
7.1 Introduction
The European automotive industry has embarked on a transition from the production of vehicles with internal combustion engines to the production of electric vehicles (i.e., battery electric vehicles (BEVs) and plug-in hybrid electric vehicles (PHEVs)), which will lead to the restructuring of the existing automotive industry in Europe. This transition has been necessitated by the adoption of strict CO2 emission limits on newly produced vehicles by the European Commission with the goal of decreasing the release of CO2 by the transport sector to limit global warming (Reference Biresselioglu, Demirbag Kaplan and YilmazBiresselioglu et al., 2018; EC, 2019; CLEPA, 2021; Reference PardiPardi, 2021). The adoption of the “Fit for 55” package by the European Union, which aims to reduce European Union’s emissions by at least 55 percent by 2030, will effectively ban internal combustion engines in all new cars and vans starting in 2035 (European Council, 2023a; 2023b). The automakers would be unable to meet these CO2 emission standards with the existing internal combustion engine technologies and many view electric vehicles as the only viable alternative (Reference SigalSigal, 2021; McKinsey&Company, 2021). However, different automakers have followed different strategies and different technological combinations to meet the emission limits.
The goal of this chapter is to analyze the impact of this transition in Eastern Europe to date in the context of the development of its automotive industry since the early 1990s and its relative position in the European automotive industry value chains and production networks. I argue that the course of the transition to the production of electric vehicles in Eastern Europe is strongly affected by the relative position of the Eastern European automotive industry in GVCs/GPNs and the international division of labor as the integrated periphery of the European automotive industry. I draw on the evolutionary economic geography perspective (e.g., Reference Martin and SunleyMartin and Sunley, 2006; Reference MacKinnon, Dawley, Pike and CumbersMacKinnon et al., 2019) to contend that this transition is strongly embedded in and constrained by the previous FDI-dependent development of the automotive industry in Eastern Europe (Reference PavlínekPavlínek, 2017a) and its current integrated periphery position in the European automotive industry production system. This chapter draws on statistical data about the automotive industry in Eastern Europe, various automotive industry databases, press reports, specialized automotive industry media and additional secondary information. It also draws on firm-level interviews previously conducted by the author and members of his research team in Czechia and Slovakia.
The chapter is organized as follows. First, I briefly summarize the state of the automotive industry in Eastern Europe. Second, I characterize the relative position of Eastern Europe in the European automotive industry as the integrated periphery and briefly summarize its basic features. Third, I explain how the integrated periphery position affects the transition to the production of electric vehicles in Eastern Europe. Fourth, I discuss the uneven nature of the transition in Eastern Europe. Fifth, I analyze the development of the battery industry in Eastern Europe. Finally, I summarize the basic arguments in the conclusion.
7.2 The Automotive Industry in Eastern Europe
A brief overview of the most important features of the automotive industry in Eastern Europe and its position in the European automotive industry division of labor is a necessary starting point of any analysis of its transition to the production of electric vehicles.
The opening of Eastern Europe to trade and investment in the early 1990s led to its integration in the European economy, including the rapid development of the export-oriented automotive industry (Reference Van Tulder and RuigrokVan Tulder and Ruigrok, 1998; Reference Havas, Humphrey, Lecler and SalernoHavas, 2000; Reference PavlínekPavlínek, 2002b; Reference Pavlínek2002d). Low production costs, market potential, geographic proximity, European Union membership or European Union preferential trading arrangements, labor surplus in the 1990s and early 2000s, large investment incentives that lowered the set-up sunk costs and thus the investment risk for foreign firms, and other location-specific factors attracted foreign automakers and component producers to set up production in Eastern Europe after 1990 (Reference PavlínekPavlínek, 2002d; Reference Pavlínek2008; Reference Pavlínek2016; Reference Pavlínek2017a; Reference Pavlínek2020; Reference AdăscălițeiAdăscăliței and Guga, 2020).
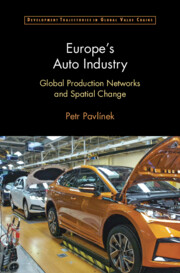
By 2019, the FDI stock in the narrowly defined automotive industry (the manufacture of motor vehicles, trailers and semitrailers – NACE 29) reached €45 billion in Eastern Europe (Eurostat, 2022a) (Figure 7.1a). FDI stock in NACE 29 is highly concentrated in Central Europe (Figure 7.1b). Poland, Czechia, Hungary and Slovakia together accounted for 80 percent of the total in 2021, reflecting their geographic, economic and political location advantages for the automotive industry compared to the rest of Eastern Europe. As a result of FDI inflows, the production of vehicles and components grew rapidly in Eastern Europe. Between 1991 and 2019, the output increased 6.6 times from 670,000 to 4.4 million vehicles (Figure 7.1c), accounting for 24.9 percent of total vehicles produced in the European Union in 2019 (OICA, 2023). The 2020 production of vehicles decreased by 805,000 (of which 762,000 were cars) to 3.6 million in Eastern Europe because of the COVID-19 pandemic, but the Eastern European share of the total European Union output increased to 26.2 percent (OICA, 2023). Czechia, Slovakia and Poland were the largest vehicle producers in 2020 (Figure 7.1d). COVID-19 ripple effects, including the shortages of semiconductors, continued to negatively affect the vehicle production in 2021 and 2022. The 2022 production was also negatively affected by the war in Ukraine.Footnote 1

Prior to the COVID-19 pandemic, the growth was concentrated in the export-oriented production of passenger cars (henceforth cars), which increased almost sevenfold from 863,000 to 4.2 million between 1991 and 2019 (Figure 7.1c). The assembly of cars takes place in Czechia, Slovakia, Romania, Hungary, Poland, Slovenia and Serbia (Figure 7.2a). Central Europe accounted for 85 percent of the total car production in Eastern Europe in 2022. Czechia and Slovakia alone accounted for 63 percent (OICA, 2023). Compared to cars, the interest of foreign capital in the production of commercial vehicles has been limited in Eastern Europe. FDI has been concentrated in Poland in the production of light commercial vehicles and heavy trucks. Poland and Czechia are the only two Eastern European countries with a surviving bus production, mainly due to FDI. Czech SOR remains the last significant domestic bus maker in Eastern Europe because Polish Solaris was sold to Spanish CAF in 2018.
Car production and value of production in the automotive industry of Eastern Europe
The value of production in the car industry (NACE 29) increased almost eightfold between 1999 and 2020 (ninefold between 1999 and 2019) and the value of manufactured parts and components (NACE 29.3) increased fourteenfold between 1999 and 2020 (nineteenfold between 1999 and 2019) (Figure 7.2b). The biggest growth was in the 2000s. In the 2010s, the rate of growth slowed, and the value of production doubled between 2000 and 2019. In 2020, the production value of parts and components was higher only by 55 percent than in 2010 because of the decrease by 26 percent in 2020 compared to 2019, which was caused by the effects of the COVID-19 pandemic. The distribution of the value of production by country corresponds with the distribution of the car production (Figure 7.2c). The largest vehicle producing countries also have the largest production of components (Figure 7.2d).
7.2.1 Limits to Growth Due to Exhausted Labor Surplus
The declining rates of growth in the 2010s, especially in Central Europe well before the COVID-19 pandemic, reflect the exhaustion of labor surplus by the rapid growth of the automotive industry. It led to labor shortages in the 2010s that pushed wages up, which undermined the rate of profit. For example, in Czechia, which has had the lowest unemployment rate in the European Union since 2016, the unemployment rate has been below 3 percent since 2017 (2.9 percent in 2017, 2.2 percent in 2018, 2.0 percent in 2019, 2.6 percent in 2020, 2.8 percent in 2021, 2.2 percent in 2022) (Eurostat, 2023e). Czechia has also consistently had the highest vacancy rate in manufacturing in the European Union since 2016 (4.7 percent in the fourth quarter of 2022) (Eurostat, 2023b). Central Bohemia, which hosts the main production complex of Škoda Auto in Mladá Boleslav, the Toyota factory in Kolín and many component suppliers, recorded a consistently lower share of unemployed persons than the national average (2.1 percent in 2017, 2.0 percent in 2018, 1.3 percent in 2019, 1.9 percent in 2020 and 2.5 percent in 2021). Similarly, the region of Hradec Králové, which hosts the second Škoda assembly complex at Kvasiny and the Škoda factory at Vrchlabí, recorded a below-national average unemployment rate (2.2 percent in 2017, 2.3 percent in 2018, 1.6 percent in 2019, 2.6 percent in 2020 and 2.9 percent in 2021). The Moravia-Silesia region, which hosts the Hyundai assembly complex, had an unemployment rate slightly higher than the national average but it was still very low and made it difficult for automotive firms to find the needed workers (4.7 percent in 2017, 3.7 percent in 2018, 3.7 percent in 2019, 3.6 percent in 2020 and 4.6 percent in 2021) (CSO, 2022). Labor surplus in the Moravia-Silesia region, which was indicated by a high unemployment rate (14.7 percent in 2003, 14.5 percent in 2004, 13.9 percent in 2005) was an important factor in Hyundai’s decision to locate its assembly factory in the Moravia-Silesia region (Reference PavlínekPavlínek, 2008; CSO, 2022). Among forty-four foreign-owned automotive firms in Czechia interviewed between 2009 and 2011, 73 percent reported difficulties in hiring qualified workers despite the economic crisis (e.g., Reference Pavlínek and ŽenkaPavlínek and Ženka, 2010; Reference PavlínekPavlínek, 2015a).
Poland (2.9 percent) and Hungary (3.6 percent) had the second- and sixth-lowest unemployment rates in the European Union in 2022 (Eurostat, 2023e). Hungary has had the second-highest vacancy rate in manufacturing in Central Europe (2.7 percent in the fourth quarter of 2022), while Poland’s vacancy rate has been much lower (0.9 percent in the fourth quarter of 2022) (Eurostat, 2023b). However, the national-level data do not reveal large regional differences in labor availability that are accentuated by the clustering of the automotive industry in regional production complexes (e.g., Reference Sturgeon, Van Biesebroeck and GereffiSturgeon et al., 2008). For instance, the national unemployment rate in Slovakia has been higher than in the rest of Central Europe (6.1 percent in 2022) and its vacancy rate in manufacturing has been among the lowest in the European Union (0.8 percent in the fourth quarter of 2022) (Eurostat, 2023b; 2023e). Still, the Slovak automotive industry has experienced severe labor shortages in regions targeted by automotive FDI, especially in western Slovakia, which, along with the Bratislava region, hosts the largest share of FDI in the Slovak automotive industry, including four assembly factories and hundreds of component suppliers (e.g., Reference JacobsJacobs, 2016; Reference PavlínekPavlínek, 2016). In 2001, the unemployment rate of West Slovakia (NUTS 2) was 17.5 percent. It decreased to 4.0 percent in 2022 (Eurostat, 2023f). The Bratislava region, which hosts a large Volkswagen assembly factory complex and many automotive suppliers, had an unemployment rate of 2.3 percent in 2022 (Eurostat, 2023f). The very low unemployment rate translated into severe labor shortages for automotive firms in western Slovakia and became a barrier for the further development of the automotive industry. Interviews with twenty-seven foreign-owned automotive industry firms conducted by the author in western Slovakia between 2011 and 2015 revealed that 96 percent of the interviewed firms had major difficulties hiring qualified workers in Slovakia. Only one supplier argued that it did not face major difficulties, but at the expense of busing workers to its factory from places located up to 100 kilometers away. In 2018, 82 percent of sixty-one surveyed automotive suppliers in Slovakia identified the lack of available qualified workers on the job market as a risk factor affecting their future growth prospects, 78 percent considered the unavailability and low quality of labor a major issue for their company, and 53 percent (up from 37 percent in 2016) argued that the lack of skilled labor restricted their ability to win or accept new contracts (PwC, 2018).
Similar widespread labor shortages in the automotive industry have been reported from other Eastern European countries, including Hungary (HIPA, 2020; Reference Szabo, Deák, Szalavetz, Túry and GalgócziSzabo et al., 2022) and Romania (Reference Amendolagine, Presbitero, Rabellotti and SanfilippoGuga, 2019; Reference AdăscălițeiAdăscăliței and Guga, 2020) and are considered the most important barrier to future investment across Eastern Europe, which also holds for Western Europe (Reference SlačíkSlačík, 2022). Labor shortages have forced automotive firms to increasingly rely on foreign workers and agency employment. More importantly, in line with theories of uneven economic development (e.g., Reference HarveyHarvey, 2005b), some automakers and component suppliers, especially those engaged in labor-intensive production, have been increasingly looking for new, potentially more profitable locations with labor surplus and low labor costs for future investments in countries such as Serbia, Moldova, Bosnia and Herzegovina, and North Macedonia (Reference PavlínekPavlínek, 2018; Reference Pavlínek2020). PSA and Renault have set up assembly plants in Morocco, with a projected capacity to reach 700,000 cars by the end of 2022 and Morocco is aiming for 1 million assembled vehicles per year by the mid-2020s (Reference BolducBolduc, 2017b; Reference HenryHenry, 2020).
7.2.2 Upgrading and Higher-Value-Added Functions
FDI in the Eastern European automotive industry has led to the development of a distinct division of labor in the European automotive industry. By investing in Eastern Europe, foreign firms have mainly pursued cost-cutting to increase their profitability and competitiveness (Reference PavlínekPavlínek, 2002d; Reference Pavlínek2020). This has translated in the focus on setting up production functions, while higher-value-added functions have remained concentrated in the home countries of foreign investors (Reference PavlínekPavlínek, 2016; Reference Pavlínek2022a; Reference Pavlínek and ŽenkaPavlínek and Ženka, 2016). In the 1990s, the focus in Eastern Europe was on the low-value-added labor-intensive assembly operations, often based on cross-border investment in the production of components and car assembly (Reference PavlínekPavlínek, 1998; Reference Pavlínek and SmithPavlínek and Smith, 1998). Over time, however, there has been the gradual upgrading of the production to more sophisticated and capital-intensive automotive production of high-quality cars and components (Reference Pavlínek, Domański and GuzikPavlínek et al., 2009; Reference Pavlínek and ŽenkaPavlínek and Ženka, 2011), in which low labor costs continue to play an important role in keeping production costs under control and thus contributing to the overall competitiveness of finished products and also of lead automotive firms (Reference Boyer and FreyssenetBoyer and Freyssenet, 2002) (Table 7.1). Foreign assembly firms and many component suppliers are now making cars and components in state-of-the-art factories based on advanced technologies in Eastern Europe (Reference LayanLayan, 2006). There is therefore no doubt about FDI-driven process and product upgrading (Reference Humphrey and SchmitzHumphrey and Schmitz, 2002) in the automotive industry of Eastern Europe since the 1990s (Reference LayanLayan, 2006; Reference Pavlínek, Domański and GuzikPavlínek et al., 2009; Reference SzalavetzSzalavetz, 2019), although not all foreign firms have been successful in Eastern Europe, as evidenced, for example, by the failure of Daewoo investments (Reference PavlínekPavlínek, 2006). Process and product upgrading has also been crucial for the competitiveness and survival of local (domestic) firms (Reference Pavlínek and ŽenkaPavlínek and Ženka, 2011). Some surviving or newly established local automotive firms have successfully internationalized (Reference Micek, Guzik, Gwosdz and DomańskiMicek et al., 2021), although many domestic firms did not survive because the most successful ones were taken over by foreign firms (Reference PavlínekPavlínek, 2002c), while unsuccessful ones ended in bankruptcy (Reference PavlínekPavlínek, 2000; Reference Pavlínek2002a; Reference Pavlínek2003) and the overall growth of domestic firms has been much slower than the growth of foreign firms (Reference PavlínekPavlínek, 2020). These processes have contributed to the overwhelming foreign control of the automotive industry in Eastern Europe (Table 7.2).
| Thousands of EUR | Germany = 100 | |
|---|---|---|
| Switzerland | 84.4 | 101.2 |
| Ireland | 84.4 | 101.2 |
| Germany | 83.4 | 100.0 |
| Sweden | 81 | 97.1 |
| Belgium | 78.6 | 94.2 |
| Netherlands | 70.5 | 84.5 |
| Austria | 69.2 | 83.0 |
| Denmark | 66.7 | 80.0 |
| France | 66.6 | 79.9 |
| Italy | 65.7 | 78.8 |
| Norway | 60.2 | 72.2 |
| Iceland | 55.3 | 66.3 |
| Britain | 54.6a | 65.5 |
| Finland | 48.7 | 58.4 |
| Spain | 45.4 | 54.4 |
| Slovakia | 25.7 | 30.8 |
| Czechia | 25.5 | 30.6 |
| Estonia | 24.8 | 29.7 |
| Portugal | 22.6 | 27.1 |
| Greece | 22.5 | 27.0 |
| Hungary | 22.5 | 27.0 |
| Poland | 19.5 | 23.4 |
| Latvia | 18.5 | 22.2 |
| Cyprus | 18.3 | 21.9 |
| Lithuania | 16.9 | 20.3 |
| Croatia | 14.6 | 17.5 |
| Romania | 14.2 | 17.0 |
| Turkey | 14.0b | 16.8 |
| Bosnia and Herzegovina | 10.7 | 12.8 |
| Bulgaria | 9.3 | 11.2 |
| North Macedonia | 5c | 6.0 |
Notes: a2018, b2014, c2012.
| Slovakia | 97.9 |
| Hungary | 96.3 |
| Romania | 94.2 |
| Czechia | 93.4 |
| Bulgaria | 92.0 |
| Poland | 89.7 |
| Spain | 85.9 |
| Portugal | 84.5 |
| Britain | 83.6Footnote b |
| Lithuania | 83.6 |
| Slovenia | 83.3 |
| Austria | 80.1 |
| Bosnia and Herzegovina | 79.9Footnote a |
| Belgium | 74.9 |
| Sweden | 63.5 |
| Netherlands | 58.1Footnote a |
| Estonia | 57.2 |
| Croatia | 54.4Footnote a |
| Ireland | 49.2 |
| Denmark | 44.6 |
| Finland | 31.3 |
| Norway | 25.1 |
| France | 24.1 |
| Italy | 23.6 |
| Germany | 14.9 |
Note: The average value of the share of foreign-controlled enterprises of five indicators in the manufacture of motor vehicles, trailers and semitrailers (NACE_R2): production value, value added at factor cost, gross investment in tangible goods, number of persons employed and turnover or gross premiums written.
a 2018, b 2017.
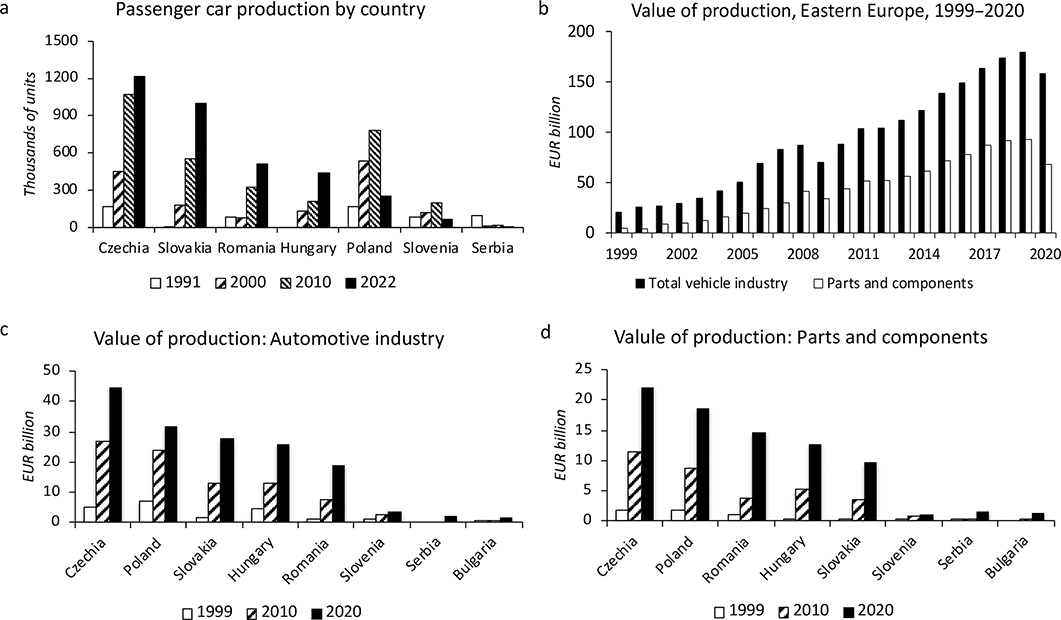
At the same time, foreign firms have invested disproportionately less in functional upgrading and the development of the higher-value-added functions in the automotive industry, including R&D in Eastern Europe (Reference PavlínekPavlínek, 2004; Reference Pavlínek2012; Reference Pavlínek2020; Reference Domański and GwosdzDomański and Gwosdz, 2009; Reference Darteyre and GalgócziDarteyre and Guga, 2022) (Figures 7.3a and 7.3b). Foreign-controlled R&D employment and R&D investment gradually increased in Eastern Europe as the low cost of the R&D labor force attracted FDI and there are numerous examples of a successful automotive R&D developed by foreign firms in Eastern Europe (Reference Pavlínek, Domański and GuzikPavlínek et al., 2009; Reference PavlínekPavlínek, 2012; Reference SzalavetzSzalavetz, 2019; Reference MarkiewiczMarkiewicz, 2020; Reference Guzik, Domański, Gwosdz, Covarrubias and Ramírez PerezGuzik et al., 2020). However, important barriers exist, which are related to the organization of corporate R&D in the automotive industry (Reference PavlínekPavlínek, 2012), as well as the shortages of the qualified R&D labor in Eastern Europe (Reference PavlínekPavlínek, 2018; Reference SzalavetzSzalavetz, 2022). Consequently, the share of R&D employment and R&D expenditures in the Eastern European automotive industry remains low compared to Western Europe (Tables 7.3 and 7.4) (Reference PavlínekPavlínek, 2022a). While Eastern Europe accounted for 32 percent of jobs in the European Union automotive industry in 2020, its share of R&D jobs was 8.7 percent and the share of R&D business expenditures was only 3.6 percent in 2019 (Figure 7.3d). The overall weakness of automotive R&D in Eastern Europe is also illustrated by the very low number of patents compared to Western Europe (Reference Delanote, Ferrazzi and Hanzl-WeißDelanote et al., 2022). Although selective functional upgrading in functions other than R&D in foreign subsidiaries has gradually developed (Reference Sass and SzalavetzSass and Szalavetz, 2013; Reference SzalavetzSzalavetz, 2022), empirical firm-level research has uncovered the weak presence of strategic and high-value-added functions in the foreign subsidiaries of automotive firms in the Eastern European automotive industry (Reference PavlínekPavlínek, 2016; Reference Pavlínek and ŽenkaPavlínek and Ženka, 2016), which is closely related to the distribution of functions in the corporate hierarchy (Reference Hymer and BhagwatiHymer, 1972; Reference PavlínekPavlínek, 2012).
| Percent | Germany = 100 | |
|---|---|---|
| Sweden | 7.42a | 106.2 |
| Germany | 6.99 | 100.0 |
| Austria | 4.88 | 69.8 |
| Britain | 4.54b | 64.9 |
| Italy | 3.37 | 48.2 |
| France | 3.04 | 43.5 |
| Finland | 2.92 | 41.8 |
| Norway | 2.45 | 35.1 |
| Netherlands | 2.10c | 30.0 |
| Belgium | 1.62 | 23.2 |
| Latvia | 1.29 | 18.4 |
| Slovenia | 1.24 | 17.7 |
| Hungary | 1.21 | 17.3 |
| Poland | 1.10 | 15.7 |
| Spain | 1.01 | 14.4 |
| Romania | 1.00 | 14.3 |
| Czechia | 0.90 | 12.8 |
| Estonia | 0.88a | 12.5 |
| Ireland | 0.83 | 11.9 |
| Lithuania | 0.73 | 10.5 |
| Denmark | 0.73 | 10.5 |
| Portugal | 0.46 | 6.6 |
| Bulgaria | 0.27 | 3.8 |
| Slovakia | 0.21 | 3.0 |
| North Macedonia | 0.03 | 0.4 |
| Greece | 0.00 | 0.0 |
| Cyprus | 0.00 | 0.0 |
| Bosnia and Herzegovina | 0.00 | 0.0 |
| Serbia | 0.00 | 0.0 |
Notes: a2019, b2018, c2012. The value for Sweden is calculated from the total for NACE 29 and NACE 30 (NACE 29 data not available).
| Percent | Germany = 100 | |
|---|---|---|
| Sweden | 18.61 | 111.5 |
| Germany | 16.68 | 100.0 |
| Austria | 11.99 | 71.8 |
| Britain | 11.58a | 69.4 |
| Italy | 10.67 | 64.0 |
| Netherlands | 10.14b | 60.8 |
| Norway | 9.24 | 55.4 |
| France | 7.31 | 43.8 |
| Finland | 5.46 | 32.7 |
| Slovenia | 5.30 | 31.8 |
| Hungary | 4.14 | 24.8 |
| Spain | 4.05 | 24.3 |
| Belgium | 4.01 | 24.1 |
| Portugal | 3.90 | 23.4 |
| Poland | 3.63 | 21.8 |
| Czechia | 3.01 | 18.0 |
| Ireland | 2.51c | 15.1 |
| Denmark | 2.25c | 13.5 |
| Romania | 1.92 | 11.5 |
| Lithuania | 1.91 | 11.5 |
| Estonia | 1.55 | 9.3 |
| Latvia | 1.46 | 8.8 |
| Slovakia | 1.26 | 7.6 |
| Greece | 0.73 | 4.4 |
| Bulgaria | 0.71 | 4.2 |
| North Macedonia | 0.07 | 0.4 |
| Serbia | 0.00 | 0.0 |
| Bosnia and Herzegovina | 0.00 | 0.0 |
Notes: a2018, b2012, c2019. For Belgium, Germany and Greece the 2020 number of R&D personnel and researchers is calculated as the average of 2019 and 2021 figures and for Poland as the average of 2018 and 2021 figures. The value for Sweden is calculated from the total for NACE 29 and NACE 30 (NACE 29 data not available).
7.3 The Integrated Periphery of the European Automotive Industry
The uncritical and simplistic accounts of the development of the automotive industry in Eastern Europe view it as an unqualified success by emphasizing short-term capital, employment and production effects of FDI (Reference Jakubiak, Kolesar, Izvorski and KurekovaJakubiak et al., 2008; Reference KurekováKureková, 2012; Reference Kureková MýtnaKureková Mýtna, 2018; Reference MarkiewiczMarkiewicz, 2020). These accounts tend to present the growth of the automotive industry as a success of the national economy by ignoring the fact that it is mainly the result of large FDI inflows and has very little to do with the nature and the level of development of the national economy. At the same time, these accounts either underplay or completely ignore the potential long-term effects of the foreign-capital-driven development in the form of newly created dependencies (capital, technological, financial, decision-making) and the outflow of value in the form of dividends and profit repatriation (Reference Dischinger, Knoll and RiedelDischinger et al., 2014b; 2014a) that will affect the ability of Eastern European countries to improve their position in the international division of labor and close the development gap with the more developed countries of Western Europe (Reference PavlínekPavlínek, 2022b).
For example, in Slovakia, the government agencies, politicians and media frequently argue that the country is a global automotive industry “superpower” because it has achieved the highest production of cars per capita in the world (e.g., Sario, 2022; ZAP, 2022). This simplistic account of the automotive industry in Slovakia based on a single indicator ignores the fact that the automotive industry is almost completely controlled by foreign capital and Slovakia has the highest index of foreign control in the European Union, at 97.9 percent in 2019 (Table 7.2). The share of foreign capital of production value, value added at factor cost and turnover exceeds 99 percent (Eurostat, 2022b; 2022c). All cars are assembled in foreign-owned factories based on foreign technology, work organization and management and R&D (see Reference PavlínekPavlínek, 2016). The foreign-controlled automotive industry is mostly isolated from the Slovak economy because it has only tenuous linkages with domestic firms, which diminishes a potential for spillovers from foreign to domestic firms (Reference PavlínekPavlínek, 2018). By far the most important production factor Slovakia contributes to the automotive industry is its relatively low-cost labor compared to Western Europe (Table 7.1). Instead of being the global automotive industry superpower and despite the highest per-capita production of cars in the world, an empirical analysis has demonstrated Slovakia’s peripheral position in the European automotive industry production system, which is almost totally controlled from the core areas of the global automotive industry. Other countries of the Eastern European integrated periphery are in a similar highly dependent peripheral position in the automotive GVCs/GPNs (Table 7.2) (Reference PavlínekPavlínek, 2022a).
It is, therefore, important to understand the course of the current and future transition to the production of electric vehicles in Eastern Europe from an evolutionary perspective and in the context of its relative position as the integrated periphery in the European automotive industry GVCs/GPNs (Reference PavlínekPavlínek, 2018; Reference Pavlínek2020; Reference Pavlínek2022a). Since the concept of the integrated periphery has been theoretically and conceptually developed in Chapters 3 and 4 of this book, its discussion here is limited to a brief summary of basic features applied to the automotive industry of Eastern Europe. At the general level, I have defined an integrated periphery in Chapter 3 as “a dynamic area of relatively low-cost (industrial) production that is geographically adjacent to a large market and has been integrated within a core-based macro-regional production network through FDI. In an integrated periphery, production, organization and strategic functions in a given industry are externally controlled through foreign ownership.” Accordingly, I have identified the basic features of the integrated periphery of the European automotive industry in Eastern Europe in Chapters 3 and 4 as follows.
1. There are substantially lower labor costs than in the core regions of the European automotive industry (Reference PavlínekPavlínek, 2022a), such as Germany, France and Italy, despite a smaller wage gap in 2020 than in the 1990s when wages in Eastern Europe were about 90 percent lower than in Western Europe (Table 7.1).Footnote 2
2. There is a sizeable labor surplus at the initial stages of growth of the automotive industry, which, however, becomes exhausted over time because of the FDI-driven growth of the automotive industry, leading to labor shortages that undermine the future growth prospects (e.g., PwC, 2019; HIPA, 2020).
3. There is geographic proximity to large and lucrative markets in core regions of Western Europe, especially Germany. It lowers transportation costs of automotive products from integrated peripheries to core areas and vice versa and is further supported by the development of modern transport infrastructure in integrated peripheries, such as divided highways and modernized high-speed railways.
4. Membership in the European Union or preferential trading arrangements with the European Union in the cases of non-European Union countries provide tariff-free access to European Union markets.
5. There is a high degree of foreign ownership and control over the automotive industry through FDI, which is the highest in the European Union. It usually exceeds 90 percent for the most important automotive industry countries of Eastern Europe (Table 7.2).
6. An export-oriented high-volume production focuses on standardized cars and generic automotive components, along with low-volume production of niche-market vehicles (Reference Havas, Humphrey, Lecler and SalernoHavas, 2000; Reference PavlínekPavlínek, 2002d; Reference LayanLayan, 2006). Typically, more than 90 percent of assembled vehicles are exported (Reference PavlínekPavlínek, 2018; WTEx, 2021; OEC, 2023).
7. There is regional specialization based on the spatial division of labor resulting from the strategy of complementary specialization (Reference Kurz, Wittke, Zysman and SchwartzKurz and Wittke, 1998), in which the integrated periphery has a greater share of low-value-added labor-intensive production tasks compared to the automotive industry in Western Europe (Reference PavlínekPavlínek, 2002d; Reference Jürgens and KrzywdzinskiJürgens and Krzywdzinski, 2009a; Reference StöllingerStöllinger, 2021; Reference SlačíkSlačík, 2022).
8. There is a weak presence of high-value-added and strategic functions, such as R&D and strategic decision-making, compared to the extent of production functions in integrated peripheries (Tables 7.3 and 7.4, Figure 7.3d) (Reference PavlínekPavlínek, 2012; Reference Pavlínek2016; Reference Pavlínek2022a; Reference Pavlínek and ŽenkaPavlínek and Ženka, 2016; Reference StöllingerStöllinger, 2021; Reference Delanote, Ferrazzi and Hanzl-WeißDelanote et al., 2022; Reference SlačíkSlačík, 2022), resulting in the truncated development of the automotive industry (Reference Pavlínek, Pavlínek, Aláez-Aller and Gil-CanaletaPavlínek, 2017b).
9. FDI-friendly state policies, large investment incentives, low corporate taxes and an active state competition over strategic automotive FDI with other countries contribute to a “race to the bottom” in the integrated periphery (Reference DrahokoupilDrahokoupil, 2008; Reference Drahokoupil2009; Reference PavlínekPavlínek, 2016).
10. Compared to the automotive industry in core countries, especially Germany, labor unions are weaker, labor codes are more liberal and labor practices are more flexible (Reference Jürgens and KrzywdzinskiJürgens and Krzywdzinski, 2009a; Reference Jürgens and Krzywdzinski2009b; Reference Drahokoupil, Myant, Delteil and KirovDrahokoupil and Myant, 2017; Reference Martišková, Kahancová and KostolnýMartišková et al., 2021).
11. The domestic automotive industry is weakly developed compared to the foreign-controlled automotive sector (Table 7.2, Chapters 3 and 4) resulting in the integration of domestic firms into macro-regional GVCs/GPNs at an inferior and subordinate position mainly as low-cost tier-three suppliers of niche products and simple parts and components (Reference Pavlínek and JanákPavlínek and Janák, 2007; Reference Pavlínek and ŽížalováPavlínek and Žížalová, 2016; Reference PavlínekPavlínek, 2018).
Overall, there is no doubt that the post-1990 development of the automotive industry in Eastern Europe has been very successful when measured by production volumes, jobs created, capital invested, the contribution to GDP and foreign trade and other quantitative indicators (Figures 7.1 and 7.2) (e.g., Reference Delanote, Ferrazzi and Hanzl-WeißDelanote et al., 2022; Reference SlačíkSlačík, 2022). At the same time, however, the foreign-controlled automotive industry in Eastern Europe has been articulated into automotive GVCs/GPNs via FDI and trade in a dependent and subordinated position through what the GPN perspective calls the structural mode of strategic coupling between regional assets and the needs of TNCs (Reference YeungCoe and Yeung, 2015; Reference CoeCoe, 2021). More specifically, it has been mostly articulated as an “assembly platform” that concentrates on production functions and has weakly developed strategic functions (Reference PavlínekPavlínek, 2016; Reference Pavlínek and ŽenkaPavlínek and Ženka, 2016; Reference StöllingerStöllinger, 2021; Reference Delanote, Ferrazzi and Hanzl-WeißDelanote et al., 2022; Reference SlačíkSlačík, 2022). It is also typified by weak linkages of foreign-owned automotive firms with host country economies that translate into weak spillovers from foreign firms to host country economies (Chapter 3 of this book, Reference Pavlínek and ŽížalováPavlínek and Žížalová, 2016). This situation contributes to a low value capture from the automotive industry compared to the automotive industry in Western Europe and has long-term structural consequences for the Eastern European integrated periphery, especially for its ability to close the development gap, wage levels and the standard of living with more developed Western Europe.
7.4 The Integrated Periphery and the Transition to the Production of Electric Vehicles in Eastern Europe
The relative position of the Eastern European integrated periphery in the European automotive industry GVCs/GPNs will influence the course of its transition to the production of electric vehicles. The starting point of my analysis is the assumption of inevitability of the transition away from the production of internal combustion engine vehicles, which is based on three points. First, the emission limits imposed on the European Union automotive industry by the European Commission (EC, 2019; CLEPA, 2021; Reference PardiPardi, 2021) cannot be met without shifting the production away from internal combustion engine vehicles. Second, feasible technological options for the automotive industry to meet these limits by the deadline specified in the European Union regulations are currently limited. Consequently, a consensus has emerged in the automotive industry about meeting the emission limits and regulations by shifting to the production of electric vehicles (BEVs, PHEVs and hybrids) (Reference JetinJetin, 2020; McKinsey&Company, 2021; Reference SigalSigal, 2021). Third, the automotive industry trends in the direction of electric vehicles in China (Reference YeungYeung, 2019; Reference SchwabeSchwabe, 2020a) and the USA (Reference Slowik and LutseySlowik and Lutsey, 2018), the largest and third-largest (after the European Union) automobile markets in the world, generate regulatory and competitive pressures on the European automakers to embrace the electric vehicle technology. This pressure applies in foreign markets (especially in China) in the form of state regulation (Reference YeungYeung, 2019; Reference SchwabeSchwabe, 2020a) and the growing competition from local (Chinese and American) carmakers in electric vehicles. It also applies in the European Union markets because of the growing competition in electric vehicles from foreign firms, especially the American Tesla, electric vehicles made by foreign firms in China that will be imported to Europe (e.g., the Mini electric vehicle made by GM at Wuling) and from Chinese automakers (Reference MantheyManthey, 2021a; Reference SigalSigal, 2022b).Footnote 3 At the same time, the transition to the production of electric vehicles is risky and extremely costly for the automotive industry (Reference Dijk, Wells and KempDijk et al., 2016; Reference Delanote, Ferrazzi and Hanzl-WeißDelanote et al., 2022) and involves many uncertainties for automotive firms and suppliers (CLEPA, 2021). The failure of European Union-based automakers to succeed would have serious repercussions not only for the European automotive industry but for the entire European economy (ACEA, 2022a).
In terms of the Eastern European automotive industry, several general observations can be made about how its position in GVCs/GPNs and the international division of labor in the automotive industry will affect its transition to the production of electric vehicles.
7.4.1 Eastern Europe is Not the Center of Innovation for Electromobility
First, Eastern Europe is not and will not be the center of innovation for electromobility. R&D for electric vehicles is mainly conducted in the home countries of assembly firms and large “global” tier-one suppliers, which are mostly located in Western Europe, the USA, Japan and South Korea. Škoda Auto in Czechia and Dacia in Romania represent a partial exception, which is related to their position as tier-two lead firms (Reference Pavlínek and JanákPavlínek and Janák, 2007; Reference Pavlínek, Bryson, Clark and VanchanPavlínek, 2015b). A tier-two lead firm has a significant autonomy to produce, manage and develop a distinct brand within a larger group. As such, it has many attributes of typical automotive lead firms, including its own international production and distribution network, which it coordinates and controls. It has the power to select suppliers and thus determine who will be included or excluded from its supplier network and under what conditions suppliers deliver components for the assembly. Most importantly, however, tier-two lead firms are foreign-owned, which means that their power and autonomy are limited. Ultimate decisions and control are in the hands of their ultimate owners, the tier-one lead firms, which are Volkswagen in the case of Škoda Auto and Renault in the case of Dacia.
Despite a few additional examples of R&D developed by assembly firms, such as 400 R&D workers working in technical development at Audi Hungária (Audi, 2021), R&D competencies of car makers are very limited or completely absent in Eastern Europe (Reference PavlínekPavlínek, 2012). It also applies to the supplier sector despite the selective development of R&D activities by foreign TNCs in Eastern Europe (Reference Pavlínek, Domański and GuzikPavlínek et al., 2009; Reference PavlínekPavlínek, 2012; Reference Guzik, Domański, Gwosdz, Covarrubias and Ramírez PerezGuzik et al., 2020), as reflected in the low share of business R&D expenditures of the total value of production and the low share of R&D personnel and researchers of total persons employed in the automotive industry (Tables 7.3 and 7.4).
This situation is a typical feature of “truncated development,” which refers to the absence or low share of high-value-added activities, such as R&D functions, strategic planning and decision-making about major investments in foreign-owned factories in host regions, and the concentration in home countries of foreign investors, usually at corporate headquarters and corporate R&D centers (see Chapter 2) (Reference BrittonBritton, 1980; Reference Britton1981; Reference HayterHayter, 1982; Reference Pavlínek, Pavlínek, Aláez-Aller and Gil-CanaletaPavlínek, 2017b). The truncated development is strongly pronounced in the Eastern European automotive industry because of the very high degree of foreign ownership and control (Table 7.2) (Reference PavlínekPavlínek, 2016; Reference Pavlínek and ŽenkaPavlínek and Ženka, 2016). It is the case despite the fact that innovation activities in the core–periphery regional systems, such as the one in the European automotive industry, gradually and selectively spread from core areas to the integrated peripheries, including some R&D functions related to electromobility (Reference FriedmannFriedmann, 1967; Reference Pavlínek, Domański and GuzikPavlínek et al., 2009; Reference PavlínekPavlínek, 2022a; Reference Pavlínek2012).
For example, Škoda Auto has been developing new R&D competencies in Czechia related to the transition to the production of electric vehicles (Škoda Auto, 2021c), although these R&D competencies are much weaker than the ones performed by Volkswagen’s corporate R&D center in Germany. Despite the gradual and selective development of innovative activities mostly driven by cheaper R&D labor in Eastern Europe than in Western Europe, the intensity and size of innovation activities will continue to be much stronger in the core areas than in the integrated periphery. The main reason is better conditions for innovation activities in core areas, as argued in Chapter 5 of this book (Reference Tödtling and TripplTödtling and Trippl, 2005; Reference Isaksen and TripplIsaksen and Trippl, 2017), which is reflected in higher automotive industry R&D employment and R&D spending in Western Europe compared to Eastern Europe (Tables 7.3 and 7.4).
7.4.2 A Slower Pace of Transition to the Production of Electric Vehicles than in Western Europe
The second general observation about the transition to the production of electric vehicles in Eastern Europe is its slower speed than in Western Europe, especially when compared to the core countries of the European automotive industry (Germany, France and Italy). For example, Renault plans 90 percent of its sales to be of battery electric vehicles by 2030 but its Romanian-based low-cost brand Dacia might reach only 10 percent battery electric vehicles according to the Renault Group’s director of R&D (Reference RandallRandall, 2021), and it plans to sell internal combustion engines “for as long as it can,” according to Dacia’s chief executive officer (ANE, 2022a). While fully dedicated factories for the large-scale production of electric vehicles have been opened in Western Europe (e.g., Volkswagen’s factories at Zwickau and Emden, Tesla’s factory near Berlin) or are being planned (e.g., Volkswagen’s Trinity factory near Wolfsburg), Eastern European factories have so far employed the strategy of mixed production, in which electric vehicles are assembled along with internal combustion engine vehicles in the same factory. This strategy will make it more difficult to achieve scale economies and, therefore, lower production costs of electric vehicles. To make this kind of mixed production viable in the short and medium run, Eastern European factories plan to compensate with lower production costs and high labor flexibility. In the long run, however, this strategy is not competitive with the production in fully dedicated electric vehicle factories and the production model in which each assembly line is fully dedicated to one platform (Reference GibbsGibbs, 2019b). Consequently, the mixed production strategy may become a major disadvantage for the competitive position of Eastern European factories in the future.
As of now, there are only three known exceptions to the mixed production strategy in Eastern Europe (Table 7.7). The first is the BMW factory, which is under construction in Debrecen, Hungary, and which should be completed in 2025. The Debrecen factory was originally also planned for the mixed production of models with internal combustion engines and electrified drivetrains (BMW, 2018). However, after first delaying the factory construction and the production launch by three years, it was decided to fully dedicate the factory to the production of electric vehicles (BMW, 2020). The second exception is the Volvo factory announced in 2022 that will be built in Slovakia between 2023 and 2026 (Reference HampelHampel, 2022c). The third exception is the BYD factory that will be built in Hungary, which might also assemble plug-in hybrid electric vehicles (Reference WesterheideWesterheide, 2024). These three cases suggest that factories fully dedicated to electric vehicles will eventually be developed in Eastern Europe to serve the European Union markets and will likely exist alongside the factories producing vehicles based on internal combustion engines for non-European Union markets.
7.4.3 Longer Production of Internal Combustion Engine Vehicles and Internal Combustion Engines than in Western Europe
Third, the production of internal combustion engine cars and internal combustion engines will continue longer in Eastern Europe than in Western Europe. The restructuring of the internal combustion engine production in Europe will entail either the closure of internal combustion engine factories or their conversion to the production of electric engines or batteries in the high-wage European automotive industry core countries, such as Germany and France. The remaining internal combustion engine production will move to countries with lower wages in the integrated periphery, such as Eastern Europe (Reference SigalSigal, 2022a). In some cases, the production of internal combustion engine vehicles and internal combustion engines is already being transferred to Eastern Europe from Western Europe, which might benefit the Eastern European locations in the short and medium run by additional investment, job creation and increased production. For example, Volkswagen is transferring the production of the Volkswagen Passat from Germany to Slovakia to make space for the production of electric vehicles in Germany (VW, 2021); Stellantis is increasing the production capacity of its engine factory by 50 percent in Szentgotthárd, Hungary to start the production of new 1.6-liter petrol engines in the first half of 2023 (Hungarian Insider, 2021); and Ford is transferring the production of 1.0-liter internal combustion engines from Cologne, Germany to its Craiova engine plant in Romania (Reference HampelHampel, 2022a).
The production of internal combustion engine cars will continue longer in Eastern Europe than in Western Europe for at least five reasons. First, there are newer, more modern assembly factories than in Western Europe. Second, older technologies continue longer in peripheral locations than in core locations of spatial systems according to the product life cycle model (Reference VernonVernon, 1966). Third, Eastern Europe has the advantage of lower production costs than in Western Europe (Table 7.1). Fourth, Eastern Europe will continue to produce internal combustion engine vehicles for non-European Union markets, such as Škoda Auto, which will produce internal combustion engine cars for the markets in less developed regions, such as India, Southeast Asia, South America and Africa (Škoda Auto, 2021b). Fifth, the transition to the production of electric vehicles in Eastern Europe will mainly be driven by foreign demand. More than 90 percent of cars produced in Eastern Europe are exported and the demand for electric vehicles has been low in Eastern Europe compared to Western Europe because of higher prices of electric vehicles compared to cars with internal combustion engines and limited subsidies for the purchase of electric vehicles (ACEA, 2021c; 2022b). It will make sense for the automakers to continue to make internal combustion engine cars close to the market in Eastern Europe where they also will be sold.
For all these reasons, we may assume that the Eastern European integrated periphery will be the last region in the European Union to completely shut down the production of internal combustion engine vehicles. The production of internal combustion engine cars will continue for at least an additional twenty years unless there will be a political decision by the European Commission banning the production and sale of internal combustion engine cars sooner. However, relying on the continuing production of internal combustion engine cars is a risky strategy for the Eastern European automotive industry, because the delay in the introduction of the large volume production of electric vehicles might undermine its long-term competitiveness. The continuing specialization in the internal combustion engine technology, which will rapidly become obsolete, instead of the cutting-edge battery electric vehicle technology, might result in a long-term disadvantage in the Eastern European automotive industry compared to countries and regions that undergo a rapid transition to the production of electric vehicles.
7.4.4 The Dependence of the Eastern European Automotive Industry’s Future on Foreign TNCs
Fourth, the high degree of foreign control over the Eastern European automotive industry (Table 7.2) means that the future of the Eastern European automotive industry, including the course of the transition to the production of electric vehicles, will be decided abroad by large foreign-owned assembly firms and component suppliers through their corporate decisions about the allocation of production and investment. Flagship foreign investors have achieved the “corporate capture” of national and local institutions and resources in Eastern Europe, which primarily serve the needs of foreign TNCs, often at the expense of domestic firms and other local needs (Reference PhelpsPhelps, 2000; Reference Phelps2008; Reference DrahokoupilDrahokoupil, 2008; Reference Drahokoupil2009; Reference PavlínekPavlínek, 2016).
The role of Eastern European governments will be mostly limited to the efforts to influence these corporate decisions via the provision of various investment incentives to attract automotive FDI, especially flagship investors (Reference PavlínekPavlínek, 2016), including FDI into battery manufacturing (e.g., €267 million in investment incentives to Volvo to build the assembly factory in Košice by Slovakia; €209 in million state aid to SK On for the construction of the battery plant in Iváncsa; €108 million awarded to Samsung SDI for the expansion of its battery cell plant in Göd by Hungary; €95 million in aid given to LG Energy Solution to expand the battery plant in Wrocław by Poland; and large investment incentives promised by Czechia for the construction of a battery gigafactory) (Tables 7.5 and 7.6).
| Company and home country | 2021 capacity (GWh) | Start date | Location | Notes |
|---|---|---|---|---|
| LG Energy Solution, South Korea | 70.0 | 2018 | Wrocław, Biskupice Podgórne, Poland | The expansion to 70 GWh in 2022, 115 GWh in 2025. Total investment: €1.5 billion; 6,000 full-time workers. Investment incentives: €95 million to expand the plant. |
| SK On (SK Innovation), South Korea | 7.5 | 2020 | Komárom Plant 1, Hungary | The expansion to 23.5 GWh by 2023, 1,300 workers. Investment: €688 million. |
| SK On, South Korea | 2022 | Komárom Plant 2, Hungary | 9.8 GWh, option up to 16 GWh. Investment: €753 million. | |
| Samsung SDI, South Korea | 2.5 | 2017 | Göd Plant 1, Hungary | 2.5 GWh in 2020, expansion to 12 GWh by 2023 and 20 GWh by 2028. |
| Samsung SDI, South Korea | 7.5 | 2021 | Göd Plant 2, Hungary | Investment: €740 million. Investment incentives: €108 million. In partnership with Mercedes-Benz. |
| Sunwoda Electronics, China | 2025 | Nyiregyhaza, Hungary | Investment: €1.5 billion. | |
| Eve Energy, China | 2026 | Debrecen, Hungary | Planned capacity: 28 GWh. Investment: €1 billion; 1,000 jobs. Investment incentives: €38 million. Supply of the BMW Debrecen factory. | |
| SK On, South Korea | 2028 | Iváncska Plant 3, Hungary | 9.8 GWh, rising to 30 GWh in 2028; 2,500 jobs. Total investment by SK innovation in Hungary: €1.6 billion. Investment incentives: €209 million. | |
| CATL, China | 2028 | Debrecen, Hungary | Planned capacity: 100 GWh. Investment: €7.34 billion; 9,000 jobs. | |
| EIT InnoEnergy, Netherlands | 2025 | Subotica, Serbia | The first LFP lithium-ion battery gigafactory in Europe. 500 MWh planned in 2024, 8 GWh by the end of 2025, expansion to 16 GWh planned later. Based on the LFP technology developed by the Serbian company ElevenEs in Subotica. | |
| Avesta Battery and Energy Engineering, Belgium | 2026 | Galați, Romania | Planned capacity: 22 GWh. Investment: €1.4 billion; 8,000 jobs. | |
| InoBat and Gotion High-Tech, Slovakia/China | 2026 | Šurany, Slovakia | A letter of intent to build a 20-GWh gigafactory was signed with the Slovak government in November 2023. Planned capacity to potentially increase to 40 GWh in the second stage. | |
| InoBat, Slovakia | 2025 | Ćuprija, Serbia | A memorandum of understanding with Serbia’s Ministry of Finance and the Municipality of Ćuprija signed in September 2023. Initial capacity: 4 GWh, which could grow up to 32 GWh. Investment incentives: €419 million. |
| Company, home country | Start year | Location | Notes |
|---|---|---|---|
| SK IE Technology (SK Innovation), South Korea | Plant 1: 2021, Plant 2: 2023, Plant 3: 2024, Plant 4: 2024 | Dąbrowa Górnicza, Poland | Plants for separators used in electric car batteries; 1,000 new jobs. Total investment: €1.5 billion. |
| EcoPro BM, South Korea | 2024–2025 | Debrecen, Hungary | Cathode material factory for electric car batteries. Investment: €715 million. |
| Enchem, South Korea | N.A. (announced in 2021) | Komárom, Hungary | Lithium salt production facility for lithium-ion batteries with annual capacity of 20,000 tons. |
| Anodox Energy, Sweden | 2022 | Riga, Latvia | The assembly of battery packs for electric vehicles should start in December 2022. A second factory should follow. Investment: €50 million; 300 jobs. Status was unclear as of 2023. |
| Enchem, South Korea | 2020 | Biskupice Podgórne, Poland | Lithium salt production facility for lithium-ion batteries with annual capacity of 20,000 tons. The construction of the second factory in Kobierzyce announced in 2022. |
| Capchem, China | 2022 | Śrem, Poland | A €50-million electrolyte production factory for 40,000 tons of electrolyte per year; sixty jobs. |
| Daimler, Germany | 2022 | Jawor, Poland | Battery assembly facility, 100,000 batteries for BEVs and PHEVs per year. |
| Northvolt, Sweden | 2022 | Gdańsk, Poland | Production of battery modules. An initial capacity of 5 GWh in 2022 and potential for 12 GWh. |
| Umicore, Belgium | 2022 | Nysa, Poland | Cathode material factory; 400 jobs. Production capacity will grow to over 200 GWh/year to produce battery cells for 3 million electric vehicles after 2025. |
| Ionway (a JV between Volkswagen and Umicore) Belgium/Germany | N.A. (announced in 2023) | Nysa, Poland | The second cathode material factory at the same location announced in 2023. Investment: €1.7 billion; 900 jobs by 2030. Investment incentives: €350 million. |
| SKC (SK Group), South Korea | 2024 | Stalowa Wola, Poland | Copper foils factory for use in electric vehicle batteries. Investment: €693 million, initial capacity of 50,000 tons per year. |
| Volkswagen (Škoda Auto), Germany | 2019 | Mladá Boleslav, Czechia | €130-million car battery assembly line for the Volkswagen Group’s MQB platform. 205,784 batteries assembled in 2022. The annual capacity of 380,000 MEB battery systems achieved at the end of 2023; 250 jobs. Expansion to 1,500 batteries per day announced in 2023. |
| Stellantis, France | 2019 | Trnava, Slovakia | The assembly of car batteries (35,922 assembled in 2020). |
| Porsche, Germany | 2024 | Horná Streda, Slovakia | €195-million car battery modules assembly factory; sixty jobs. Investment incentives: €4.2 million. |
| Dräxlmaier, Germany | 2022 | Timisoara, Romania | Battery systems for hybrid cars. Investment: €200 million; more than 1,000 jobs. |
| BYD, China | N.A. (announced in 2023) | Fót, Hungary | Battery assembly plant. Investment: €27 million; 100 jobs. Investment incentives: €3.8 million. |
| Huayou Cobalt, China | N.A. (announced in 2023) | Ács, Hungary | Nickel-rich ternary lithium battery cathode material plant. Investment: €1.4 billion (€250 million in the first phase). Annual capacity of 100,000 metric tons (initial capacity of 25,000 metric tons). |
| Andrada, Slovenia | N.A. (announced in 2023) | Alsózsolca, Hungary | Recycling factory for electric car batteries. Investment: €26 million. Annual capacity 10,000 tons of recycled batteries per year. Investment incentives: €12 million; 200 jobs. |
| BMZ Group, Germany | N.A. (announced in 2023) | Skopje, North Macedonia | More than sixty production lines planned by 2028. Production will be relocated from Germany and Poland; up to 600 jobs. |
| Rock Tech Lithium, Germany/Canada | 2029 | Romania | A production plant for battery-grade lithium hydroxide. Investment: €715 million. A memorandum of understanding signed in March 2022. Location unknown. |
Note: BEVs = battery electric vehicles, PHEVs = plug-in hybrid electric vehicles.
While Eastern European countries are willing to offer large investment incentives to flagship investors, especially assembly firms, large suppliers and battery manufacturers, they have otherwise followed a mostly wait-and-see strategy. Consequently, the support of the state for the transition to the production of electric vehicles beyond investment incentives has been limited so far. There has been uneven but mostly weak state support for the building of infrastructure (charging stations) (Transport & Environment, 2020; ACEA, 2021b; Reference GrzegorczykGrzegorczyk, 2021; Reference Darteyre and GalgócziDarteyre and Guga, 2022) and uneven state support for the purchase of electric vehicles. For example, as of 2023, Hungary, Romania and Croatia offer generous purchase incentives. Smaller incentives are provided in Estonia, Lithuania, Poland and Slovenia, and no incentives for individuals are in place in Bulgaria, Czechia, Latvia and Slovakia (ACEA, 2023b).
Poland represents an interesting exception. Its government has actively attempted to break out of FDI dependency in the transition to electric vehicles by launching the project of the national battery electric vehicle, the Izera, in 2020. The Izera will be produced by the state-owned company ElectroMobility Poland, although it will strongly depend on foreign technologies and know-how. Three Izera models (an SUV, a hatchback and a station wagon) will be designed by the Italian design company Pininfarina and built on Geely’s SEA platform. However, the components are planned to be supplied mostly by Polish suppliers. The assembly was supposed to be launched in 2024 but was postponed until the end of 2025 (Reference ĐorđevićĐorđević, 2021; Reference HampelHampel, 2022b; Reference RandallRandall, 2023a; Reference Randall2023b).
In some cases, Eastern European governments have been hostile to European Commission regulations and the transition to electric vehicles. In Czechia, for example, Prime Minister Andrej Babiš argued in 2021, “We have repeatedly said that the [European Union’s climate] goals must be set in a way not to harm our industry … It must be done reasonably, not based on ideology” (Prague Morning, 2021). Following the 2021 elections, the new prime minister of Czechia Petr Fiala declared on December 19, 2021: “the proposal of the European Commission to ban the production and sales of [new] internal combustion engine cars after 2035 is unacceptable for the government of Czechia” (Aktuálně.cz, 2021). The new minister of industry and trade of Czechia added: “I think it’s nonsense to ban the sale of internal combustion engines” (Reference ProkešProkeš, 2021). The weak role of the state in the transition to the production of electric vehicles as a mere facilitator (Reference HornerHorner, 2017) in Eastern Europe reinforces the assumption that the future of the Eastern European automotive industry will mainly depend on the corporate strategies of foreign TNCs.
7.4.5 The Continuing Strong Location Advantages for the Automotive Industry in Eastern Europe
Fifth, Eastern Europe will continue to have strong location advantages for the automotive industry in the context of the European Union. These include low wages compared to Western Europe, the geographic location close to the large and affluent Western European markets and European Union membership. Eastern Europe will continue to be an attractive location for potential new electric vehicle assembly plants and the production of battery cells and components. In the long run, the drive for profit of automotive companies will prevail. As long as the wages in Eastern Europe continue to be significantly lower than in Western Europe, especially in Germany, Eastern Europe will be attractive for the continuing production and additional investment, including the investment in the battery industry and production of electric vehicles (Tables 7.5–7.7) (Reference PavlínekPavlínek, 2020). However, as already discussed, this potential can be undermined by insufficient or exhausted labor surplus despite low labor costs, as has recently been the case in Central Europe and Romania (Reference PavlínekPavlínek, 2015a; Reference Drahokoupil, Martišková, Pícl and PogátsaGuga, 2019; PwC, 2019; Reference AdăscălițeiAdăscăliței and Guga, 2020; HIPA, 2020). The recent location decision of Japan’s Nidec corporation illustrates this point. In December 2021, Nidec started the construction of a factory to produce electric engines in Novi Sad, Serbia, which will employ 1,000 workers. Nidec will also build a smaller factory for automotive inverters and engine control units that will create 200 jobs. Serbia has been selected for the location of these factories because of its low wages (Table 7.1), labor surplus (the total unemployment rate of 9.1 percent in 2020, down from 19.4 percent in 2014) and future European Union membership (Eurostat, 2021; Reference MantheyManthey, 2021b; Nidec, 2021). These factories will not be built in Poland or Hungary despite their greater recent experience in engine manufacturing (Table 7.8) and proximity to the market because of their higher wages (Table 7.1) and labor shortages that were considered more important for the location decision by Nidec. Ultimately, when the basic preconditions for automotive FDI are present, such as political stability, the absence of trade barriers with the European Union and the transportation access to the market, it is the combination of labor costs and labor availability that drives concrete location decisions in the Eastern European automotive industry (Reference PavlínekPavlínek, 2020; HIPA, 2020; Nidec, 2021; Reference Vesić, Vukša and KroppVesić and Vukša, 2021).
Note: BEVs = battery electric vehicles, PHEVs = plug-in hybrid electric vehicles.
| Country | Product | Parent company | Location |
|---|---|---|---|
| Poland | Engines | Volkswagen AG | Polkowice, Poland |
| Engines | Daimler Group | Jawor, Poland | |
| Engines | Toyota Motor Europe | Wałbrzych, Poland | |
| Engines | Toyota Motor Europe | Jelcz-Laskowice, Poland | |
| Engines | Stellantis | Tychy, Poland | |
| Engines | Stellantis | Bielsko-Biała, Poland | |
| Transmissions | Toyota Motor Europe | Wałbrzych, Poland | |
| Czechia | Engines | Volkswagen AG (Škoda) | Mladá Boleslav, Czechia |
| Transmissions | Hyundai | Nošovice, Czechia | |
| Transmissions | Volkswagen AG (Škoda) | Mladá Boleslav, Czechia | |
| Transmissions | Volkswagen AG (Škoda) | Vrchlabí, Czechia | |
| Romania | Engines | Renault SA | Mioveni (Pitești), Romania |
| Engines | Ford Europe | Craiova, Romania | |
| Transmissions | Daimler | Sebeș, Romania | |
| Transmissions | Renault SA | Mioveni (Pitești), Romania | |
| Hungary | Engines | Volkswagen AG | Györ, Hungary |
| Engines | Stellantis | Szentgotthárd, Hungary | |
| Transmissions | ZF Friedrichshafen | Eger, Hungary | |
| Slovakia | Engines | Kia (Hyundai Motor Group) | Žilina, Slovakia |
| Transmissions | Getrag Ford | Kechnec, Slovakia | |
| Transmissions | Volkswagen AG | Bratislava, Slovakia |
The most important limitations of these five general observations about the transition to the production of electric vehicles are related to the highly increased geopolitical risks and volatility caused by the 2022 war in Ukraine and by the unfolding energy crisis in Europe. Energy costs multiplied in Eastern Europe in 2022 compared to 2021. Combined with one of the highest dependencies of large Eastern European vehicle producers, such as Czechia, Slovakia and Hungary, on Russian natural gas, it may undermine one of Eastern Europe’s competitive advantages in the automotive industry. For example, in September 2022, Volkswagen warned that it might relocate production away from Germany and Eastern Europe to its factories in Southwestern Europe or coastal areas of Northern Europe because of their proximity to seaborne liquefied natural gas terminals (ANE, 2022d). Eastern Europe may also be impacted by the increased perceived investment risk due to its geographic proximity to Ukraine, which might negatively affect future investment decisions by TNCs in the Eastern European automotive industry.
7.5 Uneven Effects of the Transition to the Production of Electric Vehicles in the Automotive Industry
The overall trend away from the production of internal combustion engine vehicles and toward electric vehicles will lead to the restructuring of the automotive industry in Europe (McKinsey&Company, 2021; Reference SigalSigal, 2021). The main questions about the transition to the production of electric vehicles in Eastern Europe are about its speed and its effects, that is, how long it will take and how it will ultimately affect the automotive industry. However, in thinking about these effects, we need to keep in mind that the trend toward the production of electric vehicles is only one of several important megatrends that will affect the automotive industry in Eastern Europe. Other trends, such as those associated with the digitalization, robotization and automation of production (Industry 4.0), continuing investment, reinvestment and the relocation of production, will also impact the automotive industry in Eastern Europe and will likely have more important employment effects than the transition to the production of electric vehicles (e.g., Reference Bauer, Riedel and HerrmannBauer et al., 2020; Reference DrahokoupilDrahokoupil, 2020; Reference SzaboSzabo, 2020).
The shift to the production of electric vehicles will likely disrupt employment patterns but it will disrupt them unevenly in different sectors of the Eastern European automotive industry. The two most important sectors of the narrowly defined automotive industry employing the most workers are the production of parts and components (NACE 29.3) and the manufacture of vehicles and engines (NACE 29.1). NACE 29.3, which employed 671,590 persons in Eastern Europe in 2020 (Eurostat, 2023c), accounting for 78 percent of all automotive industry jobs, is likely to be most affected.Footnote 4 Within NACE 29.3, suppliers of components and parts for the internal combustion engine powertrain (e.g., components and parts for engines, gear boxes, fuel and exhaust systems) will be most affected as their products will become redundant in battery electric vehicles. For example, a combustion engine has 1,018 forged components, while a comparable fully electric engine has only 143 (Reference SchwabeSchwabe, 2020b). The drivetrain of a battery electric vehicle is less complex than in conventional vehicles and requires, for example, only half of its bearings (Reference Davies, Cipcigan, Donovan, Newman, Nieuwenhuis, Nieuwenhuis and WellsDavies et al., 2015). Therefore, even if the production of internal combustion engines is replaced with the production of electric engines, it might result in significant job loss, because the production of electric engines is less labor-intensive than the manufacture of internal combustion engines (Reference Bauer, Riedel and HerrmannBauer et al., 2020; CLEPA, 2021). On the other hand, large segments of the supplier industry that are unrelated to internal combustion engines will experience no or small effects (e.g., seats, wheels, structure parts, air conditioning systems), and the new segments of the automotive industry related to the battery system will create new jobs (e.g., batteries, battery management systems, sensors). The entire battery industry, including the extraction of raw materials, manufacturing of battery cells, battery assembly and recycling, could create up to 4 million jobs in the European Union (Reference HarrisonHarrison, 2021).
The shift to electric vehicles might also disrupt employment patterns in NACE 29.1, which employed 160,000 people in Eastern Europe in 2020 (Eurostat, 2023c), because the assembly of battery electric vehicles is less labor-intensive than the manufacturing of traditional cars. There are fewer mechanical parts and, despite many new electric and electronic components and the battery, fewer workers will be needed in the final assembly. For example, to maintain the employment levels from before the transition to electric vehicles, Volkswagen’s Zwickau BEVs factory integrated some processes that used to be outsourced to external suppliers, such as stamping work for the hood, fenders and doors. This ultimately translates into fewer jobs in the supplier sector (Reference GibbsGibbs, 2019a). NACE 29.1 will also be affected due to the fact that the production of electric engines is less labor-intensive than the manufacture of internal combustion engines (Reference Bauer, Riedel and HerrmannBauer et al., 2020; CLEPA, 2021).
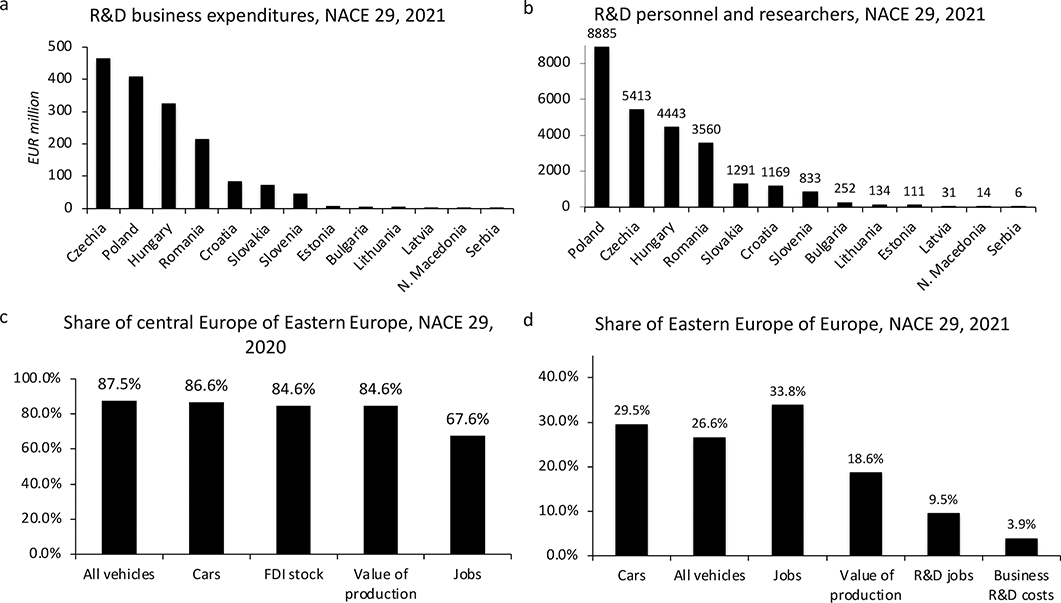
These effects will be geographically uneven across Eastern Europe since different Eastern European countries are specialized to a different degree in the production of distinct automotive products and components. For example, Poland and Hungary are more dependent on exports of internal combustion engines, engine parts and transmissions than other Eastern European countries (Figure 7.4a). The production of engines and gearboxes in Czechia and Slovakia is mainly for the large local assembly of cars and not for exports. Poland, the largest producer of engines, has six engine factories (Table 7.8) and exported engines worth €1.9 billion in 2021 (OEC, 2023). Poland, Hungary and Czechia are also the largest exporters of engine parts from Eastern Europe (Figure 7.4a), making them potentially vulnerable to the decrease in the production of internal combustion engines.
But even in the cases of internal combustion engines, the production will not necessarily end in 2035, because some Eastern European factories, such as Škoda Auto in Czechia and its suppliers, plan to continue to produce internal combustion engines for foreign markets that will undergo much slower transition to electromobility, such as India, Russia, South America and North Africa. The speed of the transformation will also differ for different segments of the supplier industry. In most cases, the change will not be abrupt, but it will be gradual and the existing engine factories might gradually transition to the production of electric engines. For example, Audi Hungária at Győr, Hungary, the largest engine factory in Eastern Europe and in the world, started to produce electric engines in 2018. Out of the total number of 1,677,545 engines produced in 2022, 108,097 (6.4 percent) were electric powertrains and their share will continue to increase in the future (Audi Hungaria, 2023) so that the factory may assemble only 271,000 internal combustion engines in 2029 (Reference SigalSigal, 2022a).
Projections of changes in powertrain employment under the most likely scenario of the transition to electric vehicles prepared for selected European countries for the 2020–2040 period by CLEPA (2021) suggest for Eastern European countries the maximum employment in internal combustion engine powertrain technologies around 2030, followed by a steady decline to 2040 (Figure 7.4b), and a steady increase in the employment in electric vehicle powertrain technologies (Figure 7.4c), which, however, will not compensate for job losses in the internal combustion engine powertrain technologies. Overall, almost 50 percent of powertrain jobs are projected to be lost in Czechia, Poland and Romania between 2030 and 2040. Compared to 2020, the number of powertrain jobs is projected to be lower by one fourth in these three countries in 2040 (Figure 7.4d) (CLEPA, 2021).
Local automotive suppliers are mostly captive tier-three suppliers or niche suppliers in automotive GVCs/GPNs (Reference Pavlínek and ŽížalováPavlínek and Žížalová, 2016; Reference PavlínekPavlínek, 2018). As such, domestic firms will be in a weak position to effect any changes related to the transition to electric vehicles in Eastern Europe. Empirical research has suggested the weakening position of domestic firms in the Eastern European automotive industry because of their inability to benefit from and keep up with its rapid FDI-driven growth in the 2000s and 2010s (Reference PavlínekPavlínek, 2020).
7.6 The Battery Industry in Eastern Europe
Attracting FDI to battery and cell manufacturing is a feasible strategy to attract the assembly of electric vehicles, thus ensuring the future of the automotive industry in Eastern Europe and offsetting job losses caused by the decreases in the production of internal combustion engines, even though jobs in the electric vehicle battery assembly are not high-value-added jobs (Reference SzalavetzSzalavetz, 2022) and the production of battery cells is highly automated (Reference Schade, Haug, Berthold and GalgócziSchade et al., 2022). Since batteries are heavy and can account for up to one third of the total electric vehicle weight (Reference Delanote, Ferrazzi and Hanzl-WeißDelanote et al., 2022), the geographic proximity of the battery assembly operations lowers transportation costs involved in transporting finished batteries to a vehicle assembly factory. There are also strong strategic reasons behind the development of the battery industry in Europe because batteries account for 30–50 percent of the value of battery electric vehicles (CLEPA, 2022). It has been estimated that twenty-four new battery gigafactories with annual capacity of 25 GWh will have to be built in Europe by 2030 to meet the European battery demand (McKinsey&Company, 2021). In December 2020, the European Union specified its local content requirements for the European lithium battery production, which include the location of key parts of its value chain in Europe between 2024 and 2027 (e.g., cathodes, anodes and chemicals), with the goal of achieving 100 percent European sourcing by 2027. The European Commission approved large subsidies for the development of the European battery industry (€3.2 billion in 2019 and €2.9 billion in 2020) (Reference HarrisonHarrison, 2021). These developments will support the growth of the battery industry in Eastern Europe, including an increase in high-value-added jobs in battery design and testing that has already been documented in a few celebrated cases of local startups, such as InoBat in Slovakia and ElevenEs in Serbia, and also in some foreign subsidiaries (Reference SzalavetzSzalavetz, 2022) (Table 7.6). However, because the production of battery cells is very energy intensive, the future growth of the battery industry in Eastern Europe is likely to be negatively affected by drastically increased energy prices and the high degree of dependence on Russian natural gas, unless alternative sources of cheap energy are found.
Deposits of lithium, a crucial raw material to produce car batteries, have potentially been one of the locational advantages of Eastern Europe for the development of the battery industry. Two large deposits have been discovered in Eastern Europe: one in western Czechia in the Ore Mountains close to the German border, which is the largest lithium deposit in Europe (up to 3 percent of global lithium deposits), the other one in the Loznica region of western Serbia along the Drina River close to the Bosnia and Herzegovina border. Foreign mining TNCs, such as Australian European Metals Holdings in the case of Czechia and British-Australian Rio Tinto, in the case of Serbia, were interested in mining the lithium deposits. In both cases, however, mining projects became highly politicized. In the case of Czechia, after the political outcry about foreign capital control of the lithium deposit, the government-linked energy company ČEZ purchased a majority stake in Geomet, European Metals Holdings’ subsidiary, for €32 million because it held exploration licenses for lithium deposits (Deloitte, 2021). ČEZ and European Metals Holdings are considering mining lithium but no decision about the mining has been made as of 2023, which, according to the Czech government, might start in 2026 (HN, 2019; 2021; 2023). In the case of Serbia, the government stopped the USD2.4 billion mining project in January 2022 following the strong resistance of local communities and environmentalists (Reference RandallRandall, 2022b).
Compared to Western Europe, the development of the battery industry in Eastern Europe has so far been limited (AMS, 2021b; Reference WilliamsWilliams, 2021; Reference DunnDunn, 2022). As of August 2022, only 13.3 percent of completed or planned installed capacity of lithium battery gigafactory projects were in Eastern Europe (Reference HeinesHeines, 2022). Within Eastern Europe, the growth has so far been restricted to Hungary (5.5 percent of the European total) and Poland (4.9 percent) as of 2022 (Table 7.5). The recently announced large investments by Chinese CATL, Sunwoda Electronics and Eve Energy in three additional gigafactories in Hungary will strongly increase its European share. By 2030, Hungary’s annual battery output has been projected to reach 250GWh, followed by Poland (120 GWh), Serbia (48GWh), Czechia (25GWh), Romania (22GWh), and Slovakia (10GWh) (Reference Rzentarzewska and CeryRzentarzewska and Cery, 2023).
In coming years, we might also expect investments in the Eastern European battery industry from European companies, whose rapidly growing investments have so far been limited to Western Europe (Reference Beutnagel and VerpraetBeutnagel and Verpraet, 2021; Reference HeinesHeines, 2022). It is likely that in addition to Hungary and Poland other Eastern European countries will be targeted by FDI in the battery production. Hungary and Poland have been more aggressive than other Eastern European countries in attracting the battery industry (Tables 7.5 and 7.6) perhaps because of their greater dependence on the production of internal combustion engines (Figure 7.4a) and, therefore, greater vulnerability to potential job losses related to the decrease in the production of internal combustion engines compared to the rest of Eastern Europe.
Czechia, which has the largest production of cars in Eastern Europe (Figure 7.2a), has so far failed to attract any battery gigafactories. The Czech government has been actively attracting one of six planned Volkswagen gigafactories, which is supported by Škoda Auto, by offering investment incentives, including tax breaks, building of transportation infrastructure and retraining the thousands of workers (Reference LiebreichLiebreich, 2021; Reference CharvátCharvát, 2022). Czechia’s Eastern European locational advantages, such as low labor costs, the largest European lithium deposits and the proximity of other Volkswagen factories, are being undermined by the limited state support for the transition to electromobility, the weak promotion of future technologies and the rapidly rising energy costs since 2022 (Reference HampelHampel, 2021; Škoda Auto, 2021a). Volkswagen has therefore also considered Poland and Hungary for its Eastern European gigafactory, which might be a way to extract the biggest possible investment incentives from one of these three governments, a typical strategy in location decisions by automotive TNCs in the European integrated periphery (Reference PavlínekPavlínek, 2016). In November 2023, Volkswagen announced the indefinite postponement of its planned Eastern European gigafactory due to a lower-than-expected demand for its electric vehicles in Europe (Reference HovetHovet, 2023).
In Slovakia, InoBat Auto, the Slovak startup, which is partially owned by Chinese Gotion High Tech (25 percent), and the California-based Wildcat Discovery Technologies, the owner of patented technology for car batteries, are building a €100 million 45-MWh pilot battery line close to the town of Trnava. Along with an R&D center for 150 R&D workers, it should be completed in 2024 and produce up to 50,000 high-performance battery cells for aircraft and racing cars (Reference MantheyManthey, 2019; Reference BolducBolduc, 2021; Reference EhlEhl, 2023). A separate JV of InoBat and Gotion plans to build a 20-GWh gigafactory to produce up to 150,000 smart batteries per year in the town of Šurany (Reference RandallRandall, 2022a; Reference EhlEhl, 2023) (Table 7.5). Eastern Europe has also attracted a growing FDI into module and pack battery manufacturing, which bundles individual battery cells into modules and packs, as well as into material suppliers for battery production and battery recycling. A high share of these investments went to Poland (Table 7.7), whose government allocated €3.1 billion for investment incentives to the battery industry in 2019 (Reference StrzałkowskiStrzałkowski, 2021).
7.7 Conclusion
This chapter considers the implications of the integrated periphery position of the Eastern European automotive industry in the European GVCs/GPNs and international division of labor for the course of the transition to the production of electric vehicles. It argues that the dependent position of Eastern Europe will strongly influence the course of this transition. Although there are many questions and uncertainties about this transition that have been greatly enhanced by the geopolitical and economic instability due to the war in Ukraine since 2022, several general conclusions about its nature in Eastern Europe can be made. First, the extremely high dependence of the East European automotive industry on foreign ownership and control means that the course of the transition will be driven by the corporate decisions of foreign automotive TNCs. Local firms will be unable to influence the course of the transition and play a significant role. Second, while the role of the CO2 regulation imposed on the automotive industry at the European Union level has been instrumental in triggering the transition to the production of electric vehicles, the role of states and their policies in Eastern Europe will be severely limited. It will mainly focus on attracting additional FDI from flagship foreign investors through offering various investment incentives, engaging in the “race to the bottom” by competing with other states in the integrated periphery for these investments, and pursuing additional policies designed to meet the needs of flagship investors in the production of electric vehicles. Third, the transition to the production of electric vehicles will be slower in Eastern Europe than in Western Europe because of the continuing production of internal combustion engine vehicles, the slower introduction of fully dedicated electric vehicle factories and the greater reliance on the mixed production of electric vehicles and internal combustion engine vehicles than in Western Europe. While this slower transition will likely increase the employment in the Eastern European automotive industry in the short and medium run in the 2020s, it might weaken the position of Eastern Europe in the international division of labor of the European automotive industry in the long run by relying on the increasingly obsolete and less profitable internal combustion engine technologies and falling behind Western Europe, and because Western Europe will move to the full-scale production of electric vehicles in electric vehicle dedicated factories faster. Fourth, the impact of the transition to electric vehicles will be uneven within the automotive industry. In terms of jobs, there will be a greater potential for job losses in the production of parts and components than in the vehicle assembly. The creation of new jobs in the battery industry will depend on the abilities of Eastern European governments to attract foreign battery manufacturers. So far, however, the majority of battery gigafactories are built or planned to be built in Western Europe, not in Eastern Europe. Only Hungary and to a lesser extent Poland have so far attracted any significant investment in the battery industry. Fifth, the transition will be geographically uneven in Eastern Europe. The course of the transition and its outcome in individual Eastern European countries will depend on their ability to attract FDI in the production electric vehicles, the battery industry and battery components production, which will help offset potential losses related to phasing out the production of components for internal combustion engines.
The chapter has identified several risks for the future competitiveness of the automotive industry in the Eastern European integrated periphery based on the currently pursued strategies of the transition to electric vehicles. Most importantly, the reliance on the mixed production of internal combustion engine vehicles with electric vehicles and on the production of internal combustion engine cars for a longer period than in Western Europe, and the potential failure of some Eastern European countries to attract the battery industry, especially battery gigafactories, might undermine their long-term competitive position in the European automotive industry. To counteract these risks, the integrated periphery will continue to rely on its enduring competitive advantage of low production costs, especially low labor costs, to continue to attract FDI in the automotive industry, which is risky because of the exhausted labor surplus in many countries. Since the transition to the production of electric vehicles will mostly depend on foreign capital, it will continue to be dependent growth (Reference PavlínekPavlínek, 2017a), which is unlikely to improve the highly dependent position of Eastern European countries in automotive GVCs/GPNs and the international division of labor in the European automotive industry.
The validity of these conclusions is generally supported by recent research (e.g., CLEPA, 2021; Reference Delanote, Ferrazzi and Hanzl-WeißDelanote et al., 2022; Reference SlačíkSlačík, 2022; Reference SzalavetzSzalavetz, 2022). However, it can be strongly undermined by the effects of the increased geopolitical instability and energy crisis in Europe. Eastern Europe is more vulnerable than Western Europe due to its geographic location close to Ukraine and Russia, the high dependence on Russian energy resources and the landlocked location of many Eastern European countries, which makes access to alternative sources of oil and liquified gas more difficult and expensive. This might negatively affect the future investment decisions of foreign TNCs in the Eastern European automotive industry and has already been manifested by the indefinite postponement of the construction of Volkswagen’s battery gigafactory in Eastern Europe. Therefore, given the analysis presented in this chapter and significant risks identified above, the best outcome of the transition to the production of electric vehicles the Eastern European automotive industry can hope for is to maintain its integrated peripheral position in the European automotive industry division of labor and GVCs/GPNs that has developed since the early 1990s.


 Open access