

1. INTRODUCTION
The vast majority (74%) of Antarctica's outer margins are confined by freely-floating ice shelves and ice tongues (Bindschadler and others, Reference Bindschadler2011). These areas are separated from the ice sheets by grounding zones where the ice detaches from the bedrock or sediment at its base. Mass flux from the ice sheets, can be measured across this transition and depends on a complex interaction of stresses (Schoof, Reference Schoof2007).
Thinning ice shelves (Pritchard and others, Reference Pritchard, Arthern, Vaughan and Edwards2009, Reference Pritchard2012) reduce the amount of buttressing (Dupont and Alley, Reference Dupont and Alley2005) and may lead to an enhanced ice discharge to the ocean on a retro-grade bed (Gudmundsson, Reference Gudmundsson2013). Recent decrease in ice-shelf volume (Paolo and others, Reference Paolo, Fricker and Padman2015) is attributed to both atmospheric variability (Scambos and others, Reference Scambos, Hulbe and Fahnestock2013) and modified oceanic conditions (Dutrieux and others, Reference Dutrieux2014). The mass input from tributary ice streams to ice shelves, combined with knowledge of accumulation on the ice sheets, provides a basis for modelling the mass balance behaviour of Antarctica (Rignot and Thomas, Reference Rignot and Thomas2002).
Grounding zones extend between the landward limit of ice flexure from tidal movement (Rignot, Reference Rignot1996; Rignot and others, Reference Rignot, Mouginot and Scheuchl2011) and the hydrostatic line at which ice begins to oscillate with the full tidal amplitude (Fricker and others, Reference Fricker2009). The influence of oscillatory ocean tides on the speed of the ice discharge has received considerable attention (Anandakrishnan and others, Reference Anandakrishnan, Voigt, Alley and King2003; Bindschadler and others, Reference Bindschadler, King, Alley, Anandakrishnan and Padman2003; Gudmundsson, Reference Gudmundsson2006; Murray and others, Reference Murray, Smith, King and Weedon2007; Wiens and others, Reference Wiens, Anandakrishnan, Winberry and King2008; Marsh and others, Reference Marsh, Rack, Floricioiu, Golledge and Lawson2013; Rosier and others, Reference Rosier, Gudmundsson and Green2014, Reference Rosier, Gudmundsson and Green2015).
This tidal deformation is produced by the imbalance between cryostatic pressure on grounded ice and the hydrostatic pressure at the adjacent ice shelf and has been modelled as an elastic beam, resting on a horizontal elastic foundation (Holdsworth, Reference Holdsworth1969; Vaughan, Reference Vaughan1995). Their analytical 1-D approach has been expanded by Schmeltz and others (Reference Schmeltz, Rignot and MacAyeal2002) to cover the vertical displacement of a 2-D elastic plate due to oceanic tides.
Elastic models of tidal deformation cannot match observations in different locations with a single value of the Young's modulus E without a reduction of the effective ice-shelf thickness (Holdsworth, Reference Holdsworth1969, Reference Holdsworth1977; Lingle and others, Reference Lingle, Hughes and Kollmeyer1981; Stephenson, Reference Stephenson1984; Vaughan, Reference Vaughan1994). Vaughan (Reference Vaughan1995) concluded from a variety of locations the effective Young's modulus E = 0.88 ± 0.35 GPa adequately describes tidal bending. However, the analysis of SAR interferometry profiles for Petermann Glacier, Greenland reveals E = 3.0 ± 0.2 GPa (Rignot, Reference Rignot1996). This led to the physically unrealistic conclusion that the Young's modulus of ice oscillates over short time periods – thus violating linear elastic theory (Schmeltz and others, Reference Schmeltz, Rignot and MacAyeal2002). The variation has been ascribed to viscoelastic effects resulting in a time delay between oceanic forcing and ice-shelf response (Reeh and others, Reference Reeh, Mayer, Olesen, Christensen and Thomsen2000). Reeh and others (Reference Reeh, Christensen, Mayer and Olesen2003) suggested that tidal flexure might be better described by a Burgers rheological model supported by tiltmeter data from Nioghalvfjerdsfjorden, northeast Greenland, while Gudmundsson (Reference Gudmundsson2011) suggests that a Maxwell model may be equally suitable over tidal timescales.
In addition, there is a disagreement of an order of magnitude between field observations (E ≈ 1.0 GPa) and laboratory measurements using sound-wave propagation in isotropic polycrystalline ice (E = 9.0 GPa) (Petrenko and Whitworth, Reference Petrenko and Whitworth1999). The difference implies an instantaneous elastic response followed by a time-dependent viscoelastic deformation. Gudmundsson (Reference Gudmundsson2011) shows that this response to tidal loading can be expressed by a Maxwell rheological model over tidal timescales, being essentially identical to the more complicated Burgers material of Reeh and others (Reference Reeh, Christensen, Mayer and Olesen2003), with E = 4.8 GPa and a Poisson's ratio for ice of λ = 0.4.
Walker and others (Reference Walker2013) considered this rheological model and improved on simple Euler–Bernoulli elastic beam theory, providing a flexure profile dependent on tidal stress history. Thus viscous damping modifies the timing of ice flexure, while elastic deformation still dominates on shorter timescales. Gudmundsson (Reference Gudmundsson2007) concluded a purely elastic response on the Rutford Ice stream for tidal frequencies between 1 h and 50 d. However, the viscous proportion of the displacement is increasing nonlinearly with ice temperature and shear stress. It is apparent that both vary spatially across Antarctica and so it is necessary to define the conditions when the elastic theory is suitable to model tidal flexure.
We compare the well-known elastic solution to a published viscoelastic model using high-resolution flexure data, and explain the shortcomings in the elastic model due to the absence of viscous damping effects. This is achieved as follows: First we describe the two models and the chosen boundary conditions. Second we present the field data used for model validation. Third we conduct a thorough sensitivity analysis reviewing the effect of a modified flexural rigidity and viscosity on the shape and timing of the ice-shelf response in comparison with field data.
2. TIDAL FLEXURE MODELS
We now model the ice-shelf system both elastically and viscoelastically as a 1-D semi-infinite slab of varying ice thickness. Both models are derived from classic Euler–Bernoulli beam theory assuming a large length to depth ratio. We implement a 25 km long profile, with 5 km up- and 20 km downstream of the grounding line to eliminate possible edge effects. The grounding line is assumed to be anchored at x = 0 m, which represents its mean sea level position. The floating part is supported by the hydrostatic pressure underneath the ice shelf whereas the grounded part is resting on an elastically deforming foundation represented by a series of springs.
2.1. Elastic model
Following Holdsworth (Reference Holdsworth1969), the vertical deflection of an elastic beam with a variable flexural rigidity is described by Walker and others (Reference Walker2013):
 $$kw + \displaystyle{{\partial ^2} \over {\partial x^2}} \left( {D\displaystyle{{\partial ^2} \over {\partial x^2}} w} \right) = q,$$
where x is the horizontal plane in the Cartesian coordinate system and w(x, t) the model solution for vertical displacement from the mean. The tidal forcing q(t) is given by
 $$q = \rho _{{\rm sw}} g(A(t) - w),$$
with ρ sw = 1030 kg m−3 the density of sea water, g = 9.81 m s−2 the acceleration due to gravity and A(t) the time-dependent tidal amplitude. We use the flexural rigidity D(x) of a thin plate rather than that of an elastic beam given by (Love, Reference Love1906, p. 443):
 $$D = \displaystyle{{Eh^3} \over {12(1 - \lambda ^2 )}} \ne {\rm const}.$$
Here, E is the Young's modulus, h(x) is the ice thickness and λ = 0.4 the Poisson's ratio. While this is a 1-D model, Poisson's ratio is included to account for transverse deformation due to longitudinal strain. At this point, we introduce the two simplifying assumptions: (1) Spatial variation in flexural rigidity is only a function of ice thickness, (2) Poisson's ratio can be fixed when exploring the range in values of the other parameters. Therefore, the glaciological parameters E and λ are constant along the profile. The effect of changing Poisson's ratio within the well-known plausible range of λ is balanced by small changes in the Young's modulus. Hereafter, parameter uncertainty is discussed for E only within the range of reported bounds. We build on earlier work and use the value k = 5 MPa m−1 of the spring constant derived by Walker and others (Reference Walker2013) to match observations of Heinert and Riedel (Reference Heinert and Riedel2007) at Ekstroem Ice shelf, Antarctica.
2.2. Viscoelastic model
Our viscoelastic model employs a Maxwell rheology, analogous to a Newtonian damper and a Hookean spring in series, and is based on the model of Walker and others (Reference Walker2013):
 $$\eqalign{& \displaystyle{\partial \over {\partial t}}\left( {kw + \displaystyle{{\partial ^2} \over {\partial x^2}} \left( {D\displaystyle{{\partial ^2} \over {\partial x^2}} w} \right)} \right) + \displaystyle{{Ek} \over {2\nu (1 - \lambda ^2 )}}w \cr & \qquad = \displaystyle{\partial \over {\partial t}}q + \displaystyle{E \over {2\nu (1 - \lambda ^2 )}}q,} $$
where ν is ice viscosity. In this study we ignore ice inflow and gravitational driving stress, which lead to unbounded deformation at the ice shelf. This model of viscoelastic tidal flexure incorporates the time derivative of the tidal forcing (∂q/∂t). Its magnitude represents viscous damping effects that cause a time delay of the ice-shelf response to the tidal forcing. As with the other glaciological parameters, the viscosity does not vary spatially across the model domain. The viscous time delay shortens for increasing viscosity and becomes zero in the theoretical limit (ν → ∞) corresponding to an instantaneous elastic response. We test viscosities between 1013.6 and 1016.0 Pa s, where the floating point exponent indicates a logarithmic distribution of the values due to the high model sensitivity within relatively low viscosities. We observe that the viscoelastic model for ν = 1016.0 Pa s almost perfectly reproduces the elastic solution.
Both elastic and viscoelastic formulations have been split up into two non-linear systems of partial differential equations. These systems are discretized implicitly in time and numerically integrated using the commercial finite-element software COMSOL Multiphysics. The grid resolution is 50 m, creating a mesh composed of 501 nodes. Elastic model simulations were performed with Young's moduli in the range of 0.1 ≤ E ≤ 9.0 GPa using 0.1 GPa steps. A coarser parameter variation in Young's moduli was used for the viscoelastic model using 13 values distributed between 0.5 and 9.0 GPa.
The upstream end of the domain (x = −5 km) is rigidly anchored to a tributary ice stream (w = 0, ∂2w/∂x 2 = 0), while the downstream end (x = 20 km) rises and falls freely with the tidal cycle (w = A(t), ∂w/∂x = 0). The grounding line (x = 0 km) is represented by a fixed fulcrum (w = 0) to investigate an inland transmitted signal of the tidal load due to leverage of the ice shelf.
3. FIELD VALIDATION ON THE SOUTHERN MCMURDO ICE SHELF
Tidal flexure was measured across the grounding zone of the Southern McMurdo Ice Shelf during the 2014/15 Antarctic season (Fig. 1). At this field site in the western Ross Sea region the ice is largely stagnant. We select a profile across a straight part of the grounding zone to avoid any influence of curved grounding lines on the tidal flexure pattern (Marsh and others, Reference Marsh, Rack, Golledge, Lawson and Floricioiu2014).
Landsat 8 imagery from 1 December 2015 of the Southern McMurdo Ice Shelf, overlaid with a differential interferogram from three TerraSAR-X scenes, acquired on 30 October 2014, 10 November 2014 and on 21 November 2014. The flexure zone is determined by the dense band of DInSAR fringes. Each full colour cycle corresponds to ~3.1 cm of vertical displacement. (red) Locations of field measurements, (black) the interferometric grounding line and (arrows) the main ice-flow directions. Closeup shows positions of tiltmeter and GPS sensors across the grounding zone.
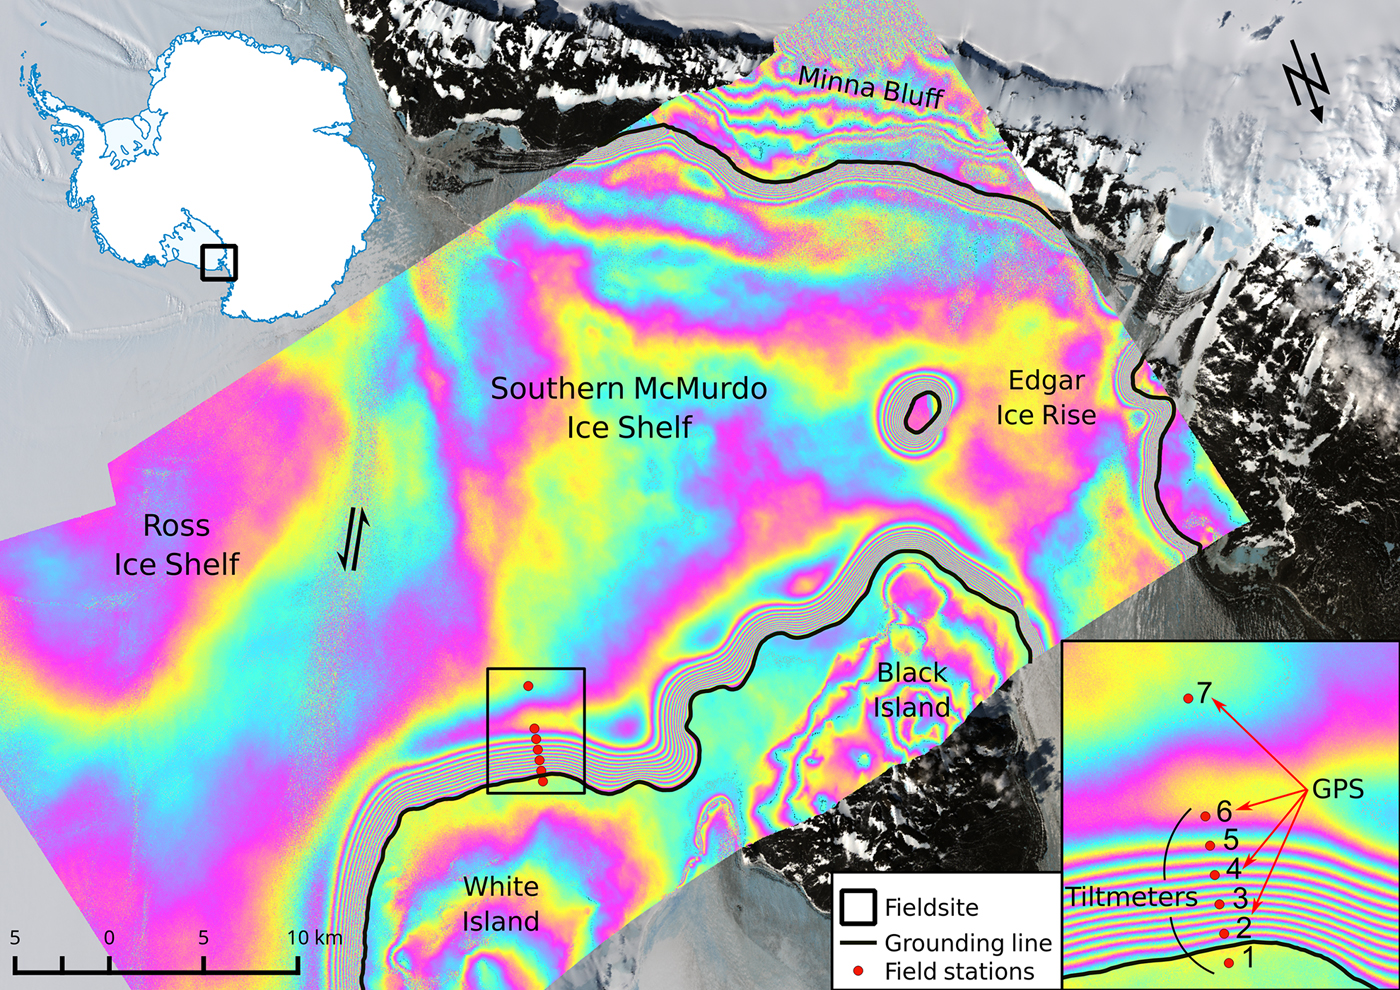
The first six field stations are separated by 500 m and are equipped with high-precision tiltmeters.We installed RION ACA826T dual axis sensors with full temperature compensation. These flexure measurements were continuously complemented by differentially corrected GPS data at stations two, four, six and seven to record the tidal signal at different locations in the grounding zone. Additional data acquired for the flexure analysis are snow and ice stratigraphy, basal ice properties derived from radar as well as information on snow morphology from snow pits and firn cores. Ice thickness in this region was measured using a 25 MHz pulseEKKO PRO Ground Penetrating Radar (GPR). The initial 3 m GPR trace spacing has been interpolated using a cubic spline function on a 50 m equidistant grid. The resulting first and last values of the profile (200 and 203 m, respectively) are extrapolated up- and downstream of the flexure region (Fig. 2).
Ice thickness transect along the field stations through the grounding zone recorded by GPR. The grounding line location and bedrock topography underneath the grounded ice are indicated. Black arrows show possible locations of basal crevasses in the radargram. The 8 km transect is part of the model domain used in this study.
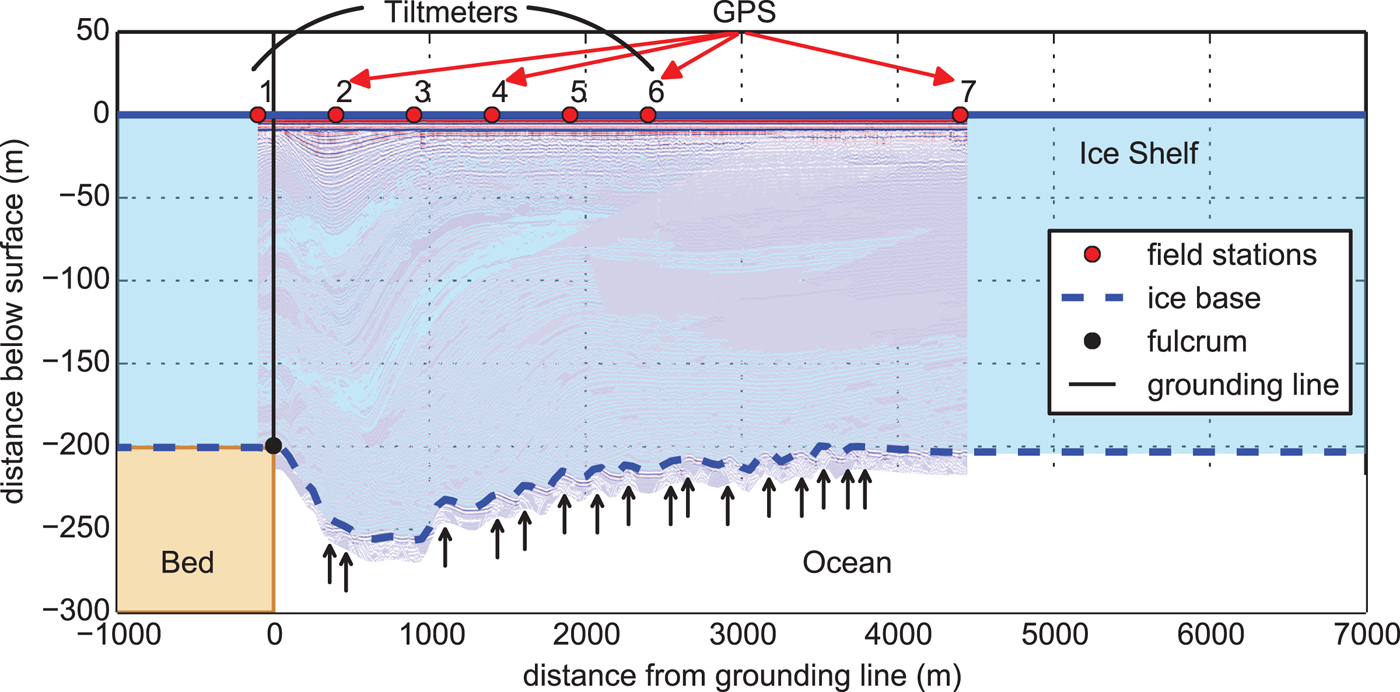
The grounding line (x = 0 km) is placed at a fulcrum identified here from nine differential TerraSAR-X interferograms. We observe an almost stagnant position as well as a steep bedrock slope. This fixed grounding line is supported by the analysis of Anandakrishnan and others (Reference Anandakrishnan, Catania, Alley and Horgan2007) showing that tide-dependent grounding-line movement is small compared with the flexural length scale of ice shelves in areas of steep bedrock topography.
3.1. Tiltmeter measurements
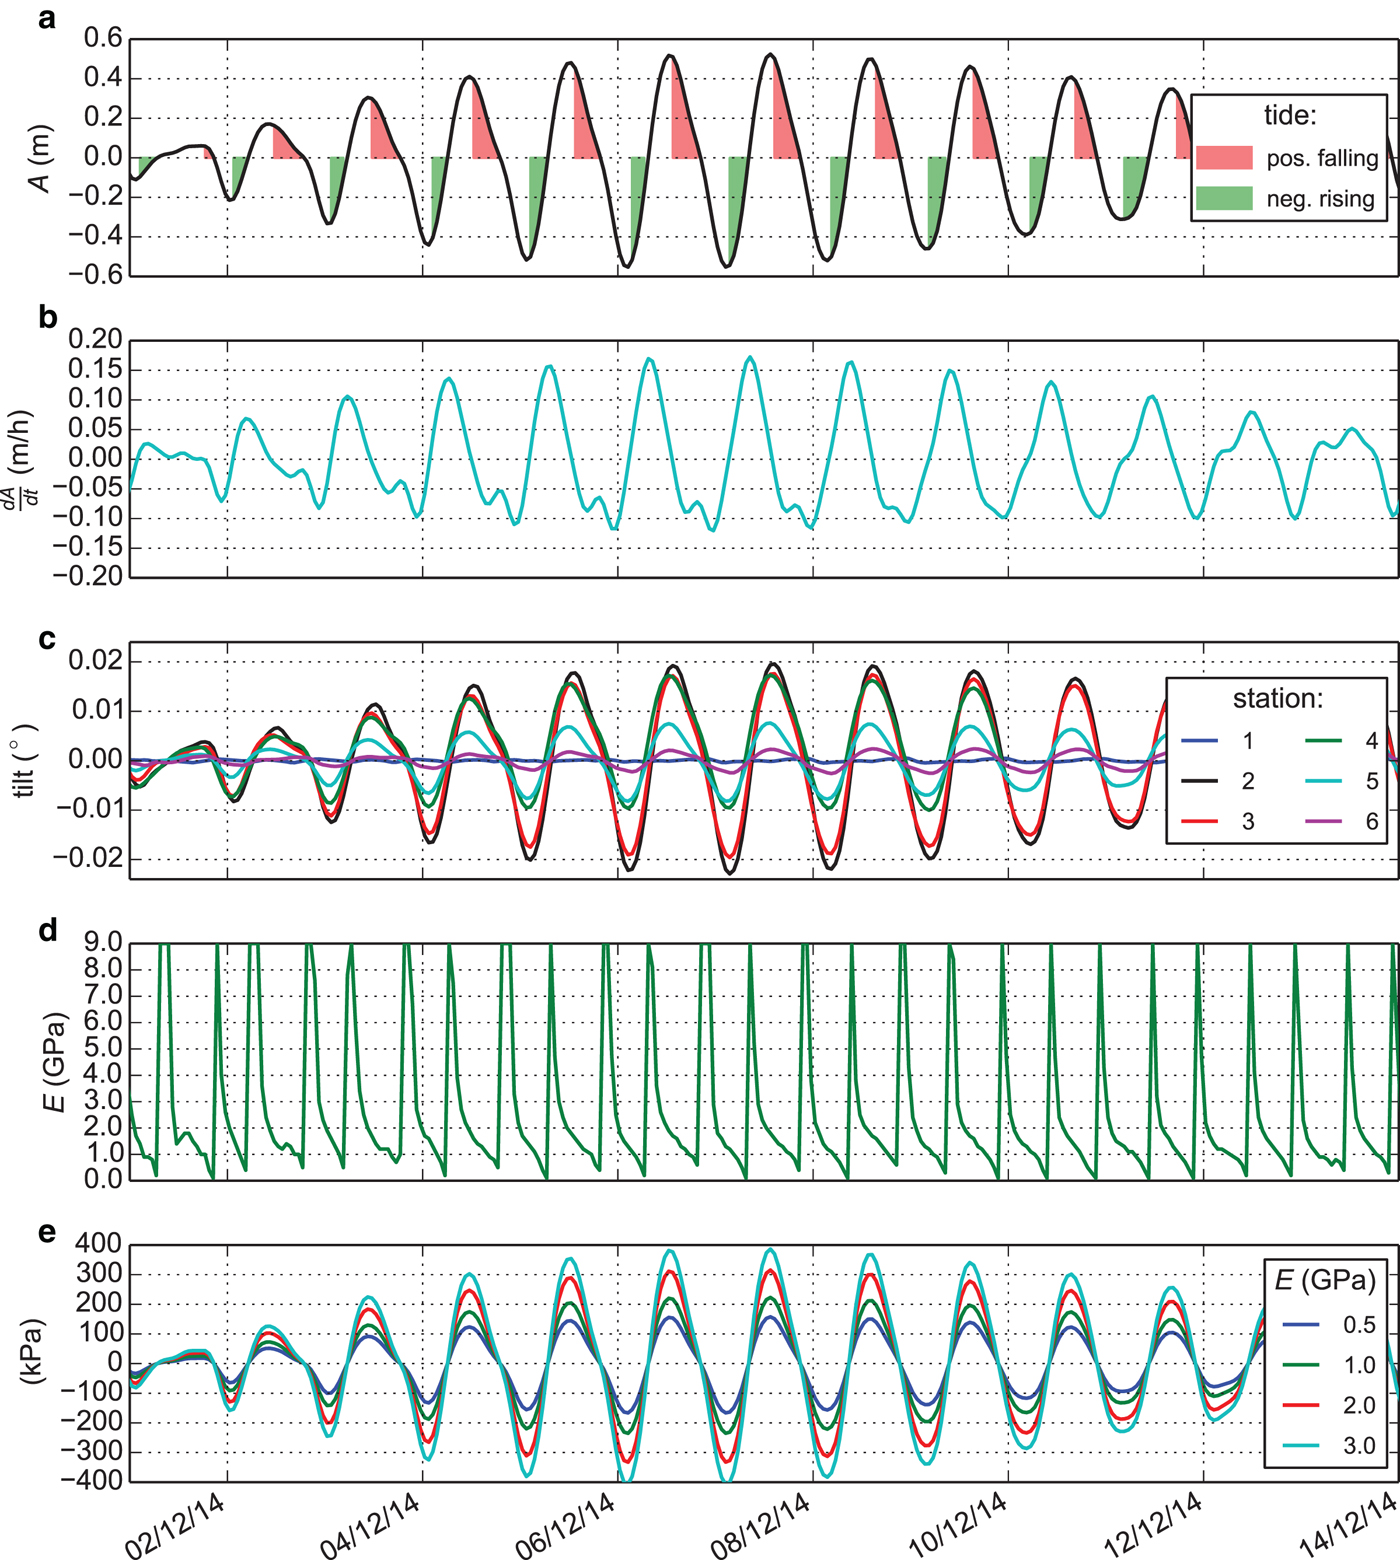
We installed six tiltmeters across the grounding zone to measure changing surface slope caused by oceanic tides. Each sensor was mounted on a 1 m long aluminium pole drilled into the ice surface and levelled using a mounted spirit level. We recorded surface tilting at six locations over a 64 d period with 1 min intervals starting on 20 November 2014. The tiltmeter dataset is detrended and interpreted using the t_tide software (Pawlowicz and others, Reference Pawlowicz, Beardsley and Lentz2002). Each location features a diurnal signal with a clear ~14 d spring-neap cycle. Station two exhibits the largest surface slope variations (±0.02°), which become progressively smaller towards the freely-floating ice shelf (Fig. 3c). We placed one tiltmeter ~100 m upstream of the grounding line, which shows a diurnal tidal signal with amplitudes close to the precision of the sensor. All model solutions for vertical displacement are differentiated with respect to x, as tiltmeters detect the time-dependent surface slope. The root-mean-square-error (RMSE) between the modelled flexure profile and the tiltmeter record can then be calculated to assess model performance.
Time series of tidal motion during the first half of December 2014. (a) The tidal amplitude and (b) its time derivative, (c) detrended surface tilt at six locations across the grounding zone, (d) calculated best-fit Young's modulus for the elastic model determined by a minimum RMSE to the tiltmeter measurements. (e) Bending stresses at the grounding line calculated from four values of the Young's modulus possibly exceeding the theoretical elastic limit of ±200 kPa.
3.2. GPS measurements
GPS measurements along the profile provide the tidal amplitude in the grounding zone at high temporal resolution. We located four GPS receivers along our glaciological profile (Fig. 2). The GPS at station seven is freely floating (located ~4.4 km downstream of the grounding line) but operated only over a period of 11 d because of technical difficulties. In this period, we could extract the dominant K1 component (23.93 h) with an amplitude of 0.27 ± 0.07 m and a corresponding Greenwich phase of 201 ± 15° allowing us to conclude that station six (2.4 km downstream of the grounding line) oscillates synchronously (0.32 ± 0.01 m and 207 ± 2°) and can also be assumed to be on the freely-floating part of the ice shelf. This extends our record of tidal amplitude from 11 d to a 75 d period starting on 9 November 2014 until 23 January 2015. The t_tide prediction is used as input for both models (Fig. 3a, b). All GPS measurements have been analysed with the t_tide software to predict the relative phase lag. Also the long-term drift of the sensors as well as short-term fluctuations could be removed from the GPS measurements.
4. RESULTS
In this section we present the effects of changing the ice rheology on the modelled flexure curves by systematically varying Young's modulus and viscosity. Variations of E have the largest effect on the flexural pattern for large tidal displacements by changing the width of the flexure zone (Fig. 4 upper panel). This is also seen in the migration of the upstream limit of tidal flexure ‘hinge line’ (coloured triangles in Fig. 4). In contrast, the ice viscosity affects the shape of the flexural profile most strongly at steeply rising/falling tides as the ice closest to the grounding line experiences the most time delay relative to the displacement on the freely-floating portion.
Model sensitivities to Young's modulus (upper panel) and viscosity (lower panel). Tidal flexure curves in the upper panel are from the lowest recorded tide (−0.6 m on 23 December 2014 02:30:00). The close-up shows upstream bending on the grounded ice due to a fixed fulcrum at the grounding line (black dot). The locations where vertical deflections become <5 mm are marked with coloured triangles. The onset of approximate hydrostatic equilibrium is characterized by displacements within 1 cm of the tidal amplitude and is marked with coloured circles. Tidal flexure curves in the lower panel with E = 1.6 GPa are at the largest rising tide (A = −0.07 m on 04 January 2015 06:30:00).
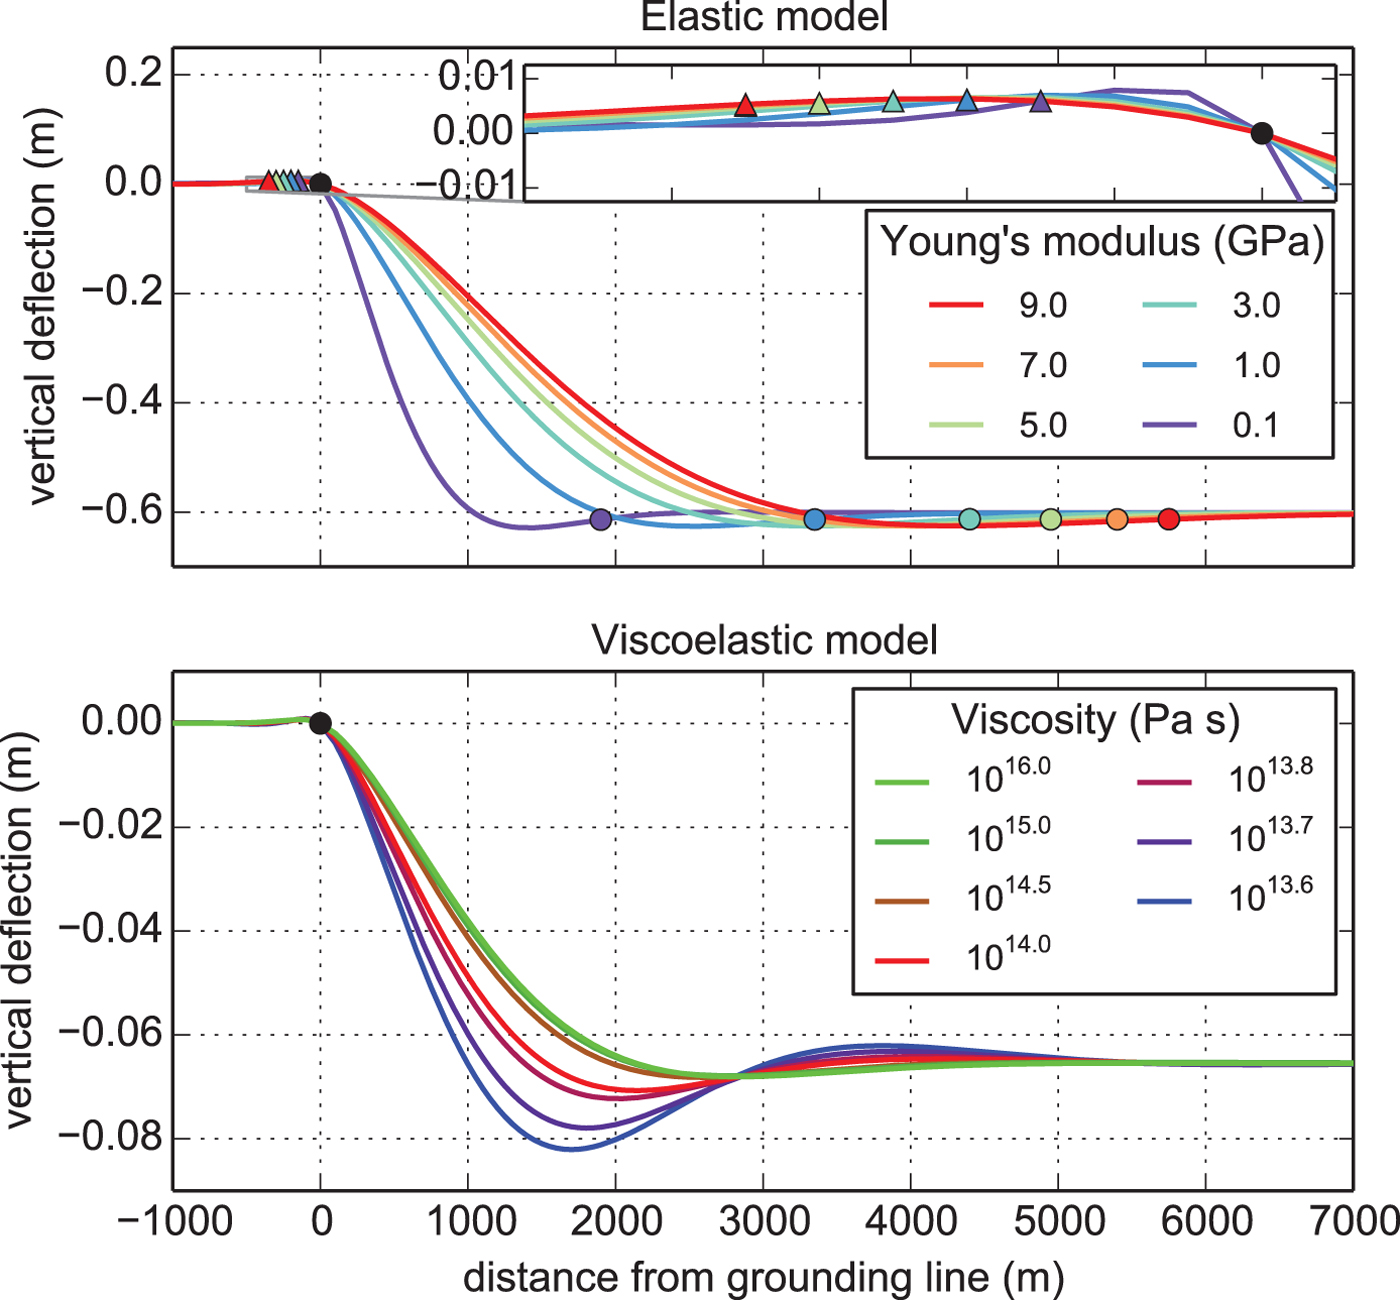
Downstream of the grounding line, beam stresses transmitted from the grounded ice prevent the ice shelf from freely floating. The imbalance leads to a region where the displacement is greater than the tidal amplitude (Bindschadler and others, Reference Bindschadler2011). In an elastic model this peak displacement is 104% of the tidal forcing. Reducing the Young's modulus shifts the bulge towards the grounding line (Fig. 4 upper panel). Downstream of the bulge, vertical displacement tends towards the tidal forcing. A 1 cm difference is chosen to represent the onset of hydrostatic equilibrium (coloured circles in Fig. 4).
In the viscoelastic model the shape of the flexure profile depends not only on the tidal displacement but also on its time derivative (Eqn. (4)). For a negative rising tide or a positive falling tide, reducing the viscosity increases the difference between the tidal amplitude and the peak deflection and shifts its location further upstream (Fig. 4 lower panel). In the case of a negative falling tide or a positive rising tide the difference between the tidal amplitude and the peak deflection still increases but its location moves downstream. As the magnitude of this effect depends on the time derivative of the tidal forcing, it is largest at rapidly changing tides – that is during the zero crossing of the tidal oscillation.
4.1. Viscoelastic time delay
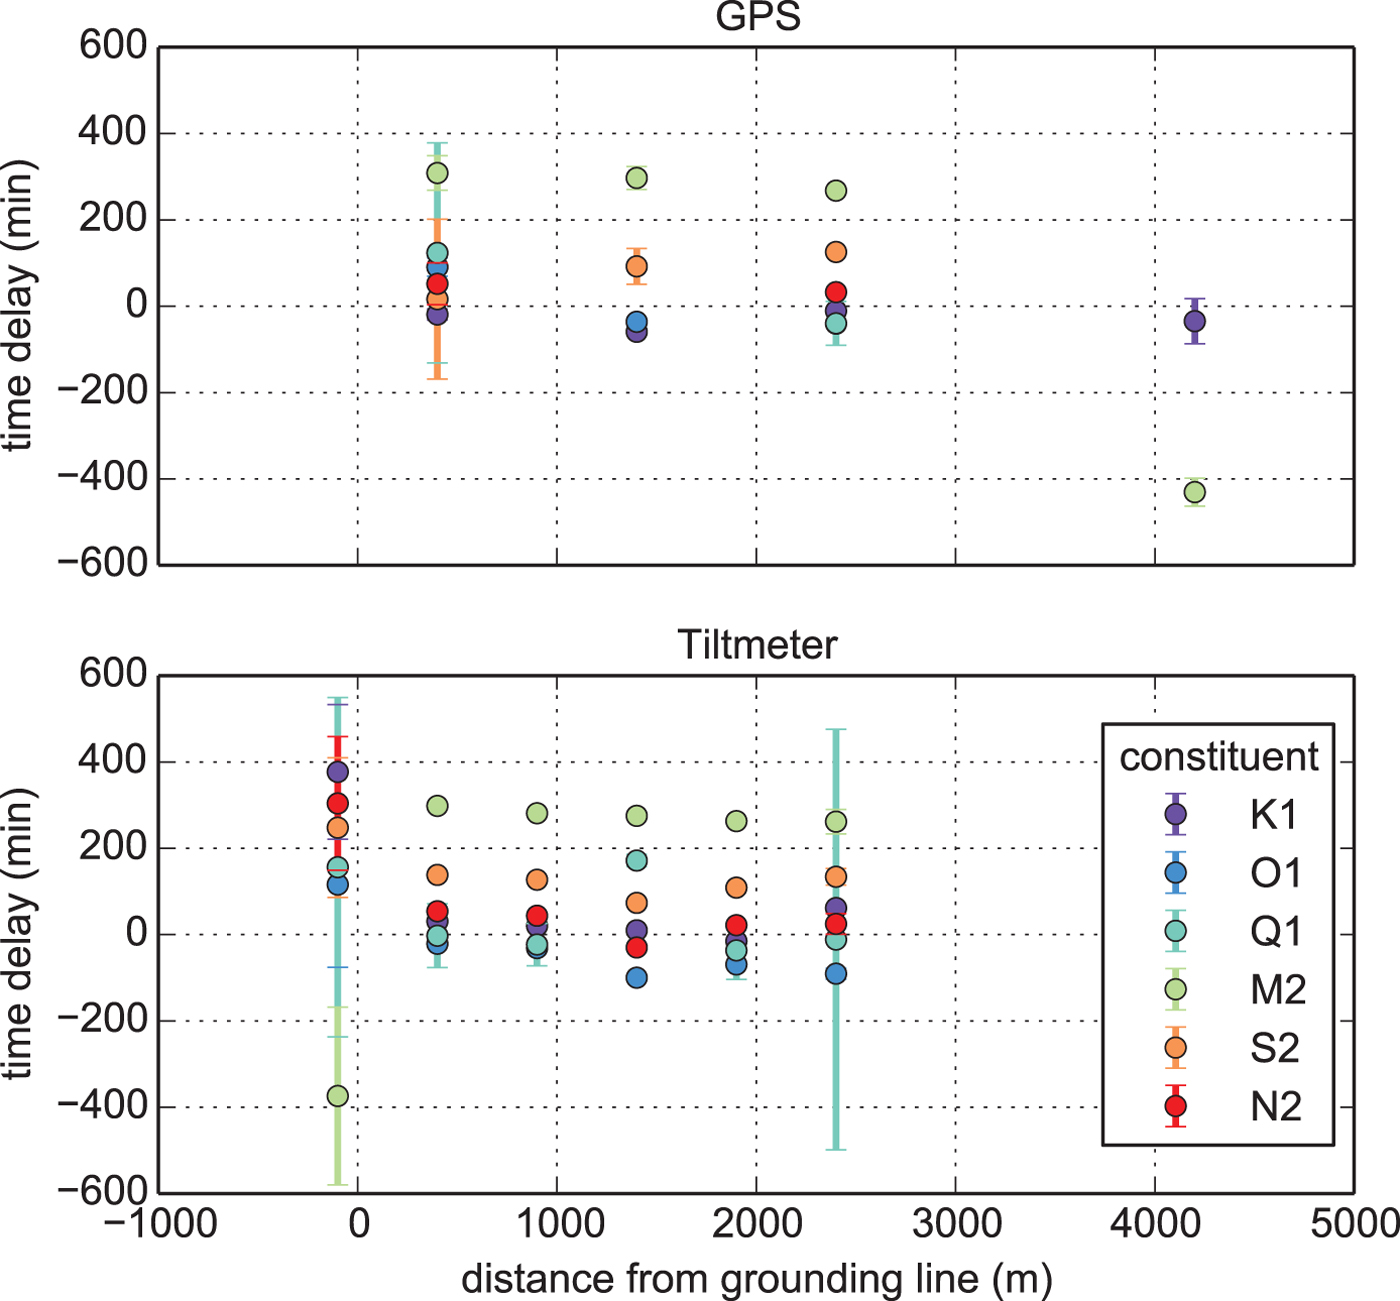
The Ross Sea is characterized by well pronounced diurnal tides and weak semi-diurnal tides (Padman and others, Reference Padman, Erofeeva and Joughin2003). In order to investigate the variation of vertical displacement and flexural response with distance from the grounding line, we compute a harmonic analysis of the GPS and tiltmeter record using the t_tide software. We compare these data to ten tidal components (K1, O1, Q1, M2, S2, N2, K2, P1, Mf, MM) from the CATS tide model, corrected for their tidal load (Padman and others, Reference Padman, Erofeeva and Fricker2008). The results reveal an increasing time delay from the freely-floating ice shelf towards its grounded part upstream of the grounding line (Fig. 5). Relative to the tidal amplitude from station six, the dominant K1 component lags ~40 min behind at station two, 30 min at station three, 20 min at station four and 5 min at station five. Time delays of a similar magnitude are observed in the semi-diurnal components.
Timelag of the GPS (upper panel) and tiltmeter (lower panel) record behind the CATS model predictions. The respective signals have been separated in diurnal (K1, O1, Q1) and semi-diurnal (M2, S2, N2) tidal constituents.
4.2. Temporal variability of Young's modulus
As an elastic constant, Young's modulus should not vary with time. Nevertheless, the Young's modulus, which fits best our data requires modifying its value depending on the tidal forcing. An increasing time delay towards the grounding line causes an apparent shift in the peak displacement, which is represented in the elastic model by gradually reducing the Young's modulus. Fitting the elastic model to the tiltmeter data results in a sawtooth shape over each 12 h period (Fig. 3d).
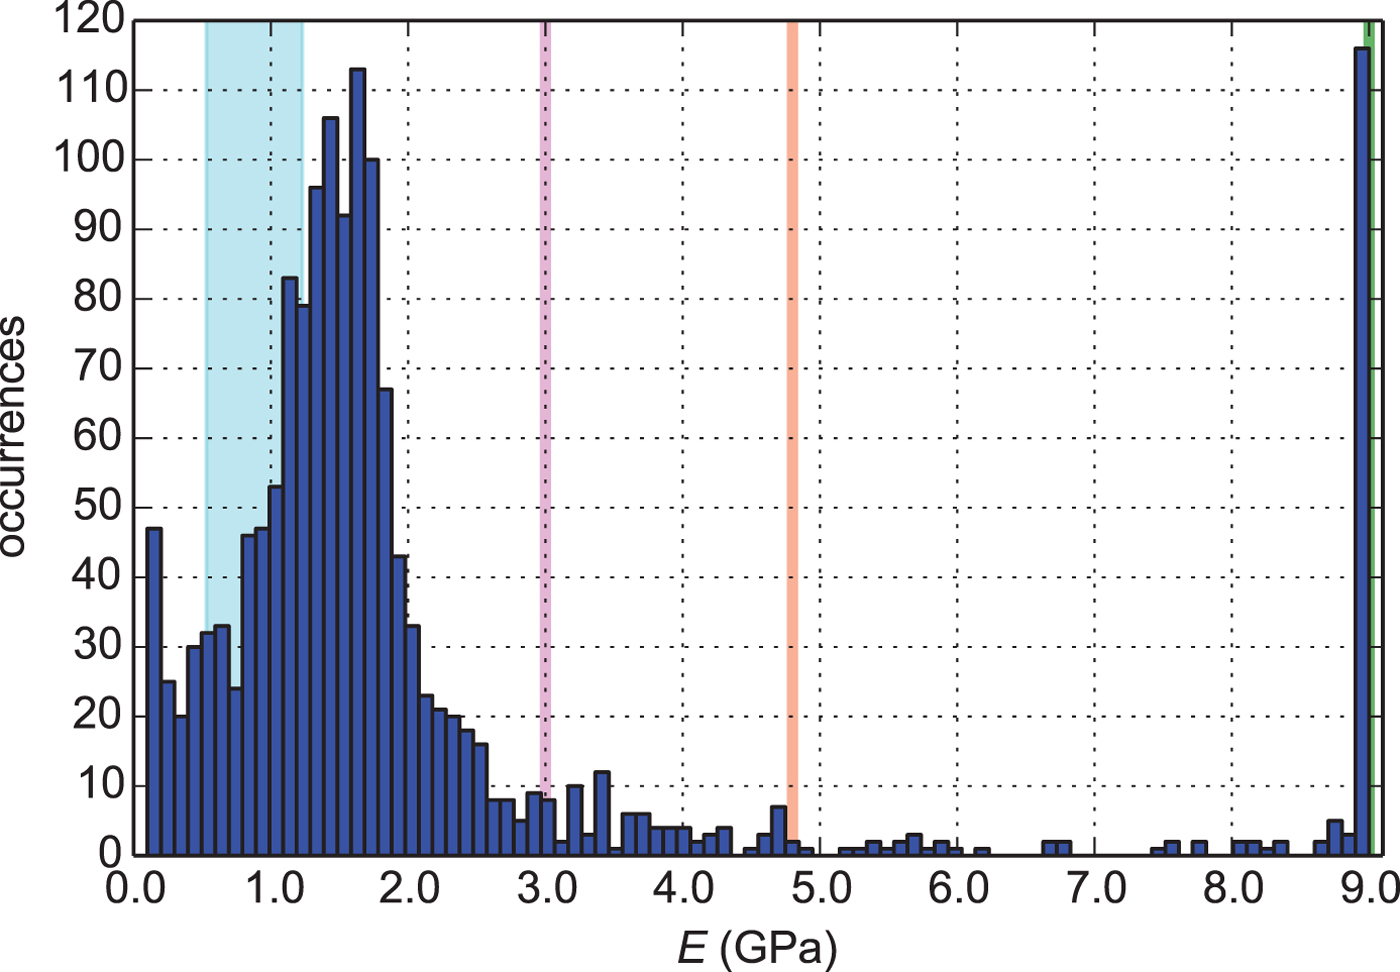
Over the tiltmeter validation period, we identify a skewed distribution of Young's moduli with the major mode E ≈ 1.6 GPa (Fig. 6). The peak at the upper boundary of the investigated parameter range (E = 9.0 GPa) is generated during the zero crossing of the tidal wave and a result of an indetermined elastic solution. To eliminate this artefact of our tuning strategy, we apply a threshold of  $A \ge \pm {\kern 1pt} 0.2$ m corresponding to 35% of the maximum measured tidal amplitude (0.56 m). This yields an elastic Young's modulus of E = 1.62 ± 0.69 GPa over the remaining time period.
Distribution of the time-dependent Young's modulus determined by the elastic model as a function of the tidal amplitude. Published values for Young's modulus in blue (Vaughan, Reference Vaughan1995), magenta (Rignot, Reference Rignot1996), brown (Gudmundsson, Reference Gudmundsson2011) and green vertical lines (Petrenko and Whitworth, Reference Petrenko and Whitworth1999).
4.3. Viscous damping
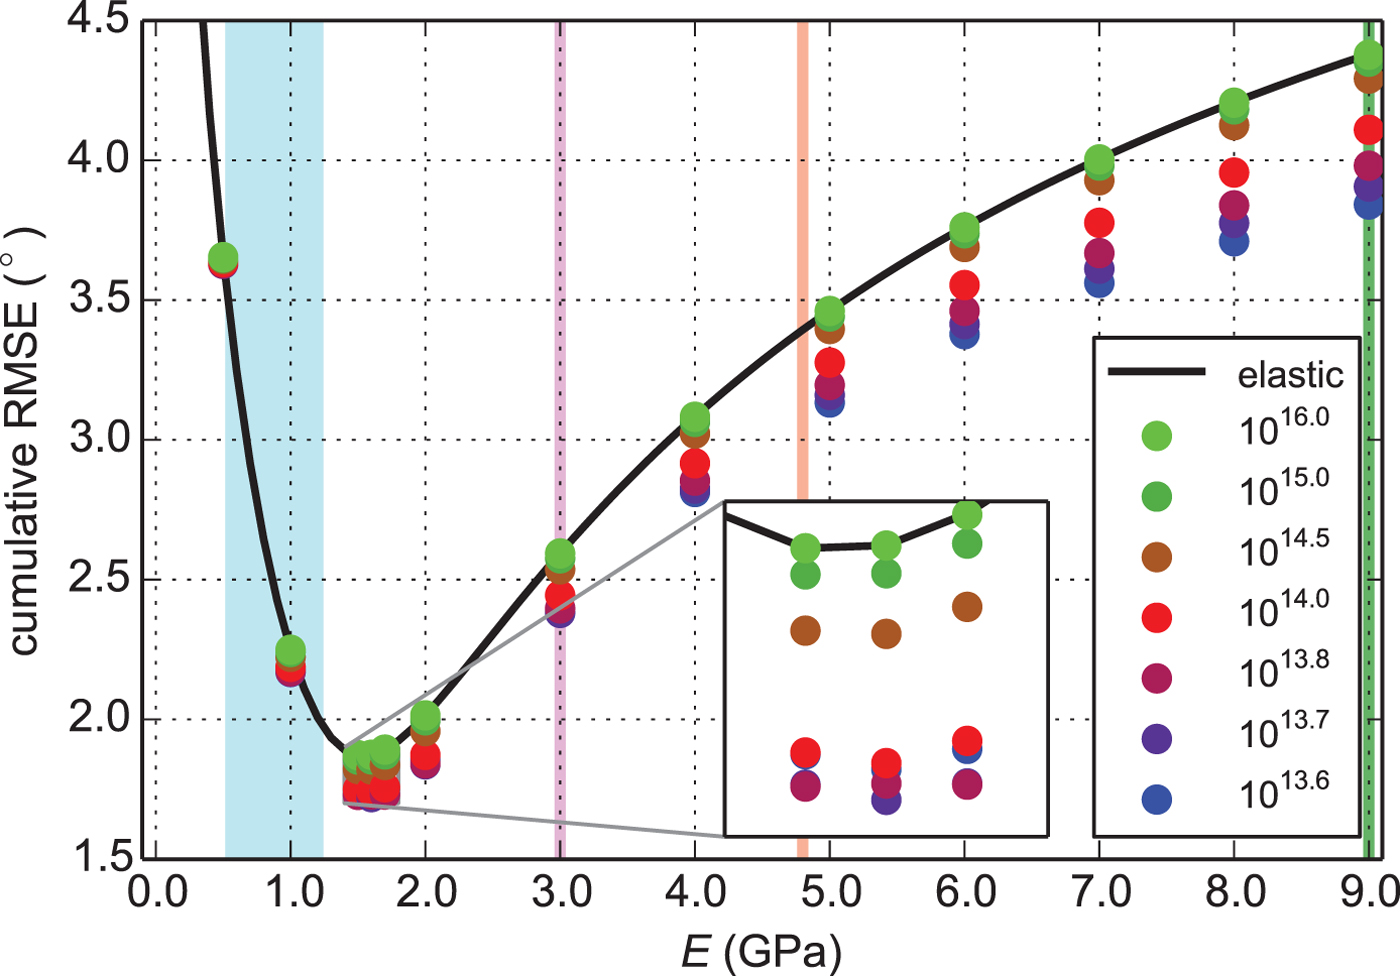
To produce a more realistic representation of the flexure we fix the Young's modulus and viscosity in time. A minimum cumulative RMSE corresponds to an over-all best fit. Over the analysed parameter range, the viscoelastic model matches best the tiltmeter record (Fig. 7). This confirms our Young's modulus of E = 1.6 GPa and reveals an ice viscosity of ν = 1013.7 Pa s that captures best the measured surface flexure. Over the entire validation period and thus for all tidal amplitudes, this parameter combination yields an overall cumulative RMSE of 1.72° – close to the 1.58° resulting from a time-varying elastic solution. For this reason, including viscous damping effects in the modelling approach explains previously observed unphysical variations in the elastic formulation.
Individual model performance of the simulated parameter combinations. The elastic solution is denoted in black, the viscoelastic solution as colour-coded dots. Published values for Young's modulus in blue (Vaughan, Reference Vaughan1995), magenta (Rignot, Reference Rignot1996), brown (Gudmundsson, Reference Gudmundsson2011) and green vertical lines (Petrenko and Whitworth, Reference Petrenko and Whitworth1999).
4.4. Temporal decomposition
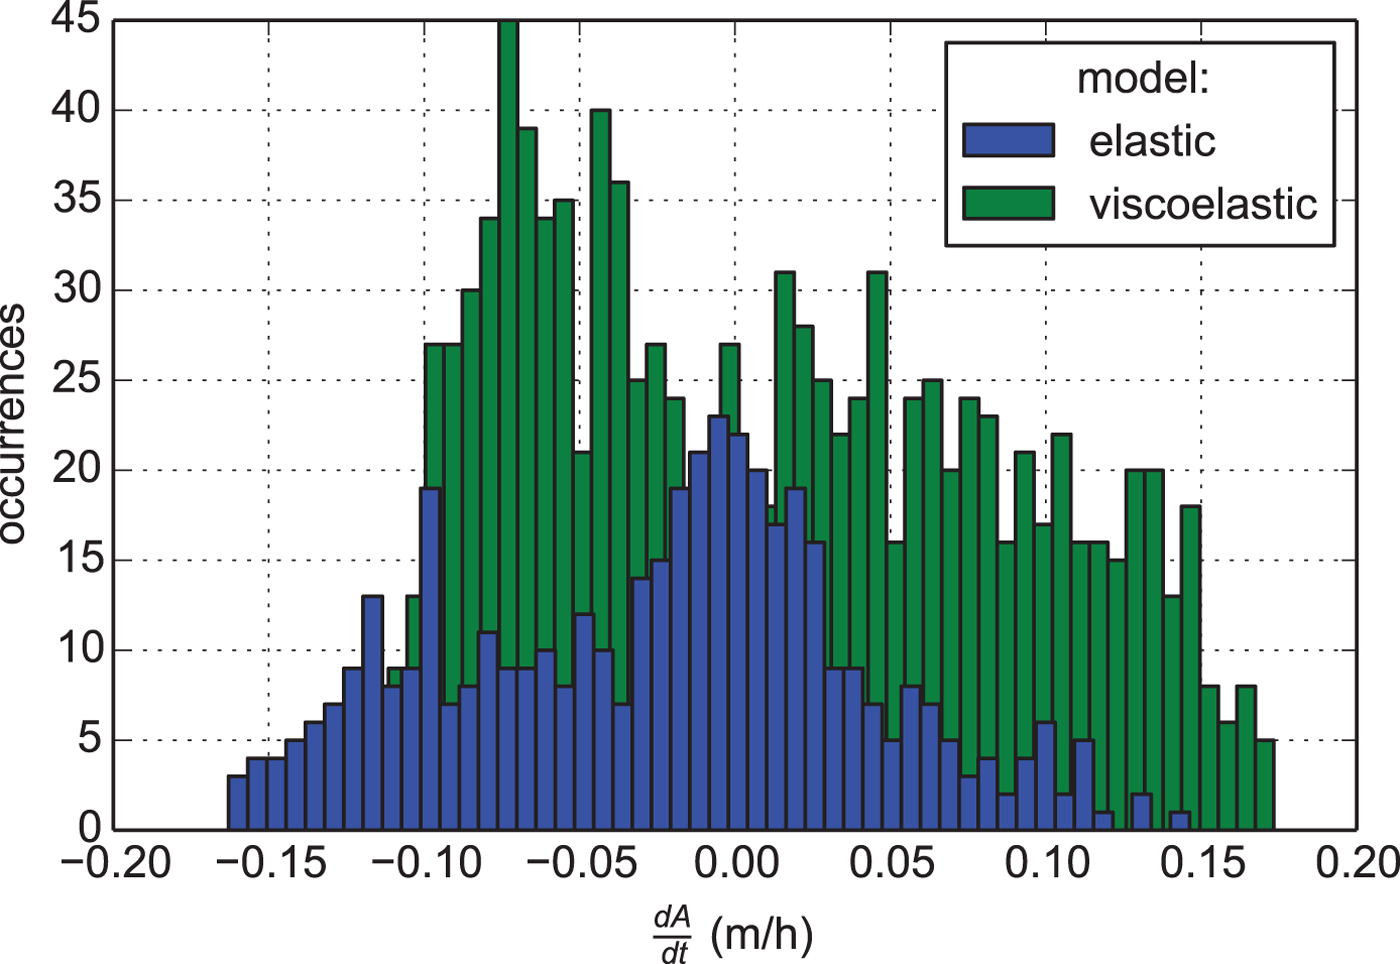
While cumulative RMSE is a good indicator for overall model performance we are also interested in model validity under different tidal conditions. In 71% of the tiltmeter record the viscoelastic model performs better than the elastic formulation. This is especially the case around small tidal amplitudes or in other words for steeply rising and falling tides (Fig. 8). When ∂A/∂t is ≈0, the ice has sufficient time to adapt to the applied tidal load and therefore both solutions are almost identical at high and low tides.
Probability distribution of the model performance for the best elastic (E = 1.5 GPa) and viscoelastic model (E = 1.6 GPa and ν = 1013.7 Pa s) as a function of the time derivative of the tidal amplitude.
The applicability of the elastic model is in theory controlled by the prevailing bending stress at the grounding line. Laboratory experiments yield a stress range of 20–200 kPa, covering ice temperatures down to −50 °C, for the elastic theory (Budd and Jacka, Reference Budd and Jacka1989). Bending stresses at the grounding line are calculated by (Holdsworth, Reference Holdsworth1969; Hughes, Reference Hughes1977):
 $$\sigma = \left( {\displaystyle{{3\rho _{{\rm sw}} gE} \over {(1 - \lambda ^2 )h_{{\rm gl}}}}} \right)^{1/2} A(t).$$
For our location, h gl = 199.5 m at the grounding line. We calculate tide-dependent bending stresses for 0.5 ≤ E ≤ 3.0 GPa and find that they might exceed the theoretical elastic limit around the maximum tidal amplitude (Fig. 3e). Therefore, we have tested the applicability of elastic theory as suggested by Schmeltz and others (Reference Schmeltz, Rignot and MacAyeal2002).
5. DISCUSSION
We analysed tidal bending using six tiltmeters across the grounding zone of the Southern McMurdo Ice Shelf. The tiltmeter record implies that a viscoelastic model with a Young's modulus of E = 1.6 GPa and an ice viscosity of ν = 1013.7 Pa s can be used to predict tidal flexure for all times at this location, thus including viscous damping effects. This confirms the findings of Reeh and others (Reference Reeh, Mayer, Olesen, Christensen and Thomsen2000) that the general inclusion of viscoelastic properties in model formulations is useful to model tidal bending.
We attribute the observed time dependence of the Young's modulus to a systematic artefact of the representation of viscous damping in the elastic model. While this effect is small during high/low tides, it leads to a violation of the elastic approximation, which does not allow the Young's modulus to be constrained for small tidal displacements when the rate of tidal change is large. In this location, this is where tidal displacements are smaller than 0.2 m, corresponding to 35% of the maximum observed tidal amplitude. The remaining 52% of the time series data are above this threshold, yielding a mean value of the Young's modulus of E = 1.62 ± 0.69 GPa, which is close to the value obtained from viscoelastic theory.
Other studies around Antarctica and Greenland used an elastic model to derive a value for the Young's modulus from a single snapshot in time. These studies neglect the potential for an apparent temporal variation in the Young's modulus caused by viscous damping effects, which are likely also present at these other locations. The smaller the relative tidal displacement, the higher the likely error in the resulting Young's modulus. Rignot (Reference Rignot1996) finds a value of E = 3.0 ± 0.2 GPa matches interferometry at Petermann Glacier. The calculation has been performed for a tidal displacement of 0.16 m – corresponding to 15% of the maximum tidal amplitude of ~ ± 1.1 m in northeast Greenland. In this case, an elastic model is likely to overestimate the Young's modulus. Similarly, Schmeltz and others (Reference Schmeltz, Rignot and MacAyeal2002) find E = 3.0 GPa at Pine Island Glacier with a relative tidal displacement corresponding to 35% of the spring-tidal amplitude in the Amundsen Sea sector. The bending stresses at both locations exceeds the elastic limit. In contrast, the Drygalski Ice Tongue (David glacier) is much thicker at the grounding line with bending stresses well within elastic theory. This is similar to the Beardmore Glacier, where E = 1.5 ± 0.5 GPa best matches interferometry with 65% relative tidal displacement (Marsh and others, Reference Marsh, Rack, Golledge, Lawson and Floricioiu2014). We suggest the elastic model is valid when the derivative of the tidal wave is small and bending stresses are <200 kPa at the grounding line. Our investigation points to a well-pronounced viscoelastic flexural behaviour below our suggested threshold of 35% relative tidal displacement. The derivation of an elastic Young's modulus from smaller tidal displacements is not possible without capturing a viscoelastic signal.
We suggest that this is valid at other grounding zones, although ice temperature, firn compaction, tidal surface cracks and basal crevassing reduce the effective ice thickness and would therefore change the effective Young's modulus (S. H. R. Rosier, O. J. Marsh, W. Rack, G. H. Gudmundsson, C. T. Wild and M. Ryan, in preparation). Two-dimensional effects have also been shown to influence the width of the flexure zone (Rabus and Lang, Reference Rabus and Lang2002).
6. CONCLUSION
An elastic and a viscoelastic model have been compared with field observations for a range of plausible values of the Young's modulus and ice viscosity. The validation shows that the utilization of a viscoelastic model to describe tidal bending in the Southern McMurdo Ice Shelf region is in general preferable to an elastic model. We found that values of the Young's modulus and the ice viscosity of E = 1.6 GPa and ν = 1013.7 Pa s, respectively, fit best the available tiltmeter data.
The simulations of temporal changes in tidal bending reveal that systematic variations in Young's modulus are required to match tiltmeter observations using the elastic approach. These can be explained by incorporating viscous damping effects in the model. This might partly explain the range of reported field derived values for the Young's modulus of ice, which have been mostly calculated for snapshots in time and neglect the temporal evolution of the flexure pattern. If the elastic model is to be used, we suggest a threshold of >35% of the spring-tidal amplitude to derive the Young's modulus.
The temporal decomposition reveals an almost elastic flexural response at high or low tides despite a clear viscoelastic signal dominating on falling or rising tides. An inverse modelling approach to calculate ice thickness or Young's modulus should be possible with careful satellite data acquisition.
Petermann Glacier and the Rutford Ice Stream show horizontal ice dynamics as well as bending stresses at the grounding line significantly beyond the theoretical elastic limit. Both characteristics can be neglected at the almost stagnant Southern McMurdo Ice Shelf with bending stresses up to 270 kPa, but a similar study needs to be undertaken in an area with comparable bending stresses and non-negligible horizontal ice flow to confirm our findings. Complications arising from complex grounding line geometries or fjord-like embayments have also been exluded from this study. Hence, the influence of grounding line configuration on the tidal flexure pattern remains to be investigated.
ACKNOWLEDGEMENTS
The work presented in this study has been performed at Gateway Antarctica, University of Canterbury, and supported by the New Zealand Antarctic Research Institute and Royal Society of New Zealand. We acknowledge the German Aerospace Agency (DLR) for providing TerraSAR-X satellite imagery and Antarctica New Zealand for logistical support of the event K053 during the season 2014/15. The fieldwork benefited greatly from the tireless commitment of D. Price and M. Ryan. We thank M. King for GPS trouble shooting and data processing. We also thank R. Greve and two anonymous reviewers for their constructive comments of this manuscript.


 Open access