


INTRODUCTION
Peatland deposits are sensitive indicators of Late Glacial and Holocene palaeoenvironmental changes (e.g., Lamentowicz et al. Reference Lamentowicz, Van der Knaap, Van Leeuwen, Hangartner, Mitchell, Goslar, Tinner and Kamenik2010; Chambers et al. Reference Chambers, Booth, De Vleeschouwer, Lamentowicz, Le Roux, Mauquoy, Nichols and van Geel2012; Rydin and Jeglum Reference Rydin and Jeglum2013). Especially mountain peatlands, formed in a specific climatic and hydrogeological regime, are characterized by clear records of climate changes for the last several thousand years (Obidowicz Reference Obidowicz1990; Margielewski Reference Margielewski2006, Reference Margielewski2018; Feuerdan et al. Reference Feuerdan, Wohlfarth, Björkman, Tantau, Bennike, Willis, Farcas and Robertsson2007, Reference Feuerdan, Persiou, Tantau, Stevens, Magyari, Onac, Markovic, Andric, Connor and Farcacs2014; Magyari et al. Reference Magyari, Vincze, Orbán, Bíró and Pál2018; Kołaczek et al. Reference Kołaczek, Margielewski, Gałka, Karpińska-Kołaczek, Buczek, Lamentowicz, Borek, Zernitskaya and Marcisz2020, Reference Kołaczek, Buczek, Margielewski, Gałka, Rycerz, Woszczyk, Karpińska-Kołaczek and Marcisz2021; Margielewski et al. Reference Margielewski, Obidowicz, Zernitskaya and Korzeń2022). Palaeoenvironmental reconstructions recently carried out on the basis of multiproxy analyzes of these sediments, allow even to determine changes in palaeotemperature, climate humidity, or human activity (since prehistoric time) (Zolitschka et al. Reference Zolitschka, Behre and Sneider2003; Feuerdan et al. Reference Feuerdan, Wohlfarth, Björkman, Tantau, Bennike, Willis, Farcas and Robertsson2007; Chambers et al. Reference Chambers, Booth, De Vleeschouwer, Lamentowicz, Le Roux, Mauquoy, Nichols and van Geel2012; Krąpiec et al. Reference Krąpiec, Margielewski, Korzeń, Szychowska-Krąpiec, Nalepka and Łajczak2016). A significant problem related to these reconstructions is, however, human activity causing (mainly as a result of melioration of peatlands or peat exploitation) significant changes in the profiles of peatland deposits. The hiatuses (sedimentation breaks) occurring here (lacking parts of the deposits due to the exploitation or drainage of the peatland), as well as peat decomposition and humification owing to mires overdrying, cause the incomplete or disturbed records of palaeoenvironmental changes (Zolitschka et al. Reference Zolitschka, Behre and Sneider2003; Hansson et al. Reference Hansson, Rydberg, Kylander, Gallagher and Bindler2013; Kustár et al. Reference Kustár, Molnár, Sümegi, Töröcsik and Sávai2016; Stivrins et al. Reference Stivrins, Ozola, Gałka, Kuske, Alliksaar, Andersen, Lamentowicz, Wulf and Reitalu2017; Drewnik et al. Reference Drewnik, Rajwa-Kuligiewicz, Stolarczyk, Kucharzyk and Żelazny2018).
In the reconstructions of the palaeoenvironment performed so far, human activity has mainly been attributed to disturbance of the upper parts of peatland sediments (Zolitschka et al. Reference Zolitschka, Behre and Sneider2003; Kołaczek et al. Reference Kołaczek, Fijałkiewicz-Kozieł, Karpińska-Kołaczek and Gałka2010; Bogacz et al. Reference Bogacz, Glina, Januszewska, Midor, Tomaszewska, Podlaska, Telega and Dradrach2017; Stivrins et al. Reference Stivrins, Ozola, Gałka, Kuske, Alliksaar, Andersen, Lamentowicz, Wulf and Reitalu2017; Drewnik et al. Reference Drewnik, Rajwa-Kuligiewicz, Stolarczyk, Kucharzyk and Żelazny2018). However, our investigation concerning the sediments of the Grel raised bog (Polish Inner Carpathians; Figure 1) indicates that modern human activity may disturb the entire profile of the mire deposits, not only its upper parts (Figure 2). In the 1960s, a full palynological profile was made for the deposits of this peat bog, indicating that its accumulation began in the Oldest Dryas Stadial (Figure 3A) (Koperowa Reference Koperowa1962). Our research in 2012–2019 showed that in the last 60 years, the thickness of the profile of organic sediments has decreased twice (from ca 7.4 m to 3.9 m), without changes in their stratigraphic sequence (Figures 2A and 3A–B). The analysis, in which the retrospective age–depth model elaborated by us for the pollen profile made in the 1960s played an important role, showed that the entire depositional profile was compacted not uniformly. The results of this research are an important contribution to the critical analysis of palaeoenvironmental reconstruction based on multi-proxy analyzes of peatland sediments, carried out especially on the basis of factors such as the rate of sediment accumulation or the varying degree of their compaction in individual parts of the sequence.
(A) Location of the Grel raised bog in the Carpathians; (B) LiDAR DTM of the Ludźmierz vicinity, with the Grel raised bog and the Czarny Dunajec River channel; (C) Topography Military Map of Austro-Hungarian Imperium, 1: 28 000, the sec. Ed. 1860 (https://maps.arcanum.com/); (D) orthophotomap of the Ludźmierz vicinity, with the Grel raised bog and the Czarny Dunajec River channel (state in 2019).

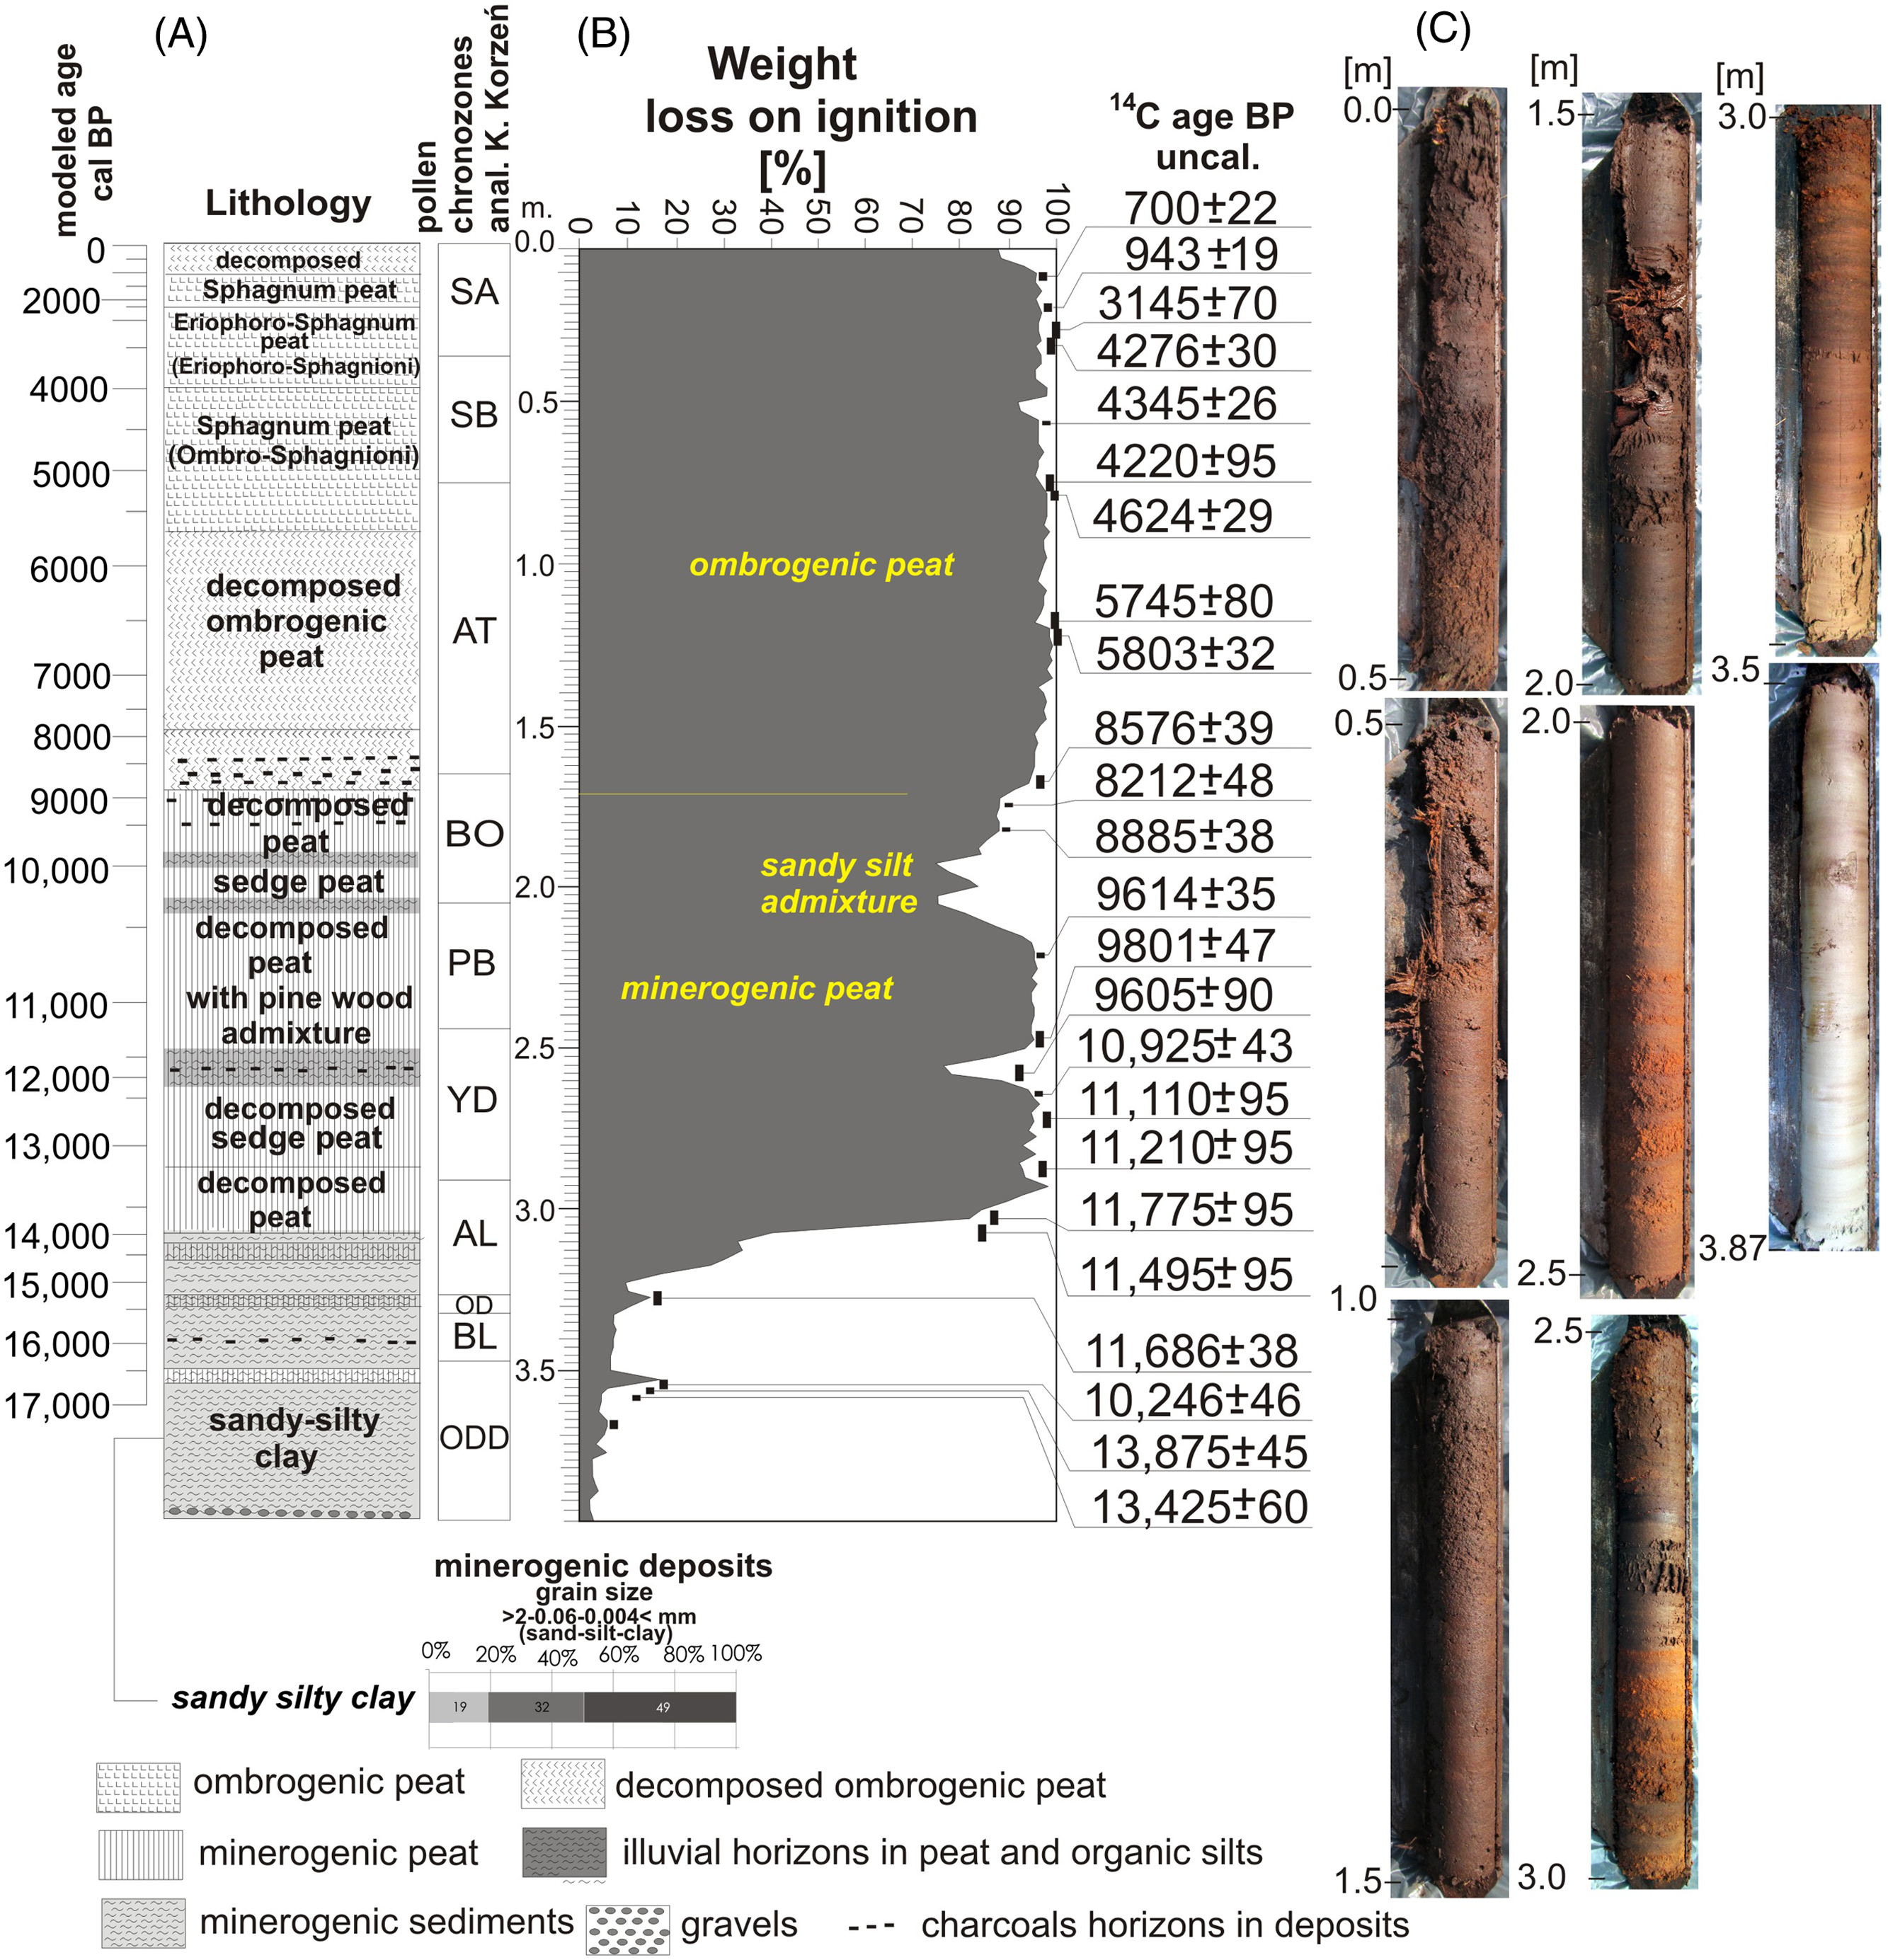
(A) Lithology of Grel raised bog (log cored in 2019), mineral sediments classified on the basis of dyfractometer analysis (grain size is presented below the log), peat type after A. Obidowicz, pollen chronozones after K. Korzeń (Figure 3B); (B) loss on ignition for each 2.5-cm interval of the log, radiocarbon datings (see Table 1); (C) photo of log (photo from W. Margielewski).
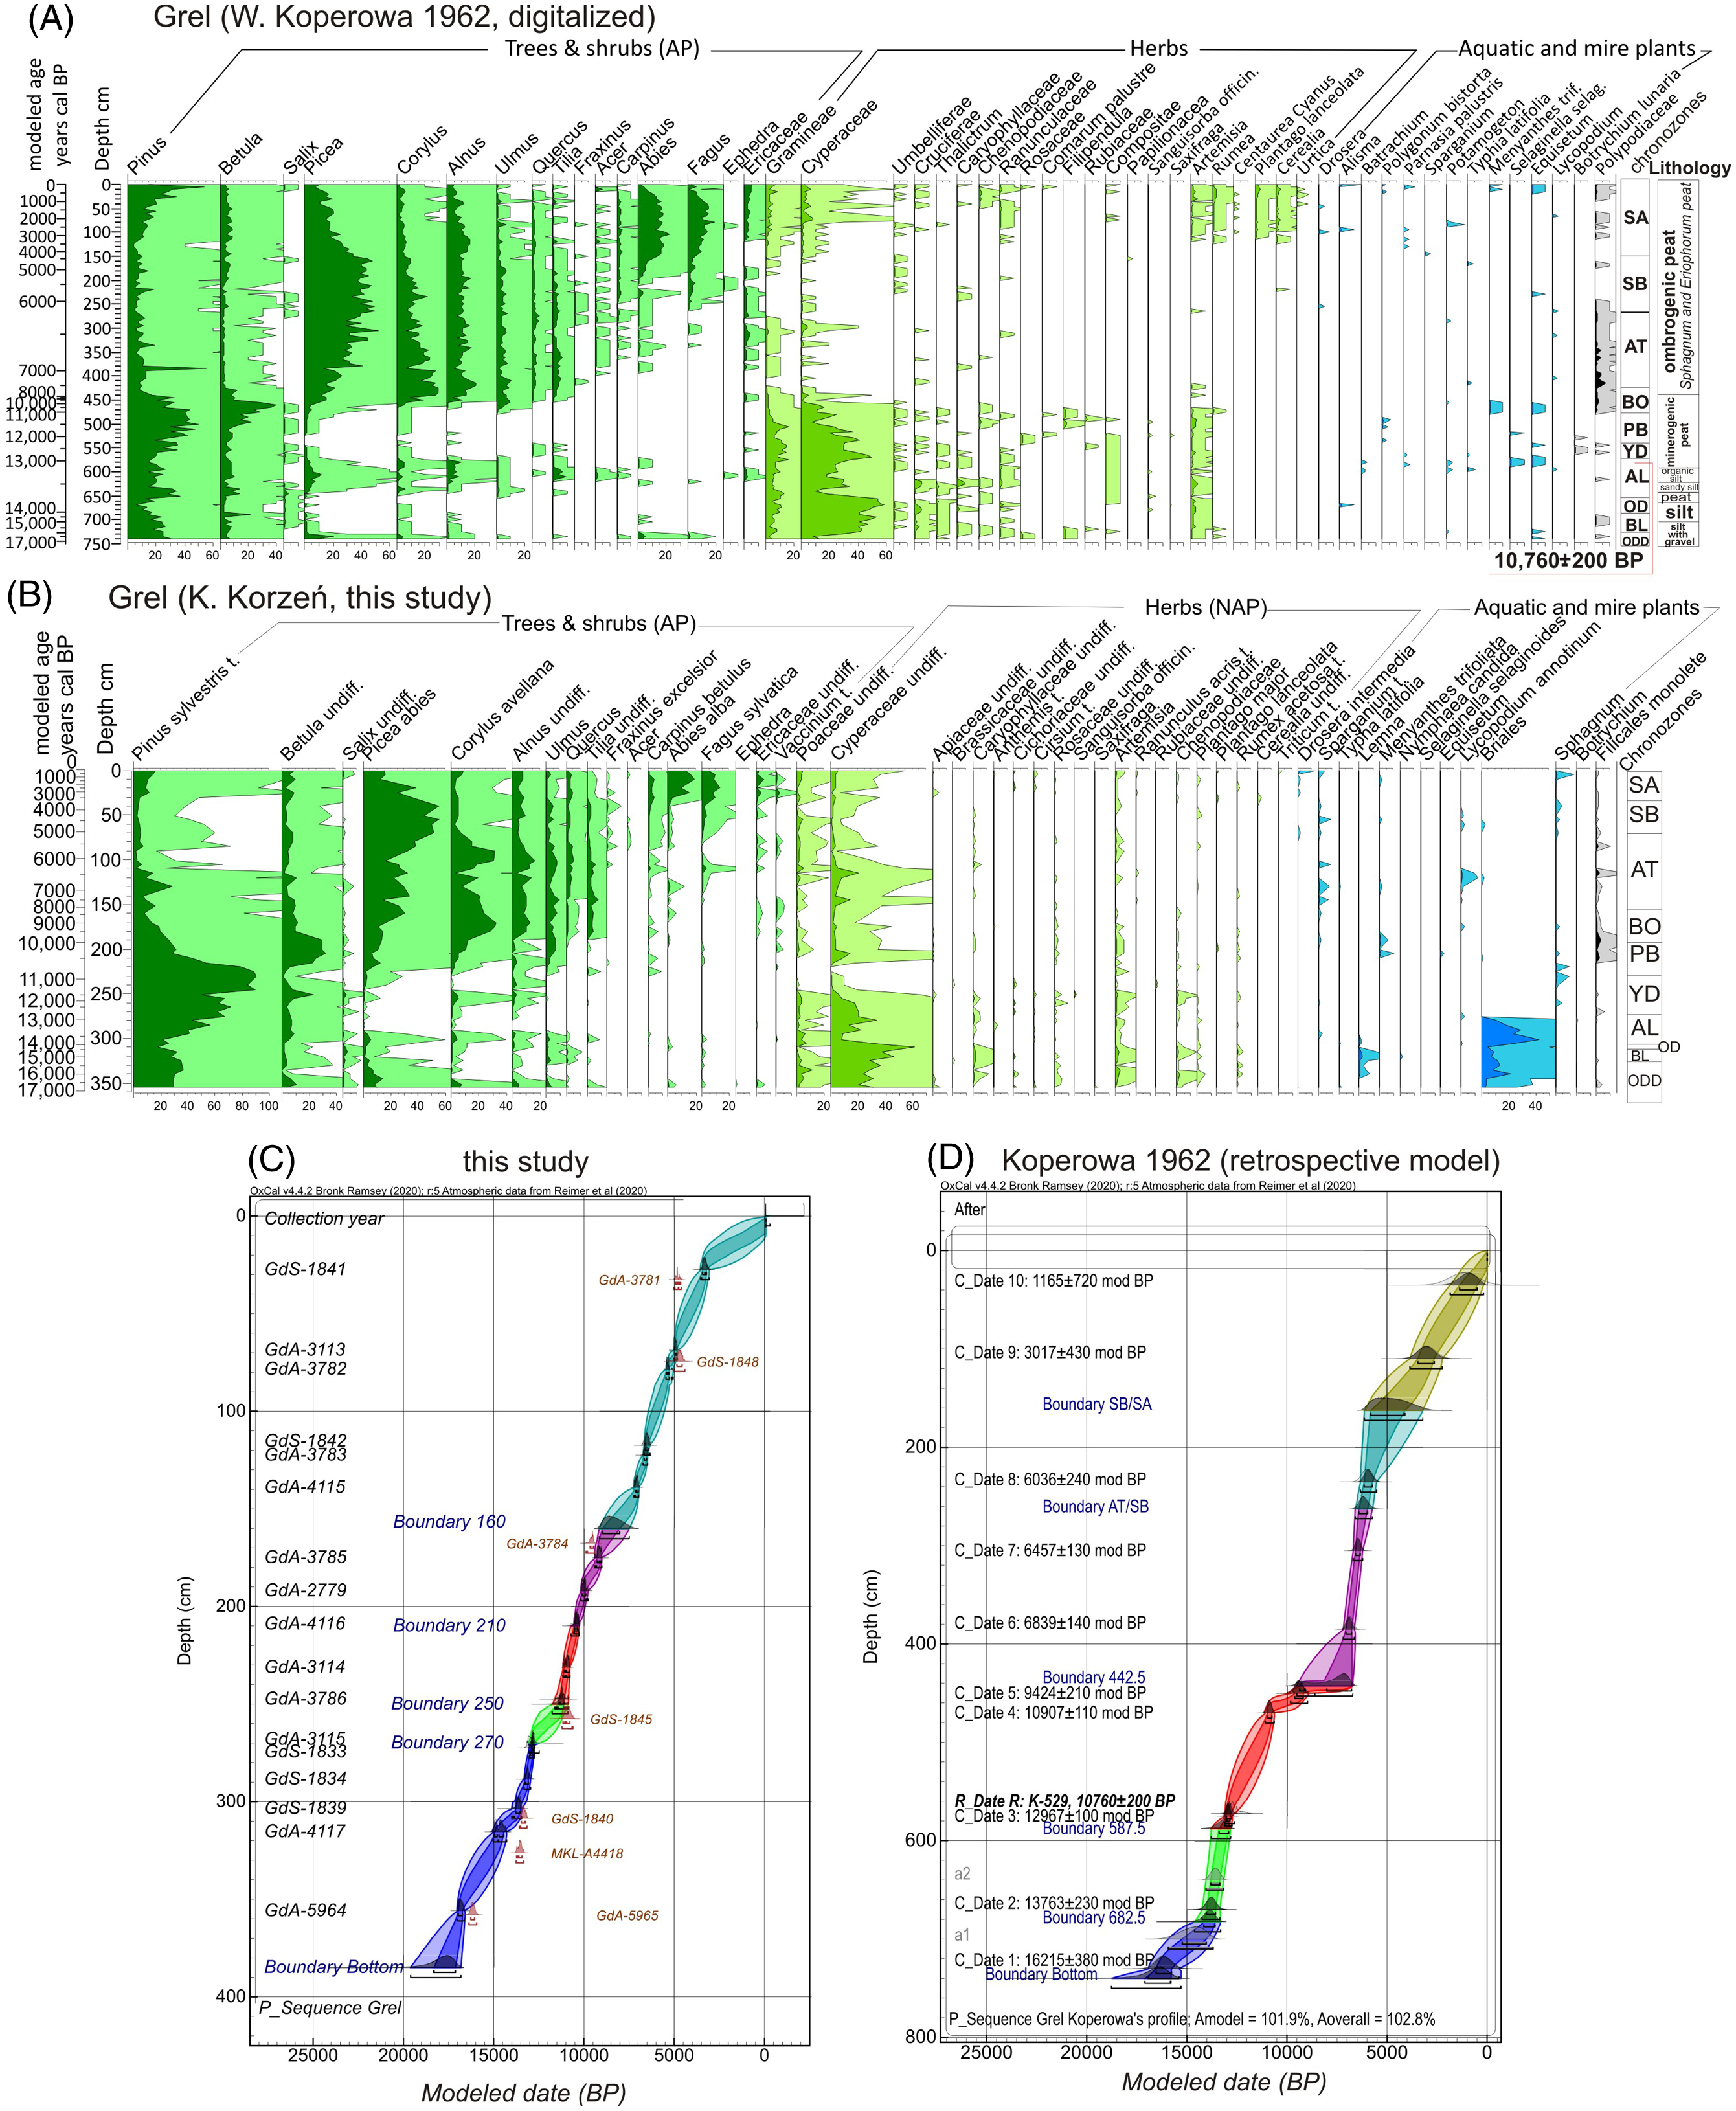
(A) Digitalized percentage pollen diagram of Koperowa (Reference Koperowa1962), simplified and supplemented. The limits of the pollen chronozones were changed by K. Korzeń according to Mangerud et al. (Reference Mangerud, Andersen, Berglund and Donner1974); (B) percentage pollen diagram for compacted profile elaborated by K. Korzeń (in 2019) (statistics and graphical elaboration by K. Buczek); (C) age–depth model for the log cored in 2019 on the basis of radiocarbon datings presented in Figure 2B and Table 1); (D) retrospective age–depth model created for Koperowa’s log (Koperowa Reference Koperowa1962), based on modeled dates assigned to correlative levels in both sequences, on the basis of PCA analysis. Age–depth scale in profile (A) on the basis of retrospective age–depth model. Age–depth models det. by: D.J. Michczyńska and A. Michczyński.
STUDY SITE
The Grel raised bog is located in the vicinity of Ludźmierz village (near town of Nowy Targ) in the Orawa-Nowy Targ Basin (ONTB)—a large intermontane basin (490–680 m a.s.l) surrounded from the north by the Western Beskidy Mountains (Outer Flysch Carpathians), and by the Spisko-Gubałowskie Foothills and the Tatra Mountains (Inner Carpathians) from the south. This depression is filled with Neogene and Quaternary deposits (Watycha Reference Watycha1976).
Mean annual temperature of ONTB (considered to be the Polish cold pole) is only 5.5ºC (Hess Reference Hess1965; Obrębska-Starklowa Reference Obrębska-Starklowa1977). Total annual precipitation reaches 740–815 mm (Obrębska-Starklowa Reference Obrębska-Starklowa1977; Kowanetz Reference Kowanetz1998). Frequent fog additionally contributes to the condensation of water within the basin (Kowanetz Reference Kowanetz1998). Owing to the hydrological specificity of the region, numerous peatlands have been formed since the Late Glacial (Koperowa Reference Koperowa1962; Obidowicz Reference Obidowicz1990; Łajczak Reference Łajczak2009; Hrynowiecka-Czmielewska Reference Hrynowiecka-Czmielewska2009; Krąpiec et al. Reference Krąpiec, Margielewski, Korzeń, Szychowska-Krąpiec, Nalepka and Łajczak2016).
The Grel raised bog is situated in the northwestern part of the ONTB. It formed in the highest terrace of the Czarny Dunajec River (ca. 598–601 m a.s.l.) (Figure 1B). The raised bog (of original area 18 ha), exploited for a long time by local communities has a degraded peat dome (598.4 m a.s.l.) (Figure 1C–D). The area of the present-day preserved peat bog reaches ca 8 ha (295 m in diameter), while maximum thickness of the bog deposits is about 3.9 m (Michczyńska et al. Reference Michczyńska, Margielewski, Korzeń, Michczyński, Borówka, Tomkowiak and Obidowicz2016). According to the first palynological studies of the peatland deposits, the beginning of the peat bog formation was then attributed to the Oldest Dryas Stadial (Figure 3A) (Koperowa Reference Koperowa1962).
MATERIALS AND METHODS
Field Works and Sampling
The Grel raised bog has never been exploited industrially by cutting surface system using machinery: exploitation was carried out only using economic method, usually in the form of small, point excavations. Thus, the part of the peatland dome has remained unchanged. Therefore the sediment cores, obtained in 2012–2019, were taken from the same place as it was done by Koperowa in the 1960s (Koperowa Reference Koperowa1962), at the thickest part of the peatland dome with an undisturbed surface. This place was precisely pointed out by prof. K. Szczepanek (from the Jagiellonian University), who was the witness of drillings done by Koperowa. The logs were cored, using INSTORF sampler 10 cm and 7 cm in diameter (GPS drilling N49 28.754'; E19 59.352'). Five cores in total were collected (part of them for future analyses).
Analyses of Sediments
Loss on ignition (LOI) analyses of deposits were done for each 2.5 cm segment of log, according to Heiri et al. (Reference Heiri, Lotter and Lemcke2001) procedure. Mineral sediments were examined by dyfractometric analysis, whereas peat was subjected to microscopic tissues analysis (performed by A. Obidowicz). Peat sediments were categorized according to Tołpa et al. (Reference Tołpa, Jasnowski and Pałczyński1971) classification.
Pollen- and Non-Pollen Palynomorphs
Samples for pollen analysis (1 cm3) were taken from the log at 5 cm intervals and were prepared according to the standard procedure proposed by Berglund and Ralska-Jasiewiczowa (Reference Berglund, Ralska-Jasiewiczowa and Berglund1986). Calculations and presentation of palynological data (on pollen diagram) were performed (by K. Korzeń) using POLPAL software (Nalepka and Walanus Reference Nalepka and Walanus2003), and TILIA Graph program (Grimm Reference Grimm1991) (Figure 3B). Chronozone boundaries were used according to the Mangerud et al. (Reference Mangerud, Andersen, Berglund and Donner1974) and Starkel et al. (Reference Starkel, Michczyńska, Krąpiec, Margielewski, Nalepka and Pazdur2013) subdivisions of the Holocene. The Late Glacial chronozone boundaries were established according to Litt et al. (Reference Litt, Brauer, Goslar, Merkt, Bałaga, Mueller, Ralska-Jasiewiczowa, Stebich and Negendank2001), Lowe et al. (Reference Lowe, Rasmussen, Bjorck, Hoek, Steffensen, Walker and Yu2008), Amman et al. (Reference Amman, van Leeuwen, van der Knaap, Lischke, Heiri and Tinner2013), Rasmussen et al. (Reference Rasmussen, Bigler, Blockey, Blunier, Buchardt, Clausen, Cvijanovis, Dahl-Jensen and Johnsen2014).
Pollen percentage diagram of W. Koperowa (Reference Koperowa1962) was digitized, the number of taxa was reduced and ordered, using TILIA Graph program (Grimm Reference Grimm1991) (Figure 3A). The chronozones boundaries proposed previously by W. Koperowa (Reference Koperowa1962), were corrected by us according to Mangerud et al. (Reference Mangerud, Andersen, Berglund and Donner1974) (age calibrated by Walanus and Nalepka Reference Walanus and Nalepka2010) and Starkel et al. (Reference Starkel, Michczyńska, Krąpiec, Margielewski, Nalepka and Pazdur2013) Holocene and Late Glacial subdivision, using the dendrogram based on the ConsLink (constrained single link of samples) analysis (Nalepka and Walanus Reference Nalepka and Walanus2003). Principal component analysis (PCA) of correlated levels of both pollen profiles was performed using “R” environment for statistical computing.
Radiocarbon Dating and Age–Depth Model Construction
In total, 24 radiocarbon datings were made. The dating was conducted in the Gliwice Radiocarbon Laboratory (GdS signature for LSC and GdA—for the AMS method) and in the Marek Krąpiec Laboratory in Kraków (MKL—signature), using AMS (Piotrowska Reference Piotrowska2013) and LSC techniques (Pazdur et al. Reference Pazdur, Fogtman, Michczyński and Pawlyta2003) (Table 1). The radiocarbon dates were calibrated using the computer program OxCal v. 4.3 (see Bronk Ramsey Reference Bronk Ramsey2006) and the IntCal20 calibration curve (Reimer et al. Reference Reimer, Austin, Bard, Bayliss, Blackwell, Bronk Ramsey, Butzin, Cheng, Edwards, Friedrich, Grootes, Guilderson, Hajdas, Heaton, Hogg, Hughen, Kromer, Manning, Muscheler, Palmer, Pearson, van der Plicht, Reimer, Richards, Scott, Southon, Turney, Wacker, Adolphi, Büntgen, Capano, Fahrni, Fogtmann-Schulz, Friedrich, Köhler, Kudsk, Miyake, Olsen, Reinig, Sakamoto, Sookdeo and Talamo2020).
Radiocarbon dates of samples taken from the log cored in 2019 in the Grel peatland (see Figure 2B) and results of their calibration.

The age–depth model was elaborated using the P_Sequence function in the OxCal program (Bronk Ramsey Reference Bronk Ramsey2006, Reference Bronk Ramsey2008). The modeled age, derived from the age–depth curve, is presented in the text as mod. cal BP. For the construction of the age–depth model of Koperowa’s log and obtained the retrospective modeled age (RMA), we used modeled age of pollen horizons of a new pollen diagram for the log drilled in 2019, well correlated with similar pollen horizons in Koperowa’s log (Table 2), as well as one radiocarbon dating made for this latter log: 10,760 ± 200 BP (K-529) elaborated in the Copenhagen Radiocarbon Laboratory (Tauber Reference Tauber1960; Koperowa Reference Koperowa1962) (Figure 3A; Table 1). This was probably one of the first radiocarbon date in paleoecological research history of the Polish Carpathians.
Pollen Correlated Horizons (PCH) in Koperowa (Reference Koperowa1962) pollen diagram and K. Korzeń pollen diagram (this study) of the log cored in 2019.

RESULTS AND INTERPRETATION
Sequence of Deposits
Over the fluvial gravel of the Czarny Dunajec River, drilled here (in 2012–2019), in the interval of 390–327 cm, bluish-grey silty sandy clay occurs (Figure 2A). In the middle part of this complex of mineral sediment, there is an insert of organic detritus dated by the AMS method at 17,026–16,661 cal BP (GdA-5964) (Figure 1A; Table 1). Deposition of mineral material was continuing during the warming of the Bølling Interstadial and the short-term cooling of the Older Dryas, identified here by palynology (Figure 3B).
At the beginning of the climate warming of the Allerød Interstadial, the accumulation of minerogenic peat began. Currently it is represented by the highly decomposed sedge peat of a thickness of approx. 1 m (decomposition factor of peat is ca. 65%) (Figure 2A). The beginning of its accumulation was dated at ca. 13,807–13,446 cal BP (GdS-1839) (Figure 2; Table 1). In the terminal phase of the Younger Dryas cooling, dated here at 12,924–12,748 cal BP (GdA-3115; 11,685 ± 361 mod. cal BP), an illuvial horizon within the decomposed peats is visible. This horizon was formed due to to supply of mineral material (sandy silt), as a result of overflow of peatland by the Czarny Dunajec River, which was probably associated with floods caused by a permafrost melting (Figure 2A–B). Another such flood episode that created an illuvial horizon in peat depositional sequence occurred in the Preboreal Phase, dated at ca. 11,173–10,775 cal BP (GdA-3114; 10,314 ± 114 mod. cal BP) (Figure 2) and was probably related to the Preboreal Cold Oscillation (PBO) (see Behre Reference Behre1978; Björck et al. Reference Björck, Rundgrend, Ingolfssen and Vunder1997; van der Plicht et al. Reference van der Plicht, van Geel, Bohncke, Bos, Blauuw, Speranza, Muscheler and Björck2004). The illuvial horizon was formed within the sedge peat with Carex, Menyanthes trifoliata, and pine wood (Figure 2A–B), locally strongly decomposed (Figure 2A). The beginning of ombrogenic peat accumulation (at depth 1.7 m) was associated with the climate warming at the beginning of the Atlantic Phase and is dated here at ca. 9399–9018 cal BP (GdA 3785; Figure 2; Table 1) (8916 ± 293 mod. cal BP). The bottom part of this complex is formed by a strongly decomposed ombrogenic peat, which upwards (in the interval 0.7–0.4 m) turns into Ombro-Sphagnioni detritus peat, formed by mosses: Sphagnum fallax, Sphagnum magellanicum, and cottongrass (cottonsedge) (Eriophorum vaginatum), as well as bog rosemary (Andromeda polifolia). In the higher part of peat complex (0.4–0.2 m), the composition of ombrogenic peat (Eriophoro-Sphagneti) is predominated by cottongrass peat (Eriopphorum vaginatum), with participation of moss Sphagnum magellanicum and bog rosemary (Andromeda polifolia), while pure Sphagnum peat predominates at the top (0.2–0.1 m). In the highest 10 cm of the log, ombrogenic peat is strongly decomposed (Figure 2A).
Local Vegetation History
The beginning of the vegetation history record in palynological profiles (Koperowa Reference Koperowa1962, Figure 3A, and this study—Figure 3B) dates back to the Oldest Dryas Stadial. Although vegetation history is based on both palynological diagrams, absolute dating of chronozone boundaries is presented for the pollen diagram elaborated in 2019 (Figure 3B) and based on the modeled age (Figure 3C).
The Oldest Dryas Stadial (before 16,374 mod. cal BP)
During the Oldest Dryas, herbaceous plants, mainly sedges (Cyperaceae), prevails in the fen area and in its vicinity. The tree pollen is predominated by Pinus, with a small amount of Betula, Picea, Alnus and Salix, and a very small share of species with increased thermal requirements (Corylus, Ulmus) (Figure 3A–B), whose pollen in the bottom part of this log is probably redeposited. The region at that period was overgrown by tundra, with shrubs and patches of herbaceous plants.
Bølling Interstadial (16,374–15,435 mod. cal BP)
The percentage pollen diagrams show an increase in the proportion of pine with a simultaneous decrease in birch and the appearance of a large amount of grasses (Poaceae), Artemisia and Chenopodiaceae. The vegetation was still tundra-type, but with Pinus patches involving Larix.
Older Dryas Stadial (15,435–15,165 mod. cal BP)
This short climate cooling (lasting only 190 years) was clearly marked in both diagrams by a significant predomination of Cyperaceae pollen and a small share of Pinus (Figure 3A–B).
Allerød Interstadial (15,165–13,213 mod. cal BP)
Vegetation in this period was characterized by an increase in the share of trees: mainly Pinus, but also Betula, Alnus, Salix and species with higher thermal requirements (Tilia, Corylus, Quercus) (Figure 3A–B). In the vicinity of the peatland mixed forest was present, with the dominance of Pinus and admixture of Betula and Picea, locally also with Alnus and Salix. On the southern slopes of the hills adjacent to the Grel peatland, refugia with thermophilous plants: Corylus, Tilia and Quercus probably occurred. The presence of pollen of thermophilous plants in the Allerød sedimentary sequences has been reported from various sites of the Western Carpathians and forelands (see: Mamakowa Reference Mamakowa1962; Margielewski et al. Reference Margielewski, Obidowicz, Zernitskaya and Korzeń2022).
Younger Dryas Stadial (13,213–11,242 mod. cal BP)
During this climate cooling, an increase of Artemisia and Poaceae proportion in the total pollen spectra composition was recorded (Figure 3A–B). Increase in the share of Pinus and Betula and in younger parts of YD, also Corylus, Alnus and Salix, is observed. The vegetation at that time was composed of patches of coniferous forest and communities predominated by Pinus with an admixture of Betula, and later also other deciduous trees, alternating with patches overgrown by grass and herbaceous plants.
Preboreal Phase (11,242–10,314 mod. cal BP)
The final stage of the Younger Dryas Stadial and the beginning of the Preboreal Phase are marked by a decrease in the pine pollen, an increase in pollen of other tree species and a much smaller share of pollen of herbaceous plants. In particular, Betula and the thermophilous Corylus and Ulmus clearly appeared in the forest species composition.
Boreal Phase (10,314–8649 mod. cal BP)
During the Boreal Phase a significant increase in the share of Corylus and Picea is recorded in both diagrams (Figure 3A–B). There is also a decrease in the percentage of Pinus pollen, and, at the end of the Boreal Phase, also of Betula in favor of Picea, Alnus and trees with higher thermal requirements, such as Tilia, Quercus and trace amounts of Carpinus. The participation of pollen of herbaceous plants is small. Mixed forest communities covered mountain slopes in the vicinity of peatland. The Picea and Corylus entered the fen, slowly pushing Pinus and Betula to the area of the Nowy Targ Basin. Gradually, Alnus and (locally, on the “warmer” slopes) Carpinus, Quercus and Tilia appeared (Figure 3A–B).
Atlantic Phase (8649–5091 mod. cal BP)
In the Atlantic section of the depositional sequence both diagrams show the significant predominance of Corylus and Picea as well as a large share of tree species with higher thermal requirements: Tilia and Quercus. Abies and Fagus pollen is found occasionally (Figure 3A–B). Fagus pollen appears temporary already in the middle of the Atlantic phase, while traces of Abies—even at the beginning of this phase. It is an interesting observation, because their appearance seems to be a very early one as for the Carpathians region (see Obidowicz et al. Reference Obidowicz, Madeyska and Turner2013). The percentage of herbaceous plants is small. At that time, the multi-storey arrangement of vegetation in the region was clearly formed. In the Nowy Targ Basin occur mainly peatland communities, to a small extent covered by Pinus, Betula and Picea. The lower parts of the slopes were overgrown with multi-species deciduous forests, and above them spruce forests predominated. With the beginning of the Atlantic Phase, a change in the sedentation of minerogenic peat into an ombrogenic peat is visible in the peatland (Figure 2A).
Subboreal Phase (5091–3609 mod. cal BP)
Along with the climate cooling in the Subboreal Phase a decrease in the share of Corylus and a significant increase in the participation of Picea (Figure 3A–B) is observed. The main plant communities at this time were still forests and woodlands, while the fen area was to a small extent covered with Betula and Pinus, with small participation of Picea. Along the rivers and streams alder and riparian forests occurred. There was a slight change in the vegetation on mountain slopes—the area of spruce forests increased, and Corylus ceased to predominate in deciduous forests growing in locations at lower altitudes.
Subatlantic Phase (since 3609 mod. cal BP)
In the Subatlantic Phase, there was a sharp decline in the share of Picea in the pollen spectrum, in favor of Fagus and Abies. In the Orawa-Nowy Targ Basin, the share of forest communities with Pinus and Betula increased. A greater share of herbaceous plants began to be visible on pollen diagram, mainly related to human activity (Rumex, Plantago lanceolata, P. major) and there is also pollen of cereals (Cerealia, Triticum). The lower parts of the nearby Beskidy Mts. slopes were covered with deciduous and mixed forests, with a significant participation of Fagus and Abies, turning upwards into fir-beech and fir forests. Spruce forests have been pushed into the higher parts of the slopes.
Retrospective Modeled Age (RMA) of Koperowa’s Log
The variables in the PCA (principal content analysis) performed for both palynological diagrams were the most common taxons: Pinus sylvestris t., Betula undiff. Picea abies, Abies alba, Fagus sylvatica, Quercus, Tilia undiff., Ulmus, Carpinus betulus, Alnus undiff., Corylus avellana, Ericaceae undiff., Poaceae undiff., Cyperaceae undiff., Cerealia undiff., Artemisia, Chenopodiaceae. PCA analysis allowed to identify 10 corresponding levels (Pollen Correlated Horizons: PCH) in both pollen profiles, in which the share and mutual proportions of pollen of diagnostic taxa were characterized by high similarity, i.e., similar variability of taxa (Table 2). The modeled age was then determined for the designated PCH. For the palynological profile developed in 2019 (this study), the age was determined using the age–depth model based on radiocarbon dates (Figures 2B and 3C; Table 1). In the next step, these dates were assigned to the corresponding pollen horizons (PCH) in the Koperowa’s diagram (Figure 3), and, based on these “datings,” a retrospective age–depth model for this depositional sequence was constructed (Figure 3D). The determination of the modeled age for the Koperowa’s sequence allowed for the development of a time scale for this profile (Figure 3A). The obtained RMA for the Koperowa’s profile also made it possible to compare both palynological profiles presented on the age scale (Figure 4A), as well as to determine the degree of compaction of individual sediment sequences and to compare the accumulation rate in both sequences (Figure 4C). The development of a retrospective age–depth model for the Koperowa’s pollen profile allowed for the presentation of this profile on an age scale and allowed for its direct comparison with the pollen profile developed in this study (Figure 4A).
(A) Comparison of percentage share of selected pollen taxa of both profiles (Koperowa, Reference Koperowa1962 and cored in 2019), presented in age scale: 1 – 2019 profile, 2 – Koperowa’s (1962) profile: the timescales (expressed in mod. cal BP) for both pollen diagrams were constructed based on the age–depth curves (Figure 3C–D); (B) the degree of peat compaction during the last 60 years, presented for each chronozones; (C) accumulation rate (AR) of the Grel raised bog deposits: 1 – for Koperowa profile; 2 – for compacted deposits of log cored in 2019 (K. Korzeń).

High-Resolution Absolute Age of Chronozones Boundaries
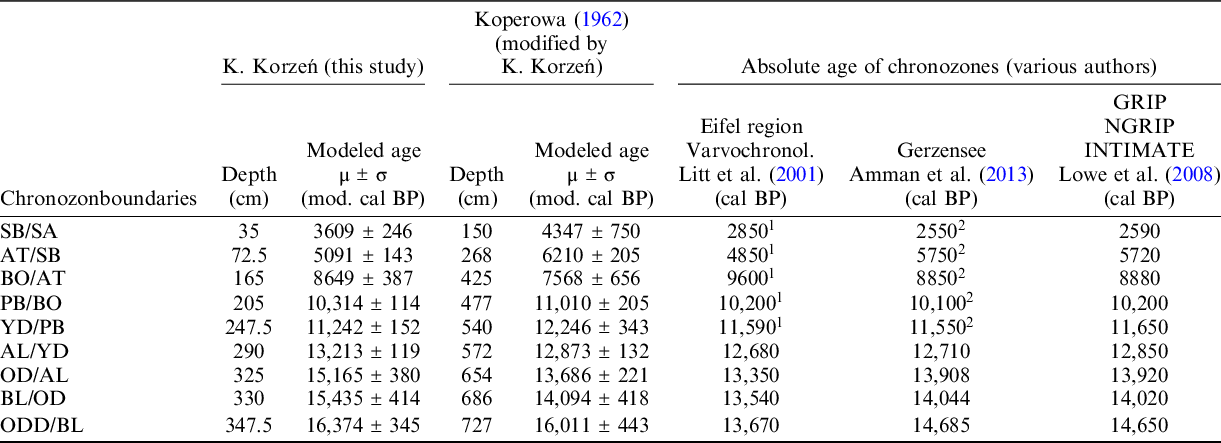
The modeled age constructed for both sequences (also RMA) shows some discrepancy in the absolute dating of chronozone boundaries (Table 3). Undoubtedly, the modeled age obtained for the Oldest Dryas/Bølling boundary is overestimated in both sequences (16.3 ka and 16.01 ka BP) (see Table 3). The modeled age of the Late Glacial chronozone boundaries in the palynological profile analyzed in 2019 (this study) seems to be somewhat overestimated (aged) in relation to the analogous age of these boundaries defined in the Late Glacial sequences of lacustrine sediments in the Eifel region in Germany (Litt et al. Reference Litt, Brauer, Goslar, Merkt, Bałaga, Mueller, Ralska-Jasiewiczowa, Stebich and Negendank2001) and Gerzensee Lake (Swiss Plateau) (Amman et al. Reference Amman, van Leeuwen, van der Knaap, Lischke, Heiri and Tinner2013), as well as in the Greenland ice core (Lowe et al. Reference Lowe, Rasmussen, Bjorck, Hoek, Steffensen, Walker and Yu2008) (Table 3). In turn, the absolute age of the Late Glacial chronozone boundaries obtained on the basis of the RMA for the Koperowa’s profile (1962) shows an agreement with the corresponding age of the chronozones limits mentioned above (Litt et al. Reference Litt, Brauer, Goslar, Merkt, Bałaga, Mueller, Ralska-Jasiewiczowa, Stebich and Negendank2001; Rasmussen et al. Reference Rasmussen, Andersen, Swensson, Steffensen, Vinther, Clausen, Siggaart, Johnsen, Larsen and Dahl-Jensen2006, Reference Rasmussen, Bigler, Blockey, Blunier, Buchardt, Clausen, Cvijanovis, Dahl-Jensen and Johnsen2014; Lowe et al. Reference Lowe, Rasmussen, Bjorck, Hoek, Steffensen, Walker and Yu2008; Amman et al. Reference Amman, van Leeuwen, van der Knaap, Lischke, Heiri and Tinner2013) (Table 3). The modeled absolute age of SB/SA boundary (3.6 and 4.3 ka mod. cal BP), which is overestimated, is very problematic (Table 3).
Absolute age of the chronozone boundaries in the Grel peatland deposits, on the basis of the age–depth model based on radiocarbon dates of the log cored in 2019 and retrospective age–depth model (for Koperowa’s 1962 log), versus absolute age of the Late Glacial–Holocene chronozone boundaries. The age of the Late Glacial chronozones after: Litt et al. (Reference Litt, Brauer, Goslar, Merkt, Bałaga, Mueller, Ralska-Jasiewiczowa, Stebich and Negendank2001); Amman et al. (Reference Amman, van Leeuwen, van der Knaap, Lischke, Heiri and Tinner2013), and Lowe et al. (Reference Lowe, Rasmussen, Bjorck, Hoek, Steffensen, Walker and Yu2008); Rasmussen et al. (Reference Rasmussen, Andersen, Swensson, Steffensen, Vinther, Clausen, Siggaart, Johnsen, Larsen and Dahl-Jensen2006, Reference Rasmussen, Bigler, Blockey, Blunier, Buchardt, Clausen, Cvijanovis, Dahl-Jensen and Johnsen2014)— converted from b2k. Absolute age of the Holocene chronozones: 1Starkel et al. (Reference Starkel, Michczyńska, Krąpiec, Margielewski, Nalepka and Pazdur2013); 2Mangerud et al. (Reference Mangerud, Andersen, Berglund and Donner1974) (calibrated by Walanus and Nalepka Reference Walanus and Nalepka2010).
Pollen Taxa Comparison
The presentation of selected taxa for both palynological profiles (Koperowa Reference Koperowa1962 and this study) on the age scale, indicates an amazingly high consistency in the course/shape of pollen percentage share curves on both diagrams (Figure 4A). This applies to thermophilous species (Corylus, Ulmus, Quercus, Tilia) as well as Abies and Fagus pollen occurring in the Late Glacial sedimentary sequences of both profiles, and even single episodes of increase in the share of Betula, Picea, Corylus, and Alnus pollen (Figure 4A). The comparative analysis of pollen in both diagrams shows a very high significance and accuracy of the dates obtained as a result of the RMA.
Changes in Sediment Thickness
Lithological and palynostratigraphic analysis of both profiles shows that the degree of compaction of sediments deposited in individual chronozones is uneven (Figure 4B). Thus, the sediments deposited during the Allerød Interstadial (minerogenic peat) decreased its volume in the last 60 years by 56%, while the reduction of minerogenic peat thickness deposited in Preboreal and Boreal Phases reaches only 16–20%, which was probably connected with the presence of inserts of mineral sediments in peat at this depth section (Figure 4B). Some of the horizons (YD) did not show any compaction (quite the opposite: an increase in volume). The thickness of the oldest (bottom) parts of the ombrogenic peat complex accumulated in the Atlantic Phase decreased by ca. 40%. At the sequence top, an increase in the reduction of a thickness of the ombrogenic peat is visible: in the deposits accumulated during the Subboreal Phase, the thickness of the peat was reduced by 62%. The greatest reduction in peat thickness (as much as 77%) occurs in the highest part of the ombrogenic peat sequence, accumulated in the Subatlantic Phase (Figure 4B).
Accumulation Rate (AR)
The accumulation rate of sediments calculated for the depositional sequence cored in 2019 varies from 0.1 to 0.53 mm/year (Figure 4C). The maximum AR of minerogenic peat (0.53 mm/year) is typical for the average AR in minerogenic mires (0.51 mm/year—Żurek Reference Żurek1986; Margielewski Reference Margielewski2006), whereas an accumulation rate of 0.2 mm/year is rarely recorded (Rydin and Jeglum Reference Rydin and Jeglum2013; Stivrins et al. Reference Stivrins, Ozola, Gałka, Kuske, Alliksaar, Andersen, Lamentowicz, Wulf and Reitalu2017). In turn, the AR of ombrogenic peat (0.1–0.4 mm/year) is extremely low and rather uncommon in the European peatlands (Rydin and Jeglum Reference Rydin and Jeglum2013; Stivrins et al Reference Stivrins, Ozola, Gałka, Kuske, Alliksaar, Andersen, Lamentowicz, Wulf and Reitalu2017), which points at its significant underestimation. The AR calculated for the Koperowa’s (1962) depositional sequence on the basis of the RMA is more realistic ranging for minerogenic peat: 0.25-0.7 mm/year (max. 1.5 mm/year), and for ombrogenic peat varying from 0.4 to max. 2.0 mm/year (Figure 4C).
DISCUSSION
The analysis of maps of the Austro-Hungarian Empire (to which the analyzed area belonged before 1918) shows that the Grel peatland was exploited as early as the 19th century (Figure 1C). The peat extraction was continued until the 1960s successively along the exploitation scarp or in the form of small, point excavations (Koperowa Reference Koperowa1962) and was so intense that, according to some contemporary publications, the peatland was considered to be completely depleted (Łajczak Reference Łajczak2009). Fortunately, the remnants of the dome (2500 m2—1.2% of recent peat bog area) with a complete depositional sequence have preserved to the present day, although the sediments have been significantly (almost twice) compacted during the last 60 years. During this time, the peat dome was lowered (Figures 2A and 3A–B).
Such a significant compaction of peat deposits (from 7.5 m to 3.9 m) took place owing to the strong drainage of the peatland with numerous drainage ditches (preserved to the present day), combined with a significant incision of the Czarny Dunajec River into the bedrock during last 60 years (Zawiejska and Wyżga Reference Zawiejska and Wyżga2010). The drainage works and channelisation process of the riverbed in 1950–1970 (Figure 1C–D) generally resulted in a lowering of the groundwater table by ca. 2 m. However, in the upper sections of this river the incision has reached even 3.5 m in the last few decades as a result of gravel extraction from the riverbed (Krzemień Reference Krzemień2003; Zawiejska and Wyżga Reference Zawiejska and Wyżga2010) (Figure 1C–D). The drastic drainage of peatland and associated overdrying of the peat dome remnants caused not only humification (mineralisation) but also severe peat compaction. Currently, a significant part of organic deposits is strongly humified and decomposed: peat decomposition rate reaches here 65%. This applies to both minerogenic and, particularly, to ombrogenic peat—which contemporarily forms a lowered dome (Figure 2A). The significant decomposition of the peat during last 60 years is confirmed by the analyzes of organic sediments made by Koperowa (Reference Koperowa1962; Figure 3A) and the current peat studies carried out by A. Obidowicz (this study), which indicate the present-day predominance of the strongly decomposed peat in the sequence (Figure 2A).
Such a significant reduction in peat thickness may be caused by the desiccation of the sediments, as well as its partial disappearance in the highest part of peat sequence due to weathering, bacterial activity, humification and mineralization. It is also important that the compaction of organic sediments did not occur proportionally in the entire sequence: it differs depending on the type of peat and differs within individual peat sequences accumulated in individual chronozones (Figure 4B). The results of our research are important because so far it has been regarded that peat compaction increases almost linearly, down to the water table in peatland (Hansson et al. Reference Hansson, Rydberg, Kylander, Gallagher and Bindler2013). Therefore, it is even difficult to estimate the original AR of these deposits, considering the fact that already 60 years ago (when Koperowa was working on Grel’s sedimentary profile), the bog was significantly changed by human activity, e.g., exploitation (Figure 1C). The AR calculated for the current state of fen deposits is strongly underestimated, while the one reconstructed for the Koperowa’s profile based on the RMA is close to the average rate of accumulation of peatland deposits in Europe (Figure 4C) (see Stivrins et al. Reference Stivrins, Ozola, Gałka, Kuske, Alliksaar, Andersen, Lamentowicz, Wulf and Reitalu2017). Considering the fact that the AR is an important coefficient that may be used, for example, to construct a correct age–depth model (see: Michczyński et al. Reference Michczyński, Kołaczek, Margielewski, Michczyńska and Obidowicz2013), our analysis shows that a significant error may be made when the accumulation rate is determined on the basis of depositional sequences analyzed in peatlands drained and desiccated due to e.g., exploitation or drainage works.
Generally, a very high consistency in the shape of palynological curves of selected taxa for both pollen profiles presented in the age scale confirms a very high significance and accuracy of the dates elaborated on the basis of the RMA (Figure 4A).
The absolute age of the Late Glacial chronozones boundaries in both palynological profiles seems overestimated in relation to the absolute age of the chronozone boundaries of a regional or the Northern Hemisphere scale, e.g., recorded in European lacustrine deposits (Litt et al Reference Litt, Brauer, Goslar, Merkt, Bałaga, Mueller, Ralska-Jasiewiczowa, Stebich and Negendank2001; Amman et al Reference Amman, van Leeuwen, van der Knaap, Lischke, Heiri and Tinner2013), or Greenland ice cores (Lowe et al. Reference Lowe, Rasmussen, Bjorck, Hoek, Steffensen, Walker and Yu2008; Rasmussen et al. Reference Rasmussen, Bigler, Blockey, Blunier, Buchardt, Clausen, Cvijanovis, Dahl-Jensen and Johnsen2014) (Table 3). These inconsistencies may be related to the regional (or even local) nature of vegetational history (changes) in the Orawa-Nowy Targ Basin, especially if it is taken into account that this area is considered to be the Polish Cold Pole. It is indicated i.e., by Rubus chamemorus (arctic species) growing to this day in the ONTB peatlands (Koczur Reference Koczur2008), and whose traces of occurrence (seeds) in Polish territory were found only in the Late Glacial sediments in the Carpathian peatlands (Margielewski et al. Reference Margielewski, Obidowicz and Pelc2003). So far similar problems connected with overestimation (aged) of absolute age of the Late Glacial chronozones boundaries, were observed in the Late Glacial depositional sequences in the Polish Carpathians (Margielewski Reference Margielewski2006; Margielewski et al. Reference Margielewski, Obidowicz, Zernitskaya and Korzeń2022).
Such discrepancies in determining the absolute age of the boundaries of the Late Glacial chronozones, their duration and even their number, are usually of a regional nature. The boundary of the Oldest Dryas/Bølling chronozones in the Greenland ice core and lacustrine sediments in the Lake Gerzensee sediments in Switzerland has been absolute dated to around 14,650 cal BP (e.g., Rasmussen et al. Reference Rasmussen, Andersen, Swensson, Steffensen, Vinther, Clausen, Siggaart, Johnsen, Larsen and Dahl-Jensen2006, Reference Rasmussen, Bigler, Blockey, Blunier, Buchardt, Clausen, Cvijanovis, Dahl-Jensen and Johnsen2014; Lowe et al. Reference Lowe, Rasmussen, Bjorck, Hoek, Steffensen, Walker and Yu2008; Amman et al. Reference Amman, van Leeuwen, van der Knaap, Lischke, Heiri and Tinner2013), whereas in lacustrine (laminated) sediments in the Eifel region in Germany (using also varvochronology) has been dated at 13,670 cal BP (Brauer et al. Reference Brauer, Litt, Negendank and Zolitschka2001; Litt et al. Reference Litt, Brauer, Goslar, Merkt, Bałaga, Mueller, Ralska-Jasiewiczowa, Stebich and Negendank2001). The boundary of the Bølling/Older Dryas chronozones in the Greenland ice core and lacustrine sediments of the Lake Gerzensee has been absolute dated to around ca 14,050 cal BP (Rasmussen et al. Reference Rasmussen, Andersen, Swensson, Steffensen, Vinther, Clausen, Siggaart, Johnsen, Larsen and Dahl-Jensen2006, Reference Rasmussen, Bigler, Blockey, Blunier, Buchardt, Clausen, Cvijanovis, Dahl-Jensen and Johnsen2014; Amman et al. Reference Amman, van Leeuwen, van der Knaap, Lischke, Heiri and Tinner2013), whereas in lacustrine sediments of the Eifel region in Germany, this boundary was dated at 13,540 cal BP (Brauer et al. Reference Brauer, Litt, Negendank and Zolitschka2001; Litt et al. Reference Litt, Brauer, Goslar, Merkt, Bałaga, Mueller, Ralska-Jasiewiczowa, Stebich and Negendank2001) (Table 3). The regional character also has a distinctness record/clarity of the Late Glacial chronozones. In the Grel peatland, the short-term cooling of the Older Dryas Stadial was clearly marked in the pollen record, similarly to other Late-Glacial sites of the Polish Carpathians and their foreland (Koperowa Reference Koperowa1962; Mamakowa Reference Mamakowa1962; Margielewski et al. Reference Margielewski, Obidowicz, Zernitskaya and Korzeń2022). The Older Dryas Stadial record in deposits of the Lake Gerzensee is similarly clear (Amman et al. Reference Amman, van Leeuwen, van der Knaap, Lischke, Heiri and Tinner2013). However, in the Greenland ice core, the record of this short-term cooling of the climate is less clear-cut (Rasmussen et al. Reference Rasmussen, Andersen, Swensson, Steffensen, Vinther, Clausen, Siggaart, Johnsen, Larsen and Dahl-Jensen2006, Reference Rasmussen, Bigler, Blockey, Blunier, Buchardt, Clausen, Cvijanovis, Dahl-Jensen and Johnsen2014). Meanwhile, in the European Alps, the Older Dryas chronozone was abandoned (Welten Reference Welten1982), and in many works the Bølling and Allerød interstadials are treated jointly as the Bølling-Allerød interstadial complex (e.g., Shakun and Carlson Reference Shakun and Carlson2010; Su et al. Reference Su, Ingersoll and He2016).
Thus, the overestimation (overaging) of the absolute age of the Late Glacial chronozones boundaries in Grel raised bog may be the result of the more regional record of climate change during the Late Vistulian. On the other hand, it cannot be ruled out that the overestimation of the dates can also be connected with the permafrost influence, which during the disappearance gives off the carbon dioxide absorbed several ten thousand years ago. This dead carbon may cause overestimation of radiocarbon dates due to the specific type of reservoir effect (Žak et al. Reference Žák, Mikšíková, Hercman, Melková and Kadlec2003; Urban et al. Reference Urban, Margielewski, Hercman, Žák, Zernitska, Pawlak and Schejbal-Chwastek2015).
Strongly disturbed absolute chronology of the Late Holocene sediments in the Grel raised bog (Figure 3C–D; Table 3) may be related to the degradation of organic sediments. In the upper parts, the peat is degraded due to weathering, decomposition, humification and mineralization of organic matter. Hence, the sediment at a depth of 30–35 cm was dated at around 3000 years cal BP (Figure 1; Table 1).
CONCLUSIONS
The drainage of the Grel peatland caused by the peat extraction, melioration and lowering of the groundwater table related to the nearby Dunajec River by 2–3 m in the last 60 years, resulted in a strong compaction of organic sediments in the peatland. The depositional sequence thickness has decreased twice from 7.4 m in 1962, to 3.9 m in 2019. The comparison of lithological and palynological profiles elaborated in 1962 and in 2019 shows, that despite the sediment’s compression, the depositional sequence remained complete, and its stratification (from the Oldest Dryas Stadial until today) has been kept unchanged.
Based on 24 radiocarbon dates an age–depth model was constructed for the compacted depositional sequence. The significant similarity between two palynological profiles (from 1962 and 2019) and finding correlated pollen levels in both profiles (partly on the basis of PCA analysis) allowed for the elaboration of a retrospective age–depth model for the sequence developed in 1962. The dating results and pollen analyses show that the compression of organic sediments deposited during the individual chronozones was very diverse and ranged from 77% to 16%. The accumulation rate of deposits calculated for the compacted sequence is in some chronozones significantly smaller than the accumulation rate derived for sequence from 1962, even three times smaller. There may also be a problem with identifying hiatuses of horizons of peat humification.
Palaeoenvironmental reconstructions based on the analysis of peatland deposits (especially exploited and drained peatlands) may be burdened with significant errors related to the determination of the actual rate of accumulation, the thickness of sediments deposited during individual chronozones, the presence or absence of hiatuses in the sediments, or occurrence of horizons of peat humification. Human activity can cause changes not only in the highest parts of peat bog sequences (cases the most often described), but can also affect them in the entire length
ACKNOWLEDGMENTS
This study was supported with funds from the Polish Ministry of Science, grant No. N N306 034040 (2011–2015) and with the National Science Centre, Poland grant No. 2017/25/B/ST10/02439 (2018–2022). The authors wish to express their gratitude to late Professor Kazimierz Szczepanek (Jagiellonian University, Kraków) for his help with field works and valuable scientific discussion.


 Open access