

1. Introduction
Many countries and regions around the world face challenges such as insufficient economic growth, serious environmental problems, and social governance contradictions. Theory and practice show that addressing these problems requires not only businesses and other microeconomic entities to embrace the concept of sustainable development by integrating environment, society, and governance, but also strong macroeconomic policies and enhanced international cooperation. Trade is an important avenue for international exchange and cooperation. Wu et al. (Reference Wu, Chen, Han and Wu2022) found that through Environmental, Social, and Governance (ESG) practices, firms can develop green technologies, enhance brand reputation, build competitive export advantages, and increase export intensity. Similarly, Teplova et al. (Reference Teplova, Sokolova, Gubareva and Sukhikh2022) show that compliance with ESG standards helps small- and medium-sized enterprises to enter foreign markets while improving export intensity. Therefore, this paper uses the gaps in ESG performance between the exporting country and its destination to describe the comparative advantage that can serve as a catalyst for export growth. Since its introduction by the United Nations in 2004, after 20 years, the concept of ESG has received widespread attention, driven by the growing demand for ESG information in capital markets and active promotion by international organizations. As a result, more companies are now focusing on their ESG status and integrating ESG practices into governance and investment decisions.
At the micro level, scholars have undertaken a considerable amount of research on why companies should practice ESG and the effectiveness of ESG practices. Research shows that macroeconomic determinants such as economic prosperity (Cai et al., Reference Cai, Pan and Statman2016); political and legal conditions (Baldini et al., Reference Baldini, Maso, Liberatore, Mazzi and Terzani2018); internal governance factors such as firm size (Drempetic et al., Reference Drempetic, Klein and Zwergel2020); decision-making processes (Bourveau et al., Reference Bourveau, Brochet and Garel2022); Chief Executive Officer (CEO) characteristics (McBrayer, Reference McBrayer2018); board attributes (De Masi et al., Reference De Masi, Słomka‐Gołębiowska, Becagli and Paci2021); and external governance factors, including government ownership (McGuinness et al., Reference McGuinness, Vieito and Wang2017); foreign ownership (Yu and Van Luu, Reference Yu and Van Luu2021); and institutional investor ownership – all influence ESG practices to different degrees and in different directions (Nguyen et al., 2017). At the same time, ESG practices can reduce corporate risks (Galletta and Mazzu, 2023), alleviate corporate financing constraints (Eliwa et al., Reference Eliwa, Aboud and Saleh2021), influence firm value (Yu and Van Luu, Reference Yu and Van Luu2021), and shape competitive advantages (Gillan et al., Reference Gillan, Koch and Starks2021). The discussion on ESG in macroeconomics is still in its infancy, but some researchers have conducted theoretical and empirical analyses of national ESG performance and its economic consequences. Jiang et al. (Reference Jiang, Feng and Yang2022) constructed an index system of national ESG performance based on the World Bank database for 171 countries. Long et al. (Reference Long, Feng and Chang2023) found that improving national ESG performance stimulates green innovation; Niu (Reference Niu2024) analyzed the motives for improving national ESG performance and found that increased government spending on environmental protection stimulates green innovation, which would improve national ESG performance.
Although scholars have extensively analyzed ESG and demonstrated its economic benefits, the concept of ESG itself remains controversial, with significant doubts and criticisms. The most prominent critique questions the rationality of ESG, arguing that ESG deviates from the original purpose of corporations and violates the principles of fiduciary duty, while it is politicized as ‘woke capitalism’ (Rhodes, Reference Rhodes2021). Another critique asserts that ESG fails to meet the value expectations of companies and individual investors and does not effectively promote social progress or sustainability (Pucker and King, Reference Pucker and King2022). A third critique points to biases in ESG ratings and disclosures, highlighting inconsistencies and disorder within the industry. In some cases, different agencies even assign completely opposite ratings to the same firm (Gibson Brandon et al., Reference Gibson Brandon, Krueger and Schmidt2021). Shifting ESG research to a macro perspective is a viable approach that not only provides new evidence on the economic impact of ESG, but also mitigates to some extent the controversy arising from the partial deviation of the ESG concept from the profit-driven nature of firms.Footnote 1 This paper reiterates the importance of the concept of ESG by exploring how the ESG performance gap between exporting countries and destination countries influences green exports through the lens of comparative advantage in international trade.Footnote 2
Green products are widely considered as a tool to reduce environmental degradation. Paramati et al. (Reference Paramati, Mo and Huang2021) define green products as those that improve energy efficiency and reduce environmental damage from an energy perspective. The US Department of Labor, however, broadly includes all goods that are environmentally beneficial or conserve natural resources. These varying definitions have led to the creation of numerous ‘green product lists’ around the world, such as the APEC and WTO lists. Although these lists are not universally recognized due to geopolitical factors, the positive negotiating efforts highlight the global acceptance and respect for green product production and trade. Green exports reflect the exporting country’s commitment to sustainable development and environmental management, indicate whether a country has a competitive advantage in green products, and provide valuable data for analyzing how national ESG performance affects international trade. Investigating this impact not only measures the economic benefits of ESG performance in macroeconomic terms, but also proves the effectiveness of ESG principles, thus providing support to ESG advocates in the tide of ESG opposition. Drawing on the theory of comparative advantage, this study argues that the ESG performance gap between countries can be viewed as a comparative advantage in green products.Footnote 3 A higher ESG performance can be seen as a comparative advantage for a country trading in green products with countries that have lower ESG performance, thus influencing green exports.
The main innovations of this paper are as follows: (1) It enriches the literature on the macroeconomic impact of national ESG performance. (2) We merge the global ESG index of Jiang et al. (Reference Jiang, Feng and Yang2022) with green trade data from the CPEII-BACI database, creating a comprehensive panel dataset covering 121 countries and 5000 product categories. (3) We find that the ESG performance gap plays a critical role in determining green exports. Specifically, a positive ESG performance gap (i.e., the exporting country has higher ESG performance than the destination country) stimulates green exports by widening the green innovation gap and is moderated by environmental regulations in the destination country. (4) Conversely, a negative ESG gap shows no significant linear effect, but, as this gap narrows, the impact on green exports follows a nonlinear relationship. (5) This study provides valuable insights for policymakers seeking to harmonize ESG standards and promote sustainable trade practices. The following sections are organized as follows: Section 2 introduces the theoretical framework and formulates the hypotheses. Section 3 outlines the data sources and econometric methods used in the analysis. Section 4 discusses the empirical results, examines the nonlinear effects when the ESG gap is negative, and includes a discussion. Finally, Section 5 provides concluding remarks and policy implications.
2. Literature Review, Theoretical Framework, and Hypothesis
Emphasizing environmental protection has become an important competitive strategy, and consumers are increasingly concerned about the environmental impact of their consumption habits (Lin and Niu, Reference Lin and Niu2018). Based on the theory of consumer behavior and comparative advantage, we establish a theoretical framework that ESG performance gap affects green exports. Consumers concerned about green issues tend to demand environmentally friendly products for their psychological trust and self-satisfaction (Koo and Chung, Reference Koo and Chung2014), and are willing to pay a higher green premium for them, especially among Generation Z. Berger (Reference Berger2019) proved that signaling makes consumers more willing to buy green products – signaling theory shows that buying green products reflects social status and pro-social values. Gomes et al. (Reference Gomes, Lopes and Nogueira2023) believed that perceived green quality can provide consumers with more information about the quality of green products. For companies, ESG practices can enhance reputation and attract consumers who are concerned about ESG issues, and lead to higher sales and increased export intensity. Compliance with ESG standards helps small and medium-sized enterprises expand into overseas markets and increase export intensity (Teplova et al., Reference Teplova, Sokolova, Gubareva and Sukhikh2022). There is sufficient evidence in the microeconomy to show that as sustainability principles become more popular, high ESG performance of firms can convey information to consumers to help them make decisions to buy an increased number of green products. From a macro perspective, the global trade of green products has shown an increasing trend in recent years, increasing from USD 906.3 billion in 2007 to USD 1,574.2 billion in 2018, with an average growth rate of 3.6%, and the share of green exports has increased from 8.0% to 9.8%.Footnote 4 Just as ESG can build social capital and trust, signal product quality, and improve reputation for firms (Quang Trinh et al., Reference Quang Trinh, Cao, Li and Elnahass2023; Meng et al., Reference Meng, Yahya, Ashhari and Yu2023), we expect that better ESG performance at the national level can provide a comparative advantage for a country in the global market for green products. Countries with higher ESG performance can signal the quality of their green products to potential importers, who may prefer to import from such countries to demonstrate their commitment to environmental responsibility and improve their own ESG performance.
Accordingly, we put forward the first basic hypothesis:
H1: When the ESG performance gap between the exporting country and the destination country is positive, the larger the gap, the more green products the exporting country exports to the destination country; otherwise, no significant linear relationship is observed.
2.1 ESG Performance, Environmental Regulation, and Green Exports
Since the 1970s, environmental regulation has increasingly been incorporated into traditional international trade theory to assess its impact on comparative advantage. In general, when a country imposes stricter regulations on its pollution-intensive industries than other countries, it leads to higher costs for these industries. However, there is an ongoing debate about whether environmental regulation affects a country’s exports. Tobey (Reference Tobey2001) suggested that while stringent environmental regulations increase firms’ costs, this increase is not sufficient to significantly affect the comparative advantage of pollution-intensive products or their exports. A similar conclusion was reached in a study by Jaffe et al. (Reference Jaffe, Peterson, Portney and Stavins1995) that focused on the United States. However, Hering and Poncet (Reference Hering and Poncet2014) and other studies suggest that stringent environmental regulations negatively affect the comparative advantages of pollution-intensive products in the international market. On the contrary, Porter and Linde (Reference Porter and Linde1995) found that stricter environmental regulations could promote technological progress and thus increase the long-term comparative advantage of the relevant industries. Martinez-Zarzoso et al. (2019) argued that such regulations could make production processes cleaner and improve energy efficiency.
We argue that while strict environmental regulations undeniably raise the costs of pollution-intensive industries, they also provide incentives for their green transformation, stimulate green innovation across industries, and promote the production of green products. In addition, strong environmental policies signal a nation’s commitment to sustainable development and convey the quality of its green products to potential international customers. For exporting countries with high ESG performance, strong environmental regulation can help shape their comparative advantage in green products; for destination countries with low ESG performance, strong environmental regulation can mitigate their comparative disadvantage in green products. Accordingly, when the ESG performance of the exporting country exceeds that of the destination country, we propose two hypotheses for the environmental regulation of the exporting country and the destination country, respectively:
H2a: Stronger environmental regulations in the exporting country can enhance its comparative advantage in green products to the destination country; that is, amplify the positive effect of ESG gap on green exports.
H2b: Stronger environmental regulations in the importing country can mitigate its comparative disadvantage in green products compared to the exporting country; that is, reduce the green export of the exporting country due to its high ESG performance.
2.2 ESG Performance, Green Innovation, and Green Exports
Empirical evidence suggests that ESG practices enhance firm innovation performance (Li et al., Reference Li, Ba, Ma, Xu, Huang and Huang2023). Studies emphasize the lasting influence of ESG on long-term business operations and show that ESG performance promotes corporate innovation through multiple mechanisms, including improving financial performance, expanding internationalization, reducing agency problems, improving information disclosure, and strengthening internal corporate governance (Wu et al., Reference Wu, Yi, Hu, Lyulyov and Pimonenko2024). In the context of green innovation, numerous studies have provided micro-level evidence supporting the positive relationship between ESG performance and green innovation (Fu et al., Reference Fu, Zhao and Chang2023). Extending this argument to a macroeconomic perspective, environmental, social, and governance factors collectively shape a country’s green innovation capacity, with the environmental dimension driving the green transition and the social and governance dimensions fostering innovation.
Three dimensions of ESG have been linked to national green innovation capacity through various policy and institutional mechanisms. For the environmental dimension, studies suggest that countries with strong environmental commitments often implement policies that support clean technologies, including environmental regulations and market-based mechanisms such as carbon pricing, emissions trading, and renewable energy subsidies (Yang et al., Reference Yang, Feng, Zhao and Chang2022). It is suggested that investments in environmental infrastructure, such as clean energy grids and circular economy initiatives, provide a necessary foundation for sustainable production and technology development, fostering an ecosystem conducive to long-term green innovation (Lee and Kim, Reference Lee and Kim2022). Beyond environmental policies, social and governance dimensions also contribute to a nation’s green innovation. Human capital development and institutional quality are widely recognized as critical drivers of technological progress and innovation (Acemoglu et al., 2012). Research has shown that investments in STEM education, environmental literacy, and workforce retraining enhance a country’s capacity for green innovation by cultivating a skilled workforce (Zhang, 2024). In addition, robust governance structures, including intellectual property protection, green financing incentives, and public–private partnerships, are essential for reducing the risks associated with costly research and development and promoting sustainable technological progress (Chon et al., 2018). Countries with strong institutional frameworks are also more likely to attract foreign investment in green industries, facilitating the commercialization and diffusion of sustainable technologies (Suzuki, Reference Suzuki2015). Long et al. (Reference Long, Feng and Chang2023) analyzed the impact of countries’ ESG performance on green innovation and found that, similar to firms, countries’ improved ESG performance also led to enhanced green innovation. This finding provides empirical support for considering the national green innovation capacity gap as an important mediating channel through which ESG gaps affect green exports.
Just as technology is the basis of a country’s advantage in trade, green innovation capacity is a critical factor in shaping a country’s comparative advantage in green exports. Fagerberg (Reference Fagerberg1988) found that a country’s ability to innovate is more important than traditional factors such as price and cost in maintaining international competitiveness. Greenhalgh (Reference Greenhalgh1990) concluded that continuous innovation and product upgrading are essential to maintain the UK’s international market share. Regarding green innovation, Chai (Reference Chai2023) demonstrated that the implementation of green innovation positively affects export quality; Al-Shboul (Reference Al-Shboul2023) explored the positive correlation between firms’ digital technology capabilities and comparative advantage, using green product and process innovation as key intermediary mechanisms; Bintara et al. (Reference Bintara, Yadiati, Zarkasyi and Tanzil2023) proposed, through a systematic literature review, that green innovation enhances competitive advantage and market position. Although these studies primarily focus on the micro level, it is reasonable to extend this perspective to the macroeconomic level and postulate that green innovations also shape a nation’s comparative advantage in green products. Thus, based on the theoretical and empirical foundation, we propose the following hypothesis:
H3: The green innovation capacity gap serves as a mediating channel through which the ESG performance gap influences green exports.
3. Empirical Strategy and Variables
3.1 Model Specification
In international trade research, the gravity model is commonly used to study the factors influencing bilateral trade volume. Tinbergen (Reference Tinbergen1962) first applied the gravity model, which is derived from the law of gravity in physics, to economic research in international trade. Building on this, Anderson and Van Wincoop (Reference Anderson and Van Wincoop2003), Anderson et al. (Reference Anderson, Vesselovsky and Yotov2013), Bergstrand et al. (Reference Bergstrand, Egger and Larch2013), and Novy (Reference Novy2013) have transformed the basic gravity model based on their different research objectives. Such research has significant reference value for our study. However, since our study aims to investigate whether ESG gaps between countries can form comparative advantages in green product exports, we have chosen, not green exports per se, but their share in total exports as our dependent variable. Consequently, we cannot directly apply the gravity model. Nevertheless, we will consider the bilateral variables included in the gravity model that influence bilateral trade as control variables in our regression model. We define the export behavior of an exporter to a particular destination as a trade flow. Based on theoretical analysis, high ESG performance signals the quality of green products, which represents a comparative advantage. In order to accurately describe the trade effect resulting from this comparative advantage and to avoid bias due to variations in trade size, we use the ratio of green product exports from the exporting country to each destination country, relative to total exports to that specific destination, as our proxy variable for measuring green product exports, which serves as our dependent variable in this study. We also use a panel data regression model with multi-dimensional fixed effects for conducting regression analysis and establish the following equation :
 \begin{equation}\begin{array}{*{20}{c}}
{GreenExpor{t_{ijt}} = {\alpha _0} + {\alpha _1}ESGga{p_{ijt}} + \beta {\text{ }}Controls + {\theta _t} + {\theta _i} + {\theta _j} + {\varepsilon _{ijt}}}
\end{array}\end{equation}
\begin{equation}\begin{array}{*{20}{c}}
{GreenExpor{t_{ijt}} = {\alpha _0} + {\alpha _1}ESGga{p_{ijt}} + \beta {\text{ }}Controls + {\theta _t} + {\theta _i} + {\theta _j} + {\varepsilon _{ijt}}}
\end{array}\end{equation} In this equation,  ${\alpha _0}$ is a constant term, ${\alpha _1}$ is the parameter to be estimated of the main explanatory variable, $\beta $ is the parameter vector to be estimated of the control variables. $GreenExpor{t_{ijt}}$ represents the proportion of green products exported from country i to country j in total products in year t. $Controls$ represents other control variables that can affect green export behavior. ${\theta _t}$, and ${\theta _i}$ and ${\theta _j}$ account for time and country fixed effects, respectively. ${\varepsilon _{ijt}}$ represents the error term.
3.2 Variables Definition and Data Sources
3.2.1 Explained Variable
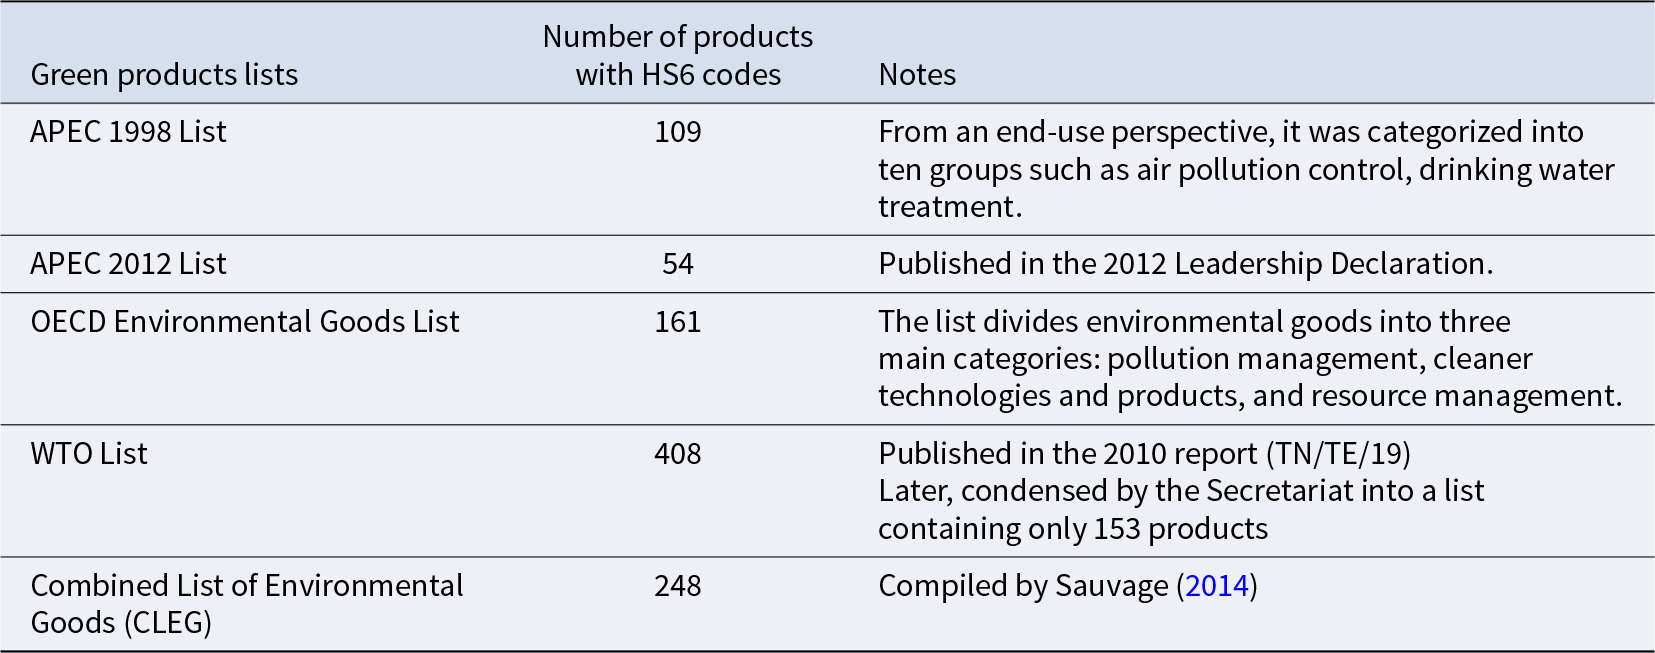
In this study, the ratio of green product exports (measured by trade volume) from the exporting country to its destination was selected as a proxy for green exports. Numerous researchers have debated the definition of ‘green’ (e.g. Kleiner, Reference Kleiner1991). The inherent complexity in defining ‘green products’ naturally leads to ambiguity. Reinhardt (Reference Reinhardt1998) posited that green products provide higher environmental benefits or lower environmental costs, while Peattie (Reference Peattie1995) emphasized their role in improving environmental and social performance. Ottman et al. (Reference Ottman, Stafford and Hartman2008) argued that green products should conserve energy and resources, reduce or eliminate toxic substances, pollutants or waste materials. De Masi and Ribeiro (2017) pointed out that green products should relieve customers from environmental responsibilities without compromising product quality. After a systematic literature review, Sdrolia and Zarotiadis (Reference Sdrolia and Zarotiadis2019) proposed a new definition that a green product can minimize the environmental impact throughout its life cycle under the current state of technology. Different organizations have different definitions and classifications of environmental products, resulting in different lists of green products, as detailed in Table 1. To ensure research accountability, we use the Combined List of Environmental Goods (CLEG) compiled by Sauvage (Reference Sauvage2014), which was carefully selected and combined after comparing different lists. We transform the products in the CLEG into standardized HS6-digit code products using the code comparison table provided by the United Nations Statistical Division. We then merge CLEG products with world trade data from the CEPII-BACI database to obtain green export data. The ratio of green exports to total exports from each exporting country to its destination is then calculated as the dependent variable.Footnote 5
Chracteristics of different green products lists
Three common indices for measuring an industry’s comparative advantage in trade are ‘RCA’, ‘NEX’, and ‘NERCA’.Footnote 6 These methods can be used for the computation of a particular country and its industry’s global comparative advantage. However, since our research focuses on trade flows between exporting and destination countries, the fundamental principle of comparative advantage theory suggests that a country with a comparative advantage in green products should export a higher proportion of such products. In other words, the share of green products in the total exports to the destination country should be relatively high. Therefore, we choose the ratio of green exports to total exports to destination countries in the trade flow as the proxy variable for green export, namely:
 \begin{equation}\begin{array}{*{20}{c}}
{GreenExpor{t_{ijt}} = \frac{{{X_{ij,green,t}}}}{{\mathop \sum {X_{ijt}}}}}
\end{array}\end{equation}
\begin{equation}\begin{array}{*{20}{c}}
{GreenExpor{t_{ijt}} = \frac{{{X_{ij,green,t}}}}{{\mathop \sum {X_{ijt}}}}}
\end{array}\end{equation} In equation (2), 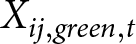 ${X_{ij,green,t}}$ represents the total export of green products of exporter i to destination j in year t, and $\mathop \sum \nolimits^ {X_{ijt}}$ represents the total export of exporter i to destination j in year t.
3.2.2 Explanatory Variables
Currently, ESG systems are generally based on firm-level indicators, and research on national ESG is usually limited to theory construction and policy analysis. Jiang et al. (Reference Jiang, Feng and Yang2022) used World Bank data to construct a national ESG indicator system, including 39 indicators across the environmental, social, and governance pillars, and used the entropy weighting method to evaluate the national ESG performance of 121 countries from 1990 to 2021. This index takes into account factors such as natural resource endowments, technological innovation, human capital, economic development, and regulatory frameworks. We therefore use this comprehensive national ESG index to calculate the ESG gap between the exporting and receiving countries in each trade flow.
Although we do not use the gravity model directly, its theoretical framework informs our selection of control variables. To ensure robust estimation and mitigate potential omitted variable bias, we include five control variables for both exporting and destination countries, for a total of 10 control variables in the model:
GDP (economic development). The level of economic development is critical for both the supply and demand of green products. Higher GDP per capita in exporting countries enhances technological capacity and green production, while in importing countries it reflects higher purchasing power and environmental awareness, which promotes demand for green goods (Grossman and Krueger, Reference Grossman and Krueger1995).
Urban (urbanization rate). Urbanization rates influence industrial structure and environmental regulation. Higher urbanization in exporters supports advanced green industries, while in importers it indicates higher demand for environmentally friendly products (Ahmad et al., Reference Ahmad, Jiang, Murshed, Shehzad, Akram, Cui and Khan2021).
CO₂ (carbon emissions). Carbon emissions serve as a proxy for the environmental externalities associated with economic activities. For exporters, high emissions may drive clean technology innovation or indicate pollution-intensive industries, while for importers, strict environmental policies may increase the demand for green imports(Xia et al., Reference Xia, Apergis, Bashir, Ghosh, Doğan and Shahzad2022).
Exchange rate. Exchange rate fluctuations affect trade flows by changing relative prices (McKenzie, Reference McKenzie1999). Depreciation for exporters increases the competitiveness of green exports, while appreciation for importers increases purchasing power.
Trade openness. Trade openness, measured as the ratio of merchandise trade to GDP, captures a country’s economic integration and dependence on global markets (Edwards, Reference Edwards1993). Open economies are more aligned with international environmental standards, which affects both the supply and demand of green exports.
In addition, to account for individual differences between exporting and importing countries, as well as year-to-year variation that remains constant across individuals, we include multidimensional fixed effects for exporting country, destination country, and year in the model. Table 2 details each variable and its data source.
Variable definitions and sources
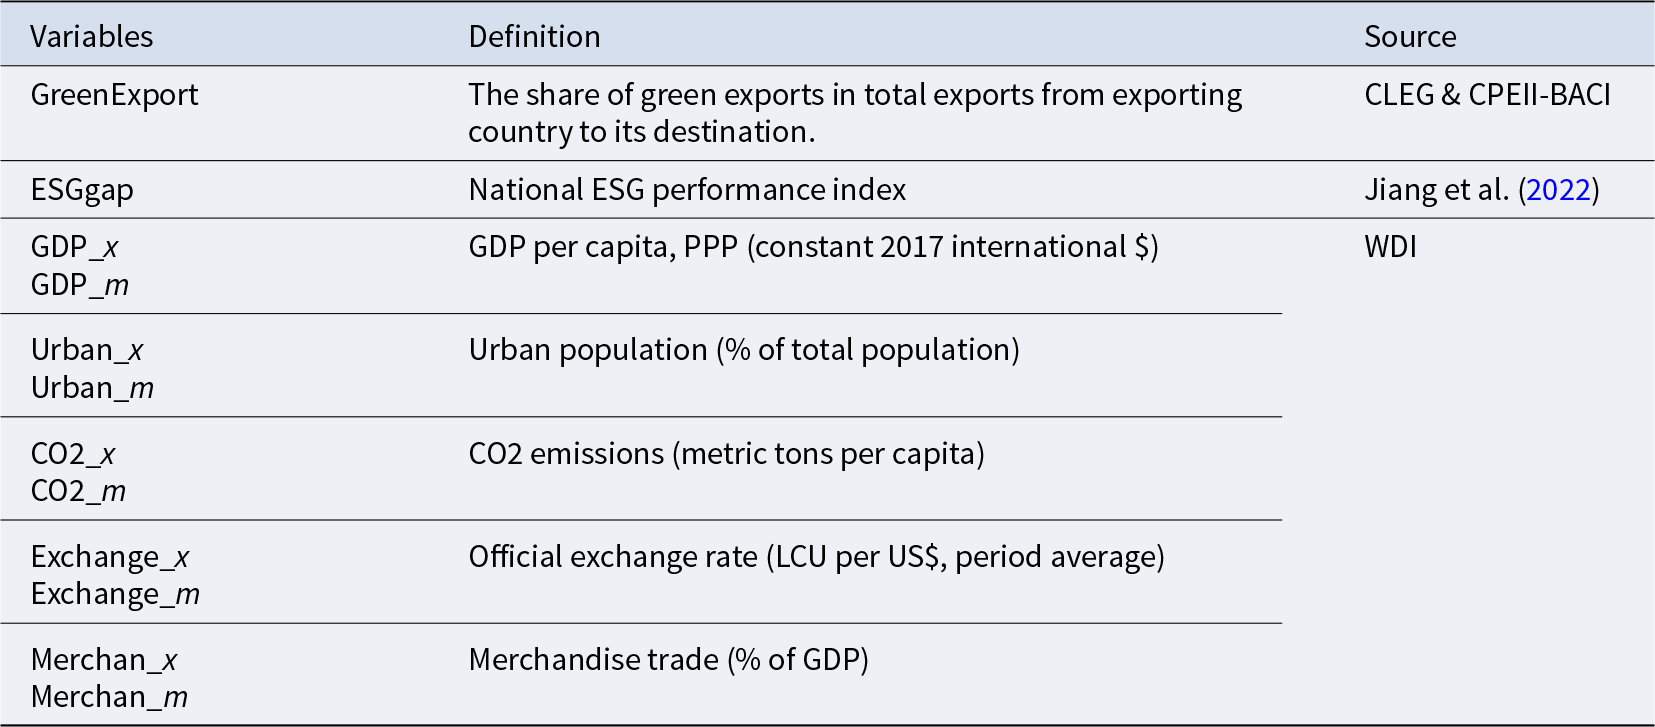
Notes: The variables with the suffixes ‘_x’ and ‘_m’ represent the exporting and destination country’s variables, respectively. WDI: World Development Indicators.
4. Empirical Analysis
4.1 Descriptive Statistics
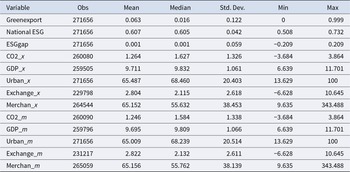
Based on the research reality and data availability, the sample includes an unbalanced panel dataset with up to 271,656 observations over 36 years (1996–2021). Each observation represents the green export behavior of an exporter to a destination country in a given year. We measure green export behavior as the share of green exports in total exports, which ranges from 0 to 0.9999945, indicating that almost all exports along this trade flow in that year consisted of green products.Footnote 7 The median is 0.020, which is lower than the mean, indicating that more than half of the trade flows are below the average level of green exports, reflecting the importance of improving ESG performance in shaping the comparative advantage of green exports. Among our selected samples, the national ESG scores range from 0.508 to 0.732, with mean and median scores of 0.607 and 0.605, respectively. The absolute value of the ESG performance gap (ESGgap) falls within (0,0.209), with its maximum value of 0.209 being smaller than the national ESG performance range of 0.224. The descriptive statistics are shown in Table 3.
Descriptive statistics
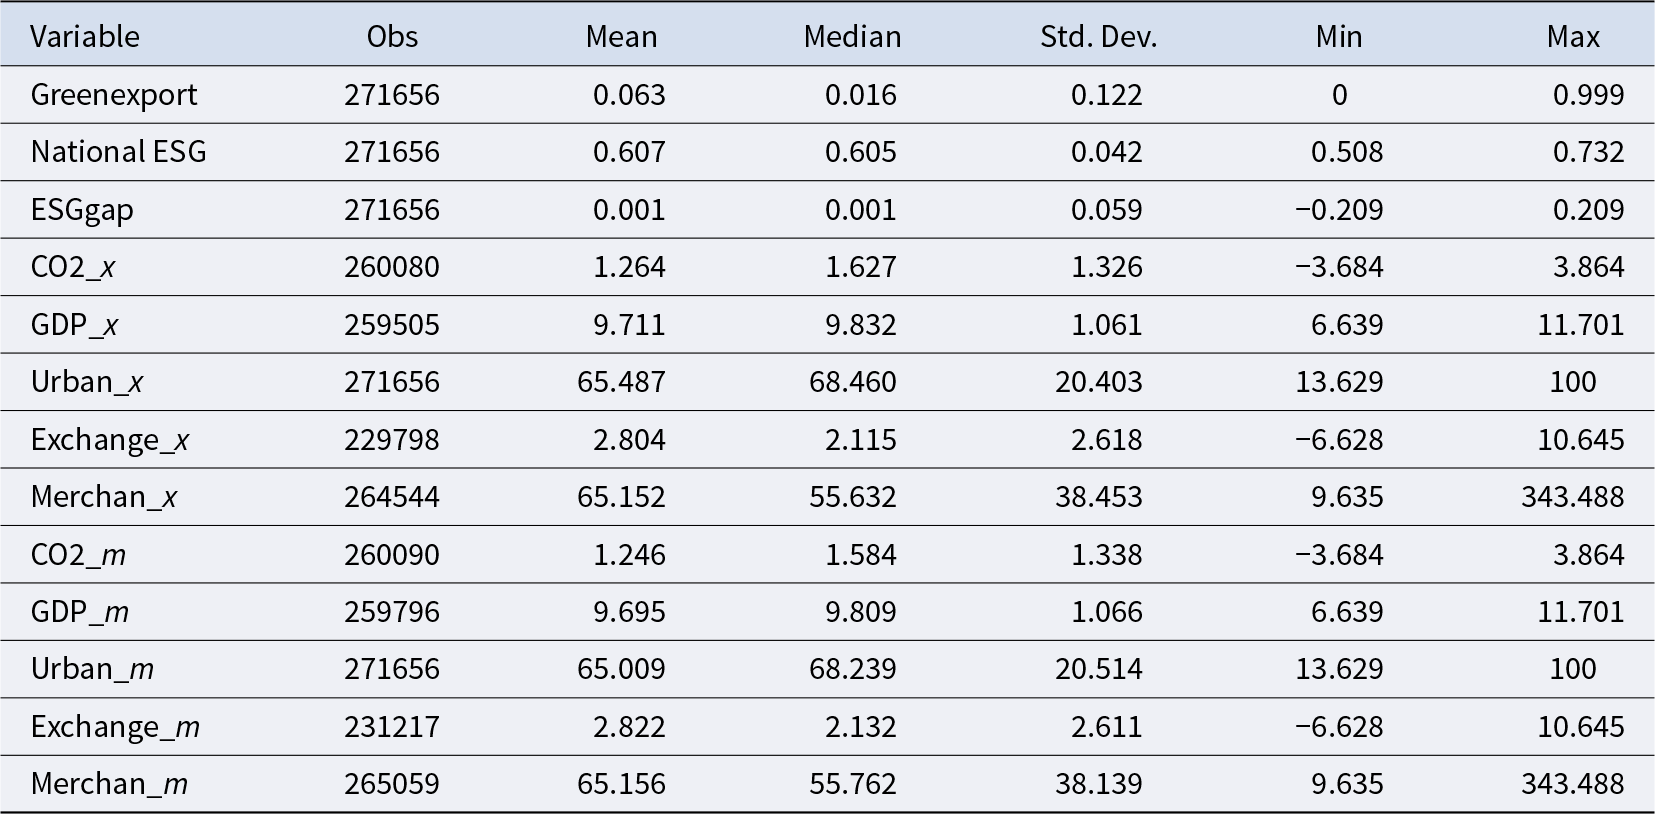
Notes: For the variables CO2, GDP, and Exchange, we present the sample data characteristics after logarithmic transformation.
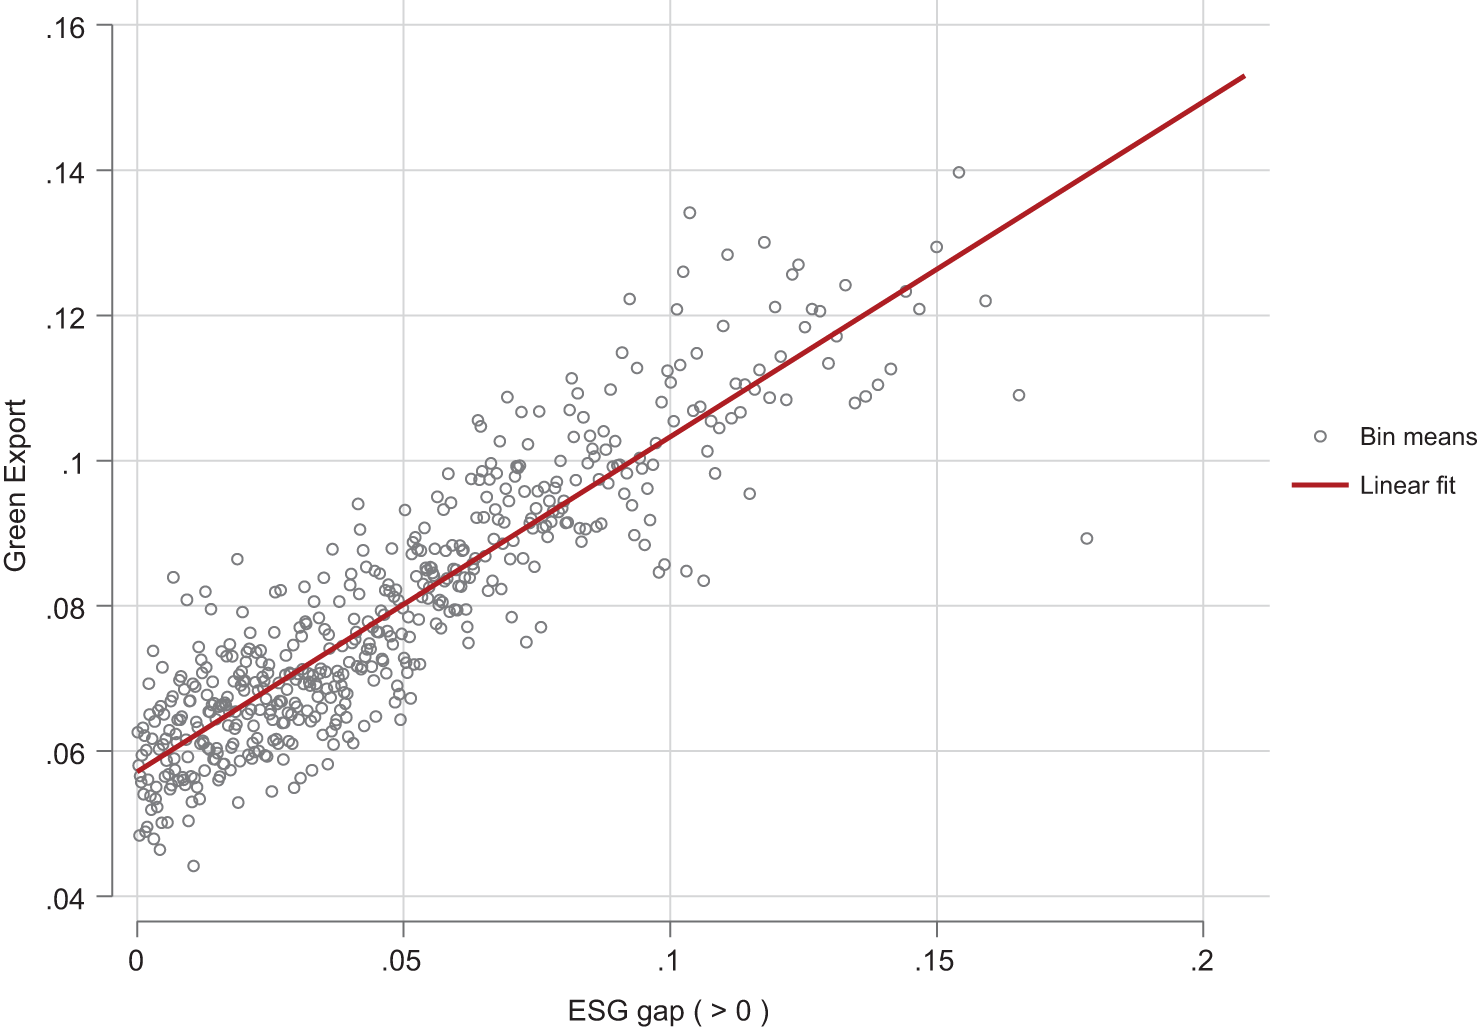
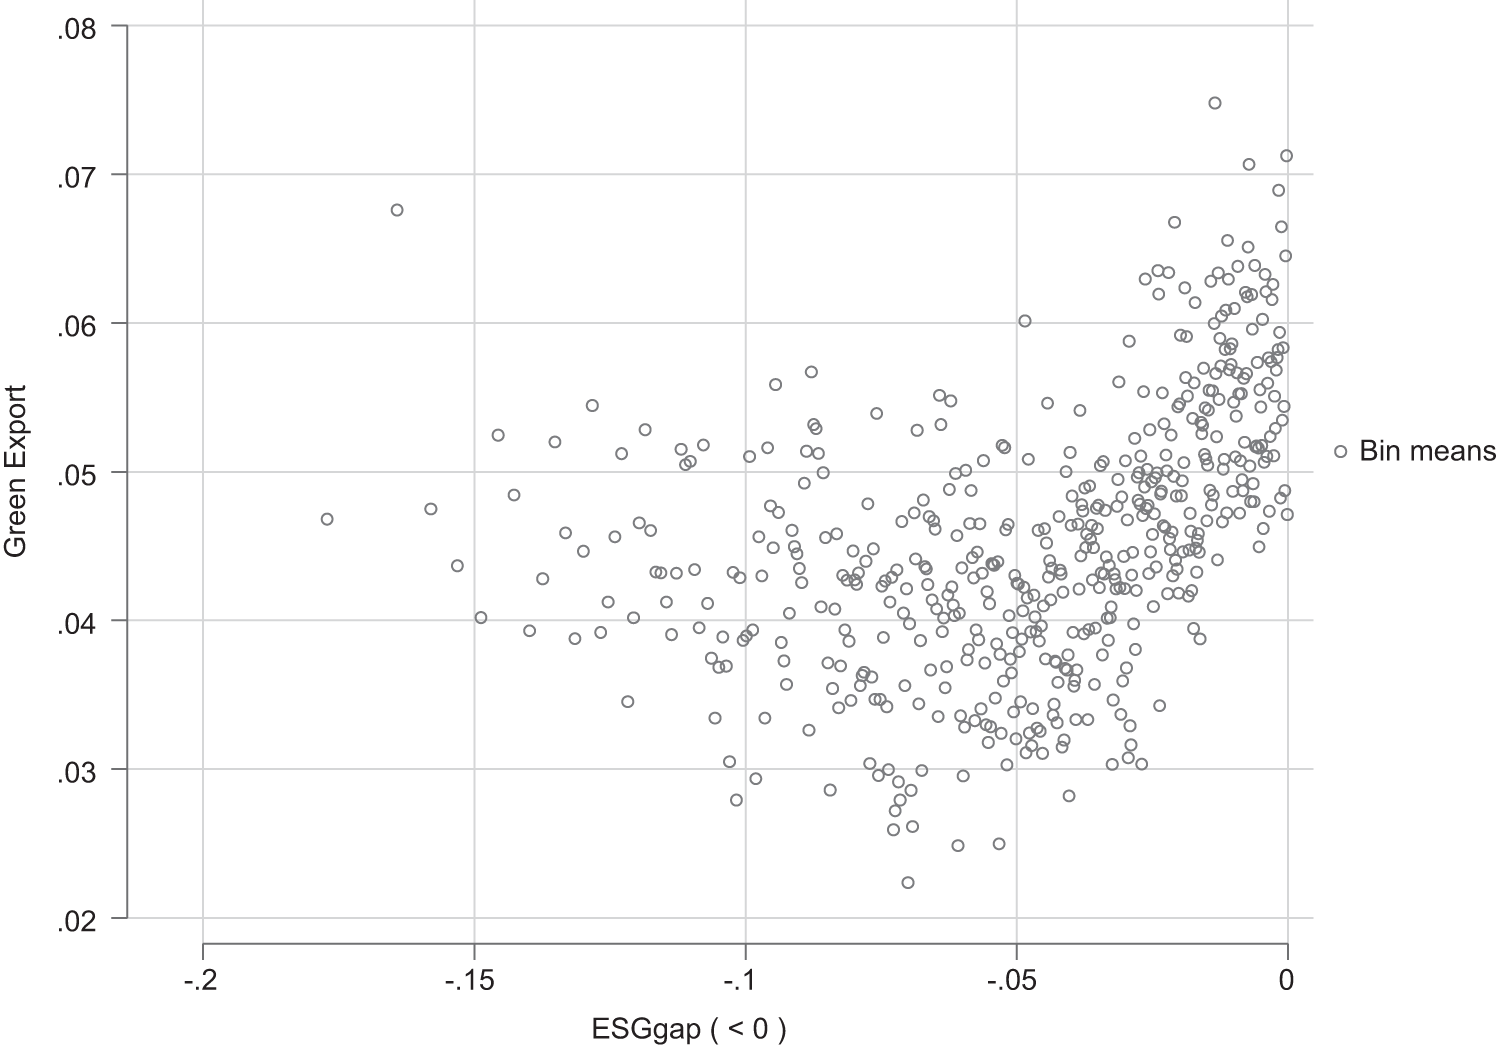
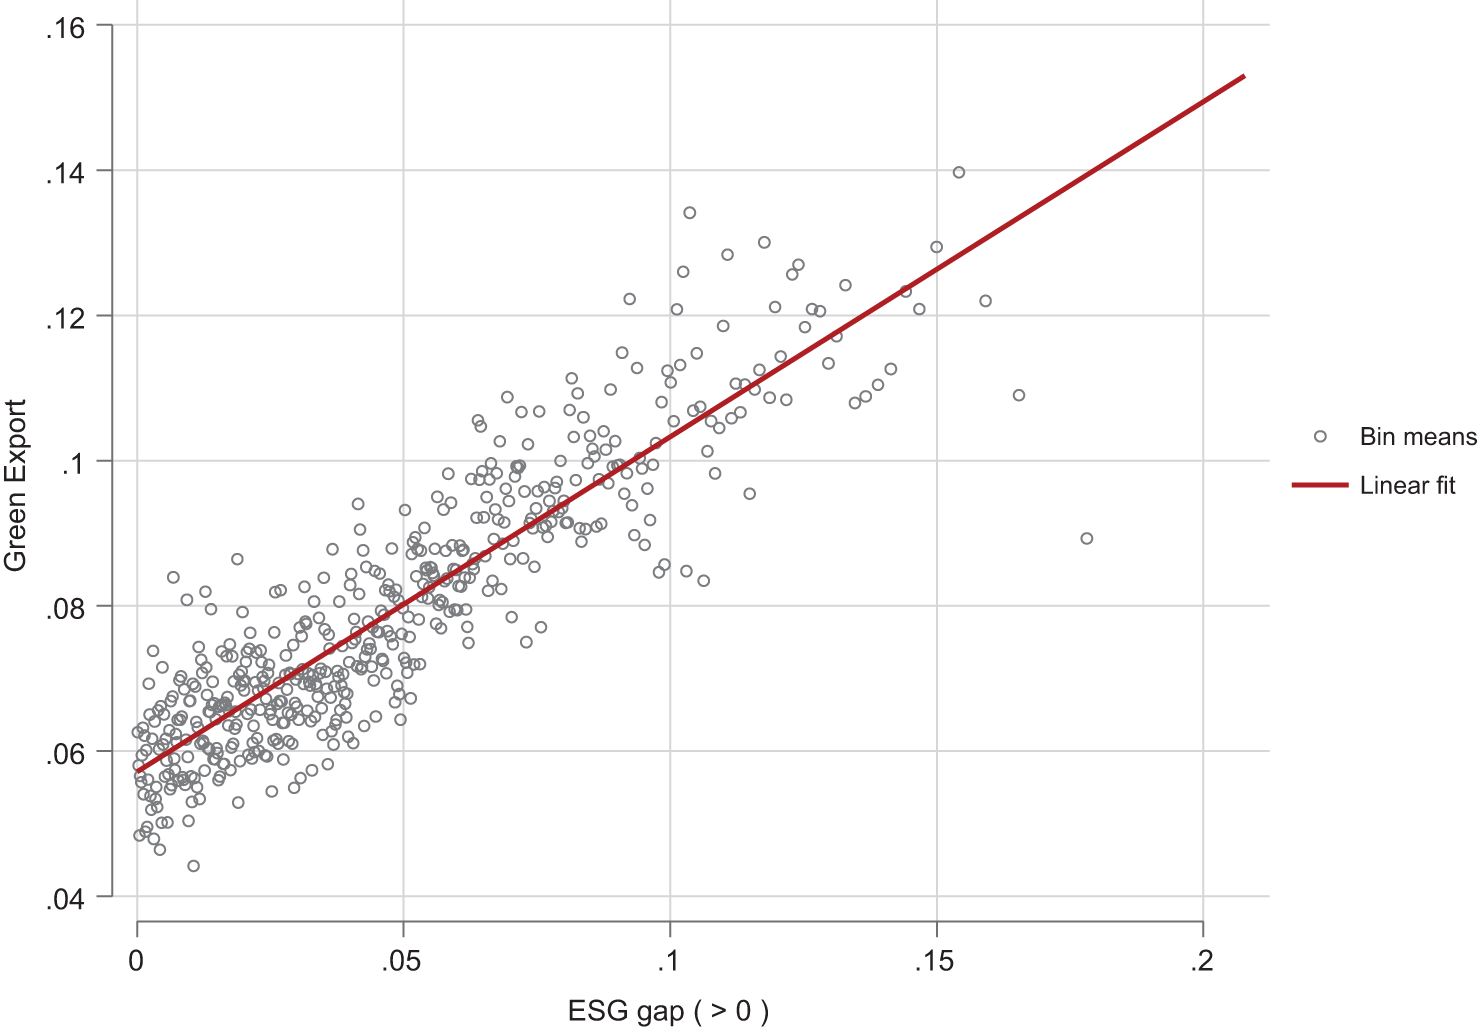
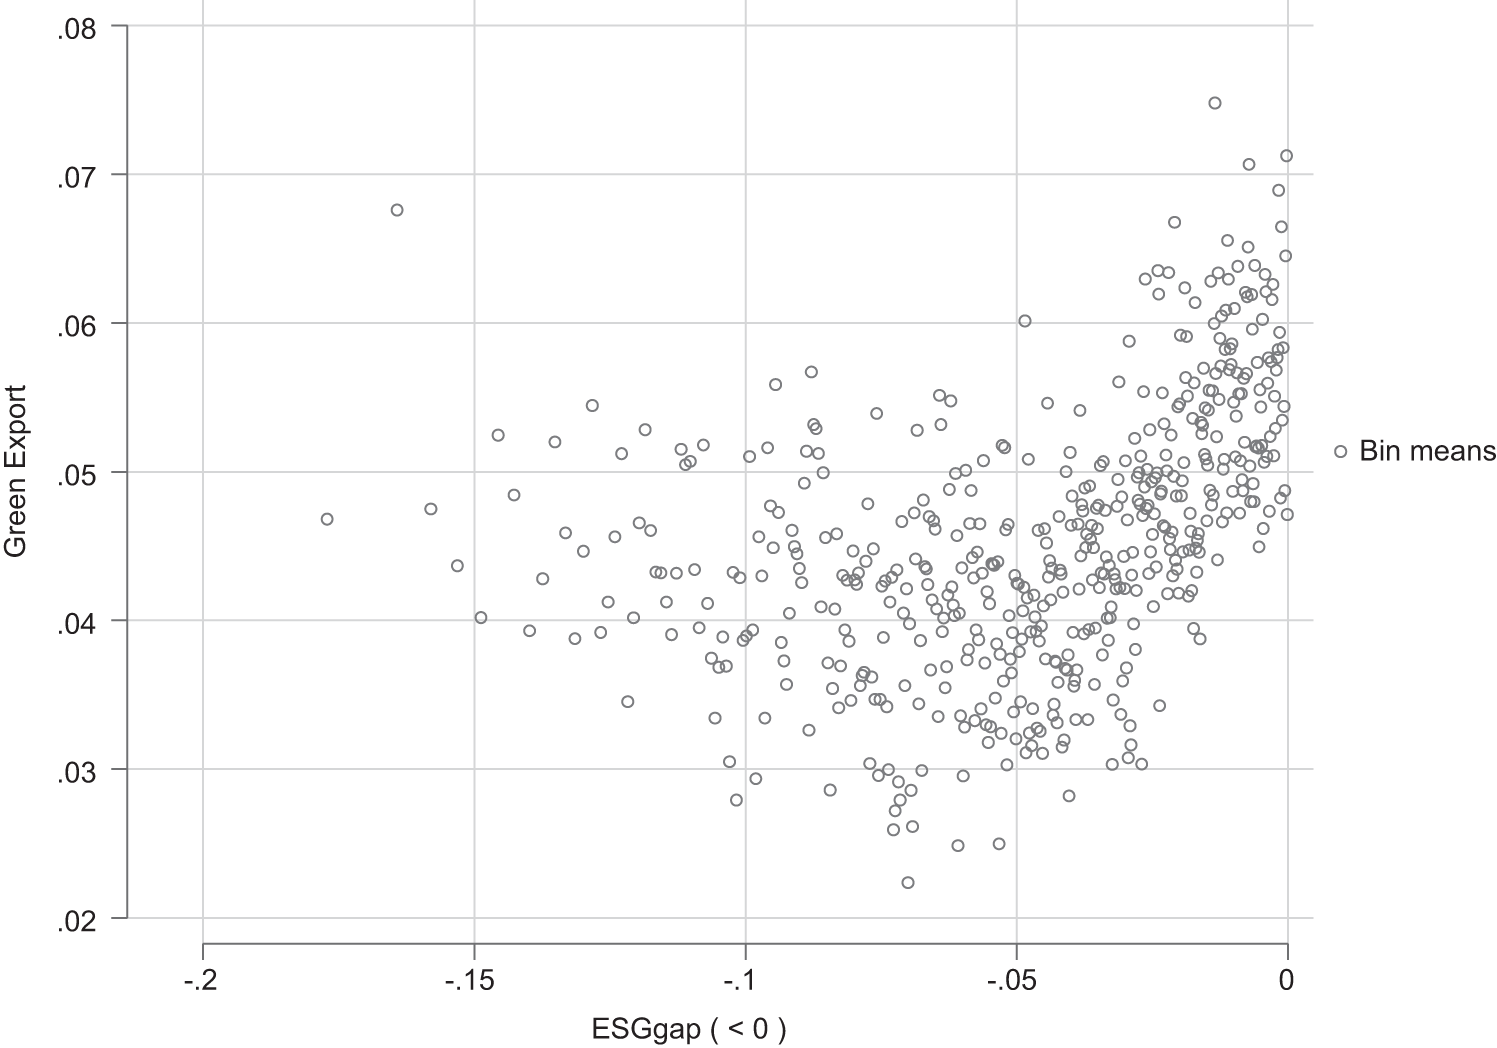
Before running the benchmark regression, we plotted a scatterplot and a fit curve to visually examine the linear relationship between GreenExport and ESGgap. First, we divided the full sample into two subsamples based on whether the ESG gap is positive. To improve the clarity and interpretability, we binned the data into 500 quantile intervals according to the order of the abscissa ESGgap, and all data points in each interval are combined into one point for fitting. The scatter plot and fitting curve can reveal the relationship and linear trend between the GreenExport and ESGgap. Figure 1 shows that when the ESG performance of the exporting country exceeds that of the destination country, an increase in the ESGgap leads to an increase in the GreenExport ratio, suggesting a strengthened comparative advantage. Figure 2 shows no significant linear correlation for samples where the ESG performance of the exporting country is lower. However, there may be a non-linear relationship, which is revealed by the quadratic and cubic terms. We will conduct further analysis below.
Binned scatter plot and corresponding fitting curve of GreenExport and positive ESGgap
Binned scatter plot of GreenExport and negative ESGgap
4.2 Benchmark Regression Results
To reduce the discrepancy in the data and the influence of outliers, we apply a logarithmic transformation to GDP, Exchange, and CO2 for all countries. The other variables are defined in terms of ratios, so a logarithmic transformation is not necessary. We then calculated the variance inflation factors for each variable, and the results are shown in Table 4. The average VIF value is 3.388, and all VIF values are less than the empirical threshold of 10; there is no strict multicollinearity among the variables. We divide the samples into two subgroups based on whether the ESGgap is positive and apply an ordinary least squares (OLS) regression model with high-dimensional fixed effects. The results are shown in Table 5. We control for exporting country, destination country, and time fixed effects and use heteroskedastic robust standard errors in the significance test. The results in columns (1)–(4) show that for a positive ESGgap (where the ESG performance of the exporting country exceeds that of the destination country), the regression coefficients on the ESGgap are significantly positive. In economic terms, when the exporting country’s ESG performance exceeds that of the destination country and there is a larger gap between them, it further promotes green exports. Accordingly, columns (5)–(8) present results for subsamples with a negative ESGgap. The regression coefficient for ESGgap is not significantly different from zero at the 90% confidence level, indicating no effect on green exports. In summary, the benchmark results show that the increase in positive ESG gaps has a linear promotional effect on green exports, while the negative ESG gaps do not have such a linear relationship.
Variance inflation factor
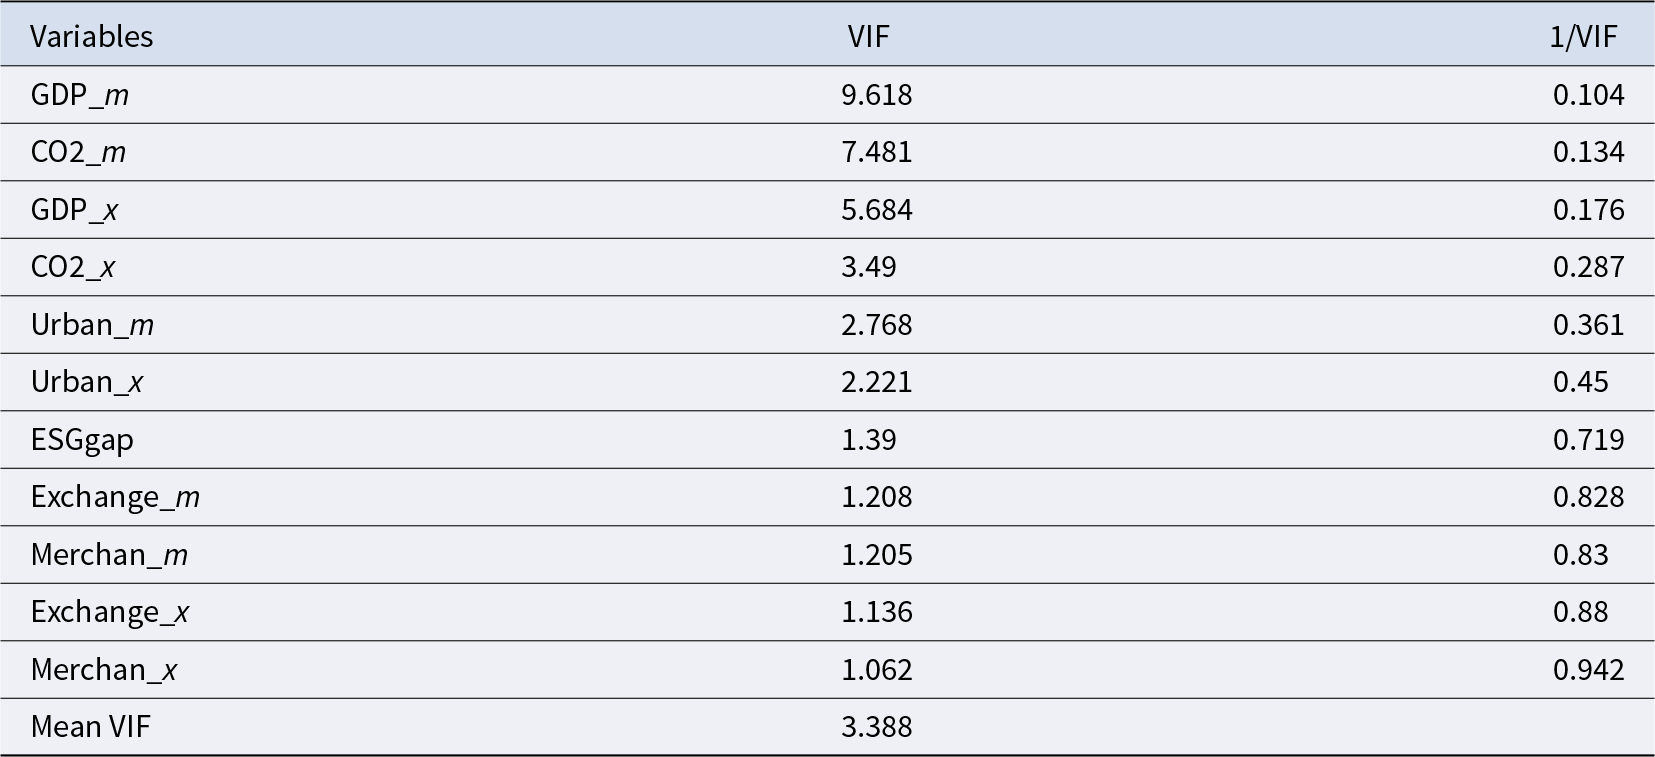
Notes: Variance Inflation Factor (VIF) is a metric used in regression analysis to detect multicollinearity, VIF quantifies the extent to which the variance of a regression coefficient is inflated due to collinearity with other predictors.
Benchmark regression results
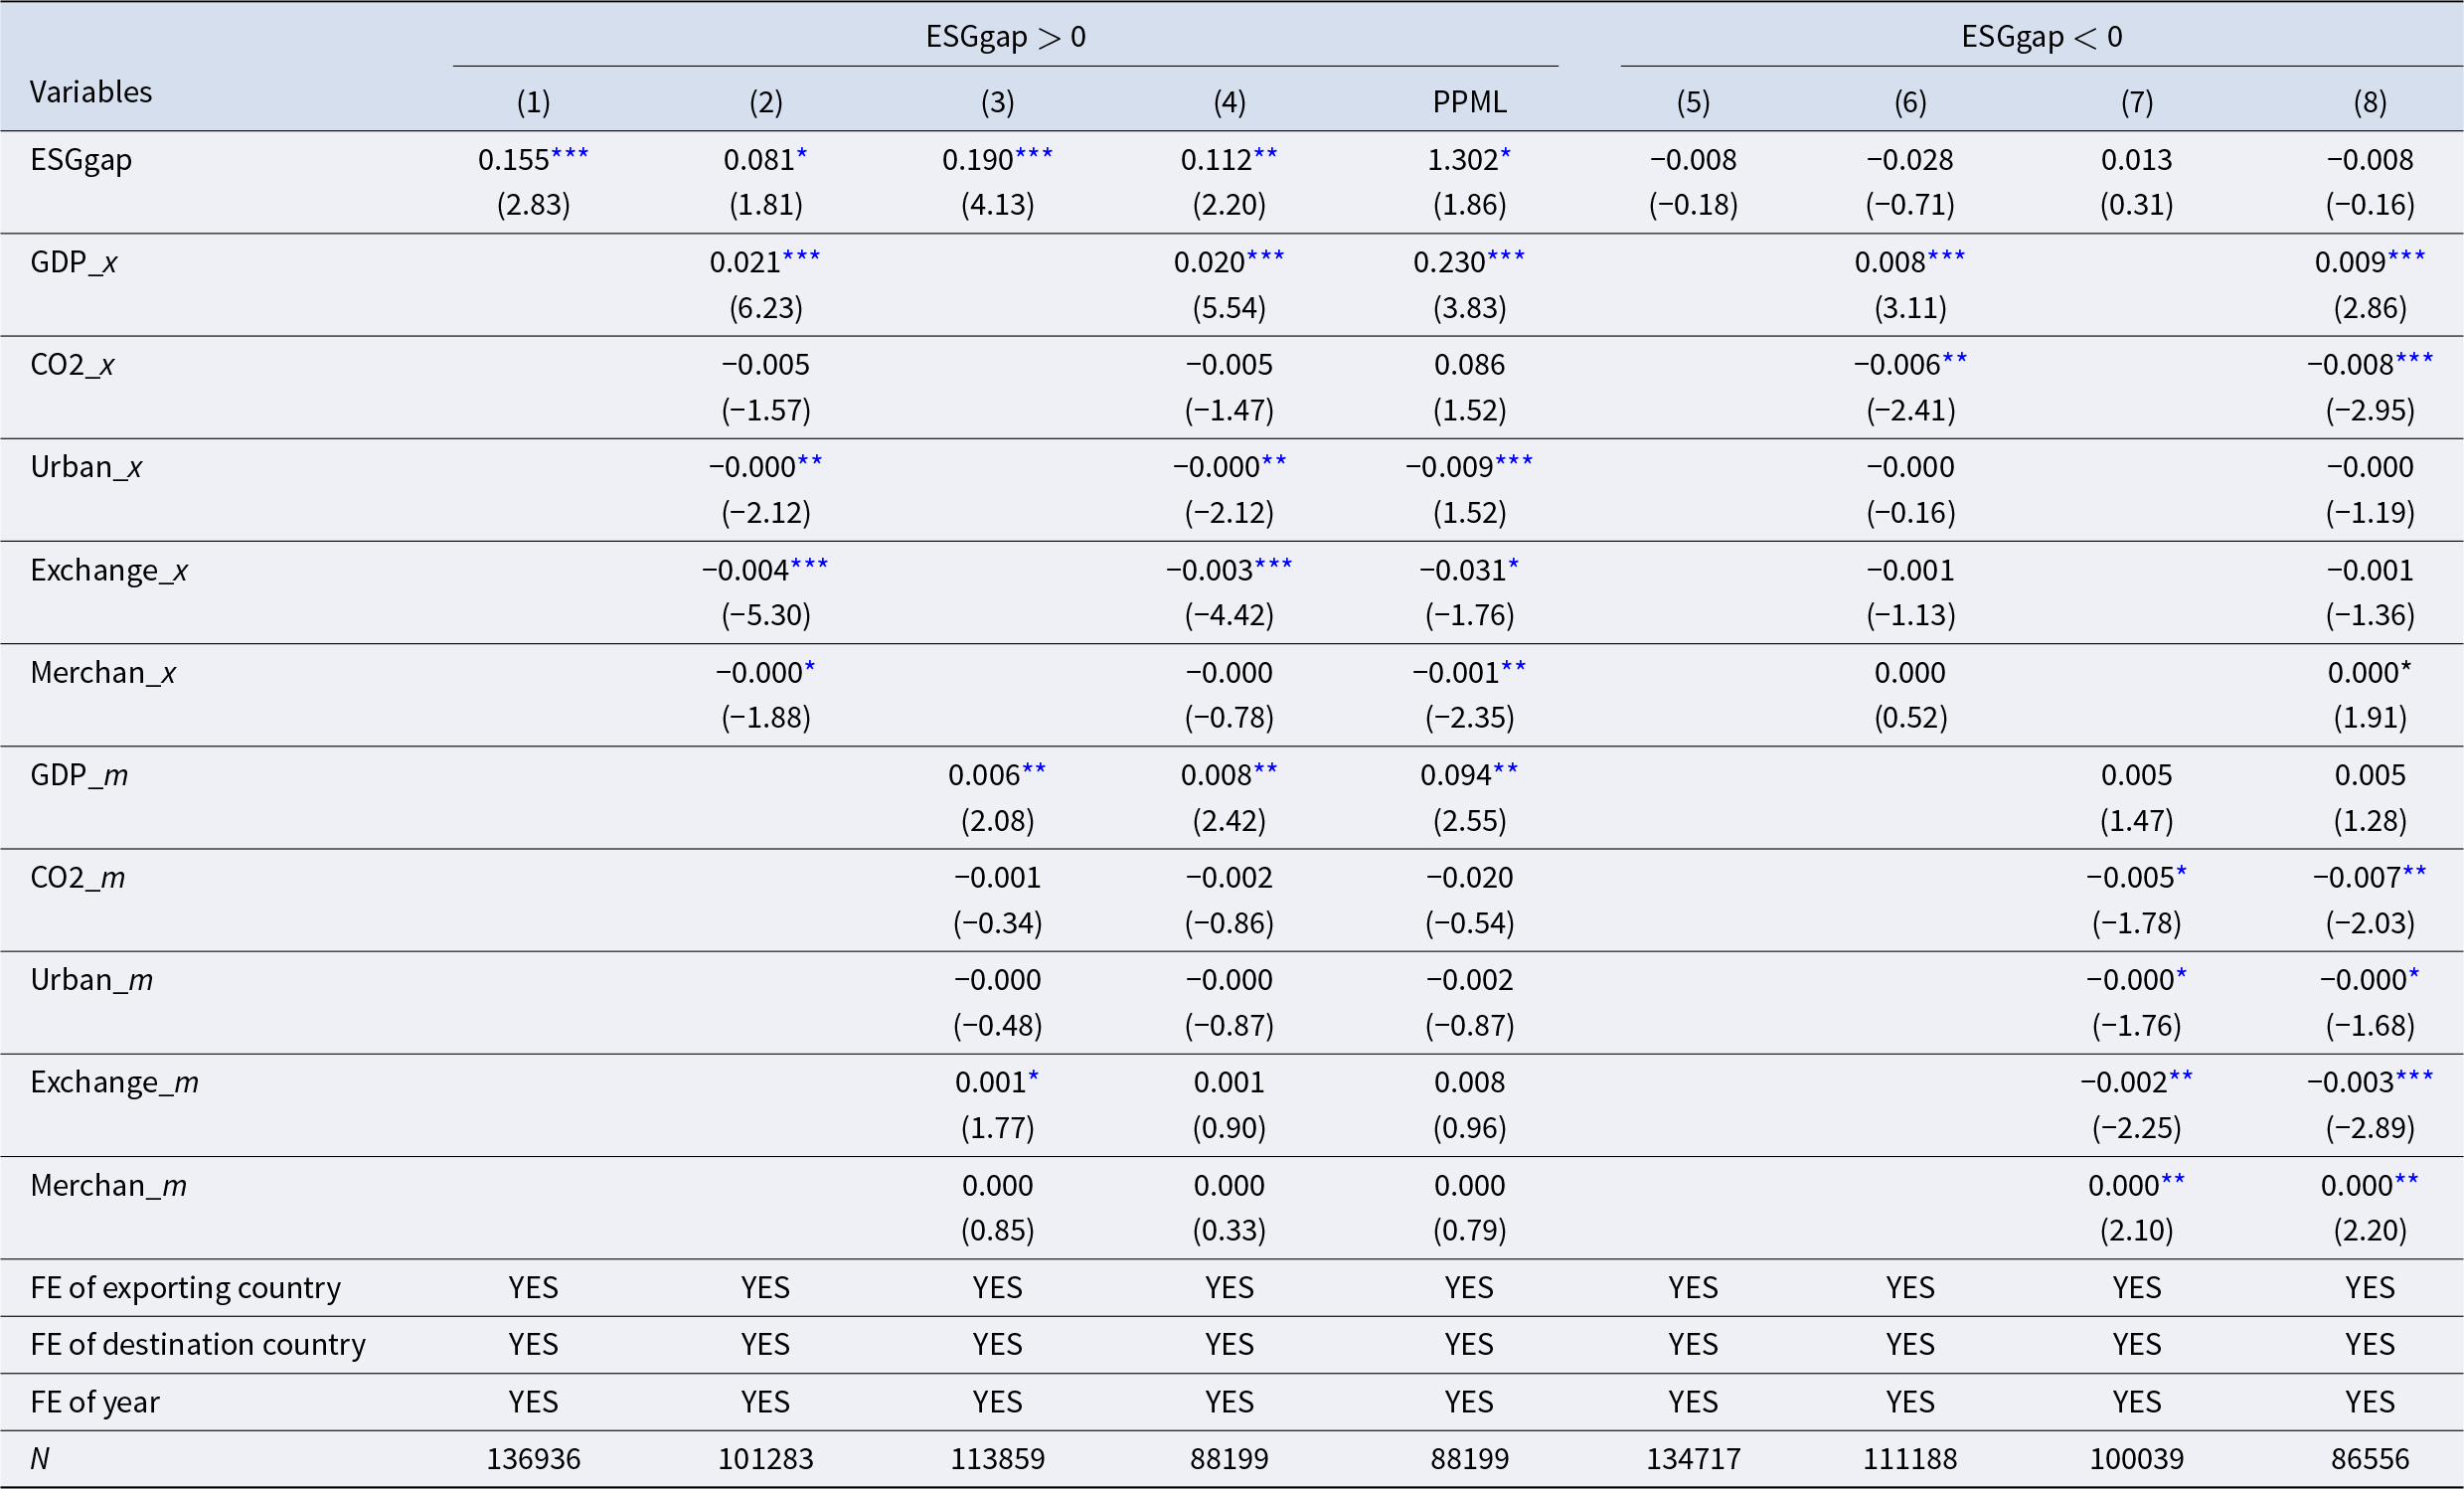
Notes: t statistics in parentheses,
* p<0.1, ** p<0.05, *** p<0.01. This applies to columns (1)–(8) and ALL subsequent tables. For Column PPML, z statistics are in parentheses. Due to space constraints, the coeffecients for control variables are only displayed in this table. These coefficients in subsequent tables are available upon request.
One concern in international trade research is the potential bias in the fixed effects estimation due to a high proportion of zero values in the dependent variable. In the subsample where the ESGgap > 0, the proportion of zero values in GreenExport is 19.32%. While this is generally acceptable, it is still important to ensure robustness. To address this concern, we re-estimate the model using the Possion Pseudo Maximum Likelihood (PPML) estimator, which is widely recommended for trade data as it effectively handles zero trade flows and mitigates heteroskedasticity (Head and Mayor, 2014). The PPML results are shown in Table 5 and are consistent with the benchmark fixed effects model, with no change in the signs or significance of the estimated coefficients.Footnote 8
4.3 Alleviating Endogeneity
To mitigate potential endogeneity issues, we included multidimensional fixed effects in the regression model to account for as many unobservable factors influencing green exports as possible, thereby reducing estimation bias. Despite these controls, measurement errors and reciprocal causality among macroeconomic variables may still introduce estimation errors due to endogeneity. To reduce such errors, we choose the forest cover gap between the exporting country and its destination as the instrumental variable, which is reasonable based on relevance and exogeneity considerations.
Relevance requires that the instrumental variable is correlated with the endogenous explanatory variable, namely the national ESG gap. For the environmental pillar, which covers such a large area of the planet, forests are critical to climate regulation and climate change mitigation.Footnote 9 A country’s forest cover directly reflects its commitment to environmental issues such as forest conservation, reforestation, and sustainable land use. Higher forest cover is generally associated with better performance on environmental indicators, which positively impacts overall ESG performance. In addition, countries with higher forest cover tend to implement more science-based conservation policies. Effective forest governance reflects more modern governance systems and capacities, while providing more diversified product categories and income sources. This strengthens social resilience, which in turn indirectly improves a country’s ESG performance. Therefore, from the perspective of E, S, and G, forest cover contributes positively to a higher ESG score. Exogeneity requires that the instrumental variable is uncorrelated with the error term in the regression model, i.e. it should not have a direct effect on the dependent variable (GreenExport), but should only affect the dependent variable through its influence on the endogenous explanatory variable (ESGgap). It is unlikely that a country’s forest cover directly determines the trade flow of green products. We argue that the main mechanism through which the forest cover gap affects trade in green products is by improving the country’s ESG performance, thereby enhancing the country’s reputation, influence, and attractiveness in green products. Therefore, in this study, the forest cover rate gap between the exporting country and the destination country can be accepted as an ideal instrumental variable.
The results of the two-stage instrumental variable least squares regression (IV-2SLS) are presented in Table 6, with columns (1) and (2) showing the results for the respective stages. The Kleibergen–Paap rk LM statistic is 138.49 with a P-value of 0.0000, which strongly rejects the null hypothesis of non-identifiability, indicating a significant relationship between the instrumental variable (Forestgap) and the endogenous explanatory variable (ESGgap). The weak identification test results, including the Cragg–Donald Wald F statistic and the Kleibergen–Paap rk Wald F statistic, both significantly exceed the critical value of 16.38 at the 10% significance level, indicating that there is no weak identification problem. In the second stage regression analysis, the significantly positive coefficient for the ESGgap confirms the robustness of our benchmark regression results even after accounting for potential endogeneity issues.
Instrumental regression result
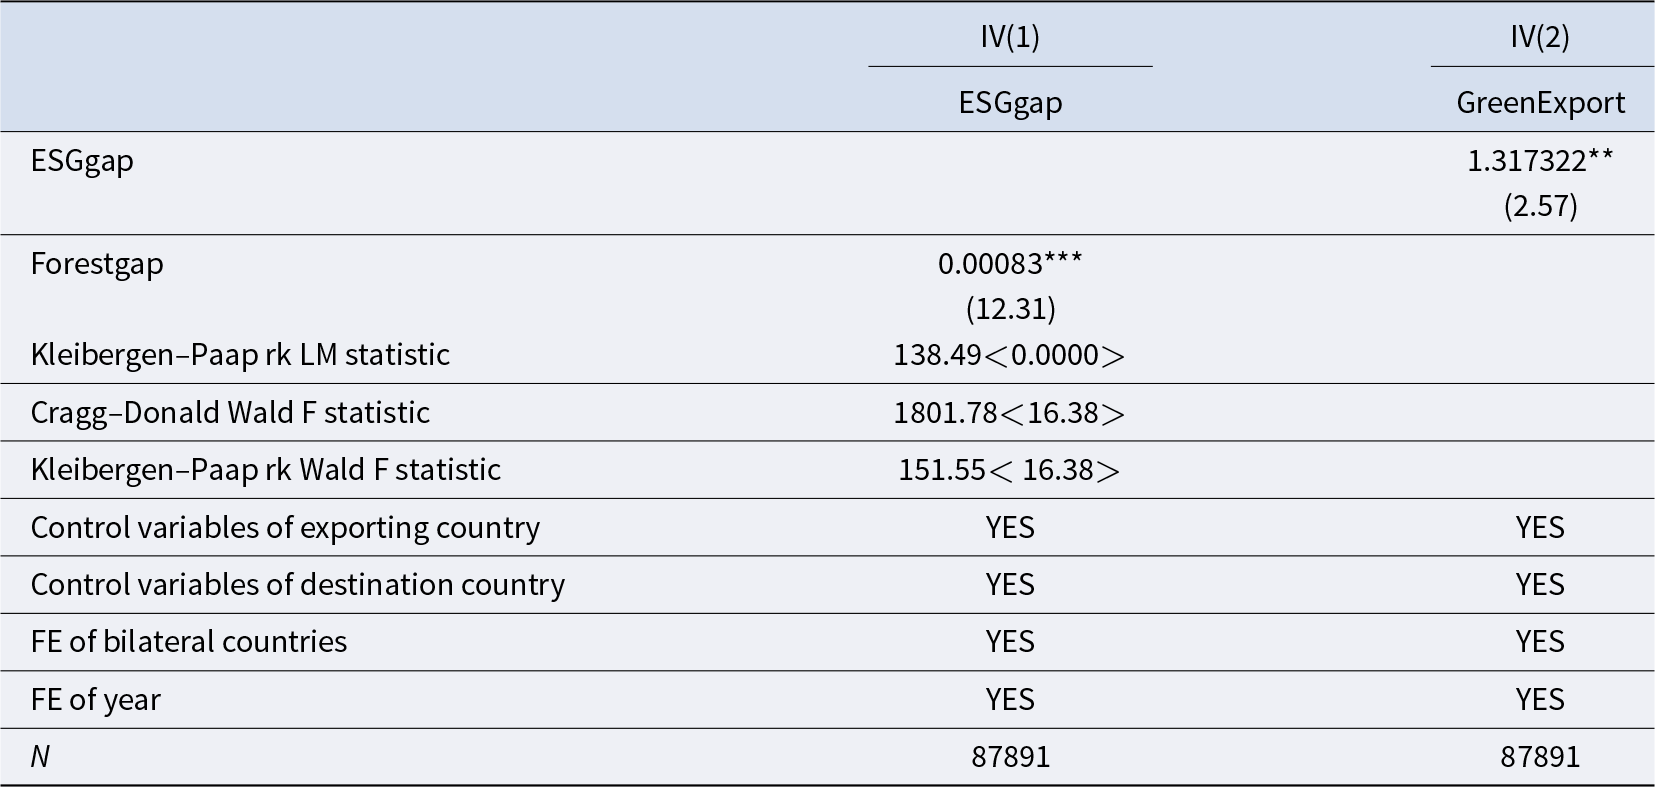
Notes: The value <16.38> is the Stock–Yogo weak ID test 10% maximal IV size critical value. The value <0.0000> is the p-value of Underidentification test using Kleibergen–Paap rk LM statistic, which is used to test for underidentification of instrumental variable.
4.4 Mechanism Tests
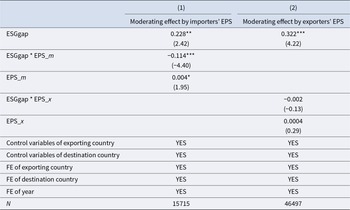
To verify hypotheses H2a and H2b, we use The OECD Environmental Policy Stringency (EPS) index which has been widely used by scholars as a policy analysis tool since its inception in 2014 (Kruse et al., Reference Kruse, Dechezleprêtre, Saffar and Robert2022). We merge the OECD EPS database with the exporting country and the destination country respectively to obtain the variable EPS_x and EPS_m. We multiply these two variables with the core explanatory variable ESGgap to obtain the interaction terms ESGgap * EPS_x and ESGgap * EPS_m, and incorporate the two interaction terms into the regression model to observe the significance and sign of their estimated coefficient. See Table 7 for the results.
Mechanism analysis about EPS
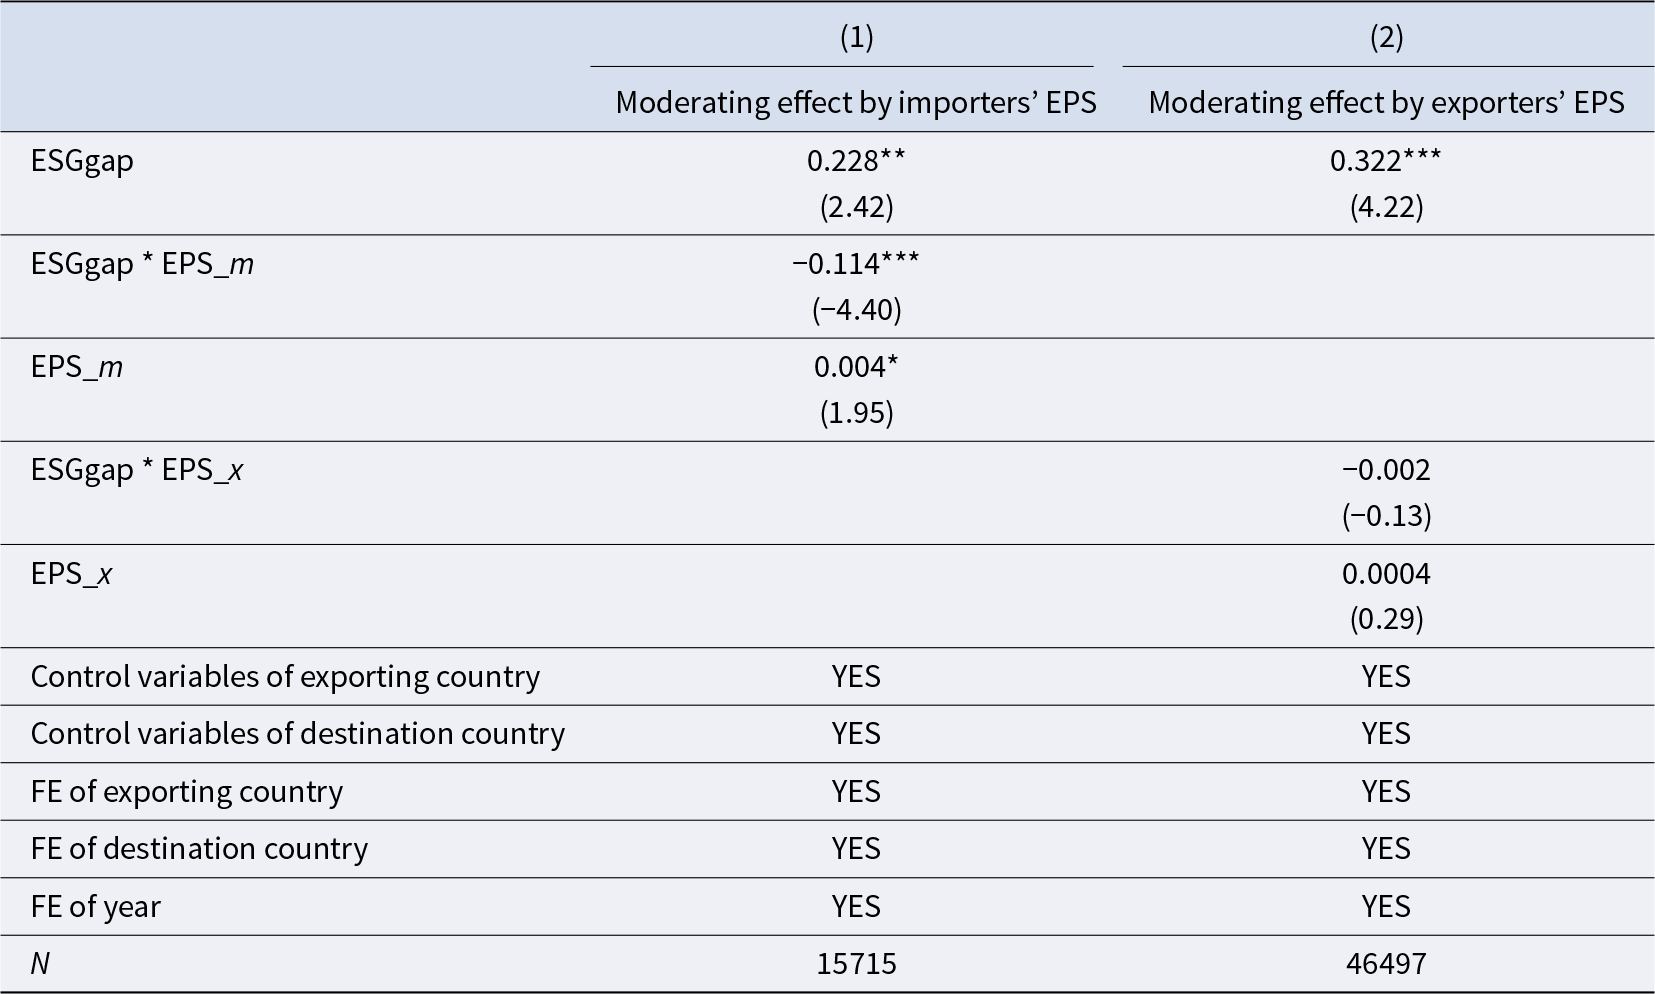
Table 7 shows the results after adding the interaction terms. Column (1) shows that adding the interaction term ESGgap * EPS_m does not change the sign and significance of the ESGgap coefficient, but the coefficient of the interaction term itself is significantly negative. In economic terms, while a larger ESG performance gap between the exporting country and its destination is associated with a higher share of green product exports, this effect diminishes as the intensity of environmental regulation in destination countries increases. More stringent environmental regulations in the destination country can enhance its comparative advantage in green products by stimulating green innovation and signaling commitment to the international community, which can mitigate some of the comparative disadvantages of green products caused by lower ESG performance. Hypothesis H2a is supported. Column (2) shows that the sign and significance of the core explanatory variable ESGgap remain unchanged after the addition of the interaction term ESGgap * EPS_x, but the coefficient of the interaction term is insignificant, indicating that, unlike in destination countries, environmental regulation in exporting countries does not significantly affect the effect of the ESG gap on green exports, which does not support hypothesis H2b. This may be due to the ‘export crowding out effect’, where stricter environmental regulations in the exporting country promote green innovation and improve product quality, but also increase domestic consumption. Indeed, domestic consumers may absorb the increased production to comply with these regulations, thereby reducing the amount of green products available for export.
To test hypotheses H3, we use the number of green technology patents to measure green innovation (Long et al., Reference Long, Feng and Chang2023; Yang et al., Reference Yang, Feng, Zhao and Chang2022). We define the green innovation gap (GIgap) as the difference between the green technology patent levels of the exporting country and the destination country, similar to how we define the ESG gap (ESGgap). We first take GIgap as the dependent variable and ESGgap as the core explanatory variable for the regression. As shown in Table 8. Column (1), the coefficient of the ESGgap is significantly positive, indicating that the more the ESG performance of the exporting country exceeds that of its destination, the green innovation level of the exporting country will be correspondingly higher than that of its destination, which verifies the first step of hypothesis H3. Although we have analyzed the economic rationality behind the second step of H3, we follow Alesina and Zhuravskaya (Reference Alesina and Zhuravskaya2011) by including both the ESGgap and GIgap in the model to investigate the mechanism. Table 8, column (2) presents the regression results. We should pay attention not only to whether the coefficient and significance of the mechanism variable are in line with theoretical expectations, but also to whether there are significant changes in the significance and coefficient of the main explanatory variable. The coefficient of the mechanism variable GIgap is significantly positive at the 10% level, indicating that a larger green innovation gap is correlated with a higher share of green exports, which is consistent with our theoretical expectation. The coefficient of the ESGgap decreases significantly (from 0.112 to 0.019) and loses significance significantly, failing to reach the 10% significance threshold. At this point, the theoretical and empirical evidence have corroborated each other, demonstrating the existence of the key mechanism related to gaps in green innovation levels.
Mechanism analysis about Green Innovation Gap
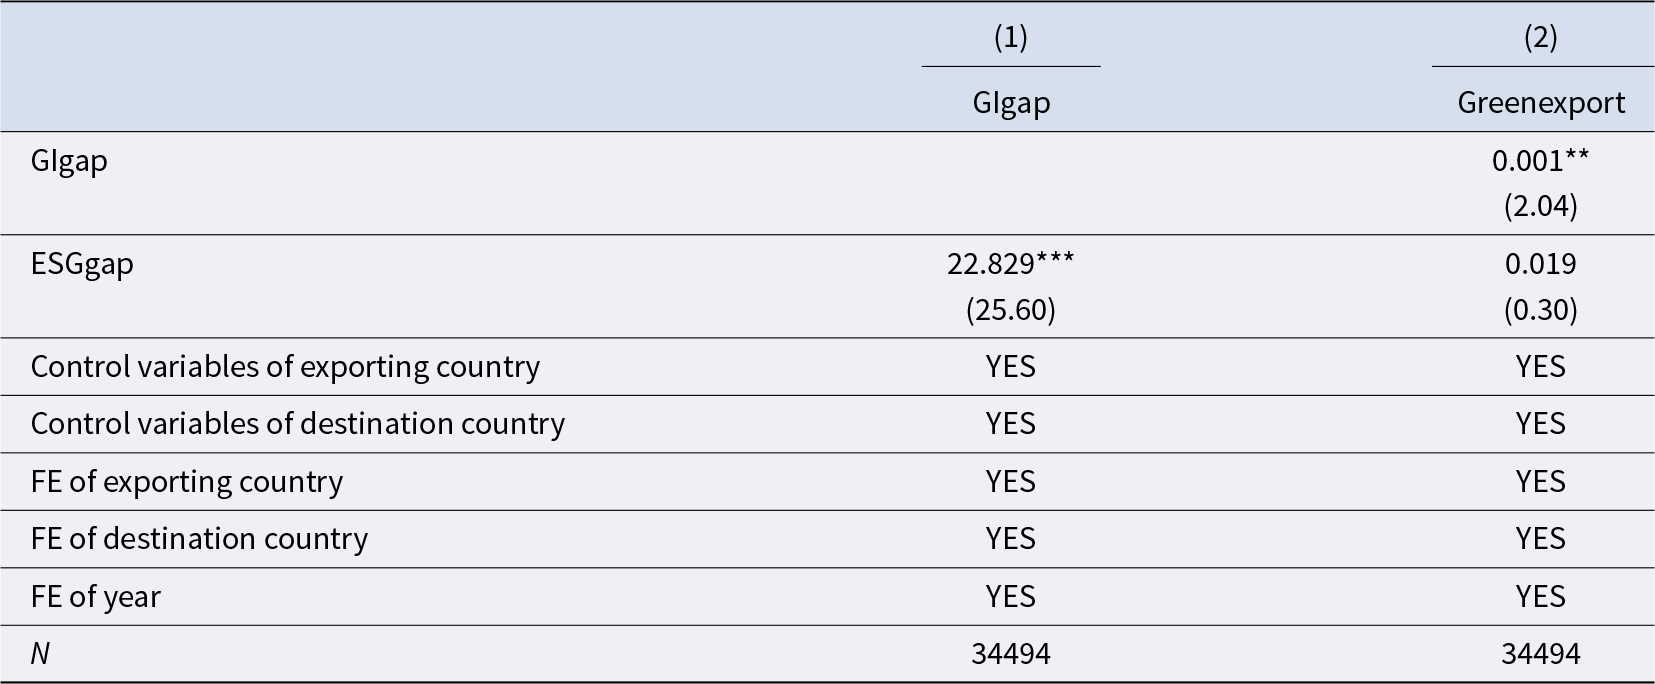
Notes: To smooth the data and minimize the influence of extreme values and zeros on the regression results, we add 1 to the number of green patents of both the exporting and destination countries before doing subtraction. We then apply a logarithmic transformation to obtain the proxy variable, GIgap, representing the gap in green innovation.
4.5 Nonlinear Analyses about Samples where the ESGgap Is Negative
For samples where the ESG performance of the exporting country is lower than that of the destination country, the benchmark regression does not show a linear effect of the ESG gap on green exports. However, if the exporting country takes measures to improve its ESG performance and reduce this gap (absolute difference), certain economic effects are expected. If such economic effects cannot be captured by a linear model, this may indicate that the direction of the effects changes as the ESG gap (absolute difference) narrows. The Environmental Kuznets Curve (EKC) suggests that pollution levels initially rise with economic growth, but eventually decline as stricter environmental policies and technological advances take effect (Grossman and Krueger, Reference Grossman and Krueger1995). Inspired by this framework, we argue that green exports in low-ESG countries follow a similar non-linear pattern.
Low-ESG countries often have weaker environmental regulations and lower environmental performance, potentially leading to the pollution haven effect (Levinson and Taylor, Reference Levinson and Taylor2008), where pollution-intensive industries maintain a comparative advantage over green industries. In the early stages of ESG development, pollution-intensive industries may still retain a comparative advantage, making green products relatively uncompetitive due to high compliance costs and weak technological capabilities. At the same time, domestic policy orientation and regulatory measures aimed at promoting green industries may stimulate domestic demand for green products, thereby crowding out green exports, causing exports to high-ESG countries to decline rather than increase. However, as these countries gradually improve their ESG performance, their latecomer advantages in green industries become more pronounced (Huang et al., Reference Huang, Su and Kim2020), leading to faster green technological innovation and expanding market demand. Over time, their comparative advantage in green products undergoes a dynamic transformation (Kojima and Ozawa, Reference Kojima and Ozawa1985), enabling them to establish global competitiveness in green exports. Thus, as the inverted U-shape of the EKC for pollution, we hypothesize a U-shaped relationship between the ESGgap and green exports when the ESGgap is negative. We assume that:
H4: When the ESG performance gap is negative, as the absolute value of the ESGgap narrows, green exports exhibit a U-shaped relationship, initially decreasing and subsequently increasing.
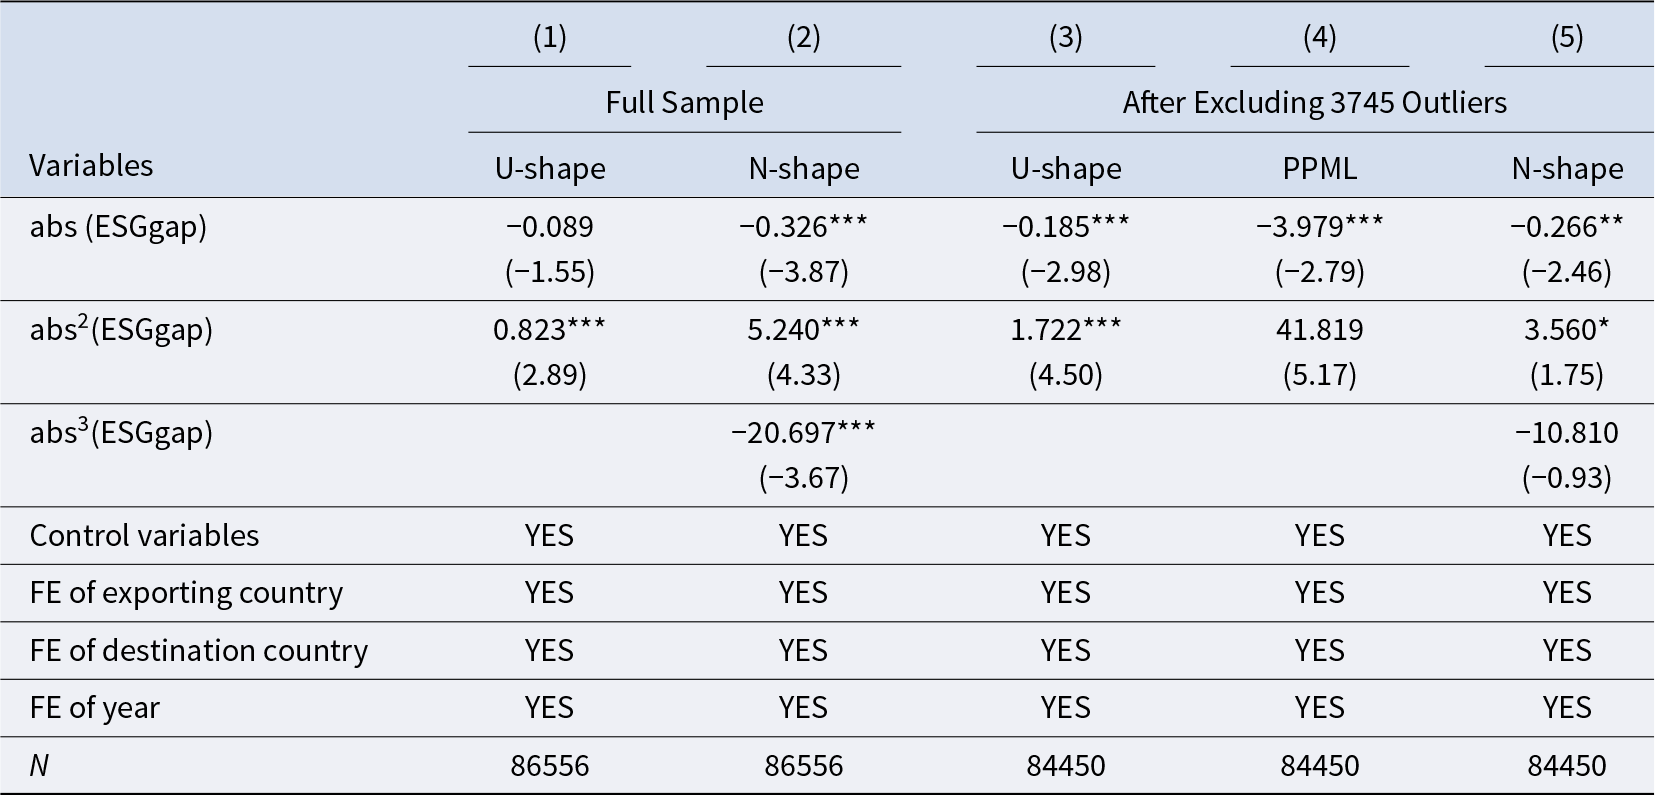
To explore and capture the possibility of a nonlinear relationship, we modify the benchmark regression model by using the absolute value of the ESGgap variable, abs(ESGgap), to measure how much the ESG performance of the exporting country lags behind that of the destination country. We add the quadratic term abs2(ESGgap) and the cubic term abs3(ESGgap) into the regression (Wang, Reference Wang2012; Shaddady, Reference Shaddady2022). Initially, adding abs2(ESGgap) to the model proves the potential presence of a U-shaped economic relationship. In Table 9, Column (1), the coefficient of the quadratic term abs2(ESGgap) is significantly positive at the 1% significance level. However, the coefficient of the quadratic term does not significantly deviate from zero, even at the 10% significance level. That is, although there may be a nonlinear relationship described by the U-shaped relationship, the minimum value point has a high probability of falling in the neighborhood of zero. In other words, in the value range of the research on the samples with a negative ESGgap, the relationship between the explanatory and explained variables may be monotonic. That is, there may not be a U-shaped relationship of first decreasing and then increasing as expected from both the scatter plot in Figure 2 and our theoretical expectations.
Nonlinear analyses
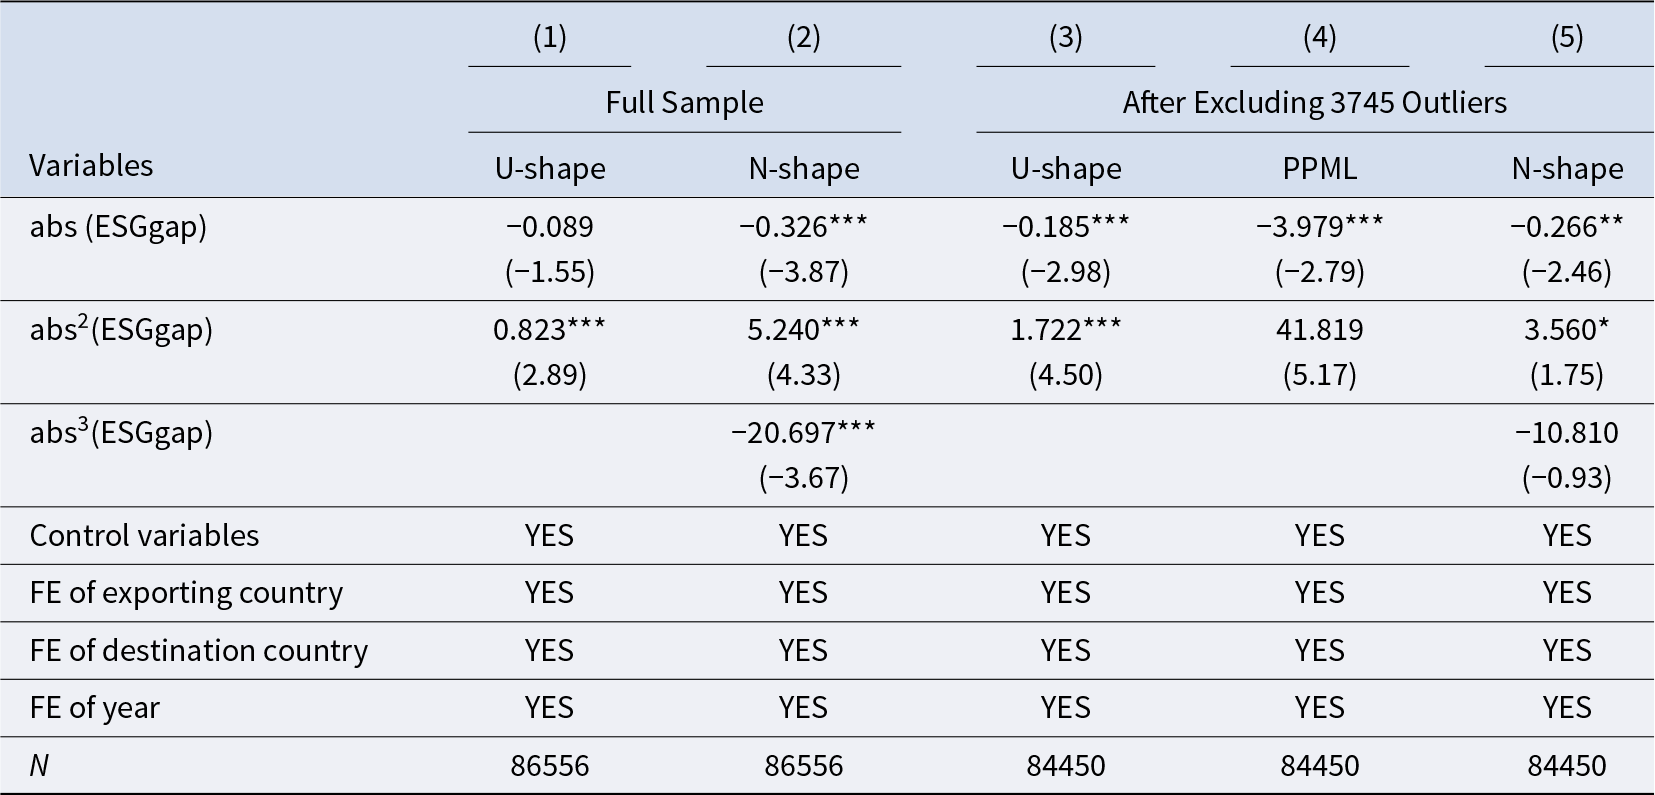
Notes: Columns (1)–(2) present nonlinear analyses using the full sample. Column (3)–(5) repeat the analyses aftering exluding 3745 outliers. Column (4) shows the PPML estimation results of U-shaped relationship analysis and z statistics in parentheses.
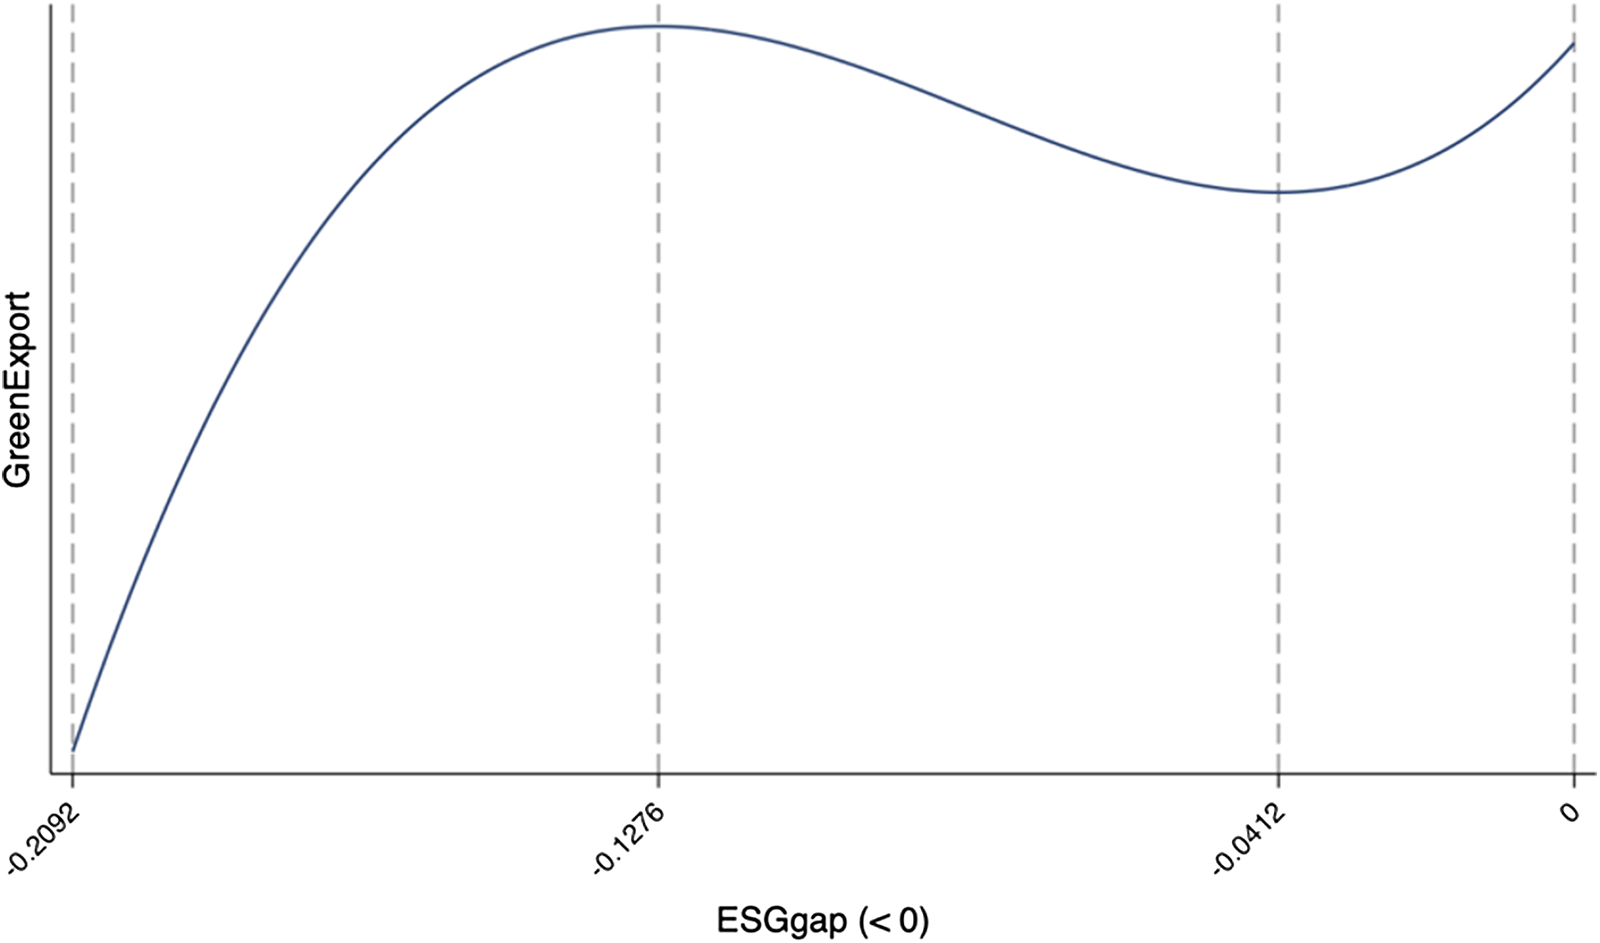
To mitigate estimation bias, we further added abs3(ESGgap) to the model to examine whether there is an N-shaped economic relationship. As shown in Table 9, Column (2), the coefficients of the cubic, quadratic, and the linear terms are all significant at the 1% level. This tells us that there may be a non-linear relationship between the explanatory and explained variables described by the cubic equation. According to their coefficients, we can calculate the two extreme points of the cubic function: the maximum value occurs at ESGgap = –0.1276, while the minimum occurs at ESGgap = –0.0412. Both fall within the sample interval (–0.2092, 0) for ESGgap values, i.e. within this range there may be an N-shaped economic relationship, as shown by the curve in Figure 3, which is divided into three segments by two extreme points. In these three segments, as the ESG performance of the exporting country gradually catches up with that of the destination country, the share of green exports first increases, then decreases, and then increases again.
The N-shaped economic relashoinship between GreenExport and negative ESGgap
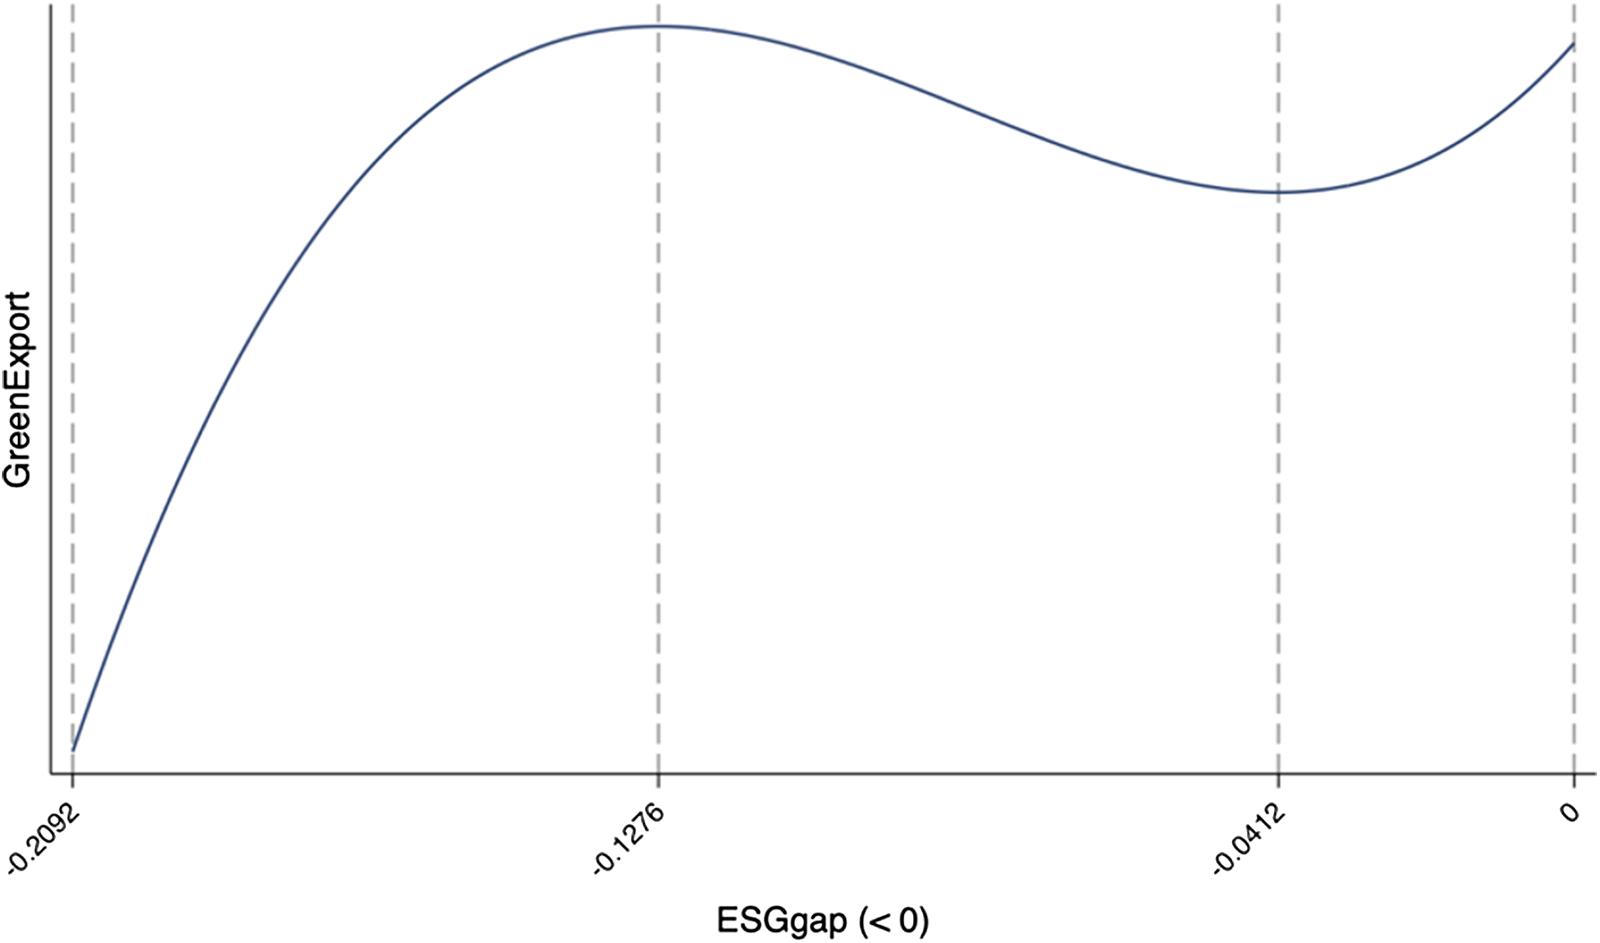
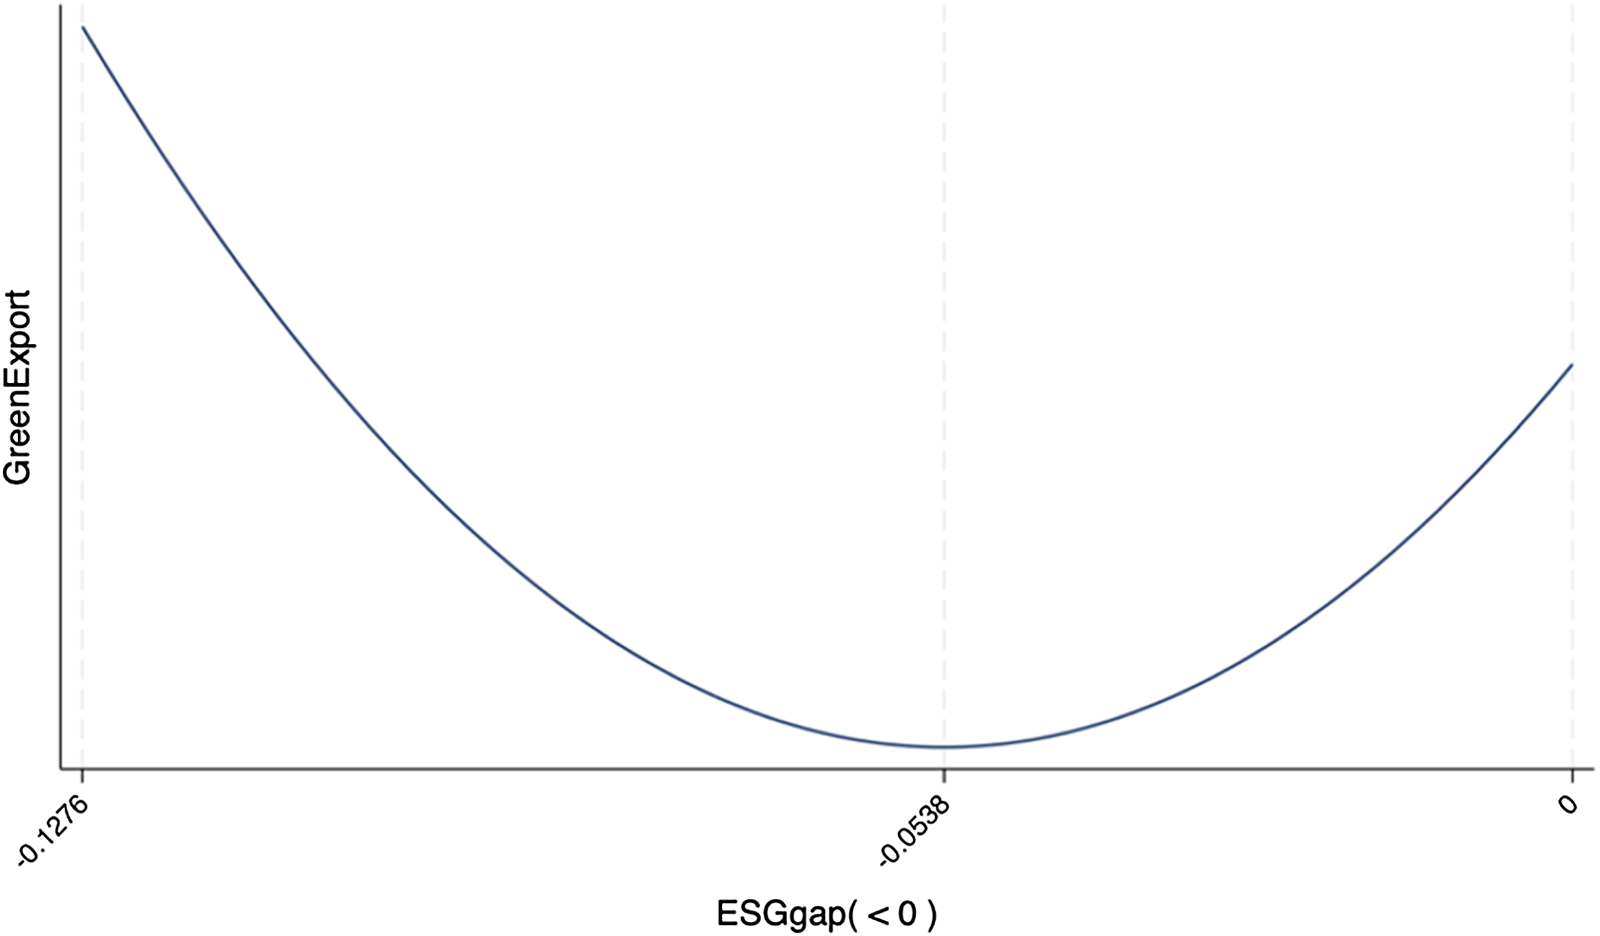
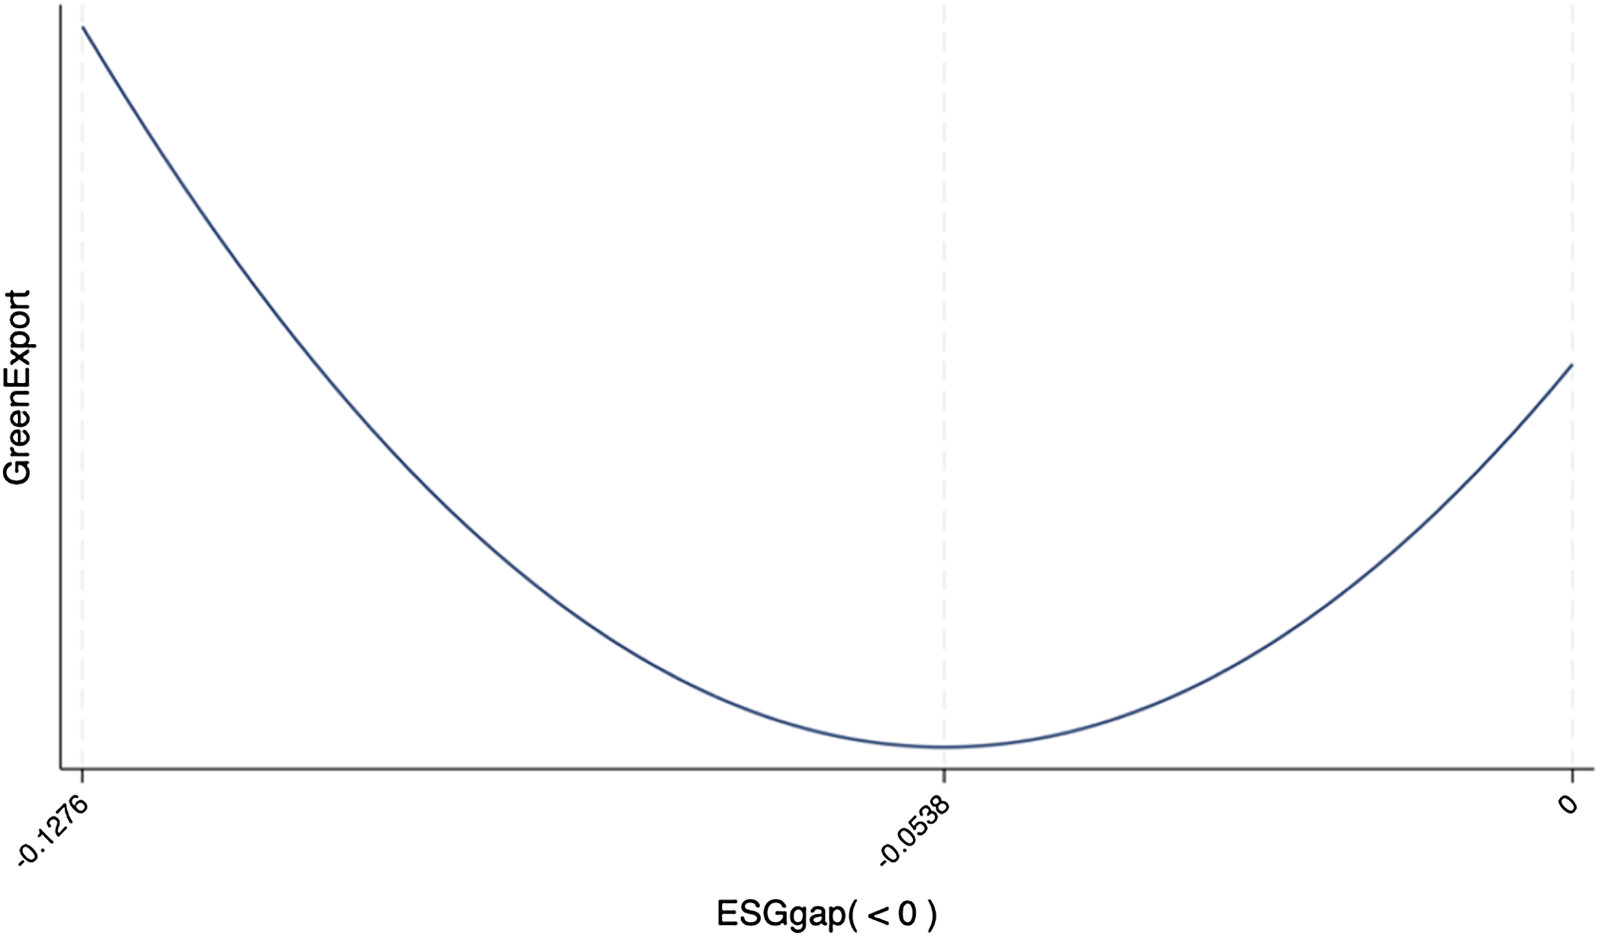
In the range (–0.2092, –0.1276), as the exporting country starts to catch up with the destination countries in terms of ESG performance, the share of green exports increases, but at a slower and slower pace until it reaches zero. This may be because when there is a large ESG gap (absolute value) between the exporting country and its destination, efforts by the exporting country to improve its ESG performance have significant marginal effects on green product exports. Such efforts can signal to the international market its commitment to better quality, leading to an increase in the share of green exports. However, the marginal effect tends to diminish as the impact of the signal weakens. By re-examining the samples, we find that only 3745 samples fall within the first interval (–0.2092, –0.1276), suggesting that this positive marginal effect is limited to cases where the exporting country’s ESG performance is significantly lower and does not represent the general trend. This means that the potential U-shaped relationship implied by the results in column (1) may more accurately reflect the mainstream effects of ESG gaps on green exports without estimation bias from ‘extreme values’. The regression results after removing 3745 outliers are shown in column (3). Both the coefficients of the quadratic and linear terms are significant at the 1% level. As in the ESGgap > 0 subsample, the PPML estimation is used to address the potential bias arising from the high proportion of zero values in GreenExport (29.92%) when ESGgap < 0. The result is shown in Table 9, Column (4) and remains consistent with the fixed effects estimation, with no change in the signs or significance of the estimated coefficient. To verify the U-shaped relationship, we add the cubic term again and the result is shown in column (5). The coefficient of the cubic term fails the significance test at the 10% level, indicating that, after excluding ‘extreme values’, we do not find evidence of a nonlinear relationship as characterized by the higher degree term. Following Lind and Mehlum (Reference Lind and Mehlum2010), we also perform a statistical test (U-test) on the possible U-shaped relationship. The calculated extreme point, –0.0537976, lies in the range (–0.1276, 0). The test rejects the null hypothesis of a monotonic or inverted U-shaped relationship at the 1% significance level. The Fieller interval for the extreme point at the 95% confidence level is [–0.08380788; –0.02418212]. So, hypothesis H4 is proved, as shown in Figure 4.
The economic interpretation of this U-shaped relationship is that in most trade flows where the ESG performance of the exporting country is lower than that of the destination country, short-term improvements may not immediately increase the comparative advantage of green products. This is because many green exporters face intense market competition due to high quality homogeneity as indicated by their ESG performance. That is, there are a large number of exporting countries with similar ESG performance offering green products, creating fierce competition. However, when the ESG performance gap narrows sufficiently, it suggests two things. First, the exporting country has made significant progress in the technology and quality of green products, reducing its comparative disadvantage. Second, a smaller ESG gap indicates a convergence of policies, requirements, and standards related to green products between two countries, facilitating smoother trade in these goods. As a result, closer alignment in ESG performance leads to a higher share of green product exports from the exporting country to the destination country.
The U-shaped economic relashoinship between GreenExport and negative ESGgap
5. Conclusions and Implications
This paper discusses the impact and mechanism of national ESG gaps on national green exports from a macroeconomic perspective, using bilateral trade data from 1996 to 2021 for 121 countries, totaling up to 271,656 observations. Our analysis proves that the ESG gap between exporting and destination countries significantly influences the share of green exports. First, when the exporting country has higher ESG performance, our results indicate that the more its ESG performance exceeds that of the destination country, the higher the comparative advantage of green products in the exporting country and the higher the proportion of green products exported to the destination country, i.e., a larger ESG gap promotes green exports. This basic conclusion remains robust to various tests. Second, this promotion effect diminishes as the environmental regulatory intensity of the destination country increases and is mainly driven by the widening of the green innovation gap. Finally, for exporting countries with lower ESG performance, we further investigate the nonlinear effects and find a U-shaped relationship between a negative ESG gap and green exports.
Compared to existing research, our study innovatively uses the bilateral ESG performance gap to measure the comparative advantage of green exports between countries. This approach highlights the crucial role of national ESG performance in capturing the international market for green products. Our findings underscore the importance of ESG concepts and provide robust economic evidence for the further promotion and development of ESG policies in the macroeconomy. It is important that governments around the world, while strongly promoting the development of ESG policies and practices in companies, also focus on promoting national ESG policies and practices under similar frameworks. By doing so, the limitations and controversies surrounding the ESG concept in microeconomics can be mitigated, more feasible ways to achieve sustainable development goals can be explored and proposed, and economic growth can be pursued in a greener way, especially in countries where national ESG performance receives more attention. We suggest the following implications.
According to the U-shaped relationship we demonstrate, short-term improvements in ESG performance may have little impact. Therefore, governments, especially in countries with lower ESG performance, should integrate comprehensive improvements in ESG performance into their long-term national development plans. This strategy can help gain competitive advantages in international trade, particularly in trade in green products, by improving national ESG performance across all dimensions.
Our findings suggest that the role of environmental regulations in green exports differs between high ESG exporters and low ESG importers, aligning with but also extending previous research on trade and environmental policies. Prior studies indicate that stringent environmental regulations can enhance green export competitiveness by stimulating green innovation and creating first-mover advantages (Fabrizi et al., Reference Fabrizi, Gentile, Guarini and Meliciani2024). However, our findings reveal that for high-ESG exporters, the benefits of stricter environmental regulations are insignificant, suggesting that additional regulatory tightening may not further enhance green export advantages. This finding contrasts with studies emphasizing the universal positive effect of environmental regulation on trade and suggests that countries with already high ESG performance should focus on regulatory harmonization and dynamic policy mechanisms rather than merely increasing regulatory stringency. First, they should lead global standard-setting efforts by aligning their environmental regulations with those of key trading partners. By establishing mutual recognition agreements for green certification and sustainable production standards, they can reduce trade barriers and create a regulatory advantage for green exports. Second, dynamic environmental regulations should be promoted. Rather than static emission limits, governments should adopt adaptive regulatory frameworks that encourage continuous improvement in sustainability performance. This can include market-based incentives, such as emissions trading schemes that reward companies for exceeding minimum compliance levels.
For low-ESG importers, our findings suggest that they can use environmental regulations to mitigate their comparative disadvantage in green products characterized by an ESG gap, albeit at the cost of higher green imports in the short run. Unlike previous research that primarily emphasizes the pollution-haven hypothesis, suggesting that lax environmental regulations provide a competitive advantage in trade (Millimet and Roy, Reference Millimet and Roy2016), our results indicate that strengthening environmental regulations can improve long-term competitiveness in green trade if accompanied by effective enforcement and complementary policies. First, they should strengthen enforcement and monitoring. Many low ESG countries suffer from weak enforcement of environmental laws. Governments should invest in compliance monitoring mechanisms, such as digital tracking of emissions, third-party audits, and public transparency initiatives, to ensure that new regulations are effectively implemented. Second, governments should use positive incentives to encourage compliance. Rather than relying solely on punitive measures, governments should implement reward-based mechanisms, such as tax breaks for companies that adopt cleaner technologies early, or public procurement programs that favor domestically produced green goods. Third, link environmental regulation to industrial policy. To avoid over-reliance on green imports, stricter regulations should be coupled with domestic industrial policies that support local green production. This includes targeted subsidies, research and development grants, and green technology transfer programs to ensure that domestic firms can meet new standards without excessive cost burdens.
Furthermore, our findings indicate that when ESGgap is positive, it promotes green exports by widening the green innovation capacity gap between the two countries. This is consistent with prior research showing that technological innovation plays a crucial role in shaping comparative advantage in green trade (Costantini and Mazzanti, Reference Costantini and Mazzanti2012). While high-ESG exporters benefit from their existing innovation edge, low-ESG importers risk increasing dependency on foreign green products unless they actively enhance their domestic innovation capabilities. Therefore, targeted policy measures are needed to ensure sustainable growth in green exports while promoting technology diffusion and innovation catch-up. First and foremost, green technology talents should be trained, and the cultivation plan and curriculum of relevant majors in colleges and universities should be optimized. In addition, the intellectual property rights of green technology must be firmly protected. The intellectual property department should streamline the patent application process for green technology and safeguard the legitimate rights and interests of green innovation achievements. These measures will improve the technical content and quality of green products, enabling countries to capture a larger share of the international market for green products. In addition to these macroeconomic recommendations for governments, it is also important to consider the actions that companies should take in response to national ESG policies. Companies should not only comply with their internal ESG requirements, but also adapt to and support national ESG policies. By investing in green innovation in line with national priorities and building resilient supply chains that meet ESG criteria, companies can strengthen their global competitiveness and contribute to improving the national ESG performance of their own countries.
Data Availability Statement
The data that support the findings of this study are openly available in Harvard Dataverse at https://doi.org/doi:10.7910/DVN/Y0UOPD.
Appendix: Three methods to measure the comparative advantage
There are three typical ways to measure the comparative advantage of an industry in trade. One is the ‘Revealed’ comparative advantage index (RCA) proposed by Balassa (Reference Balassa1965), which measures the ratio of the proportion of a certain type of export commodity in a country’s exports to the proportion of that product in the world’s total exports. The formula is as follows:Footnote 10
 \begin{equation}RCA =\frac{\dfrac{X_{it}}{\sum_{i}X_{it}}}{\frac{WX_{it}}{\sum_{i}WX_{it}}}\end{equation}
If the index is greater than 1, it means that the product has a ‘revealed’ comparative advantage. The second is the net export index (Balassa and Noland, Reference Balassa and Noland1989), which includes imports and is calculated as follows:
 \begin{equation}\begin{array}{*{20}{c}}
{NEX = \frac{{{X_{it}} - {M_{it}}}}{{{X_{it}} + {M_{it}}}}}
\end{array}\end{equation}
\begin{equation}\begin{array}{*{20}{c}}
{NEX = \frac{{{X_{it}} - {M_{it}}}}{{{X_{it}} + {M_{it}}}}}
\end{array}\end{equation}The value of NEX index is in the range of (− 1,1). The third is the index proposed by Michaely (Reference Michaely1962), which can be called the net exports revealed comparative advantage index (NERCA). It calculates the difference between the proportion of a certain product in a country’s exports and the proportion of that product in the country’s total imports:
 \begin{equation}\begin{array}{*{20}{c}}
{\begin{array}{*{20}{c}}
{NERCA = \frac{{{X_{it}}}}{{\mathop \sum \nolimits_i {X_{it}}}} - \frac{{{M_{it}}}}{{\mathop \sum \nolimits_i {M_{it}}}}}
\end{array}}
\end{array}\end{equation}
\begin{equation}\begin{array}{*{20}{c}}
{\begin{array}{*{20}{c}}
{NERCA = \frac{{{X_{it}}}}{{\mathop \sum \nolimits_i {X_{it}}}} - \frac{{{M_{it}}}}{{\mathop \sum \nolimits_i {M_{it}}}}}
\end{array}}
\end{array}\end{equation}







 Open access

