


Management Implications
This review offers valuable insights for policymakers, land managers, and conservationists seeking to mitigate and control the spread of Pteridium aquilinum (bracken fern). Using high-resolution remote sensing technologies, including unmanned aerial vehicles (UAVs), Worldview-2, and SPOT-5, will empower stakeholders to detect P. aquilinum infestations at an earlier stage with accuracy. Recognizing spread patterns promptly permits targeted management strategies to be implemented to prevent this species from becoming even more invasive. Developing standardized protocols for sensor selection, classification models, and accuracy assessments during P. aquilinum monitoring can ensure greater comparability across studies and regions, leading to more effective responses. Embracing AI-driven approaches, managers can refine detection methods and enhance predictive modeling for future spread scenarios, ensuring more robust strategies for control. It is essential to tailor remote sensing approaches to consider the unique environmental conditions and land-use practices of each region, maximizing effectiveness in diverse contexts. Fostering collaboration among researchers, government agencies, and conservation organizations, we can facilitate data sharing and enhance the availability of resources for effective monitoring programs. Therefore, policymakers must prioritize funding for advanced remote sensing applications and invest in capacity building for environmental monitoring teams, ensuring that we are well equipped to tackle this challenge. By addressing these pressing challenges and harnessing the latest technological advancements, land managers can enhance their control efforts against P. aquilinum, mitigate its ecological and economic impacts, and promote sustainable land management practices for a healthier ecosystem.
Introduction
Bracken fern [Pteridium aquilinum (L.) Kuhn] is a globally widespread weed species that exhibits invasive behavior in certain regions, causing substantial ecological, environmental, and economic impacts (Holland and Aplin Reference Holland and Aplin2013). It has been reported to invade and dominate disturbed habitats in the Southern Hemisphere and other non-native regions, including the Drakensberg in South Africa (Singh et al. Reference Singh, Forbes and Akombelwa2013) and Calakmul, Mexico (Schneider Reference Schneider2006). In its native range, such as parts of North America, the species is established but not considered invasive (Akomolafe and Rahmad Reference Akomolafe and Rahmad2018). Pteridium aquilinum has caused severe environmental impacts, including disrupting water distribution patterns (Department of Environment and Conservation 2012) and reducing optimal water supply, which threatens the ecological productivity of native plant species, especially in water-scarce regions (Matongera et al. Reference Matongera, Mutanga, Dube and Sibanda2017).
Pteridium aquilinum’s persistent underground root system enables rapid growth, causing indigenous plant species to struggle as it invades grazing pastures (Hamer et al. Reference Hamer, Potthast, Burneo and Makeschin2013; Maya- Elizarrarás and Schondube Reference Maya-Elizarrarás and Schondube2015; Odindi et al. Reference Odindi, Adam, Ngubane, Mutanga and Slotow2014; Sato et al. Reference Sato, Mashimo, Suzuki, Hirao, Takagi and Kanai2017). Due to its permanent underground system, farmlands are severely infested, and farmers may abandon the affected land (Singh et al. Reference Singh, Forbes and Akombelwa2013). Pteridium aquilinum is often found in disturbed areas, such as those affected by fire or land clearance (Singh et al. Reference Singh, Forbes and Akombelwa2013). Its rapid growth dominates these areas, suppressing the growth of other species and affecting biodiversity, which is crucial for ecosystem resilience to climate change (Bond et al. Reference Bond, Davies and Tuner2007; Schneider Reference Schneider2006; Schneider and Geoghegan Reference Schneider and Geoghegan2006). Pteridium aquilinum spreads rapidly, replacing essential crops such as corn (Zea mays L.) (Schneider and Fernando Reference Schneider and Fernando2010) and other plants that help stabilize the soil, increasing soil erosion susceptibility, especially on slopes (Schneider Reference Schneider2006). The expansion of P. aquilinum across global landscapes threatens the future sustainability of agriculture (Wulder and Franklin Reference Wulder and Franklin2012), productivity (Berget et al. Reference Berget, Duran and Bray2015), recreation potential, and forestry (Ssali et al. Reference Ssali, Moe and Sheil2017). Pteridium aquilinum contains several toxic compounds, such as ptaquiloside and carcinogens, which can affect both human (Smith and Seawright Reference Smith and Seawright1995) and animal health when ingested (Senyanzobe et al. Reference Senyanzobe, Mulei, Bizuru, Books, Oer and Scarda2016).
Before the widespread use of high-resolution satellite imagery, P. aquilinum was mapped through a combination of ground-based field surveys (Bunce et al. Reference Bunce, Howard, Hallam, Barr and Benefield1992; Pakeman et al. Reference Pakeman, Marrs and Jacob1994, Reference Pakeman, Marrs, Howard, Barr and Fuller1996), aerial photography (Tong et al. Reference Tong, Le Duc, Ghorbani and Marrs2006), and modeling approaches (Pakeman et al. Reference Pakeman, Marrs and Jacob1994). Ground surveys involved physically traversing the study areas to visually identify and record the presence of P. aquilinum. Although these surveys provided detailed and often highly accurate local information, they were time-consuming, labor-intensive, and limited in area coverage (Kamagata et al. Reference Kamagata, Hara, Mori, Akamatsu, Li and Hoshino2006). Aerial photography allowed broader spatial coverage without the need for continuous ground access, but its effectiveness depended on image resolution, seasonal timing, and interpretation accuracy. Modeling approaches enabled the prediction of distribution patterns based on environmental variables; however, their reliability was heavily influenced by input data quality and model assumptions.
Despite methodological advances, especially in ground-based methods, these approaches remain labor-intensive and less suitable for capturing large-scale temporal distribution changes (Matongera et al. Reference Matongera, Mutanga, Dube and Lottering2016). In contrast, remote sensing technologies, including satellite and airborne sensors, provide multi-temporal and large-scale monitoring capabilities that overcome many of these spatial and temporal limitations (Matongera et al. Reference Matongera, Mutanga, Dube and Lottering2016). Remote sensing allows for rapid and efficient mapping of large areas (Merchant Reference Merchant2000), providing a comprehensive view of P. aquilinum distribution across landscapes. Many studies have employed low to medium spatial-resolution satellite imagery to identify the spatial and temporal patterns of P. aquilinum. However, the use of medium-resolution imagery in detecting and mapping P. aquilinum has been limited by insufficient spatial and spectral capabilities (Matongera et al. Reference Matongera, Mutanga, Dube and Sibanda2017; Odindi et al. Reference Odindi, Adam, Ngubane, Mutanga and Slotow2014). With the advent of new sensors offering high spatial resolution, it is now possible to detect P. aquilinum more accurately, enhancing mapping and monitoring results (Ngubane Reference Ngubane2014). Although remote sensing has facilitated significant progress in P. aquilinum mapping through various techniques, challenges still exist in accurately detecting and analyzing its distribution.
Several reviews examined different aspects of P. aquilinum, focusing primarily on its ecological impacts, toxicity, invasion dynamics, and management. McGlone et al. (Reference McGlone, Wilmshurst and Leach2005) explored the historical spread and ecological challenges of P. aquilinum in New Zealand, including its cultural significance. Burge and Kirkwood (Reference Burge and Kirkwood1992) evaluated the economic and practical challenges associated with controlling P. aquilinum and reviewed progress in developing viable management strategies. Mehltreter et al. (Reference Mehltreter, Walker and Sharpe2010) assessed the ecological aspects of P. aquilinum, highlighting the problems associated with the fern and its management strategies. Similarly, Akomolafe and Rahmad (Reference Akomolafe and Rahmad2018) reviewed fern invasions, focusing on the underlying mechanisms driving these invasions and the documented management strategies for invasive ferns. Toxicological and health-related aspects have also received attention: Vetter (Reference Vetter2009) examined the biological effects of P. aquilinum on both ruminant and non-ruminant animals, while O’Connor et al. (Reference O’Connor, Alonso-Amelot, Roberts and Povey2019) investigated the ecological carcinogenicity of illudane-type compounds and potential human exposure risks. More recently, da Costa et al. (Reference da Costa, Povey, Medeiros-Fonseca, Ramwell, O’Driscoll, Williams, Hansen, Rasmussen, Fletcher, O’Connor and Bradshaw2024) reviewed environmental contamination caused by P. aquilinum toxins and their implications for animal and human health. Collectively, these reviews emphasize the ecological, physiological, toxicological, and management dimensions of the species.
In contrast, fewer reviews have focused specifically on remote sensing applications for detecting and mapping P. aquilinum. Matongera et al. (Reference Matongera, Mutanga, Dube and Lottering2016) provided one of the first syntheses of remote sensing approaches for mapping P. aquilinum, summarizing sensor types, classification techniques, spatial scales, and reported accuracy up to that time. Since then, advances in high-resolution satellite imagery and machine learning–based classification methods have expanded the methodological tool kit for large-scale and multi-temporal mapping (Matongera et al. Reference Matongera, Mutanga and Sibanda2021; Mkungo et al. Reference Mkungo, Odindi, Mutanga and Matongera2023).
Building on these earlier efforts, the present study provides an updated and comprehensive synthesis of remote sensing–based P. aquilinum mapping research. Specifically, it analyzes publication trends, geographic distribution of studies, contributing authors and journals, sensor types, classification algorithms, spatial scales, and reported mapping accuracies. Furthermore, it identifies methodological challenges and emerging research directions to guide future monitoring and management efforts.
Review of Methods
A bibliometric analysis was conducted to examine how P. aquilinum has been mapped using remote sensing by analyzing peer-reviewed articles. This analysis aimed to identify research trends, future directions, patterns, challenges, and gaps in existing studies. Understanding the current knowledge base helps guide research by revealing the remote sensing techniques most used for P. aquilinum detection. This study reviews peer-reviewed articles published between 1996 and 2023, using Web of Science (WOS) and Scopus databases, selected for their comprehensive coverage of remote sensing literature and robust citation-tracking capabilities (Anker et al. Reference Anker, Hadzibegovic, Lena and Haverkamp2019). These features make them suitable tools for detecting emerging research trends and identifying influential publications (Burnham Reference Burnham2006; Falagas et al. Reference Falagas, Pitsouni, Malietzis and Pappas2008).
The search terms were developed through an iterative process to ensure comprehensiveness and reproducibility. First, a preliminary scoping search was conducted to identify commonly used terminology in relevant articles. Keywords were then grouped into four conceptual categories reflecting the core components of the study: (1) species identification, (2) remote sensing technologies, (3) mapping and analytical approaches, and (4) invasion-related processes. Synonyms and related terms were compiled from the titles, abstracts, and author keywords of highly cited papers, as well as from standard terminology used in the remote sensing and invasion ecology literature. The Boolean operators “AND” and “OR” were used to refine the search results. The final search string applied to titles and abstracts was: (“bracken” OR “bracken fern” OR “eagle fern” OR “Pteridium aquilinum” OR “Pteridium” OR “Pteridium spp.”) AND (“remote sensing” OR “satellite” OR “satellite imagery” OR “satellite data” OR “earth observation” OR “geospatial” OR “GIS” OR “geographic information system” OR “UAV” OR “drone” OR “unmanned aerial vehicle” OR “airborne imagery”) AND (“mapping” OR “map” OR “detection” OR “monitoring” OR “classification” OR “segmentation” OR “identification” OR “distribution” OR “habitat modelling” OR “species distribution modelling” OR “SDM” OR “occurrence”) AND (“invasive” OR “invasion” OR “spread” OR “proliferation” OR “expansion” OR “encroachment” OR “coverage” OR “colonization” OR “weed”).
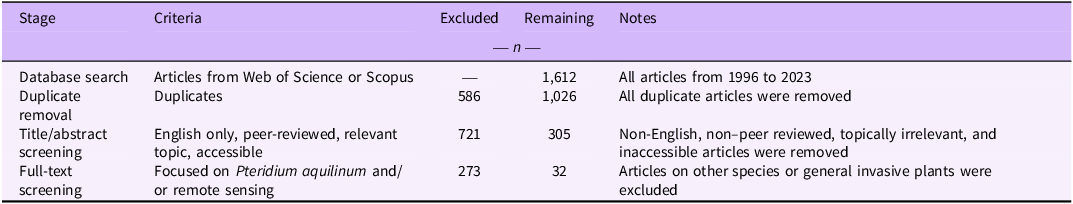
Records were retrieved from the WOS (n = 775) and Scopus (n = 837) databases, yielding a total of 1,612 records published between 1996 and 2023. All identified records were exported to reference management software, where 586 duplicate records were removed, leaving 1,026 unique articles. Title and abstract were independently screened by RM and SAA using predefined inclusion and exclusion criteria (Table 1).
Summary of literature selection process for studies on the remote sensing of bracken fern (Pteridium aquilinum), including criteria applied and number of records excluded and retained at each stage of screening.

Discrepancies were resolved through discussion and consensus. For this review, “remote sensing” was defined as the acquisition of environmental information without direct physical contact through satellite-based, airborne, or unmanned aerial vehicle (UAV)-mounted sensors. Eligible technologies included multispectral and hyperspectral satellite imagery, airborne imagery, UAV imagery, light detection and ranging (LiDAR), and other Earth observation platforms. Studies relying solely on ground-based surveys, global positioning system (GPS) mapping, or purely statistical species distribution modeling without remotely sensed input data were excluded. During this stage, 721 records were excluded because they were not written in English, were not peer-reviewed, were topically irrelevant, or were inaccessible in full text. Articles were considered relevant if they explicitly used remotely sensed data as a primary component for detecting, mapping, classifying, or monitoring P. aquilinum distribution. Studies were classified as irrelevant if remote sensing terminology was mentioned, but no remotely sensed data were used in the analysis, or if the focus was exclusively ecological, toxicological, or management-related without a spatial mapping component. The remaining 305 articles were subjected to full-text screening, which was conducted by AJVdW, CMJ, and OSD. Articles were excluded if they did not focus on P. aquilinum or were unrelated to remote sensing applications, resulting in 273 exclusions.
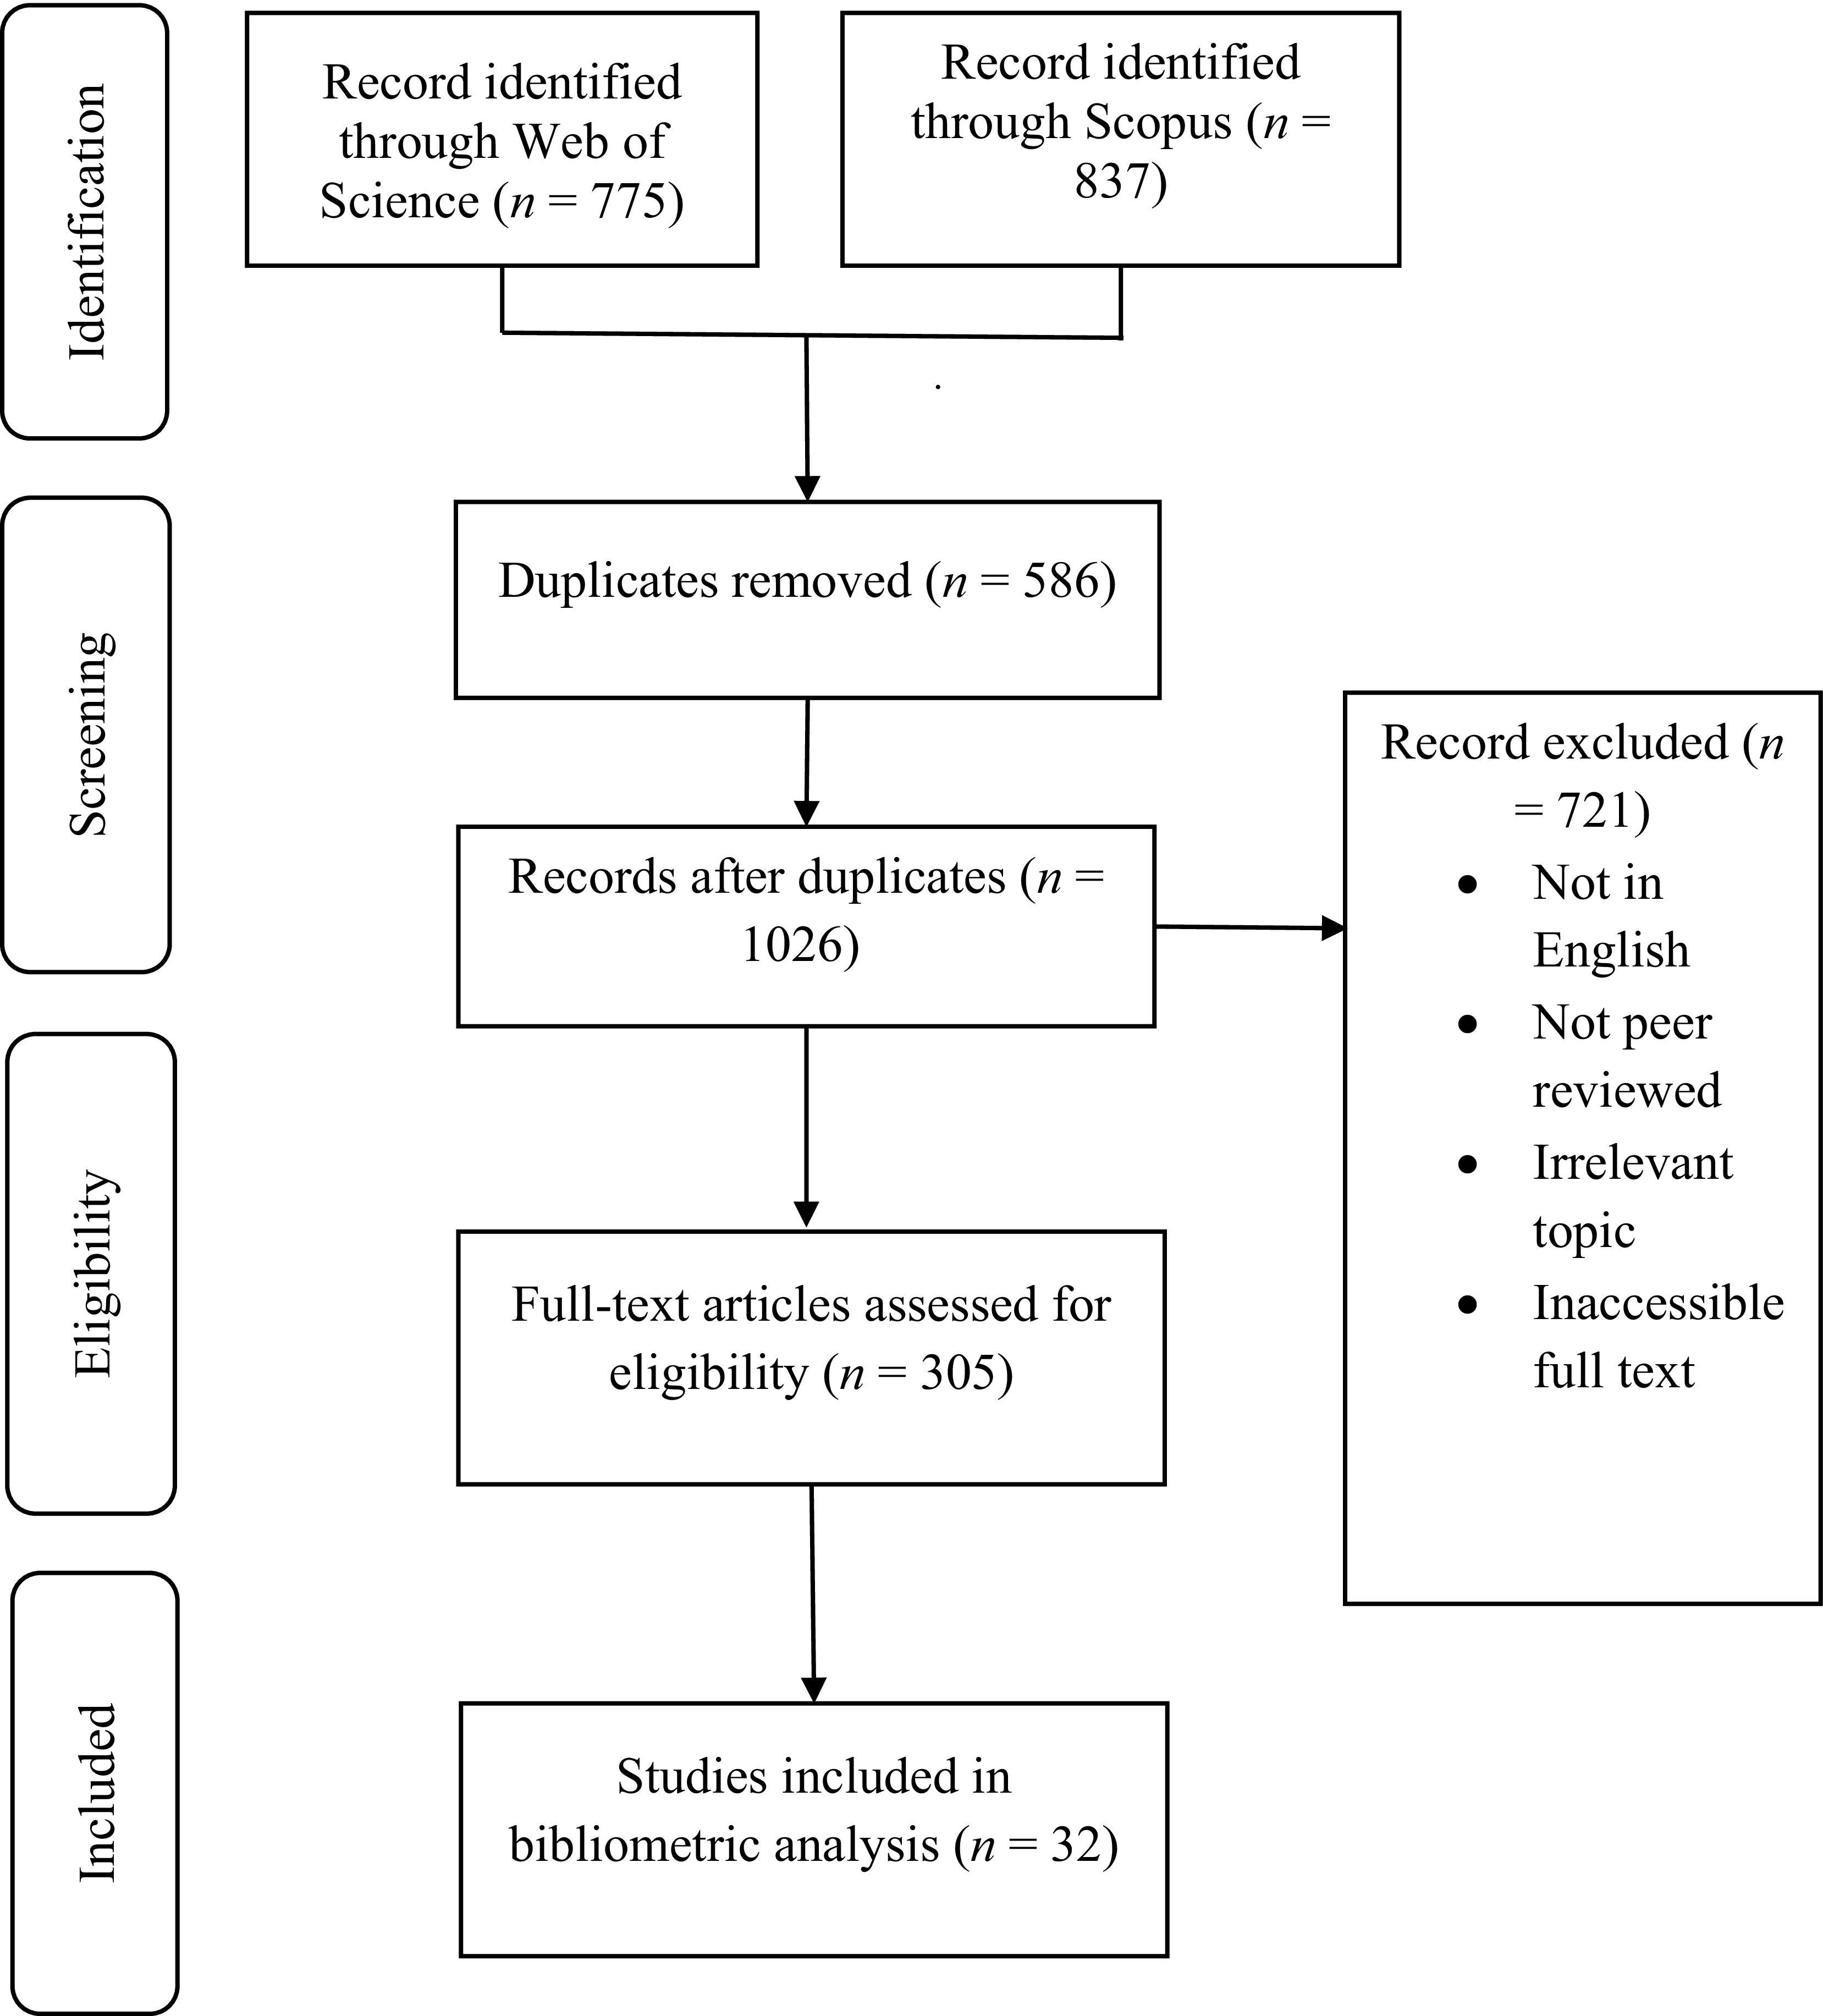
Boundary cases were evaluated during full-text screening. Studies combining field surveys with remotely sensed imagery were included only when remotely sensed data formed a central methodological component. GIS-only analyses without the incorporation of remotely sensed imagery were excluded. A total of 32 articles met all inclusion criteria and were retained for the bibliometric analysis. The selection process is summarized in Figure 1 (PRISMA flow diagram). Metadata from the 32 studies were exported in BibTeX format and analyzed using VOSviewer (v. 1.6.20).
PRISMA flow diagram summarizing the number of records (n) identified, screened, assessed for eligibility, and included in the bibliometric analysis.

A keyword co-occurrence analysis was conducted on author keywords, titles, and abstracts using the full-counting method. Synonyms were merged, and a minimum occurrence threshold of two was applied. For the keyword analysis, review-specific keywords refer to standardized thematic terms assigned during preprocessing to ensure conceptual consistency across studies. Author-provided keywords and terms extracted from titles and abstracts were compiled and manually screened. Synonymous or closely related terms (e.g., “UAV” and “drone”; “satellite imagery” and “satellite data”) were merged into unified categories using a controlled vocabulary developed by the authors. Keywords were then grouped into thematic clusters reflecting sensor type, analytical method, spatial scale, and application focus. This standardization reduced fragmentation in the co-occurrence network and improved the interpretability of the bibliometric maps.
Coauthorship, institutional collaboration, and co-citation social network analysis (SNA) were also visualized. The distance between nodes in the maps represents the strength of their association. Impact factors (IF) were obtained from Journal Citation Reports (Clarivate 2023), and citation indices (CI) from Scopus. The SNA method is widely used to analyze and visualize bibliometric data connections and trends (de Souza et al. Reference de Souza, Ribeiro, de, Corrêa and Carvalho2024). In visualization of similarities (VOS) mapping, the distance between two elements represents the strength of their relationship—a shorter distance indicates a stronger connection (van Eck and Waltman Reference van Eck and Waltman2010).
Content Analysis
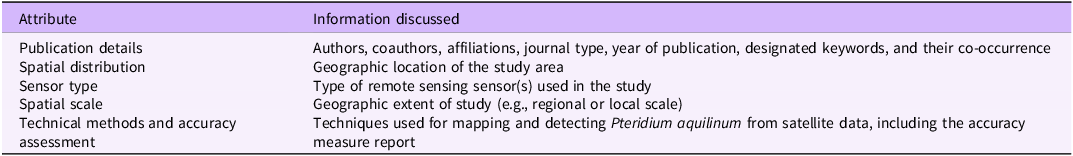
A set of attributes, as outlined in Table 2, was extracted from the 32 selected publications. Key details recorded include bibliographic information such as authors, coauthors, their affiliations, journal type, and year of publication. In addition to the keywords provided in the articles, we assigned review-specific keywords to facilitate the identification of thematic research trends and relationships between the studies. The spatial distribution of each study was noted, specifying the country where the research was conducted. Additionally, the geographic extent of the study, categorized as either regional or local, was recorded. The study also documented the types of sensors used, including their names and specifications. Finally, the image processing techniques used to detect P. aquilinum were analyzed, along with the accuracy assessment methods and the reported accuracy levels.
Information extracted from the literature on bracken fern (Pteridium aquilinum) mapping using remote sensing.

Results and Discussion
Annual Trends of Scientific Publications of Pteridium aquilinum Mapping Using Remote Sensing
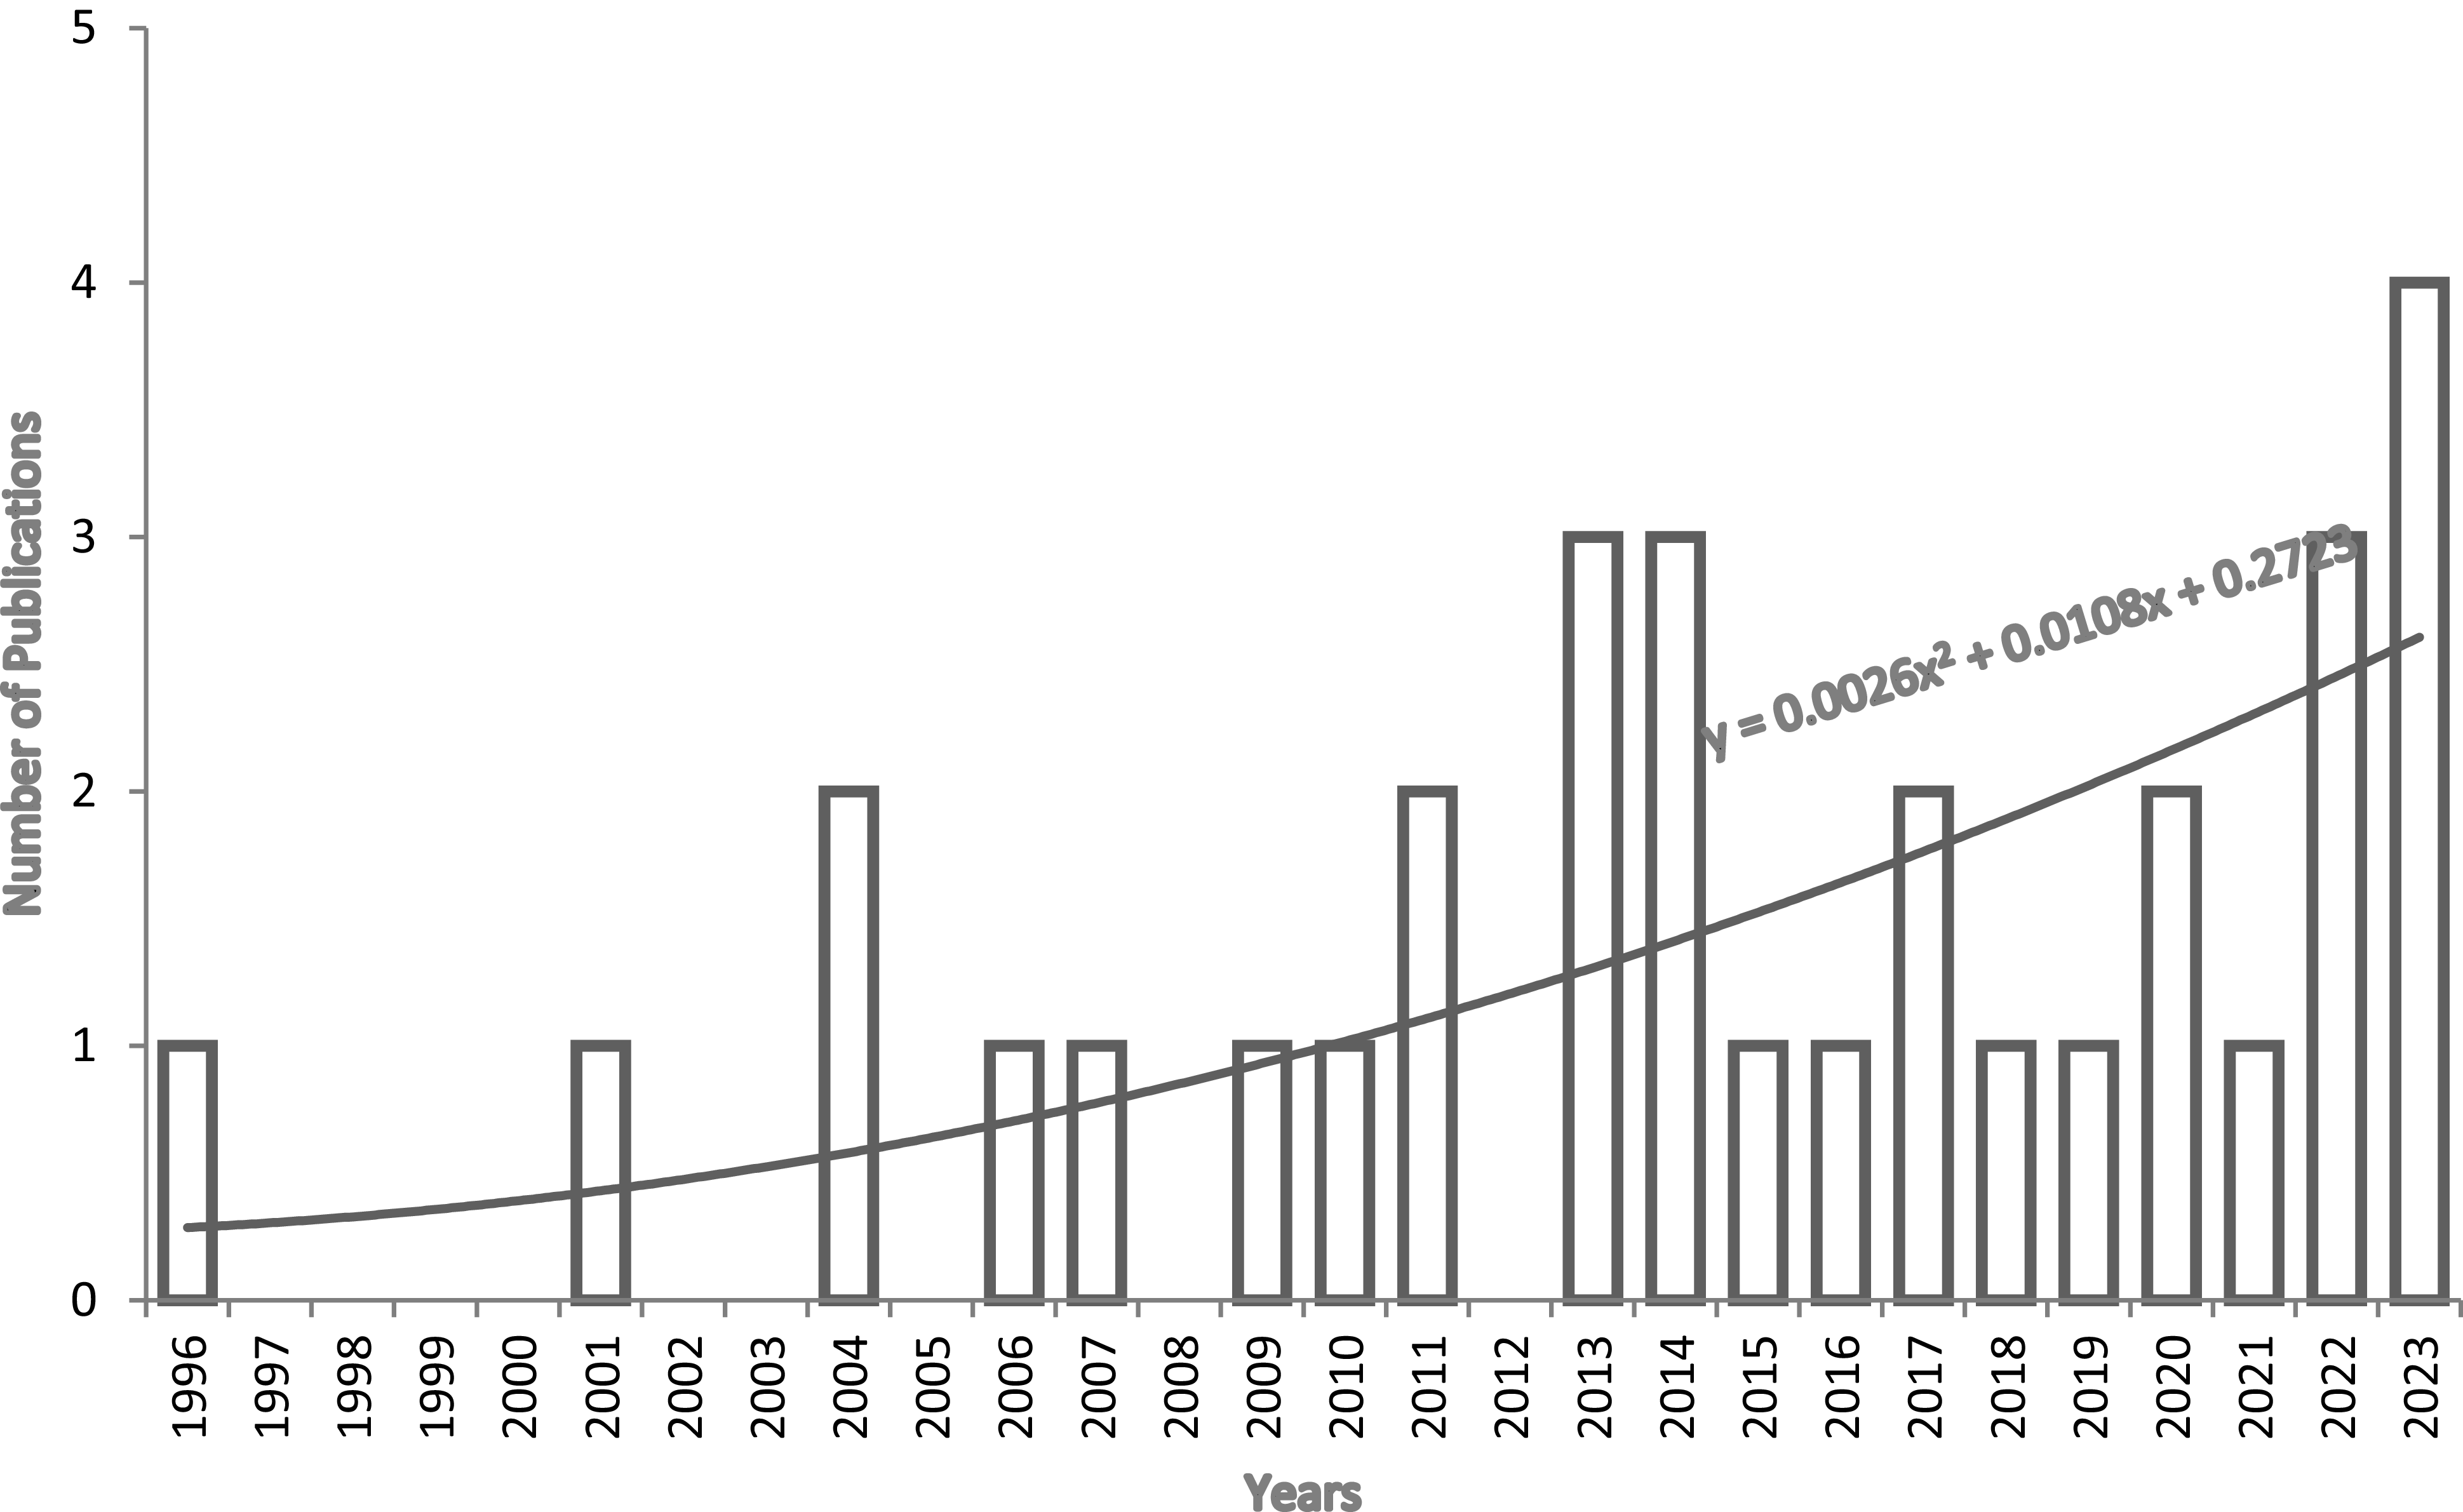
The first study to map P. aquilinum using remote sensing was published in 1996 (Pakeman et al. Reference Pakeman, Marrs, Howard, Barr and Fuller1996), marking the beginning of research in this field (Figure 2). Between 1996 and 2012, publication output was low and inconsistent, with no relevant studies in several years (e.g., 1997 to 2000, 2002 to 2003, 2005, 2008, 2012). The early period yielded fewer than one article per year, likely due to competing research priorities, limited funding, and the absence of remote sensing technologies optimized for P. aquilinum detection. From 2013 onward, research activity increased, reflecting growing interest in applying remote sensing to invasive species mapping. This surge coincided with the launch of Landsat 8 (2013), which provided enhanced spectral bands for vegetation monitoring, and Sentinel-2 (2015), which offered higher spatial resolution and open access data. The availability of UAV-based high-resolution imagery and advances in machine learning (ML) and artificial intelligence (AI) for vegetation classification further supported this growth (Matongera et al. Reference Matongera, Mutanga, Dube and Lottering2016). A peak in 2017 suggests intensified adoption of these technologies, with improved classification accuracy and broader recognition of P. aquilinum as an ecological concern.
Temporal distribution of peer-reviewed publications that applied remote sensing techniques to map bracken fern (Pteridium aquilinum) from 1996 to 2023. The bars represent the number of publications per year, showing the growth of research interest over time. The solid curve indicates a fitted polynomial trend line (second order), described by the equation y = 0.0026x 2 + 0.0108x + 0.2773, which highlights a gradual increase in publication output, particularly after 2010.

Trends in Journal Publications on Pteridium aquilinum Detection and Mapping
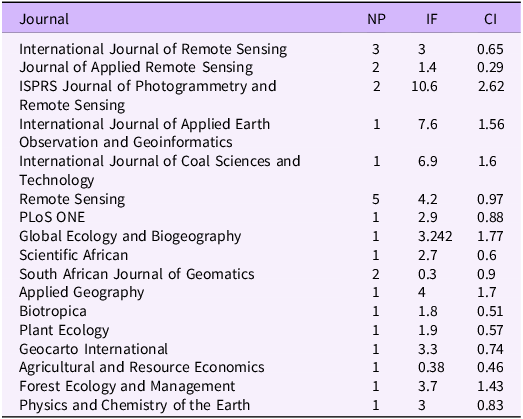
Between 1996 and 2023, studies on P. aquilinum mapping using remote sensing were published across a variety of journals, reflecting the cross-disciplinary relevance of this research (Table 3). Remote Sensing published the highest number of articles (NP = 5), followed by the International Journal of Remote Sensing (NP = 3). At the same time, journals such as the ISPRS Journal of Photogrammetry and Remote Sensing and the Journal of Applied Remote Sensing each contributed two publications. Despite this, journal output did not always correspond to a higher impact factor (IF) or citation index (CI). For instance, Remote Sensing (IF = 4.2, CI = 0.97) published the most articles but had lower impact metrics compared with the ISPRS Journal of Photogrammetry and Remote Sensing (IF = 10.6, CI = 2.62). Similarly, the International Journal of Applied Earth Observation and Geoinformatics published only one article but ranked high in both IF (7.6) and CI (1.56).
Journals publishing studies on mapping of bracken fern (Pteridium aquilinum) using remote sensing techniques (1996–2023), including the number of publications (NP), impact factor (IF), and citation index (CI).

These patterns indicate that although remote sensing journals account for most publications, higher citation indices were observed in several non–remote sensing journals, including Global Ecology and Biogeography, Applied Geography, and Forest Ecology and Management, suggesting greater academic influence despite fewer publications. Regional interest is also evident—for example, the South African Journal of Geomatics published two articles despite a low IF (0.3), likely reflecting localized research emphasis. A small number of studies also appeared in interdisciplinary journals such as PLoS ONE (IF = 2.9, CI = 0.88), Global Ecology and Biogeography (IF = 3.24, CI = 1.77), and Agricultural and Resource Economics (IF = 0.38, CI = 0.46), underscoring the diverse applicability of remote sensing for P. aquilinum monitoring across ecological, agricultural, and geoinformatics domains.
Examined Topics, Author Keywords, Relationships, and Their Co-occurrence
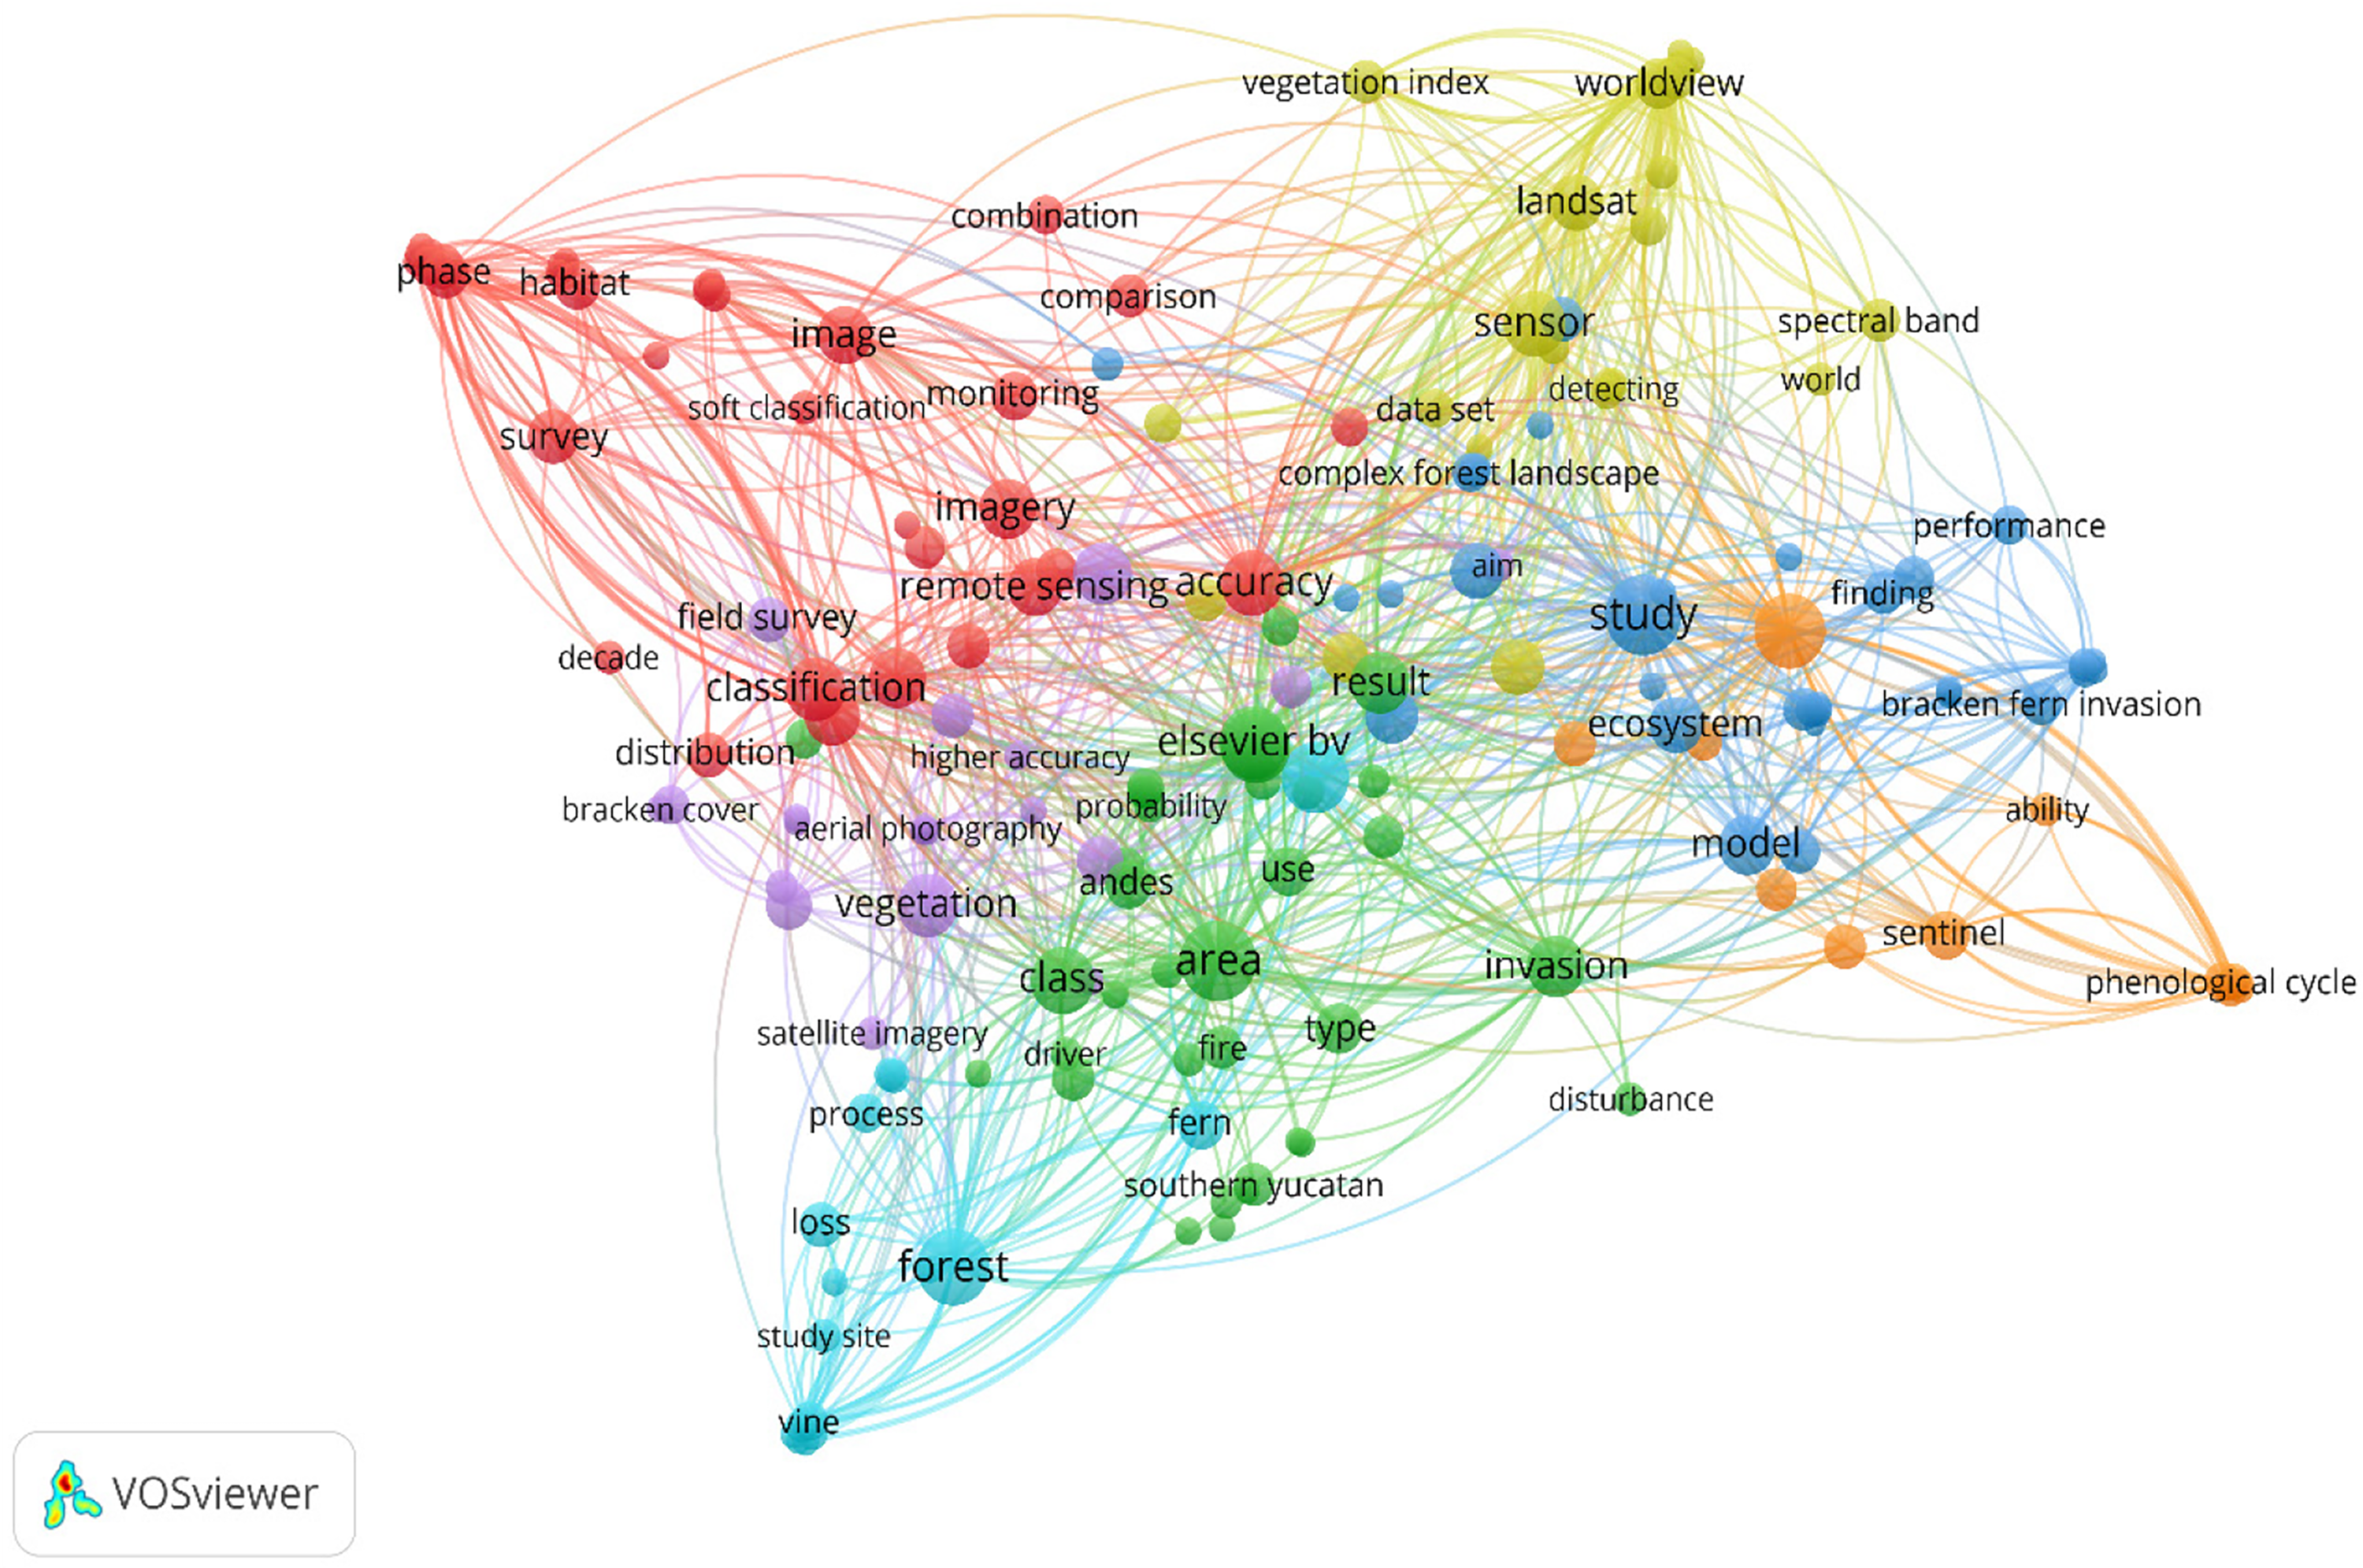
The keyword co-occurrence analysis (Figure 3), conducted using VOSviewer, reveals the main research themes in P. aquilinum mapping with remote sensing. The most frequent keywords, “remote sensing” and “bracken fern,” reflect their central role in the field. Other common terms include “vegetation,” “encroachment,” and “global distribution,” highlighting ecological and environmental concerns associated with P. aquilinum invasion. The presence of terms such as “satellite,” “accuracy,” and “classification” indicates the methodological emphasis of the field, particularly on image classification procedures and accuracy assessment practices commonly applied in remote sensing studies, rather than directly demonstrating technological progress. Over time, the expansion of keywords suggests increased diversification of analytical approaches, including supervised and ML classification methods, as well as the use of higher-resolution satellite and UAV platforms. This pattern reflects methodological refinement in detection and mapping workflows rather than a linear technological shift. While keywords such as “land use,” “climate change,” and “biodiversity” appear in the network (Matongera et al. Reference Matongera, Mutanga and Sibanda2021; Royimani et al. Reference Royimani, Mutanga and Dube2019), their occurrence indicates that some studies situate P. aquilinum within broader environmental contexts. However, terms related to vegetation encroachment and distribution patterns primarily reflect invasion ecology and landscape dynamics and should not be interpreted as synonymous with global environmental change. Instead, they highlight the spatial processes associated with species spread and habitat transformation.
Keyword co-occurrence network of publications on the mapping of bracken fern (Pteridium aquilinum) using remote sensing techniques. Each node represents an author keyword, and the node size indicates the frequency of occurrence of that keyword in the analyzed publications. The links between nodes represent co-occurrence relationships, where keywords appear together in the same article. Different colors denote clusters of keywords that frequently co-occur, indicating major thematic areas of research focus within this field. The visualization was generated using VOSviewer.

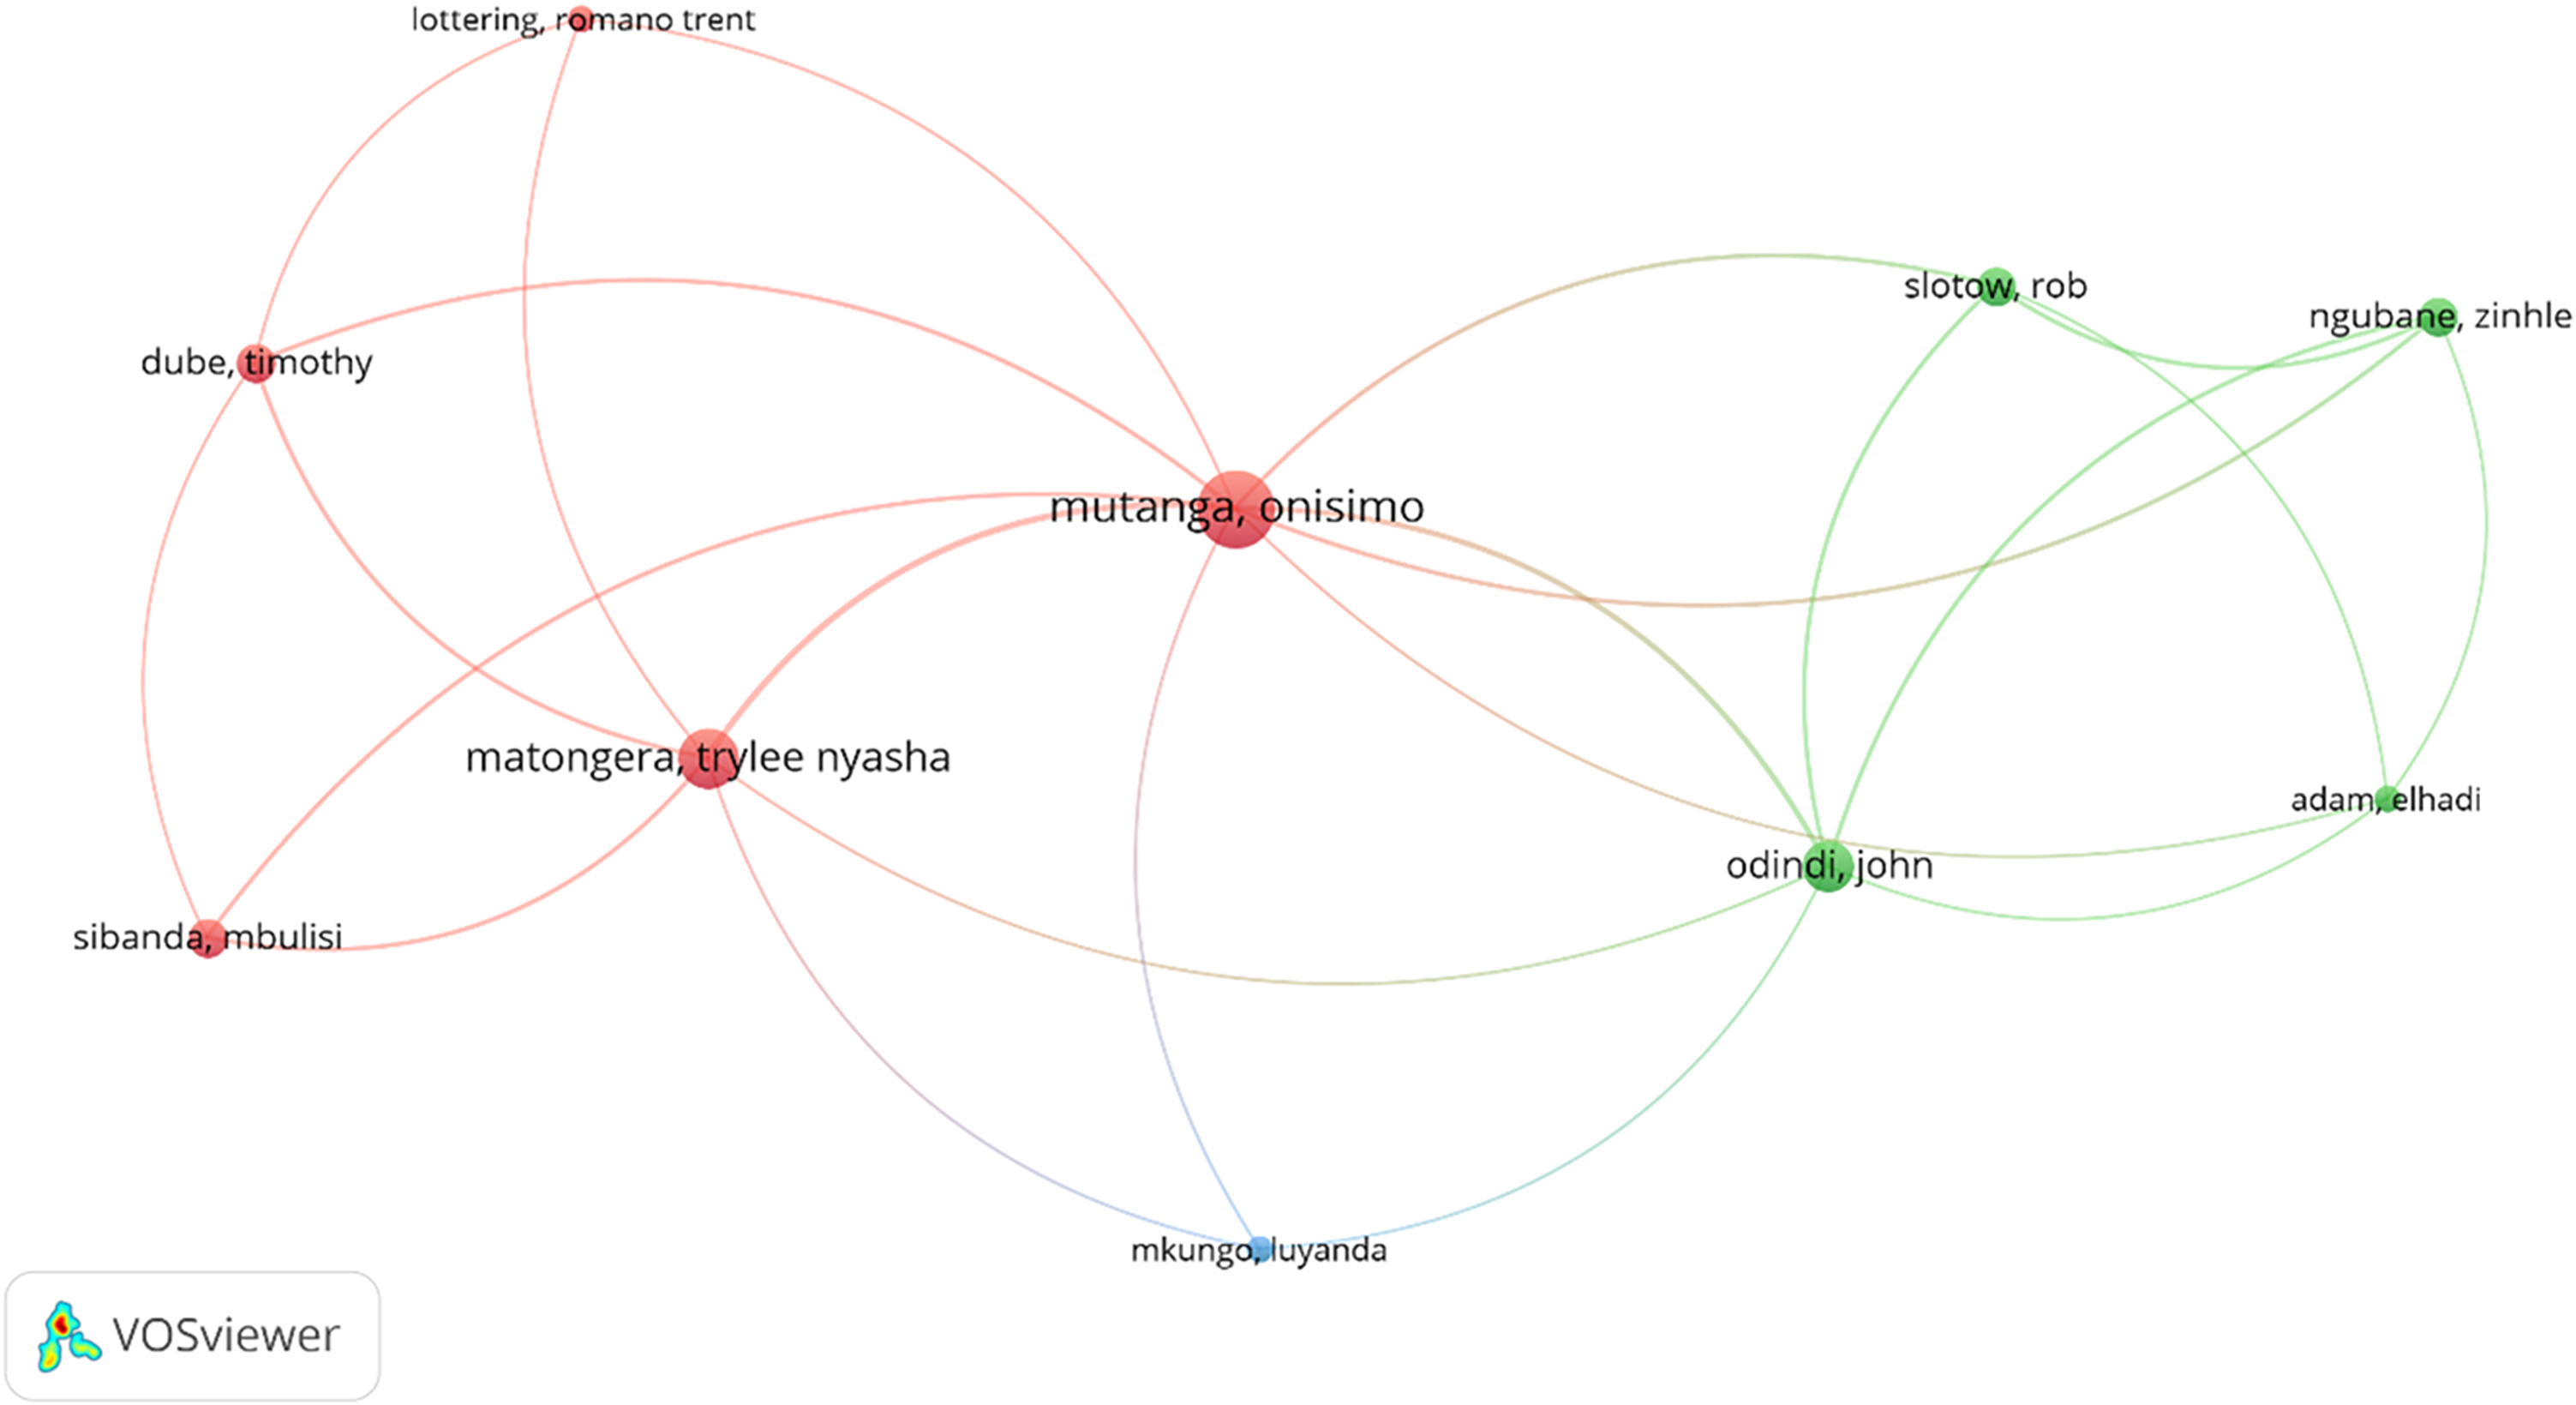
Keyword clustering further shows strong associations between P. aquilinum and environmental change, particularly vegetation encroachment and distribution patterns, reflecting increasing research emphasis on the species’ ecological consequences. Authorship analysis (Figure 4) reveals that Onisimo Mutanga and Trylee Nyasha Matongera are the frequently cited authors, each collaborating with five other researchers. Their significant contribution to methodological advancements in remote sensing–based P. aquilinum mapping underscores their academic influence. However, collaborative strength does not always correspond to publication volume; while some researchers prioritize coauthorship and networking, others focus on independent contributions. The interconnectedness of citations and coauthorship patterns highlights the collaborative and multidisciplinary nature of this research domain, where joint expertise is driving advances in vegetation monitoring, classification techniques, and methodological innovation.
Relationship between the most cited authors in publications of mapping bracken fern (Pteridium aquilinum) using remote sensing techniques. Each node represents an author, and the node size indicates the number of publications or citations associated with that author. The links (edges) between nodes represent coauthorship relationships, with thicker links showing stronger collaboration. Different colors denote clusters of authors who frequently co-publish together, indicating distinct collaborative groups within the research community. The visualization was generated using VOSviewer.

Lead Author Affiliation and the Country of Publication
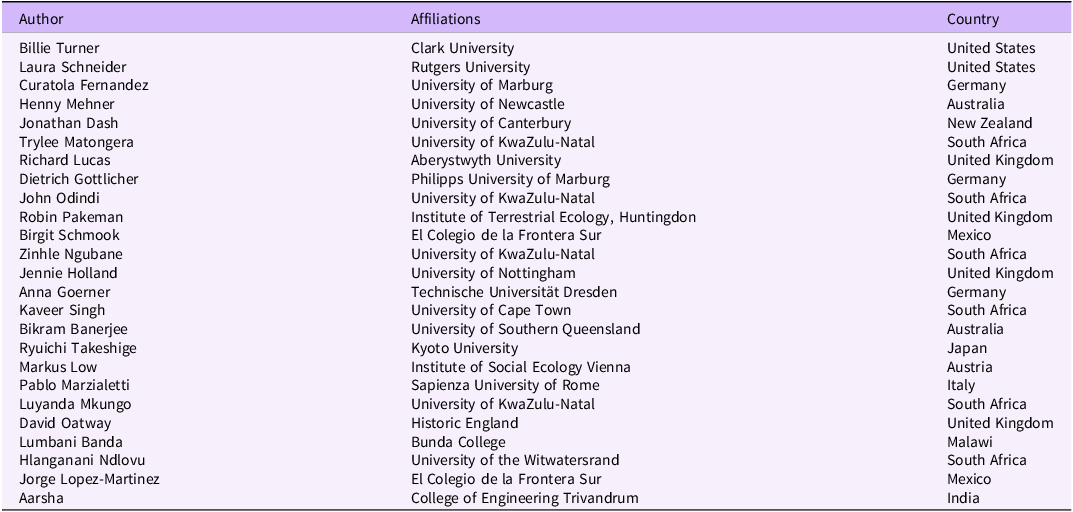
Research on mapping P. aquilinum using remote sensing reflects broad geographic participation, with contributions spanning North America, Europe, Africa, Australia, Asia, and Latin America (Table 4). The United States, the United Kingdom, Germany, South Africa, and Mexico account for a substantial proportion of the published studies, indicating sustained research activity in these regions. Several institutions appear repeatedly across the dataset, including universities in South Africa (e.g., University of KwaZulu-Natal [UKZN], the University of Cape Town, and the University of the Witwatersrand). Similarly, Germany includes affiliations with the University of Marburg and Technische Universität Dresden, while the United Kingdom includes Aberystwyth University, the University of Nottingham, and Historic England. Mexico is represented by authors affiliated with El Colegio de la Frontera Sur. Other countries, including Australia, New Zealand, Japan, Austria, India, and Malawi, are represented by single institutions or individual contributions. This pattern suggests that while research activity is internationally distributed, a limited number of institutions account for the majority of the sustained output.
Institutional affiliation and countries of lead authors in publications mapping bracken fern (Pteridium aquilinum) using remote sensing techniques.

Given the relatively small number of total publications in this field, authorship patterns should be interpreted cautiously. Many contributors appear in only one study, limiting the ability to conclude long-term research leadership or productivity. Furthermore, authorship order varies across disciplines and research groups and does not necessarily reflect project leadership or funding roles.
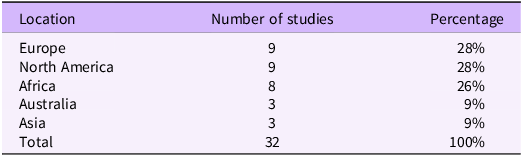
Spatial Distribution of Study Areas in Pteridium aquilinum Research
The spatial distribution of research on P. aquilinum mapping using remote sensing shows clear regional patterns (Table 5; Figure 5). Europe and North America each make up 28% of the studies, reflecting their advanced remote sensing infrastructure and long-standing commitment to environmental monitoring through agencies such as the European Space Agency (ESA) and the National Aeronautics and Space Administration (NASA). The presence of well-established academic institutions in these regions, along with early adoption of satellite-based technologies, has helped the investigation of P. aquilinum in temperate ecosystems where the species is widespread. Africa accounts for 26% of global studies, with South Africa leading as a major contributor (seven publications). This regional focus highlights Africa’s growing research capacity in universities such as the University of KwaZulu-Natal and the University of Cape Town. However, contributions from other African countries are still limited. The uneven distribution of studies within Africa may be due to differences in invasion severity, national research funding, and access to remote sensing resources. Because of P. aquilinum’s effects on biodiversity, agriculture, and land use, research on this species in Africa is expected to increase (Matongera Reference Matongera2016).
Geographic distribution of studies mapping bracken fern (Pteridium aquilinum) mapping studies using remote sensing techniques.

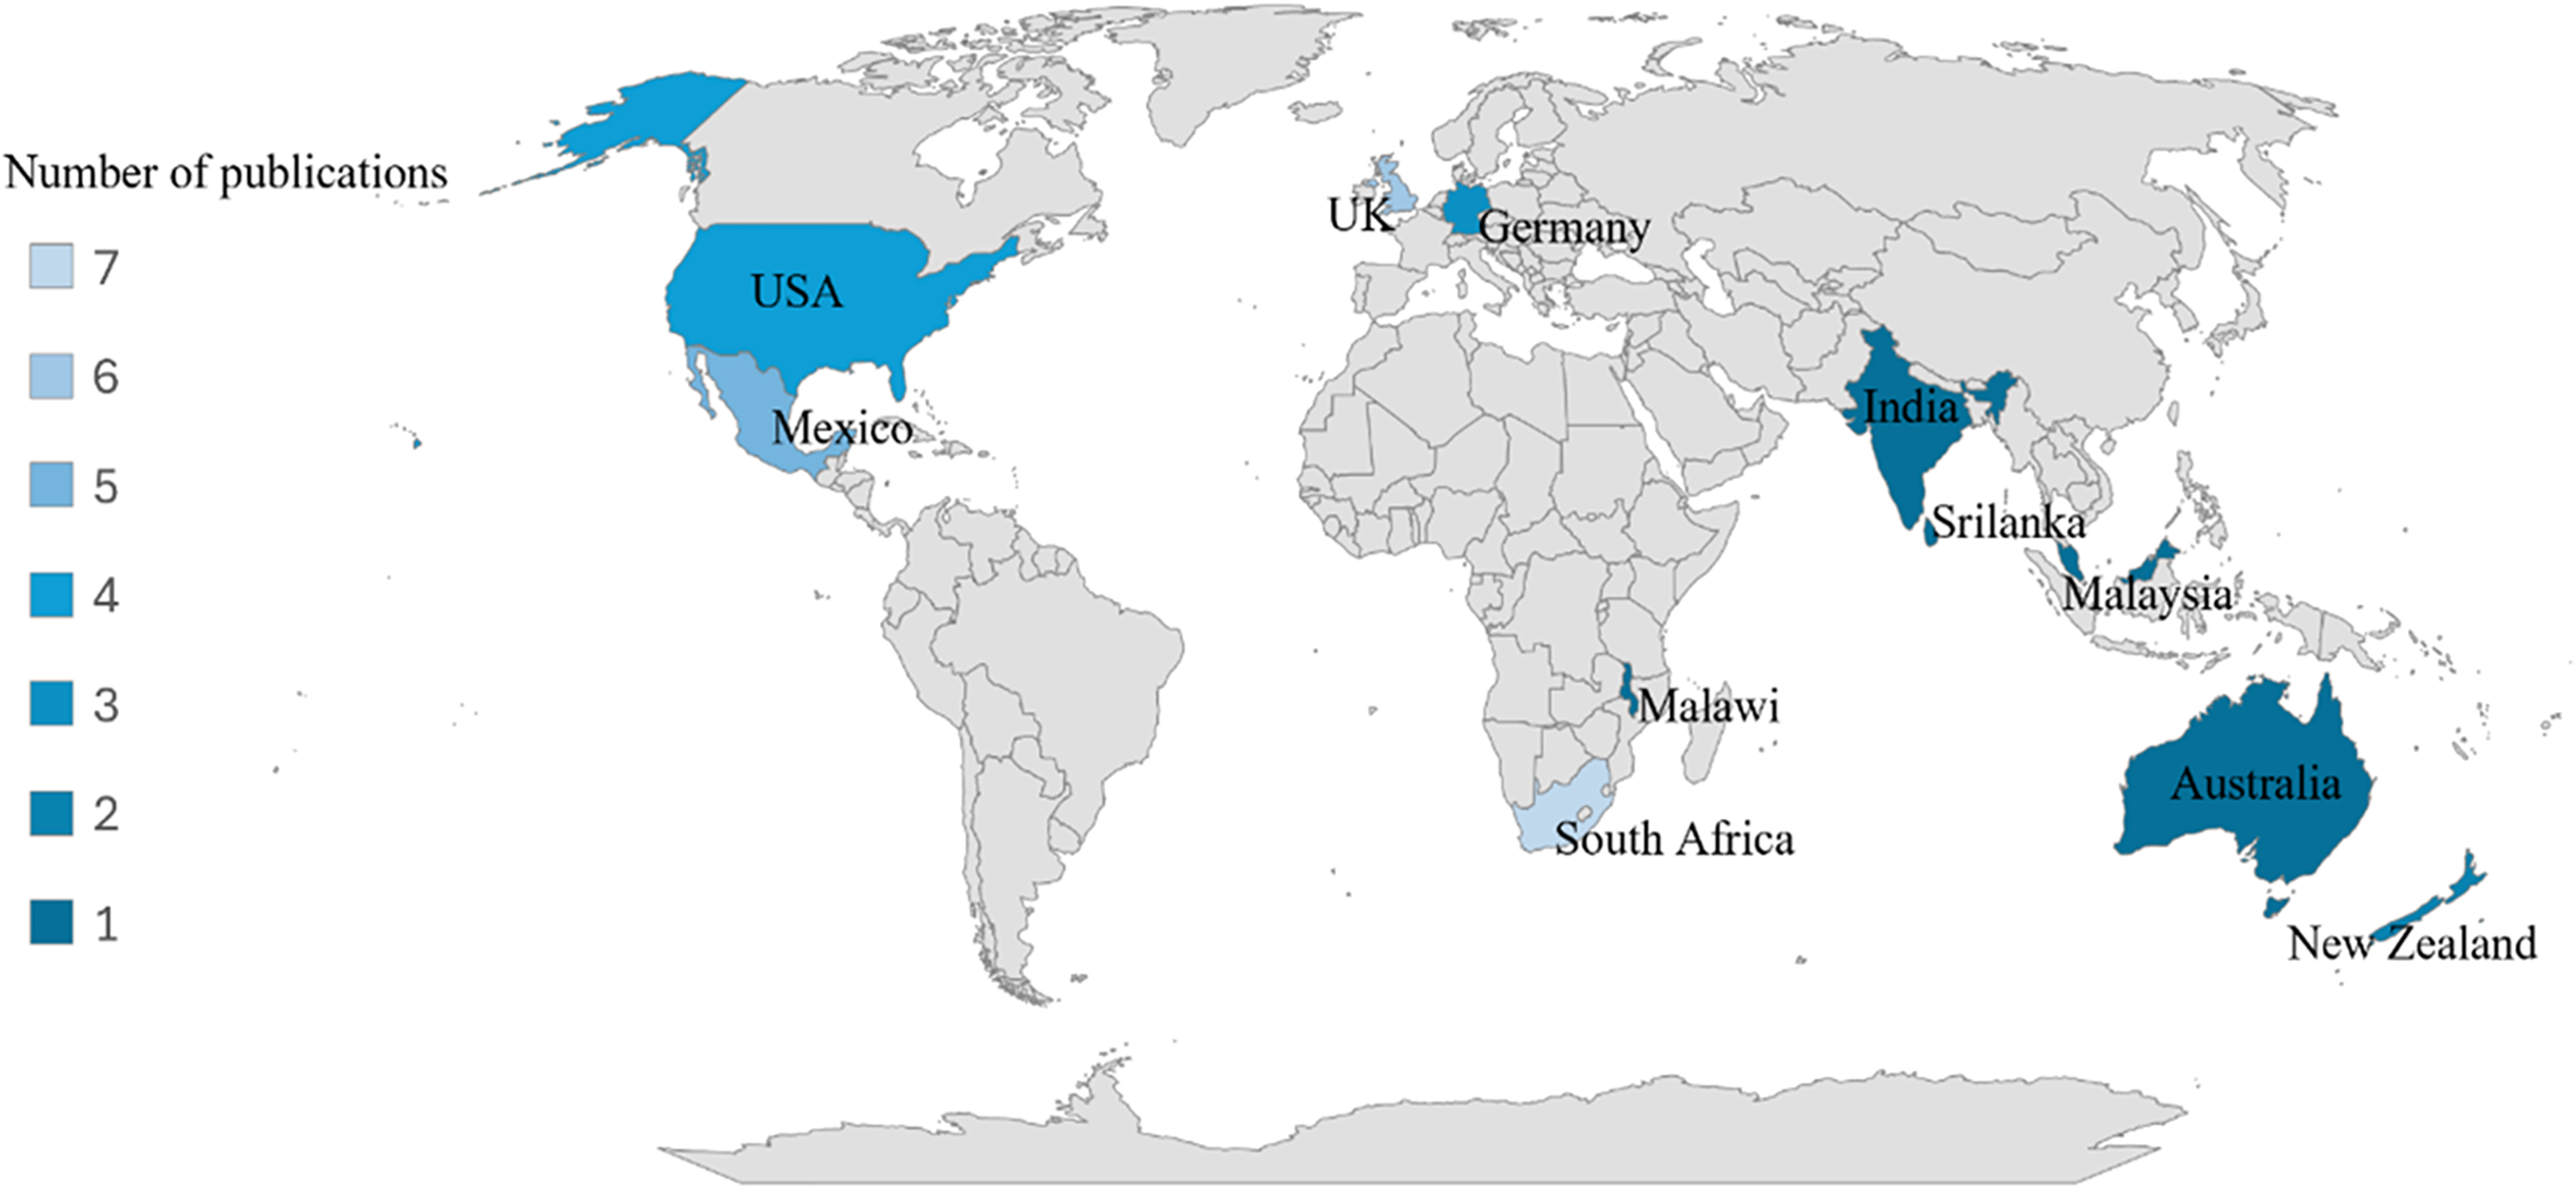
Spatial distribution of bracken fern (Pteridium aquilinum) mapping using remote sensing by country. Each country is shaded according to the number of publications originating from that location. Darker shades of blue represent a lower number of publications, while lighter shades indicate a higher number of publications, ranging from one (darkest shade) to seven (lightest shade). South Africa shows the highest research activity (seven publications), followed by the UK (United Kingdom) and Mexico. Other contributing countries include the USA (United States of America), Australia, Germany, Sri Lanka, Malaysia, Malawi, Mexico, and New Zealand. Gray areas indicate countries with no recorded publications in this field.

Australia and Asia each contribute around 9% of studies. In Australia, investigations primarily focus on managing P. aquilinum within fire-prone and agricultural landscapes, where its spread poses ecological and economic challenges. Here, the interaction between invasion dynamics and fire regimes may act as a driver of research attention. Asian contributions remain comparatively sparse, with isolated studies from Malaysia, Sri Lanka, India, and Japan, suggesting underexplored research opportunities in regions where the species could become increasingly invasive under changing climate conditions. At the country level, major contributors following South Africa (seven) include the United Kingdom (six studies), Mexico (five), the United States (four), and Germany (three). Smaller but notable contributions come from New Zealand, Malawi, Malaysia, Sri Lanka, and Australia (one or two studies). This distribution illustrates both the global scientific interest in P. aquilinum and the uneven concentration of research activity, with developed regions leading while tropical and subtropical regions remain underrepresented. This analysis is based on the geographic location of the study areas mapped with remote sensing, rather than the institutional affiliations of the authors.
Sensors Used for Detecting and Mapping
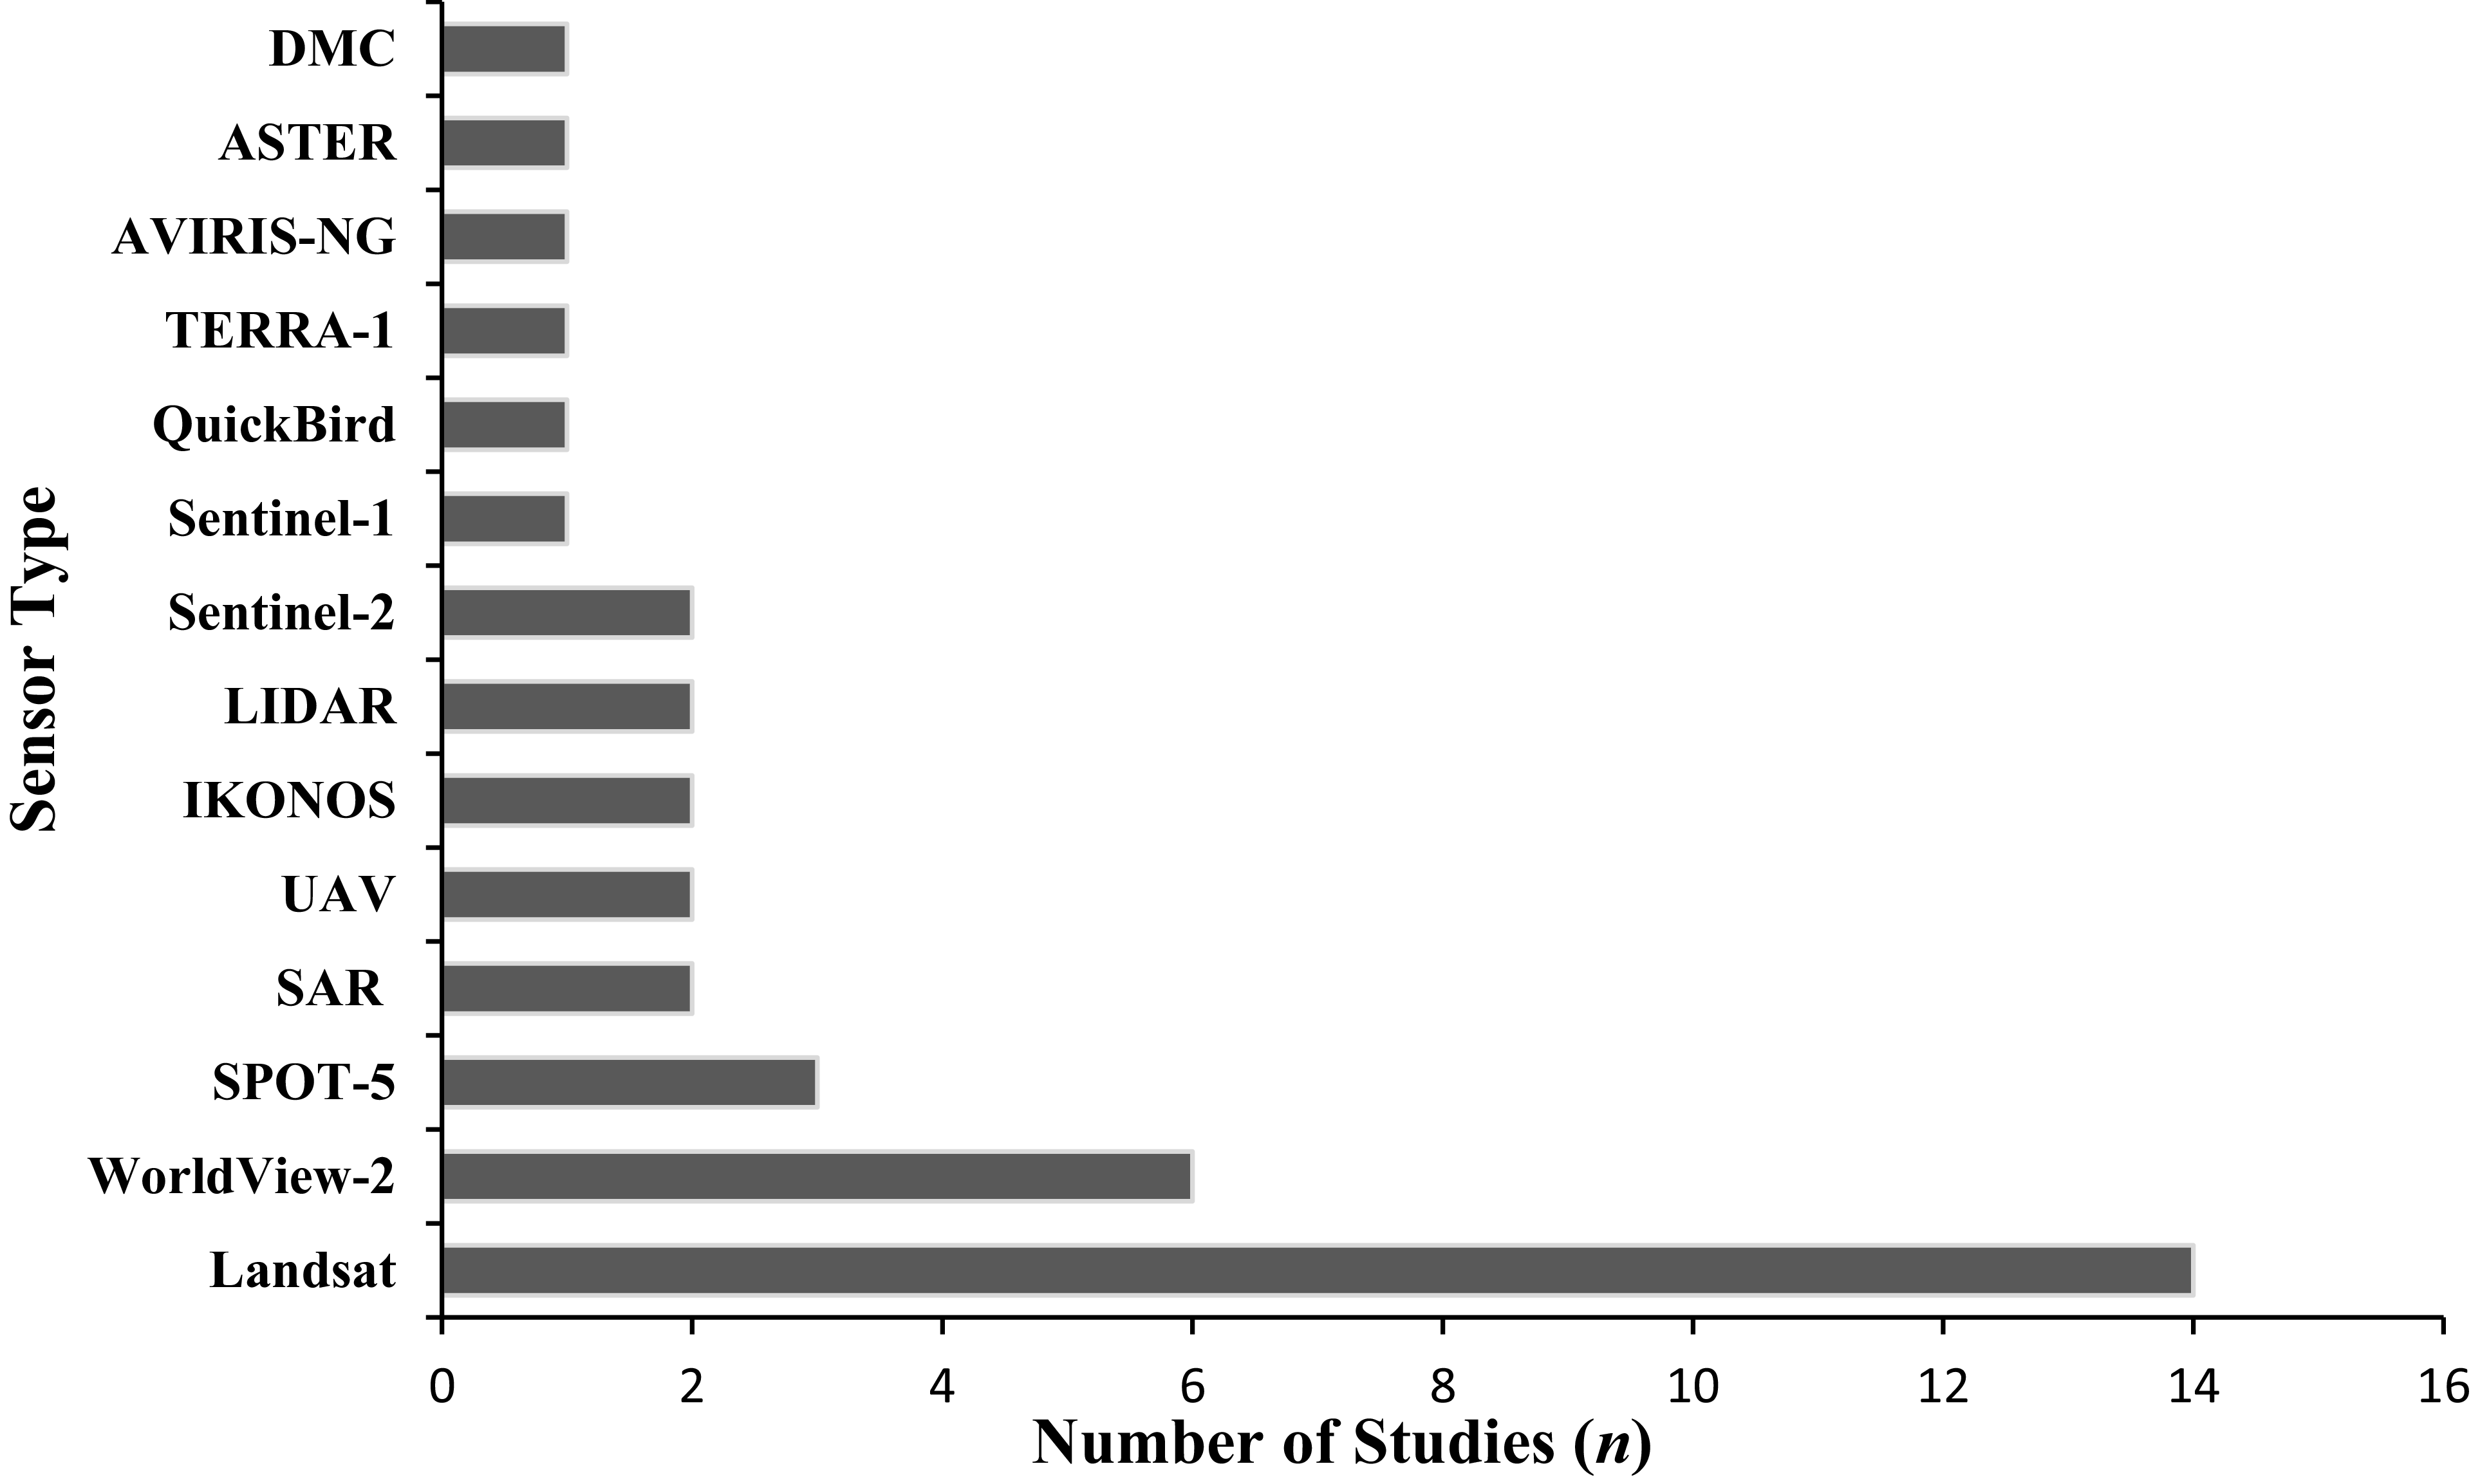
Remote sensing studies of P. aquilinum have employed a diverse range of 13 optical, radar, hyperspectral, and UAV-based platforms. The frequency of sensor usage across the reviewed literature is summarized in Figure 6, which highlights the dominance of multispectral optical systems. The Landsat program series (Thematic Mapper [TM], Enhanced Thematic Mapper Plus [ETM+], and Operational Land Imager [OLI]) represents the most frequently used platform, appearing in 14 studies (Figure 6). Its long historical archive, global coverage, and free access make it particularly suitable for regional-scale monitoring and long-term vegetation assessment (Matongera et al. Reference Matongera, Mutanga, Dube and Sibanda2017; Pakeman et al. Reference Pakeman, Marrs, Howard, Barr and Fuller1996; Schneider Reference Schneider2004). However, the 30-m spatial resolution limits detection of fragmented or early-stage bracken infestations in heterogeneous landscapes.
Number of studies utilizing different remote sensors for the detection and mapping of bracken fern (Pteridium aquilinum). The horizontal bars represent the frequency (n) of studies using each sensor type. Landsat sensors were the most frequently used (n = 15), followed by WorldView-2 and SPOT-5, indicating their popularity in vegetation and invasive species mapping. Other sensors, such as Sentinel-1, Sentinel-2, unmanned aerial vehicles (UAVs), synthetic aperture radar (SAR), and light detection and ranging (LiDAR), were used less frequently.

Commercial sensors with higher spatial resolution, including WorldView-2 (six studies), Satellite Pour l’Observation de la Terre (SPOT-5) (three studies), IKONOS (two studies), and QuickBird (one study), have been applied in studies requiring fine-scale discrimination of invasion fronts. As illustrated in Figure 6, WorldView-2 is the second most frequently used sensor. These high-resolution systems generally improve spatial detail and enhance the detection of patchy bracken distributions (Fernández et al. Reference Fernández, Silva, Gawlik, Thies and Bendix2013; Ngubane et al. Reference Ngubane, Odindi, Mutanga and Slotow2014; Odindi et al. Reference Odindi, Adam, Ngubane, Mutanga and Slotow2014).
The Sentinel-2 has gained prominence due to its 10- to 20-m resolution and red-edge spectral bands, which support vegetation differentiation and phenological monitoring (Mkungo et al. Reference Mkungo, Odindi, Mutanga and Matongera2023). In contrast, radar systems such as Sentinel-1 have been used less frequently (Figure 6). While synthetic aperture radar (SAR) data alone provide limited species-level separability, SAR’s sensitivity to vegetation structure and moisture makes it valuable when integrated with optical imagery (Takeshige et al. Reference Takeshige, Onishi, Aoyagi, Sawada, Imai, Ong and Kitayama2022).
Airborne and UAV-based systems provide ultra-high spatial resolution (up to 0.05 m). UAV platforms and aerial sensors such as the Digital Mapping Camera (DMC) allow detailed mapping and validation of localized encroachment (Dash et al. Reference Dash, Watt, Paul, Morgenroth and Pearse2019; Singh et al. Reference Singh, Forbes and Akombelwa2013). Hyperspectral airborne systems, particularly the Airborne Visible/Infrared Imaging Spectrometer–Next Generation (AVIRIS-NG), represent an emerging approach offering dense spectral sampling that enhances discrimination in complex forest environments (Aarsha et al. Reference Aarsha, Pankaj and Nidamanuri2023).
Classification and Analytical Methods
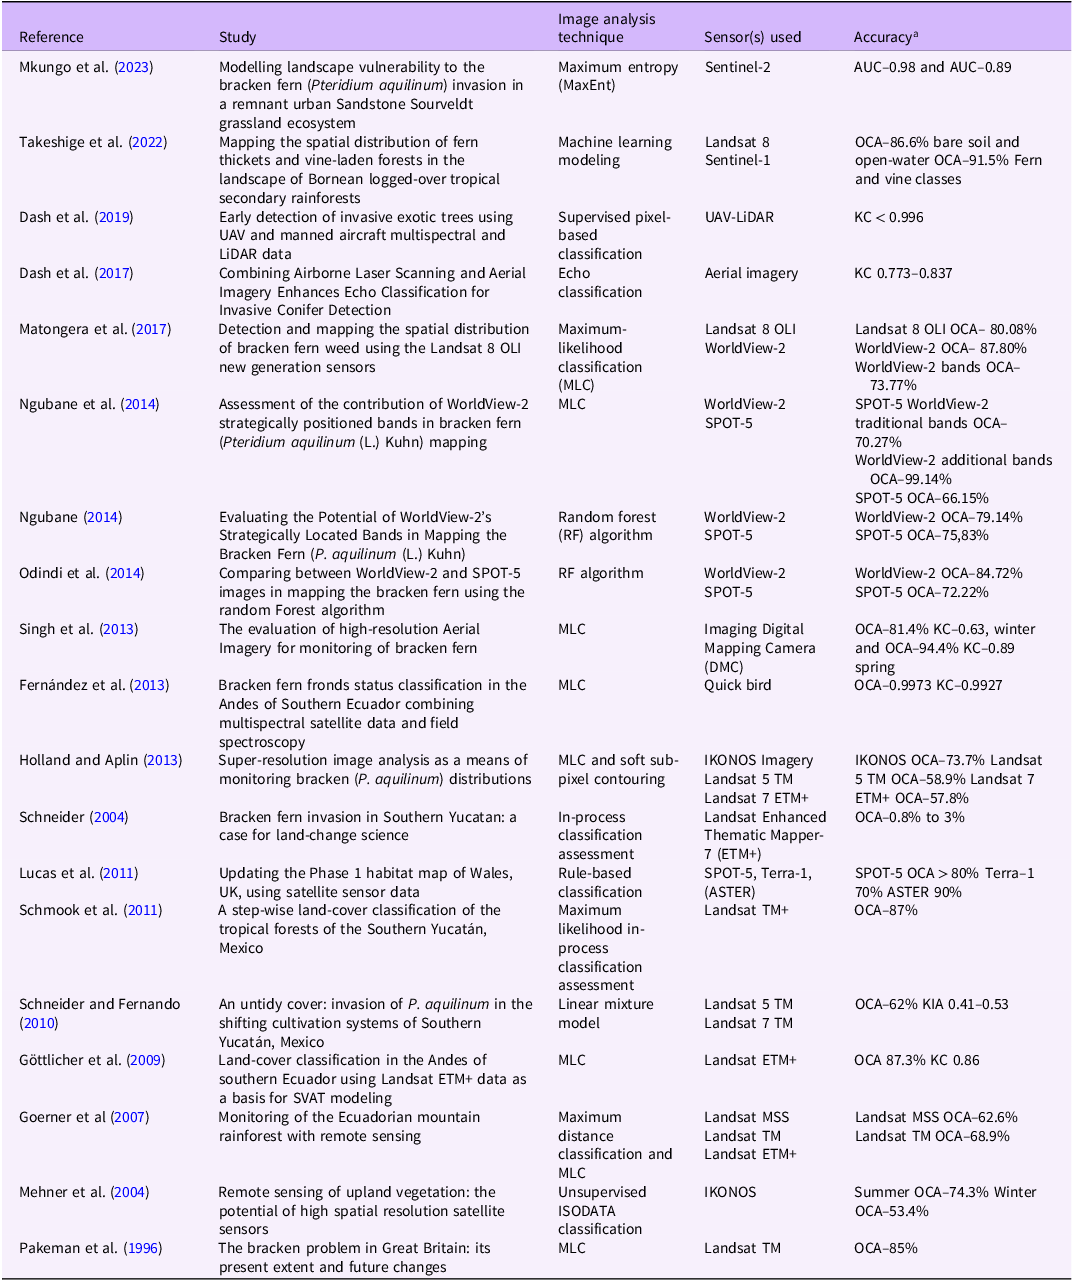
Methodological approaches for mapping P. aquilinum have evolved substantially over time, shifting from traditional statistical classifiers toward advanced ML frameworks (Table 6). Early studies relied on field surveys integrated with GIS databases, which were spatially limited and prone to identification errors and observer variability (Pakeman et al. Reference Pakeman, Marrs, Howard, Barr and Fuller1996). With the increasing availability of satellite imagery, pixel-based supervised classifiers, particularly maximum-likelihood classification (MLC), became common in early applications (Fernández et al. Reference Fernández, Silva, Gawlik, Thies and Bendix2013; Schmook et al. Reference Schmook, Palmer, Sangermano, Vadjunec, Eastman and Rogan2011).
Overview of remote sensing techniques, sensors, and classification accuracies applied in studies mapping bracken fern (Pteridium aquilinum).

a AUC, area under curve; KC, kappa coefficient; KIA, kappa index of agreement; OCA, overall classification accuracy.
Since 2014, there has been a clear transition toward ML methods. Algorithms such as random forest (RF) and maximum entropy (MaxEnt) and support vector–based approaches have been widely adopted, offering greater robustness in complex ecological environments (Mkungo et al. Reference Mkungo, Odindi, Mutanga and Matongera2023; Ngubane Reference Ngubane2014; Odindi et al. Reference Odindi, Adam, Ngubane, Mutanga and Slotow2014). Texture-based metrics derived from gray-level co-occurrence matrices (GLCM) have also been integrated to improve discrimination in structurally complex landscapes (Takeshige et al. Reference Takeshige, Onishi, Aoyagi, Sawada, Imai, Ong and Kitayama2022).
Multi-temporal analyses and phenological metrics derived from vegetation indices (e.g., Normalized Difference Vegetation Index [NDVI], Two-Band Enhanced Vegetation Index [EVI2]) have enhanced mapping by capturing seasonal dynamics (Matongera et al. Reference Matongera, Mutanga and Sibanda2021; Mehner et al. Reference Mehner, Cutler, Fairbairn and Thompson2004). Linear mixture models (LMM) and hybrid hard–soft classification approaches have been applied to handle subpixel heterogeneity and mixed vegetation conditions (Holland and Aplin Reference Holland and Aplin2013; Schneider and Fernando Reference Schneider and Fernando2010; Schmook et al. Reference Schmook, Palmer, Sangermano, Vadjunec, Eastman and Rogan2011). More recently, the combination of hyperspectral data and advanced ML techniques has facilitated fine-scale species discrimination and data-driven modeling of invasive species (Aarsha et al. Reference Aarsha, Pankaj and Nidamanuri2023; Dash et al. Reference Dash, Grant, Pearse and Thomas2017, Reference Dash, Watt, Paul, Morgenroth and Pearse2019).
Multi-Sensor and Multi-Temporal Integration
An emerging trend is the integration of multiple sensors and temporal observations rather than reliance on single-date imagery. Optical–SAR fusion (e.g., Landsat 8/9 with Sentinel-1) improves discrimination by combining spectral reflectance with structural backscatter information (Takeshige et al. Reference Takeshige, Onishi, Aoyagi, Sawada, Imai, Ong and Kitayama2022). Multi-season datasets capture green-up and senescence phases, reducing confusion with spectrally similar vegetation (Foody et al. Reference Foody, Muslim and Atkinson2005; Matongera et al. Reference Matongera, Mutanga and Sibanda2021). Time-series processing within cloud-computing platforms such as Google Earth Engine supports scalable analysis of long-term datasets (Orusa et al. Reference Orusa, Viani, Cammareri and Borgogno Mondino2023). These integrative approaches demonstrate that classification performance depends not solely on sensor resolution or algorithm choice, but on the strategic combination of spectral, structural, and temporal features.
Spatial Scale in Pteridium aquilinum Mapping
Research on P. aquilinum detection and mapping is concentrated on local scales, with approximately 95% of the published studies focusing on site-specific landscapes, particularly highland mountain forests and high-altitude environments (Holland and Aplin Reference Holland and Aplin2013; Matongera et al. Reference Matongera, Mutanga, Dube and Sibanda2017; Mkungo et al. Reference Mkungo, Odindi, Mutanga and Matongera2023; Schneider Reference Schneider2004; Singh et al. Reference Singh, Forbes and Akombelwa2013; Takeshige et al. Reference Takeshige, Onishi, Aoyagi, Sawada, Imai, Ong and Kitayama2022). Examples of regional-scale studies include Pakeman et al. (Reference Pakeman, Marrs, Howard, Barr and Fuller1996), Goerner et al. (Reference Goerner, Gloaguen and Makeschin2007), Göttlicher et al. (Reference Göttlicher, Obregón, Homeier, Rollenbeck, Nauss and Bendix2009), Singh et al. (Reference Singh, Forbes and Akombelwa2013), and Fernández et al. (Reference Fernández, Silva, Gawlik, Thies and Bendix2013). Continental or global-scale assessments are largely absent. This dominance of local case studies indicates limited translation into operational large-scale monitoring frameworks.
Challenges in Mapping Pteridium aquilinum
Despite significant technological and methodological progress, mapping P. aquilinum remains constrained by interrelated sensor, spectral, algorithmic, and environmental challenges that affect classification accuracy and spatial consistency. Spectral similarity between bracken and co-occurring vegetation reduces separability, particularly in multispectral imagery (Lu et al. Reference Lu, Li, Moran and Batistella2021). Phenological variability further complicates classification unless multi-temporal approaches are used (Matongera et al. Reference Matongera, Mutanga and Sibanda2021). Spatial resolution trade-offs remain central. Moderate-resolution imagery enables regional coverage but misses fragmented infestations, whereas high-resolution and UAV systems improve precision but are costly and spatially limited, and their data may require substantial preprocessing depending on the sensor and analytical approach (Ghosh and Joshi Reference Ghosh and Joshi2013; Wallace et al. Reference Wallace, Lucieer, Malenovský, Turner and Vopěnka2016).
Pteridium aquilinum is frequently underrepresented relative to dominant land-cover classes, limited training data, and inconsistent validation metrics (Huang et al. Reference Huang, Zhang, He, Liu, Li, Su, Liu and Bridhikitti2020; Rodriguez-Galiano et al. Reference Rodriguez-Galiano, Ghimire and Rogan2012). Reported accuracy measures (overall classification accuracy [OCA], kappa coefficient [KC], area under the curve [AUC]) vary widely across studies, limiting the comparability of methodological performance between studies (Table 6). Operational limitations are caused by cloud cover, rugged terrain, radiometric distortions (Mehner et al. Reference Mehner, Cutler, Fairbairn and Thompson2004), and the computational demands of hyperspectral and data fusion workflows (Blackburn Reference Blackburn2007; Pelletier et al. Reference Pelletier, Webb and Petitjean2019). Collectively, these challenges highlight that reliable mapping is influenced by spectral complexity, scale dependency, data imbalance, and operational constraints rather than sensor choice alone.
Methodological and Technological Progress in Pteridium aquilinum mapping
Advances in remote sensing technologies have substantially improved the detection and monitoring of P. aquilinum. Sensor development has improved detection capacity, progressing from Landsat-based mapping to higher-resolution and red edge–enabled systems. Multi-temporal datasets now exploit phenological dynamics rather than single-date reflectance patterns. Algorithmically, the transition toward ensemble and nonparametric ML methods (RF, MaxEnt) has enhanced robustness in heterogeneous environments. Texture metrics, feature engineering, and data fusion further expand discriminatory power. Cloud-computing infrastructures facilitate time-series analysis and regional scalability. These developments reflect a transition from static, pixel-based classification exercises toward integrated, data-rich, and temporally informed ecological monitoring strategies.
Future Directions and Research Opportunities
While this review has synthesized the progress made in mapping P. aquilinum, several novel insights emerge that can guide future research. First, expanding research into underrepresented regions—including parts of Asia, Latin America, and Africa—would provide valuable opportunities to evaluate invasion dynamics across diverse climatic zones and vegetation systems. Broader geographic coverage would enable comparative analyses and foster globally relevant monitoring frameworks.
Second, future studies should prioritize cross-regional model validation and transferable workflow design. Developing classification approaches that perform consistently across ecological gradients would enhance the general applicability of remote sensing methods and facilitate large-scale implementation. Shared benchmarking datasets and collaborative validation initiatives could accelerate this progress.
Third, multi-sensor data fusion represents a major avenue for methodological advancement. Integrating optical, SAR, hyperspectral, and UAV-derived data—particularly through multi-temporal frameworks—can improve discrimination of P. aquilinum across heterogeneous landscapes and phenological stages. Coupling these datasets with advanced artificial intelligence approaches, including deep learning architectures, offers significant potential for improving classification robustness and automation.
Fourth, future research should increasingly integrate ecological and environmental datasets with remote sensing outputs. Linking distribution patterns to climate variability, fire regimes, land-use transitions, and disturbance histories would enable predictive modeling of invasion dynamics. Such integration would support scenario-based forecasting under changing environmental conditions.
Fifth, operational scalability presents a strong research opportunity. Leveraging cloud-computing platforms and automated processing pipelines can facilitate regional- to continental-scale monitoring and near-real-time assessment. Developing cost-effective, repeatable, and standardized workflows would bridge the gap between academic research and applied land management.
Acknowledgments
The authors would like to thank the Geography Department at the University of the Free State for their invaluable support and resources in completing this research.
Funding statement
The authors declare that no grants or funds were received for preparing this article.
Competing interests
The authors declare no conflicts of interest.
Declaration of generative AI in scientific writing
In preparing this work, the authors utilized Grammarly as a language editing tool to improve grammar, spelling, sentence structure, and overall clarity of expression. The software was applied during the final stages of manuscript revision after the scientific content, analysis, interpretation, and conclusions had been fully developed by the authors. All content was critically reviewed and refined by the authors, who take full responsibility for the integrity and substance of the publication.

 Open access