


Income inequality fell in practically every Latin American country during the first decade of the twenty-first century (López-Calva and Lustig Reference López-Calva and Lustig2010; Cornia Reference Cornia2010). From the early 2000s to around 2012, the average Gini coefficient for the region fell from 0.51 to 0.47. This period coincided with the election of an unusual number of left-leaning presidents, a phenomenon called the Pink Tide or Latin America’s left turn (Weyland et al. Reference Weyland, Madrid and Hunter2010; Levitsky and Roberts Reference Levitsky and Roberts2011). Did inequality fall more in countries governed by the left? Figure 1 suggests that indeed, these countries experienced a more pronounced decline in inequality.

Building on the experience of Western Europe, numerous studies support the idea that leftist governments adopt policies that redistribute both income and wealth (Castles Reference Castles1985; Esping-Andersen Reference Esping-Andersen1990; Korpi Reference Korpi1983; Stephens Reference Stephens1979). The evidence, however, is not unambiguous (e.g., Bradley et al. Reference Bradley, Evelyne Huber, Nielsen and Stephens2003; Huber and Stephens Reference Huber and Stephens2010, Reference Huber and Stephens2012; Mahler Reference Mahler2010; Rueda Reference Rueda2007a).Footnote 1 Heightened competition, changes in global finance, structural unemployment, and organized labor’s declining power in recent decades hindered or discouraged leftist governments from implementing redistributive policies (e.g., Rueda Reference Rueda2007b; Thelen Reference Thelen2014). Before the onset of the Pink Tide, the consensus among political scientists analyzing Latin America was that the power of left-of-center parties was not associated with increased social spending (Huber et al. Reference Huber, Mustillo and Stephens2008; Kaufman and Segura-Ubiergo Reference Kaufman and Segura-Ubiergo2000). Some scholars argue that smaller unions and larger informal sectors limit the power of progressive governments in the region to redistribute incomes (Holland and Schneider Reference Holland and Ross Schneider2017; Schneider and Soskice Reference Schneider and Soskice2009; Segura-Ubiergo Reference Segura-Ubiergo2007).
In contrast to earlier findings, figure 1 suggests that the left may have been more redistributive than non-left regimes during the 2000s. In several countries, however, this period of declining inequality overlapped a growth spurt triggered by the commodities boom.Footnote 2 The decline in inequality, therefore, may have been a byproduct of economic growth and the concomitant larger fiscal space rather than the policies implemented by leftist governments. The question is, then, did countries governed by the left experience a decline in inequality over and above what would have been predicted by other factors, such as a larger fiscal space due to the commodities boom? If the answer is yes, what policies might underpin the result?
Using the most complete data on income inequality available covering the period between 1992 and 2017, we estimate the contemporaneous impact of government partisanship on income inequality and on specific redistributive policies (controlling for, among other things, the commodities boom). To that end, and to control for unobservable confounding factors, we use a difference-in-differences (DD) design with time series and event-study regression models. Conceptually, we examine changes in income inequality in countries before and after the left came to office, relative to such changes in other countries without a left-wing government.
The key for identifying the contribution of the left to the observed inequality dynamics is the so-called parallel trends assumption: Were the patterns in inequality trends similar between the countries that were eventually governed by the left and those that were not? We find that, on average, there were no differing patterns in inequality trends before the left took office. That is, the election of leftist executives does not appear to be related to particular dynamics of inequality trends in these countries. This result is in line with findings by Lora and Olivera (Reference Lora and Olivera2005), Kaufman (Reference Kaufman2009), Baker and Greene (Reference Baker and Greene2011), and Murillo et al. (Reference Murillo, Oliveros and Vaishnav2010), for example.
Our results suggest that countries experienced a more pronounced decline in income inequality after the left came to power, even after controlling for other factors, such as terms of trade, trade volume, export volume, the skill composition of the workforce, past levels of inequality, levels of democracy, and country and year fixed effects. On average, countries with a leftist president experienced an additional drop in the Gini coefficient of 2.4 percentage points relative to non-left countries. All else equal, our dynamic models suggest that if the left were to stay in power for a sustained period of time, the additional decline in the Gini index would be 5.5 percentage points relative to the non-left countries. Our results also suggest that the redistribution induced by the left favors the incom shares of the bottom and middle deciles at the expense of the share of the top 10 percent. This equalizing effect of the left does not appear to be contingent on the terms of trade or the volume of exports (a proxy for the commodities boom).
Which policy mechanisms explain the existence of a “leftist premium” when it comes to inequality reduction? A growing literature in economics shows that an expansion of targeted conditional and unconditional cash transfers (CCTs and UCTs) and social pensions, an increase in the minimum wage, and a larger government budget were behind the reduction of inequality during this period in Latin America.Footnote 3 We investigate the link between left incumbency and these policies and find that leftist governments are indeed more likely to raise the minimum wage, implement more generous social pensions, and expand total tax revenue at a higher pace than non-leftist governments. In sum, our results suggest that these policies are plausible mechanisms through which the left induces more inequality reduction than non-left regimes. In contrast, we find no differences between left and non-left regimes regarding the expansion of targeted cash transfers.Footnote 4
The relationship between the left and inequality in Latin America has been studied quantitatively by Birdsall et al. (Reference Birdsall, Lustig and McLeod2012), Cornia (Reference Cornia2010), Huber et al. (Reference Huber, François Nielsen and Stephens2006), Huber and Stephens (Reference Huber and Stephens2012), and Morgan and Kelly (Reference Morgan and Kelly2013). Our work complements and improves on these studies in several ways. Morgan and Kelly (Reference Morgan and Kelly2013) find that the left affects “gross” but not “net” income inequality; in turn, Huber et al. (Reference Huber, François Nielsen and Stephens2006) and Huber and Stephens (Reference Huber and Stephens2012) find that left power improves income equality. These studies focus on the impact of the long-term strength of the partisan left, measured as the legislative partisan balance accumulated over time (usually, over a 15-year period). Our work, in contrast, finds a contemporaneous effect of government ideology on disposable (“net”) income inequality. Closer in spirit to this study, Cornia (Reference Cornia2010) and Birdsall et al. (Reference Birdsall, Lustig and McLeod2012) study the contemporaneous effect of the presence of leftist governments on inequality. Although they find a positive connection between different “types” of leftist governments (so-called radical and moderate) and inequality decline, their work covers only a few years of the Pink Tide (as does Huber and Stephens Reference Huber and Stephens2012) and does not explore the policy mechanisms by which governments equalize incomes.
It is important to state at the outset that analyzing why the left became more redistributive—e.g., the leaders’ ideology, the system’s electoral competitiveness, and the party’s linkages to a strong labor movement—during the Pink Tide compared to what happened in previous decades is beyond the scope of this article. Instead, our main contributions are twofold. First, we provide a more comprehensive, empirically robust, and up-to-date analysis of the influence of leftist regimes on the evolution of income inequality in Latin America during the period of widespread decline. In particular, we examine a longer period than previous analyses and for a larger number of countries. Importantly, we use several indicators of inequality, test our hypothesis over different samples, and carefully check identification assumptions. Second, we provide new evidence on the policies that leftist administrations might have used to affect inequality in the short run.
Our findings contribute to an emerging literature on the relationship between inequality, redistribution, and the presence of leftist governments outside the context of advanced nations. While scholars of Latin America often emphasize the weak programmatic character of political parties in the region, either because they rely on clientelist and patronage networks (e.g., González-Ocantos and Oliveros Reference González-Ocantos, Oliveros and William2019) or because they often depart radically from their campaign promises (e.g., Stokes Reference Stokes2001), our study shows that during the Pink Tide, leftist governments in the region implemented policies and delivered results in line with their campaign promises. Our study also suggests that, unlike their social-democratic counterparts in Western Europe (Rueda Reference Rueda2007a), which, since the 1970s, have promoted policies favoring the middle class at the expense of low-income voters, leftist governments in the region implemented policies that favored those at the bottom of the income distribution disproportionally.
Inequality, Commodities Boom, and the Left
Latin America is among the most unequal regions in the world. Income inequality increased steadily across the region in the 1980s and 1990s, a period in which most countries also implemented market-oriented reforms, including trade and financial liberalization. By the turn of the twenty-first century, however, inequality began to recede, marking a watershed moment in the region. By 2013, inequality had declined in all 17 countries included in our analysis, quite significantly in some.
The decline in inequality has been associated with a range of short- and long-term factors, including a decline in the skill premium and the expansion of cash transfer programs that favored the poor (López-Calva and Lustig Reference López-Calva and Lustig2010). Since this expansion coincided (in South America) with more favorable terms of trade—the so-called commodities boom—the sharp decline in inequality may have been the byproduct of economic growth and the larger fiscal space that ensued. However, there are reasons to believe that better economic conditions were not the sole factor behind the rise in the generosity of transfers.
Table 1 splits countries on whether they were governed by the left at some point between 1992 and 2017, using the index developed by Baker and Greene (Reference Baker and Greene2011). Admittedly, these governments were hardly homogeneous. Some, like the governments of Lagos (2000–2006) and Bachelet (2006–10, 2014–18) in Chile, were seen as more moderate and market-friendly. Others, like the Venezuelan governments of Chávez and Maduro (1999–present), were often portrayed as “populist” or radical.Footnote 5 And some, like the government of Humala in Peru (2011–15), rejected their leftist programs in favor of more orthodox policies once in office. Table 1 also reports the Gini index change during this period. Inequality declined in countries with above-average growth rates (Chile, Peru) and in those with more moderate (Brazil, Ecuador) or little growth (Mexico); it declined in both predominantly commodity exporters (Argentina, Bolivia, Brazil, Ecuador, and Peru) and commodity importers (El Salvador, Guatemala, Nicaragua, Panama). Thus, the commodities boom and the ensuing growth do not appear to be a necessary condition for countries to experience a decline in inequality.
Classification of Countries by Political Regime and Commodity Exporters/Importers
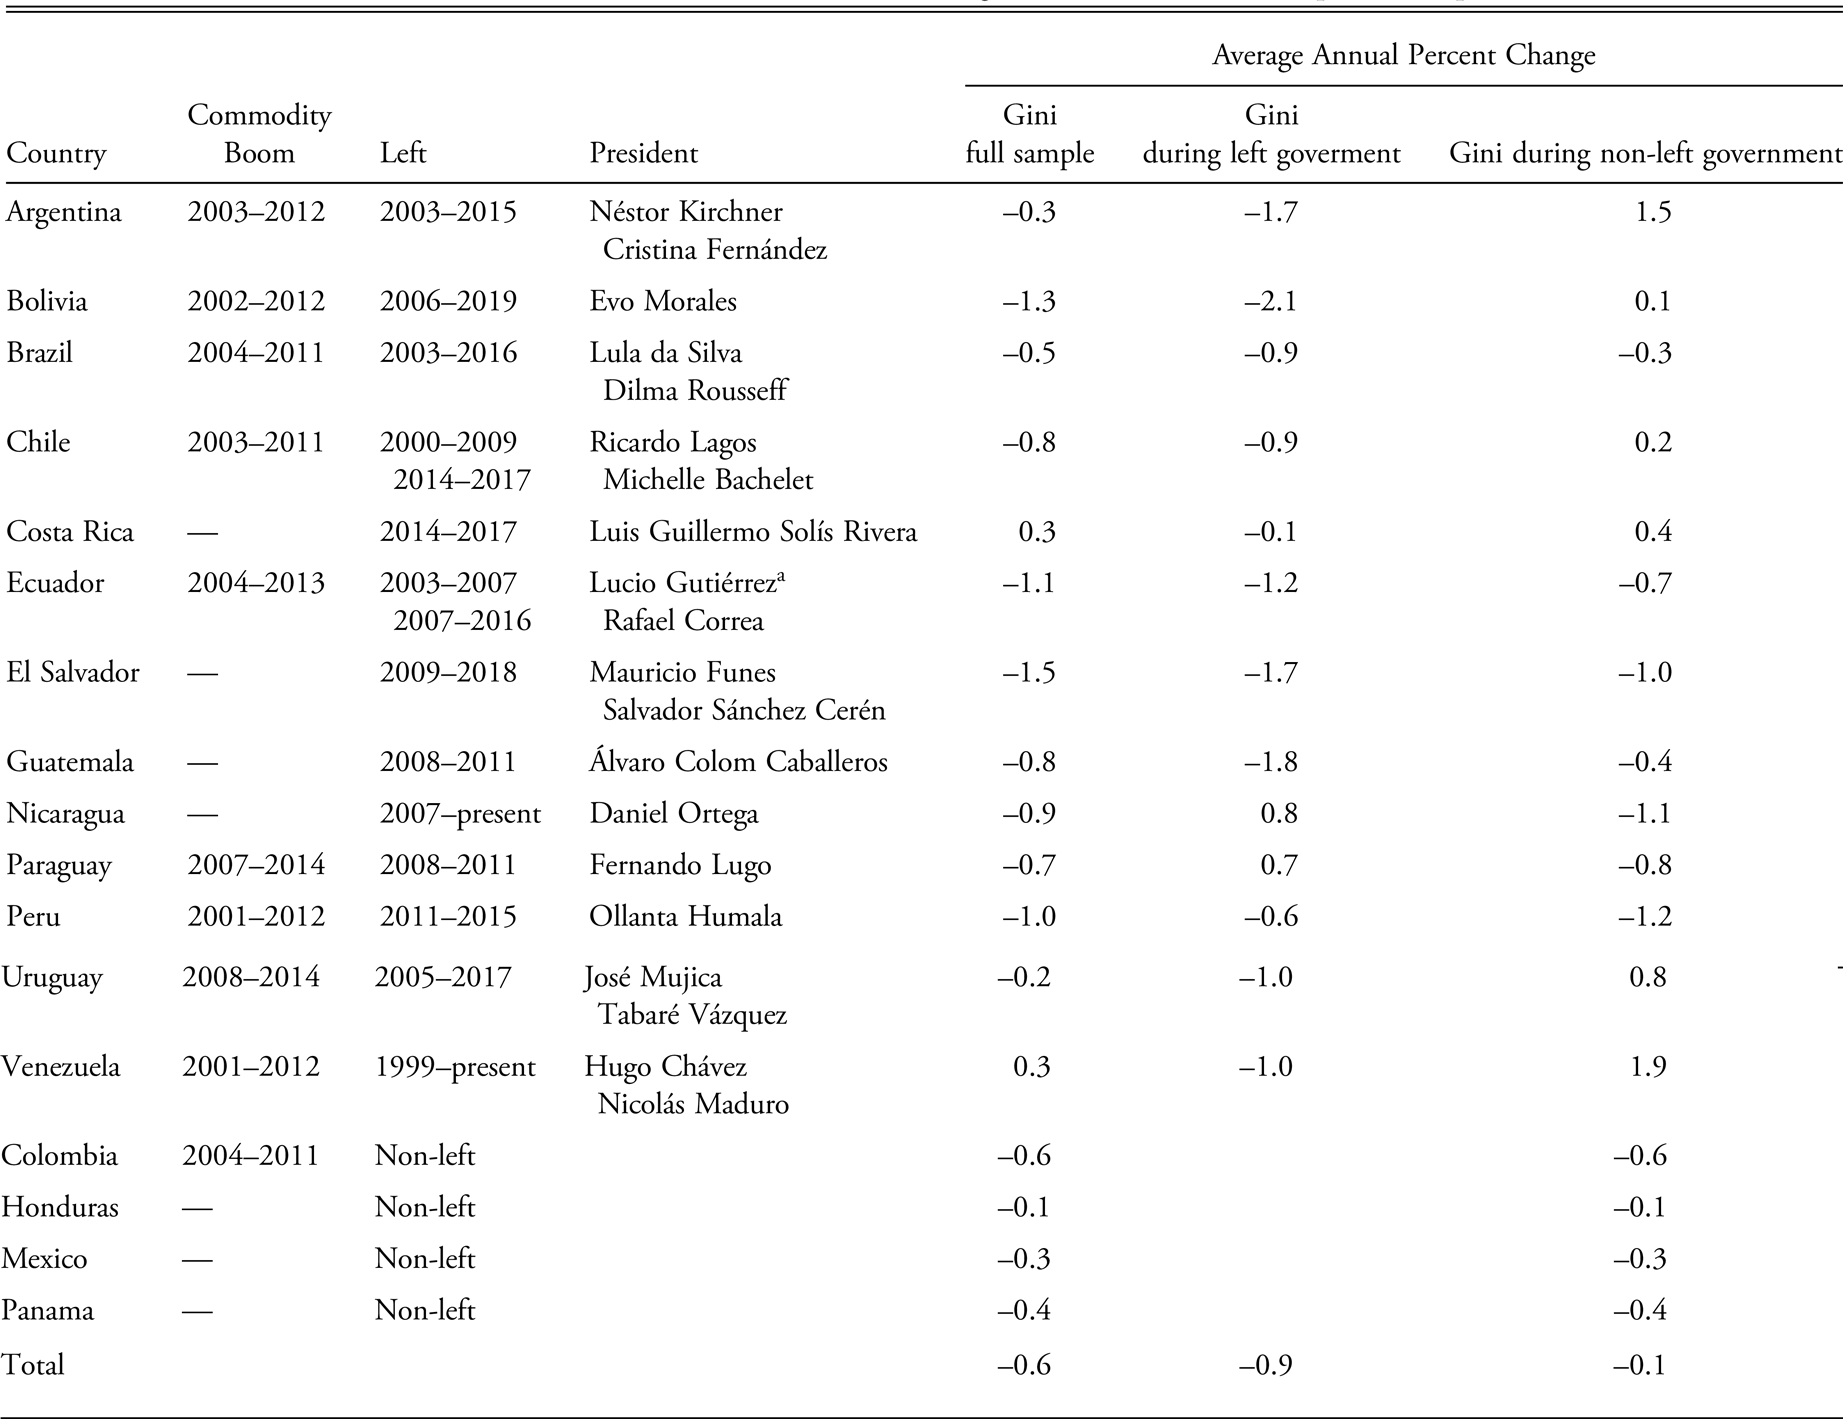
a Gutiérrez’s vice president, Alfredo Palacio, finished Gutiérrez’s term after Congress removed Gutiérrez from office.
Notes: Commodity boom: counted from first year in which terms of trade rose until they peaked, since 2000; left: counted since the year where the government begins to the ending year, if the government ends after the first half of the year.
Sources: SEDLAC (2018), consulted October 1, 2019; World Bank (2020).
As table 1 shows, inequality also declined in countries governed by left and non-left presidents. However, countries with a left government experienced a faster decline in inequality (see figure 1). The likely candidate to explain the more rapid decline of income inequality in these countries is the policies implemented by the wave of leaders and parties generically dubbed “leftist” that came to power during this period. To the extent that these governments were more likely to implement redistributive policies, government partisanship should logically reduce levels of income inequality over and above other common factors. Table 1 also shows that left-leaning candidates rose to power in countries benefiting from the commodities boom, like Argentina and Brazil, but also in countries that did not benefit from rising commodity prices, like Costa Rica or El Salvador. Thus, even if the rise in export prices helped leftist candidates in the ballot box, leftist governments also rose to power in non–commodity-boom countries.Footnote 6 Table 1 shows that these countries also experienced a decline in inequality.
The Left and Redistributive Policies
Evidence suggests that policies such as spending on direct cash transfers (CCTs, UCTs, and social pensions), a minimum wage, and the size of government (taxes to GDP) can have a contemporaneous effect on income inequality. Other policies, including an increase in education and health spending, also impact inequality, but only in the medium or long run. That is why we do not examine them here.
Evidence on the equalizing effect of cash transfers in Latin America can be found in López-Calva and Lustig (Reference López-Calva and Lustig2010) and Azevedo et al. (Reference Azevedo, Inchauste and Sanfelice2013). Based on the latter, about 17 percent of the decline in inequality in the 2000s can be attributed to the introduction of more generous and progressive cash transfers. These include two main kinds of cash transfers: conditional cash Transfers (CCTs) and social pensions. CCTs were introduced in the second half of the 1990s in Brazil and Mexico. Subsequently they became quite pervasive: about one-fifth of the region’s population ended up being covered by CCTs (Izquierdo et al. Reference Izquierdo, Pessino and Vuletin2018). Between 2000 and 2015, spending on CCTs rose from a regional average of 0.14 to 0.37 percent of GDP. As shown in the Commitment to Equity Institute’s Data Center on Fiscal Redistribution, CCTs are equalizers.
To measure the inequality-reducing effect of conditional cash transfers, the marginal contribution is used. As described in Lustig (Reference Lustig2018), the marginal contribution is the difference between the change in inequality obtained without the fiscal policy of interest (while the rest of taxes, transfers, and subsidies are kept in the calculation) and the change in inequality with the fiscal policy of interest. If the sign of this difference is positive (negative), it means that the policy of interest is equalizing (unequalizing). The information on the marginal contribution for CCTs in the CEQ Data Center shows that they are always equalizing, and on average, their size is 0.47, almost half a Gini point. The marginal contributions of CCTs ranges from 0.008 (El Salvador) to 1.29 (Mexico).
Social (that is, noncontributory) pensions have also increased in the 2000s, albeit by less. Over time, social spending rose from a regional average of 0.31 in 2000 to 0.53 percent of GDP in 2015 (UN-ECLAC 2021). Between 2002 and 2015, the average monthly amount of these benefits increased by 31 percent. As a result, the income of pensioners in the lowest deciles increased, drastically reducing the number of retired people living below the poverty line (CEPAL 2017). Given that the eligibility criterion is based mostly on beneficiaries’ level of poverty or vulnerability, it is unsurprising that almost half of the people aged 65 or over in the lowest income quintile are covered by this policy, almost three times the coverage among elders in the highest income quintile (CEPAL 2017). This pattern makes social pensions equalizing throughout. Based on the data in the CEQ Data Center, the marginal contribution of social pensions is, on average, 0.44. They range from 0.06 (El Salvador) to 1.68 (Argentina).
The effect of the minimum wage policy on inequality depends both on its level (i.e., whether the minimum wage is “binding”), its enforcement (i.e., its coverage), and whether the positive effect on the incomes of poorer workers dominates the negative effect on any potential employment losses. Examining data from Latin America, Messina and Silva (Reference Messina and Silva2017) conclude that “an increasing minimum wage, despite pervasive incomplete compliance and everpresent but small employment losses, still has a wage-equalizing effect” (158).Footnote 7 Ferreira et al. (Reference Ferreira, Firpo and Messina2022) and Cengiz et al. (Reference Cengiz, Dube, Lindner and Zipperer2019) present evidence in the same direction for Brazil in the 2000s and the United States between 1976 and 2016.
The descriptive evidence suggests that the coverage and level of minimum wages increased more in left-governed countries than in non-left countries. Argentina, Bolivia, Brazil, Chile, Ecuador, and Nicaragua saw the largest increases. Between 2000 and 2015, real minimum wages rose between 2.7 percent and 173.3 percent, depending on the country (UN-ECLAC 2021).Footnote 8 In non-left countries, by contrast, minimum wages rose little or none (e.g., Colombia and Mexico) although in some cases, such as Colombia, the minimum wage was already high at the start of the commodities boom (Messina and Silva Reference Messina and Silva2017, 160–61).
We also consider tax policy as the last channel through which governments can achieve a concomitant change in income inequality. Governments can affect inequality through tax policy by increasing revenue collection when the fiscal system is progressive and by levying more progressive taxes and increasing the progressivity of specific taxes. In fact, tax collection increased from 16.7 percent to 21.4 percent of GDP between 2000 and 2015. As shown in the detailed and comparative fiscal incidence results housed in the Commitment to Equity Institute, tax systems in Latin America are progressive, though less so than in the developed world (Lustig Reference Lustig2017).Footnote 9
Below we consider whether the left in government in Latin America is associated with a higher contemporaneous reduction in inequality and with a more pronounced expansion of these policies or not. As mentioned, the empirical literature on these issues offers mixed findings. While some scholars find that left incumbency (Cornia Reference Cornia2010; Birdsall et al. Reference Birdsall, Lustig and McLeod2012) and long-term left power (Huber et al. Reference Huber, François Nielsen and Stephens2006; Huber and Stephens Reference Huber and Stephens2012; Morgan and Kelly Reference Morgan and Kelly2013) are associated with lower income inequality, others find that leftist governments in the region face important obstacles in expanding social spending (e.g., Huber et al. Reference Huber, Mustillo and Stephens2008) and implementing other equalizing reforms (Holland and Schneider Reference Holland and Ross Schneider2017). Along these lines, recent contributions by Garay (Reference Garay2016), Fairfield and Garay (Reference Fairfield and Garay2017), and Altman and Castiglioni (Reference Altman and Castiglioni2020) suggest that factors other than the ideological dispositions of governments help explain the recent expansion of social policy toward the poor in the region. In sum, the relationship between government partisanship, inequality, and redistribution in Latin America warrants additional examination.
A robust literature in political science also suggests that political and institutional conditions impact the capacity of the left to engage in economic redistribution, including the levels of democracy (Huber et al. Reference Huber, Mustillo and Stephens2008), the partisan balance of power in the legislature (Huber and Stephens Reference Huber and Stephens2012), the organizational characteristics of the leftist party (Pribble Reference Pribble2013), and the strength of the president within his or her own party (Schipani Reference Schipani2022), to name a few. Given sample and space limitations, we consider just one of the political factors, one that has received ample attention in the literature: the partisan composition of the legislature. As noted, previous studies suggest that the strength of the left in Congress is a crucial predictor of the levels of inequality. In this regard, the left presidents in our sample offer interesting variations. While some, like Morales in Bolivia and Chávez and Maduro in Venezuela, commanded large congressional majorities, others, like Sánchez Cerén in El Salvador and Humala in Peru, governed without a majority of congressional seats. In some cases, like Argentina under Fernández de Kirchner, congressional support fluctuated over time. Although some of the policies we examine do not require congressional approval (e.g., raising the minimum wage or expanding existing social programs), others (like increasing taxes or enacting new social policies) may need to pass through Congress first. Therefore, we expect a stronger effect of the left on inequality and redistributive policies when there are solid leftist congressional majorities.
Data and Descriptive Statistics
To assess the influence of the left on inequality dynamics, we constructed an annual panel of 17 Latin American countries from 1992 to 2017. We tested our hypotheses using two different models: a difference-in-differences, or “static” model, and a “dynamic” model that accounts for potential autoregressive dynamics.
Independent Variables
Our main independent variable is a dummy variable that reflects the ideology of the government. We classify governments as left and non-left using the updated ideology score developed by Baker and Greene (Reference Baker and Greene2011). This score is based primarily on an expert survey conducted by Wiesehomeier and Benoit (Reference Wiesehomeier and Benoit2009) that asked respondents to locate parties on a general left-right dimension. Baker and Greene complement this dataset with information from Coppedge (Reference Coppedge1998), Pop-Eleches (Reference Pop-Eleches2009), and their own assessments.
We coded parties with a score equal to or less than 9 (over a 19-point scale) as left. The lowest score for a leftist government in our sample is 2, which corresponds to the governments of Funes (2009–14) and Sánchez Cerén (2014–19), from the FPL in El Salvador; the highest value corresponds to the Nicaraguan government of Daniel Ortega (FSLN), who has been in power since 2007, with a value of 8.55. These governments are listed in table 1. We coded the variable $Lef{t_{i,t}}$
equal to 1 if a left government was elected in country i and year t and 0 otherwise. In the main analysis, once the left was replaced in office by a non-leftist government, we excluded the country from the sample.Footnote
10
$Lef{t_{i,t}}$
equal to 1 if a left government was elected in country i and year t and 0 otherwise. In the main analysis, once the left was replaced in office by a non-leftist government, we excluded the country from the sample.Footnote
10
The main issue with expert coding indexes is that they are built in part to reflect the policies implemented by parties while in office, thereby raising potential endogeneity concerns. To account for this, we coded parties according to the rating they received the first time they entered Baker and Greene’s dataset.Footnote 11 Reassuringly, our classification includes governments from parties that were undeniably leftist before coming to power, like the PT’s Lula da Silva, but also parties that campaigned on the left and governed on the center-right, like Humala’s government in Peru. In turn, it excludes conservative governments that governed on the left, like the government of Manuel Zelaya in Honduras.Footnote 12
To account for any effect the commodities boom may have had on the distribution of incomes, we include two variables: the Terms of trade and the Volume of trade.Footnote 13 For Terms of trade, we use the terms of trade for goods and services from ECLAC (UN-ECLAC 2020). The rationale behind including this control is that better external conditions may affect inequality by increasing government revenues, and through a wealth effect, may induce an increase in the demand for nontradable goods (i.e., the demand for low-skilled workers). For Trade volume (openness), we use data from the World Bank and OECD national accounts. This control is measured by the sum of imports and exports as a percentage of the GDP. By adding Trade volume as a control, we can control for two additional factors: the extra revenues coming from the increase in exports and the possibility that trade exposure could affect the probability of having a left government and levels of inequality simultaneously. Together, these two variables account for the effect of the boom on the government’s fiscal balance, the effect on the relative demand for low-skilled workers, and the effect of trade exposure on inequality.Footnote 14
We also control for the skill distribution of the economy to account for any wage premium on education.Footnote 15 We measure the skill distribution as the ratio of high- versus low-skilled people, where high-skilled are individuals with more than 13 years of formal education and low-skilled are those with 0–8 years of formal education. These data come from SEDLAC (2018).
Furthermore, in the main results section, we add Government control of the congress as an independent variable, using data from the Inter-American Development Bank (IADB) (2017). We use two different measures of congress control. The first is a simple majority dummy variable, which is equal to 1 if the party in office has a seat share higher than 50 percent. The second is the ratio of the number of government seats to the total number of seats in the congress. In addition, to explore the potential interaction effect between government control of the congress and the government ideology, we interact our left variable with the government seat share. Results are displayed in appendix A9.
In the robustness section, we further control for the rate of economic growth, using data from the World Bank; levels of democracy, using the different indexes provided by V-Dem; and changes in the ideological position of the “median voter,” using data from Latinobarometro. See appendix A14 for a full description of these variables.
Dependent Variables
Our main outcome variable is the Gini coefficient of per capita household (disposable) income, which we obtain from the Socio-Economic Database for Latin America and the Caribbean (SEDLAC 2018). In the appendix, we also use the Standardized World Income Inequality Database (SWIDD), which uses a Bayesian approach to standardize observations from several sources (see appendix section A1). We also study changes in the income shares of different groups, again using data from SEDLAC: the income ratio between the 90th and 10th percentiles; the sum of the income shares of the deciles 4, 5, 6, and 7; the income shares of the poorest 10 and 20 percent; and the income share of the richest 10 percent.Footnote 16 These data cover a time span between 1992 and 2017. (Appendix 12 presents the coverage for each variable.)
Additionally, we study the effect of government partisanship on several distributive policies: the real minimum wage (extracted from the LAC Equity Lab), the total spending on conditional and unconditional cash transfers, and the spending on social (i.e., noncontributory) pensions as a percentage of the GDP. Information on these measures comes from the World Bank’s Atlas of Social Protection Indicators of Resilience and Equity (ASPIRE). Furthermore, we examine tax revenue data by country as a percentage of GDP from the OECD. We look at total tax revenue and the revenue coming from taxes on income, rent, profits, and capital gains. The appendix reports mean and standard errors for all of the dependent variables for the full sample, separated by “treated” and “control” countries (appendix A12).
Research Design
Our empirical strategy employs a difference-in-differences (DD) design to study the effect of a leftist government on income inequality and several distributive policies. Our general regression model takes the following form:
 $$Outcom{e_{i,t}} = {\beta _0} + {\beta _1}Lef{t_{i,t}} + {\beta _2}{X_{i,t}} + Countr{y_i} + Yea{r_t} + {{\rm{\varepsilon }}_{{\rm{i}},{\rm{t}}}}$$
where $Outcom{e_{i,t}}$
is a measure of inequality or a policy variable (e.g., the Gini coefficient or the level of the minimum wage) in country i and year t.
$Outcom{e_{i,t}}$
is a measure of inequality or a policy variable (e.g., the Gini coefficient or the level of the minimum wage) in country i and year t. $Lef{t_{i,t}}$
is an indicator variable that equals 1 if a leftist president is in office in country i at time t and 0 otherwise. In our main analysis, once a leftist president is replaced by a non-leftist president, we drop the country from our sample.Footnote
17
$Lef{t_{i,t}}$
is an indicator variable that equals 1 if a leftist president is in office in country i at time t and 0 otherwise. In our main analysis, once a leftist president is replaced by a non-leftist president, we drop the country from our sample.Footnote
17 ${{\rm{\beta }}_1}$
measures the average causal effect of the election of a left-wing government on the outcome variable in year t.
${{\rm{\beta }}_1}$
measures the average causal effect of the election of a left-wing government on the outcome variable in year t. ${X_{i,t}}$
is a vector of time-varying socioeconomic factors.Footnote
18
${X_{i,t}}$
is a vector of time-varying socioeconomic factors.Footnote
18 $Countr{y_i}$
is the country-level fixed effects that capture the time-invariant differences between left and non-left countries.
$Countr{y_i}$
is the country-level fixed effects that capture the time-invariant differences between left and non-left countries. $Yea{r_t}$
is the year fixed effects that control for time-specific shocks. Last,
$Yea{r_t}$
is the year fixed effects that control for time-specific shocks. Last, ${{\rm{\varepsilon }}_{{\rm{i}},{\rm{t}}}}$
is the idiosyncratic error term. In all our specifications, we cluster standard errors at the country level to take care of serial correlation.
${{\rm{\varepsilon }}_{{\rm{i}},{\rm{t}}}}$
is the idiosyncratic error term. In all our specifications, we cluster standard errors at the country level to take care of serial correlation.
Testing for Parallel Trends
The key assumption of the DD strategy is the existence of parallel trends (in the absence of treatment) between treatment and control countries. Even though this assumption cannot be tested directly, we can examine whether pretrends in inequality differ for “treated” and “untreated” countries. Our DD strategy is likely to produce biased and inconsistent estimates if pretreatment levels of inequality determine both the probability of a leftist party being elected and the concurrent level of inequality. Under the parallel trend assumption, this should not happen. To validate the assumption that the trends of the treatment and control groups would be parallel absent the elected leftist government, we employ a strategy akin to an event-study regression:
 $$Outcom{e_{i,t}} = \mathop \sum \nolimits_{ \in t\left( { \le - 3, - 2,0,1,2,3 + } \right)} {\beta _1}Lef{t_{i,t}} + {\beta _2}{X_{i,t}} + Countr{y_i}\; + Yea{r_t} + {{\rm{\varepsilon }}_{{\rm{i}},{\rm{t}}}}\;$$
where $Lef{t_{i,t}}$
is a set of indicator variables that equal 1 if t years have passed since the left was elected in country i, where t is between –3 and 3+, and 3+ indicates three years or more. The year before the leftist government is elected is omitted and used as the comparison group. If the coefficients associated with three years or more before the treatment (
$Lef{t_{i,t}}$
is a set of indicator variables that equal 1 if t years have passed since the left was elected in country i, where t is between –3 and 3+, and 3+ indicates three years or more. The year before the leftist government is elected is omitted and used as the comparison group. If the coefficients associated with three years or more before the treatment ( ${\beta _{1, \le - 3}}$
) and two years before the treatment (
${\beta _{1, \le - 3}}$
) and two years before the treatment ( ${\beta _{1, - 2}}$
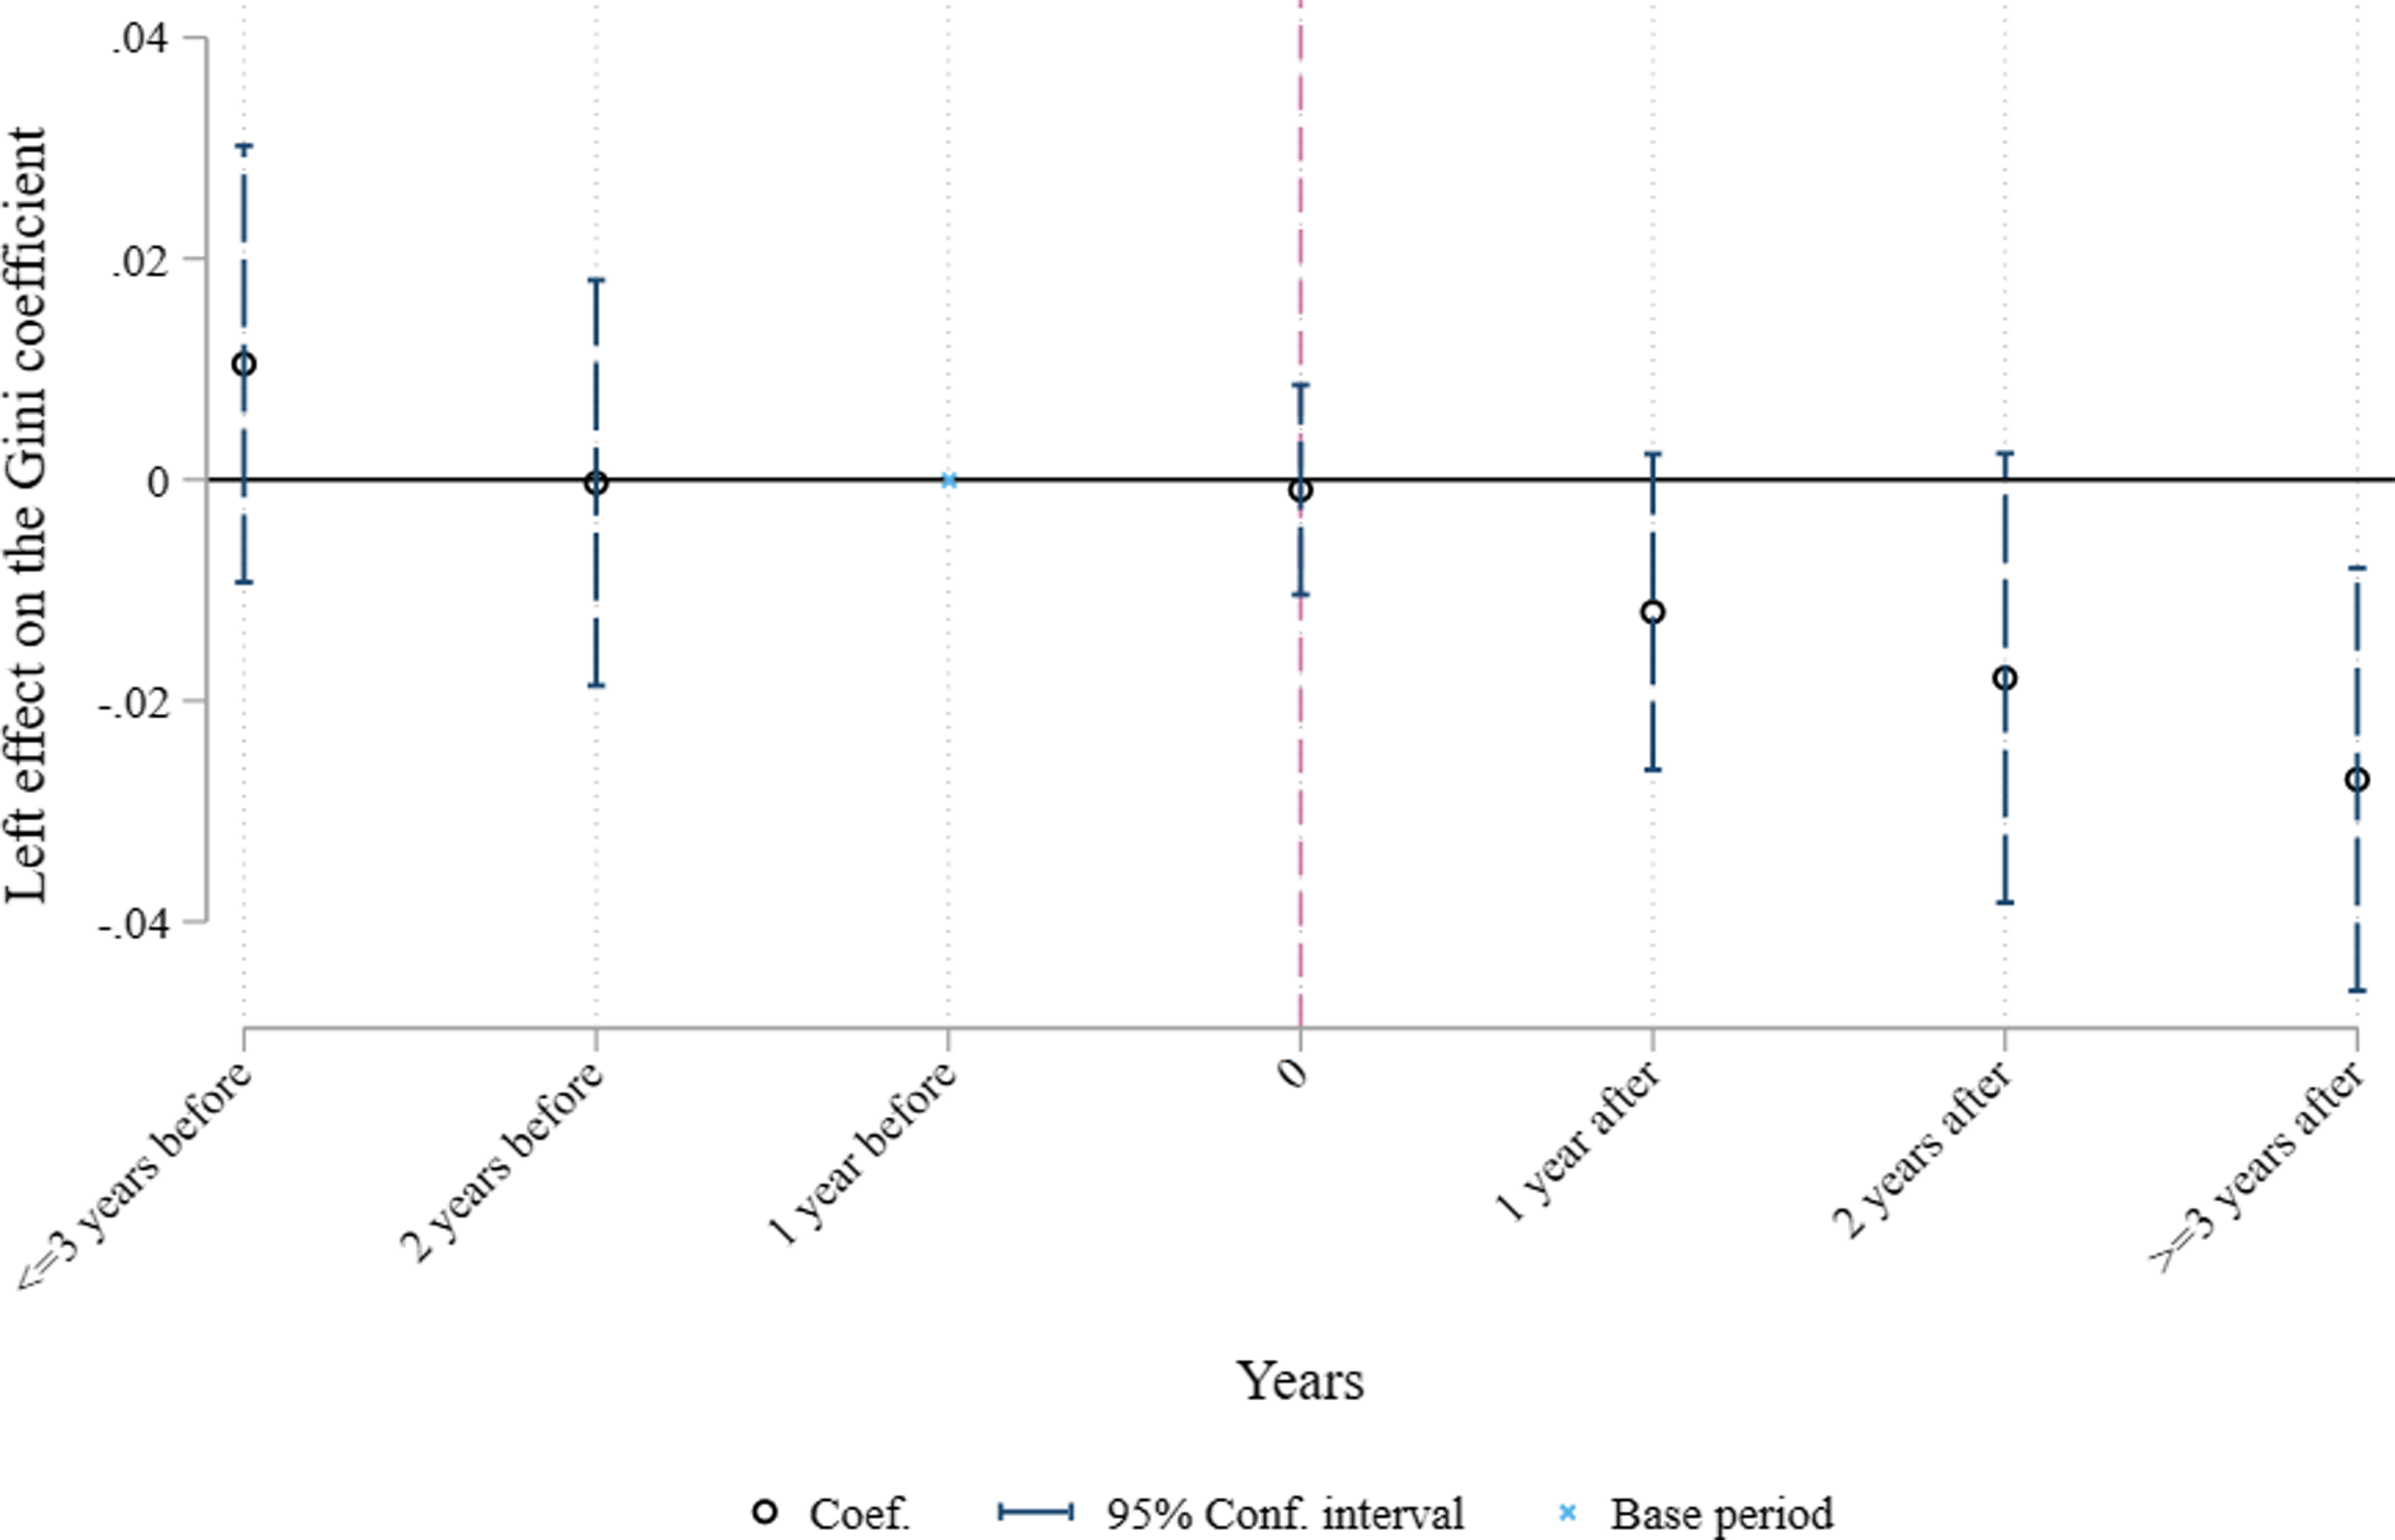
) are not significantly different from zero, the parallel trends assumption is likely to hold. Figure 2 shows the estimates for the Gini coefficient, our main dependent variable. Before the left takes office, the coefficients are not statistically significant, and they are very close to zero. Once the left is in power, however, inequality drops rapidly and significantly in these left-governed countries, lending initial support to our main hypothesis. Appendix A5 presents results for the other dependent variables showing similar trends.Footnote
19
${\beta _{1, - 2}}$
) are not significantly different from zero, the parallel trends assumption is likely to hold. Figure 2 shows the estimates for the Gini coefficient, our main dependent variable. Before the left takes office, the coefficients are not statistically significant, and they are very close to zero. Once the left is in power, however, inequality drops rapidly and significantly in these left-governed countries, lending initial support to our main hypothesis. Appendix A5 presents results for the other dependent variables showing similar trends.Footnote
19
Trends in Inequality Before and After the Left Takes Office
Notes: Each coefficient corresponds to the change in the Gini coefficient relative to the change one year before the leftist government begins. The dashed line represents the year the left government begins. We control for the terms of trade, the total trade relative to the GDP, and the ratio between high-skilled and low-skilled workers.
These results are consistent with research on elections in Latin America. While Debs and Helmke (Reference Debs and Helmke2010) suggest that there may be an inverted-U–shape relationship between inequality and voting, with inequality pushing poor voters to the left at medium levels of inequality, other studies have failed to find a link between levels of inequality and support for leftist candidates when examining the rise of the Pink Tide. Kaufman reviews survey evidence, controlled-case comparisons, and electoral returns, and concludes that “there is no systematic relation between income inequality and left voting” (Reference Kaufman2009, 364). Similarly, Murillo et al. claim “retrospective evaluations of right-leaning presidents of the 1990s and their poor performance in handling the economy … explain the increase in left vote share in the 2000s” (Reference Murillo, Oliveros and Vaishnav2010, 90). Baker and Greene (Reference Baker and Greene2011) also fail to find a relationship between income inequality and support for the left. In most cases, leftist parties consolidated their support among the poor only after taking office.Footnote 20 Therefore, our assumption that government ideology was orthogonal to past trends in inequality seems to have empirical support.
Estimation
We estimate equation 1 using standard OLS regression. This equation models the data-generating process linearly and in a “static” fashion—that is, it assumes that past treatments do not affect current versions of the outcome (Imai and Kim Reference Imai and Song Kim2019). Even though the parallel trends assumption cannot be rejected, it is not unthinkable that past levels of inequality could affect both the government’s future political orientation and ensuing levels of inequality. If that is the case, trends in non-left countries are not a good counterfactual for trends in countries governed by the left; the coefficient for the treatment effect would reflect the compound effect of the left, as well as the effect from autoregressive dynamics.
We address this concern by employing an additional “dynamic” linear model that controls for autoregressive effects. This model includes one lag of the outcome variable to account for the possibility that past outcomes may affect current levels of both the outcome and the treatment. We include only one lag because once it is added to our model, we cannot reject the null hypothesis that there is no serial correlation in the residuals of the model for the corresponding AR2 test.Footnote 21 Our model takes the following form:
 $$Outcom{e_{i,t}} = {\beta _0} + {\beta _1}Lef{t_{i,t}}\; + {\beta _2}{X_{i,t}} + \rho \;Outcom{e_{i,t - 1}}\; + Yea{r_t} + \;{{\rm{\varepsilon }}_{{\rm{i}},{\rm{t}}}}\;$$
The assumption behind this model is that, conditional on the lags of the outcome variable, time-varying covariates, and year fixed effects, countries with a leftist president are not on a different trend. We estimate this model using the Generalized System Method of Moments (GMM) proposed by Arellano and Bover (Reference Arellano and Bover1995) and Blundell and Bond (Reference Blundell and Bond1998). We obtain the long-term effect of a Left victory using a Koyck transformation. For more detail about how to compute the long-run effects, see section A8 in the appendix. To see the extended results, see table A3 in appendix 4.
The Effect of the Left on Income Inequality
We first present results on the relationship between left incumbency and income inequality using the “static” version of our model (equation 1). Table 2 presents the conditional relationship between government ideology and different measures of inequality. For the Gini index, the coefficient for left incumbency is negative and statistically significant at the 1 percent level. Countries with a leftist president featured a drop of 2.4 Gini points higher than non-left countries. The left increases the income share of the deciles in the bottom and middle of the income distribution. On average, the increase in the income share of the bottom 20 percent is roughly 9 percentage points higher relative to what happens to the same group under a non-left government (p < 0.05). The middle-income deciles also benefit with the left: the income share of deciles 4 through 7 is 4 percent higher (p < 0.01). Conversely, the income share of the top 10 percent drops 5 percentage points more than in non-left countries, and the income ratio between the centiles 90 and 10 drops by 11 percentage points more in countries governed by the left (p < 0.01). Overall, our findings suggest that the left premium comes from an increasing income share of the first seven deciles at the expense of the top 10 percent.
The Effect of the Left on Income Inequality
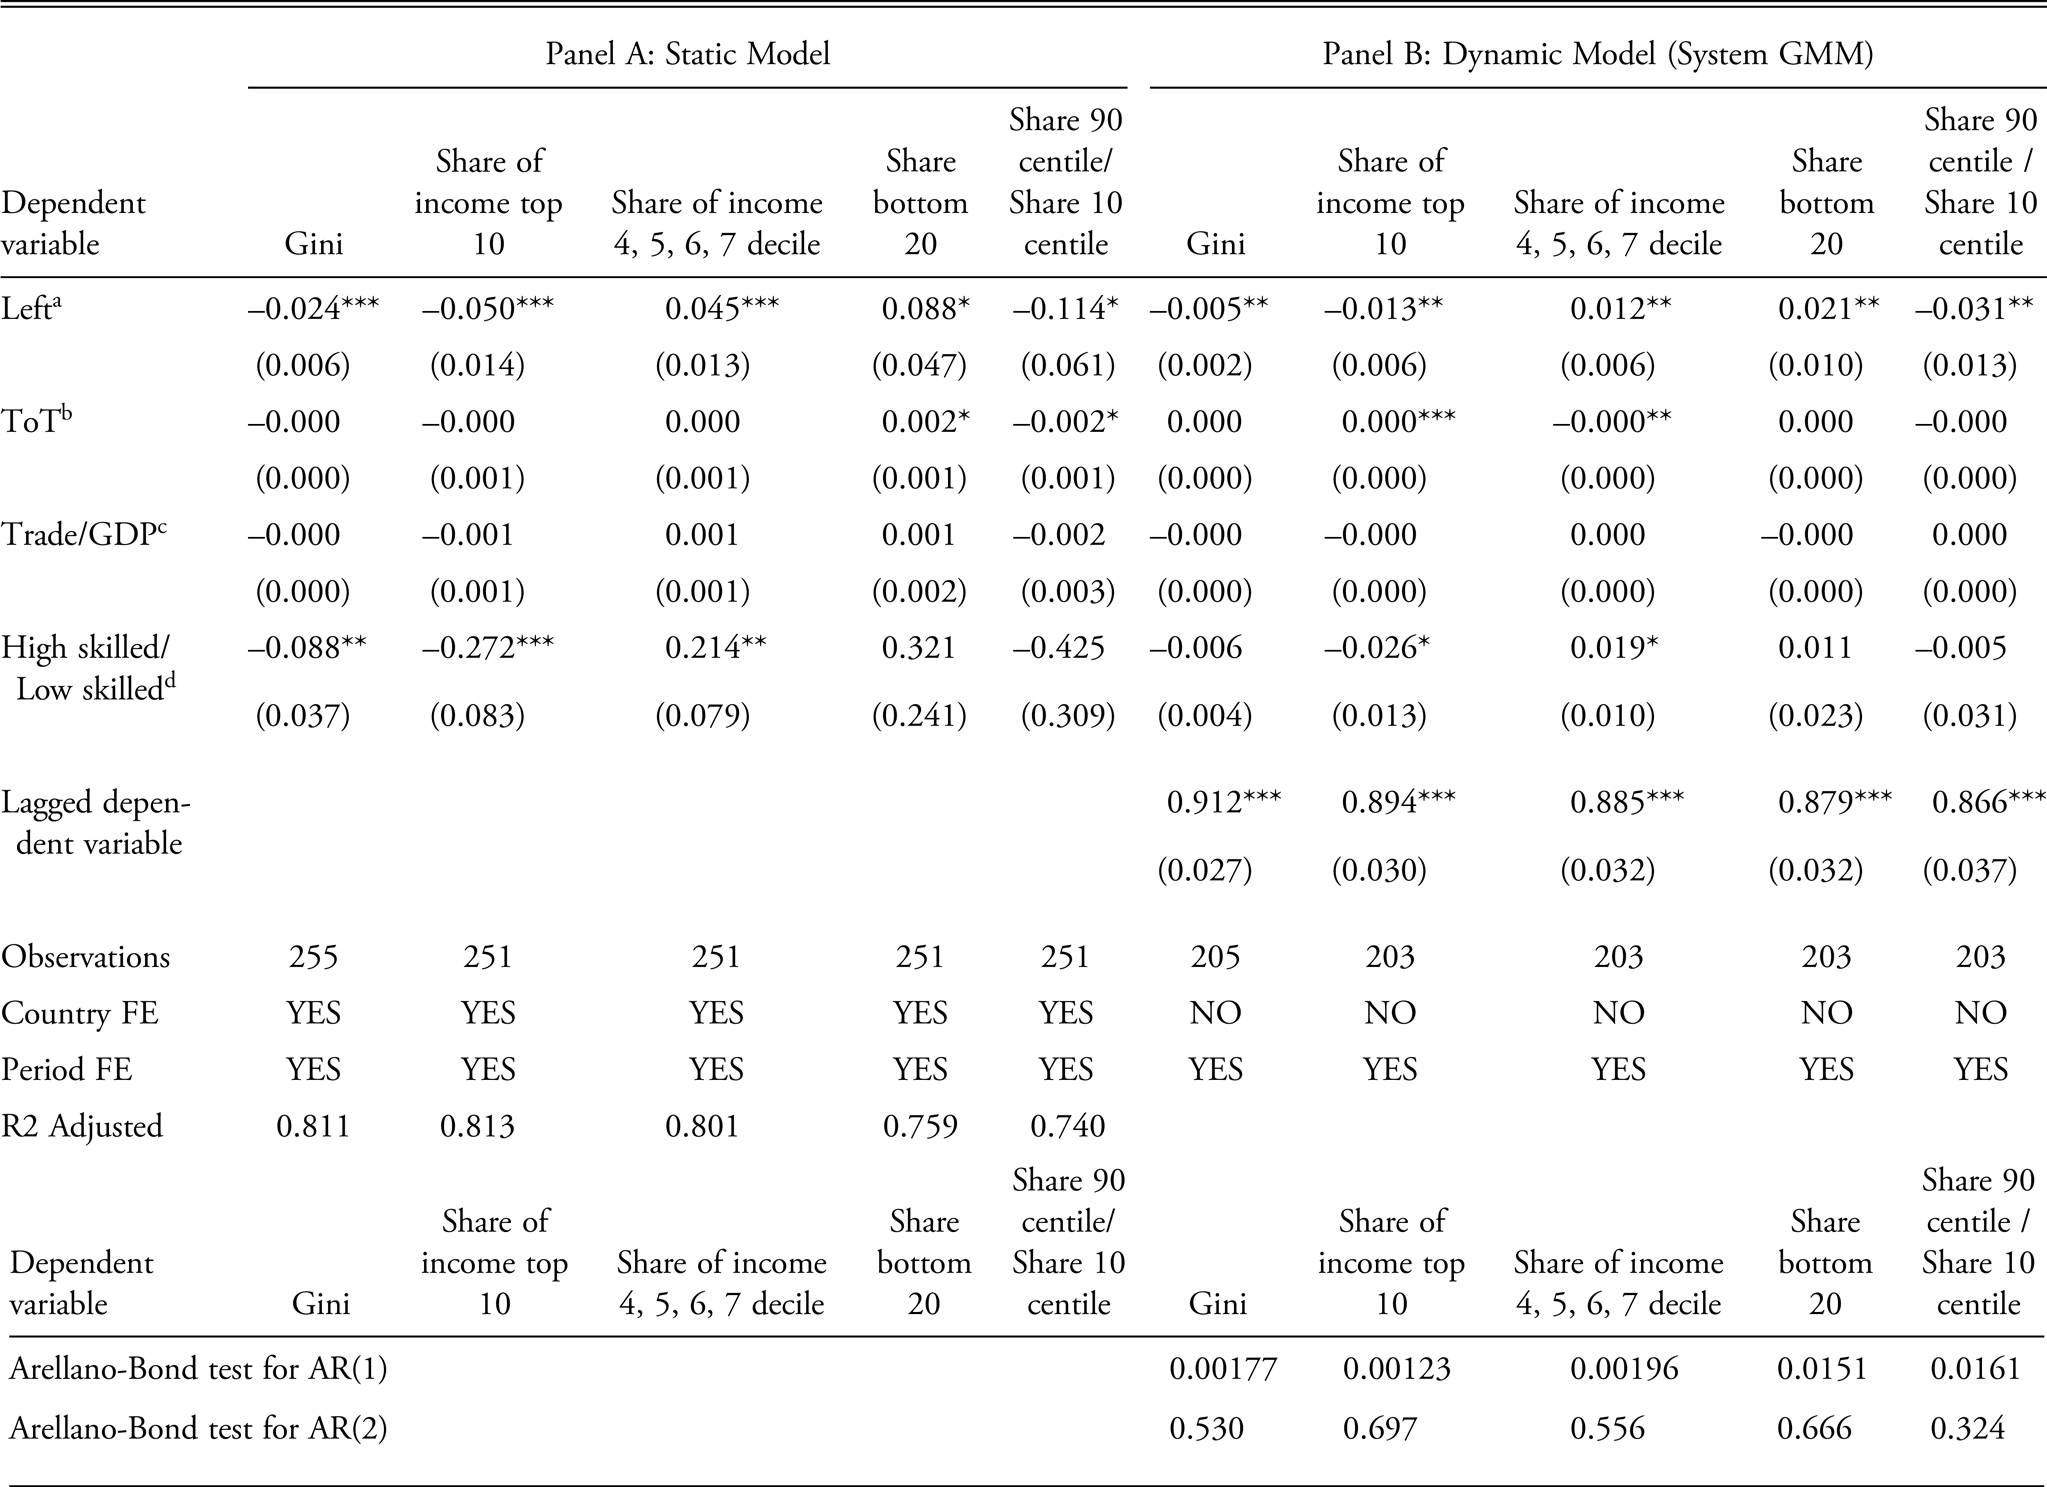
***p < 0.01, **p < 0.05, *p < 0.1.
Clustered standard errors at country level in parentheses.
a Left is equal to missing after left-governed countries go back to being governed by a non-left government.
b ToT is the level of terms of trade for each country.
c Trade/GDP is the level of the ratio between all trade and GDP for each country.
d High skilled/Low skilled is the level of the ratio between high- and low-skilled workers.
We obtain similar results once we account for potential autoregressive effects (panel B, table 2). In countries governed by a leftist government, the Gini index declines and the income shares for the first seven deciles increase, again at the expense of the top 10 percent. In addition to the instantaneous or short-run effects reported in the table, we can calculate the aggregate long-run effect of a left government maintaining power over time using the dynamic model (figure 3). If the left stayed in power for four years, the cumulative effect would be 2 percentage points; and for eight years, the effect would be 3 percentage points.
Cumulative Impact of the Left on Inequality Measures over Time
Notes: The solid black lines represent the estimated effect of being governed by a leftist government at each point in time. Gray dashed lines represent the 95 percent confidence interval. The x axis shows the number of years since the start of the leftist government.
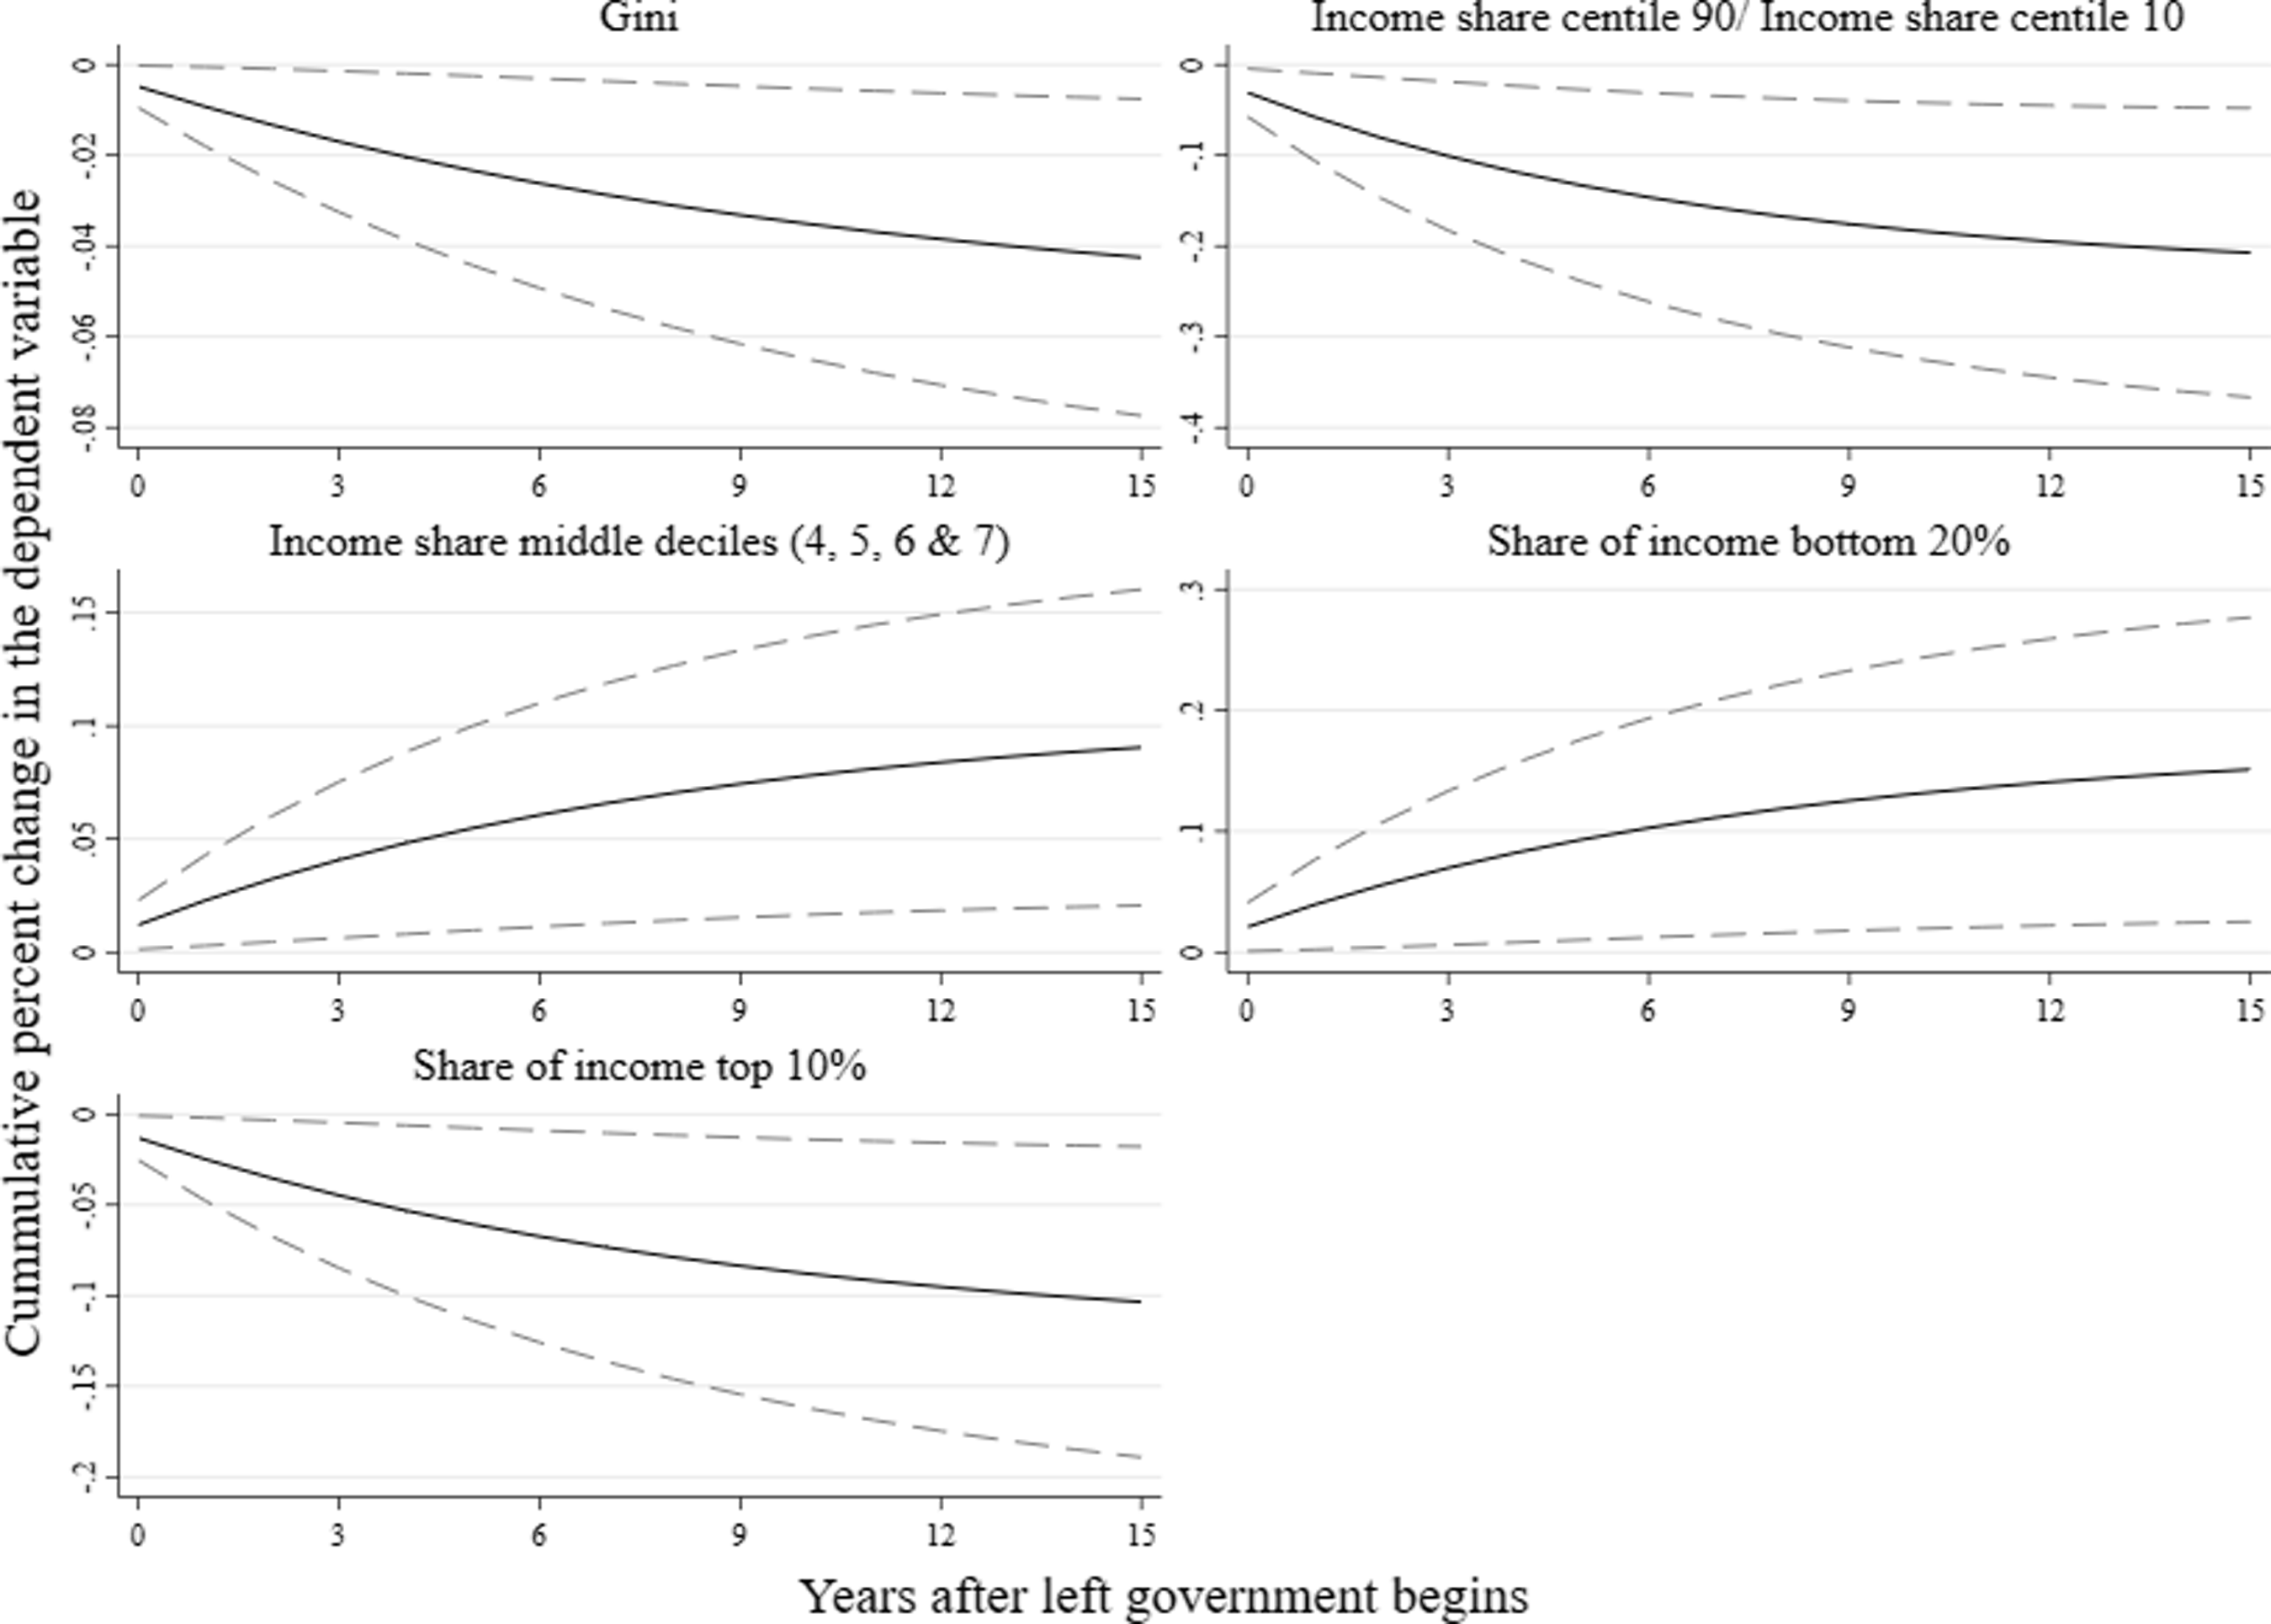
The asymptotic long-run effect (i.e., if the left stayed in office for a prolonged period) of a change from a non-left to a left regime on the Gini coefficient would be equal to an extra drop of 5.5 percentage points. Similarly, the left in office would cause a fall of 12.4 percentage points in the income share of the top 10 percent in the long run, while the bottom 20 percent would accumulate an additional 17.3 percentage point share of the national income. The income shares of the middle deciles (4, 5, 6, and 7), in turn, would increase by 10.5 percentage points (table A2 in appendix 3 presents the full results). These results are obtained under ceteris paribus conditions—that is, ignoring, among other things, the intertemporal sustainability of policies.
From an institutional perspective, this effect of the left on inequality may seem unsurprising, given the large majorities that many of these left-leaning presidents enjoyed during their time in office. On average, left presidents controlled 52.6 percent of the seats in the legislative arena and an absolute majority 58.3 percent of that time. Non-left presidents, in contrast, had a slightly weaker support in Congress (51.2 percent) and spent less time holding a majority (51.2 percent). Higher support in Congress should allow left governments to conduct equalizing policies with less political resistance. To examine this point, we control for different measures of congressional majority and interact these variables with our $Lef{t_{i,t}}$
indicator.
$Lef{t_{i,t}}$
indicator.
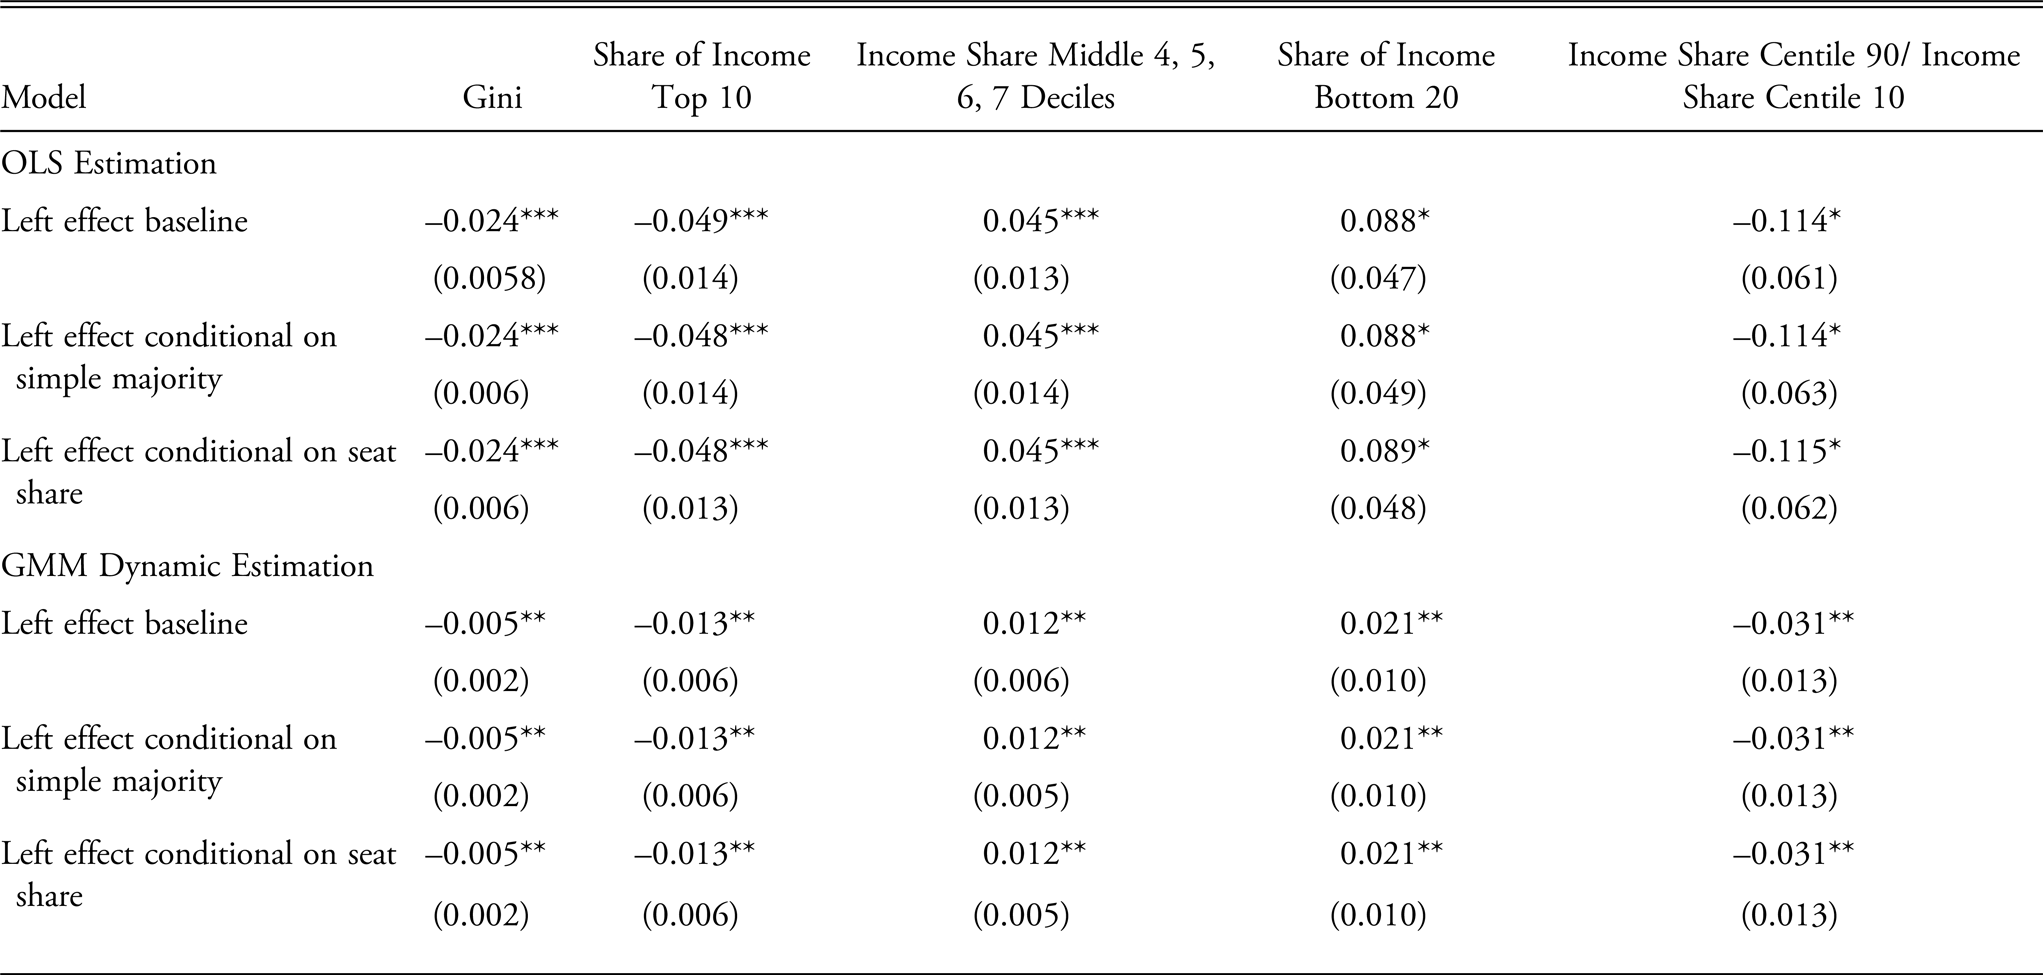
Table 3 shows that once we control for a president’s congressional support, the coefficient for $Lef{t_{i,t}}$
remains technically unchanged across the models. In appendix A9, we show that the interaction between the left dummy and the seat share reveals two factors: first, leftist governments accomplish a higher reduction in inequality over all the potential values of the seat share; second, governments with higher control of the congress accomplish higher inequality reductions. Our estimation suggests that increasing the seat share of a leftist government by one standard deviation (approximately 16 percentage points) will induce an extra drop of 0.7 Gini points (see appendix A9).
$Lef{t_{i,t}}$
remains technically unchanged across the models. In appendix A9, we show that the interaction between the left dummy and the seat share reveals two factors: first, leftist governments accomplish a higher reduction in inequality over all the potential values of the seat share; second, governments with higher control of the congress accomplish higher inequality reductions. Our estimation suggests that increasing the seat share of a leftist government by one standard deviation (approximately 16 percentage points) will induce an extra drop of 0.7 Gini points (see appendix A9).
Left Effect Conditional on Government Power in Congress
***p < 0.01, **p < 0.05, *p < 0.1.
Clustered standard errors at country level in parentheses.
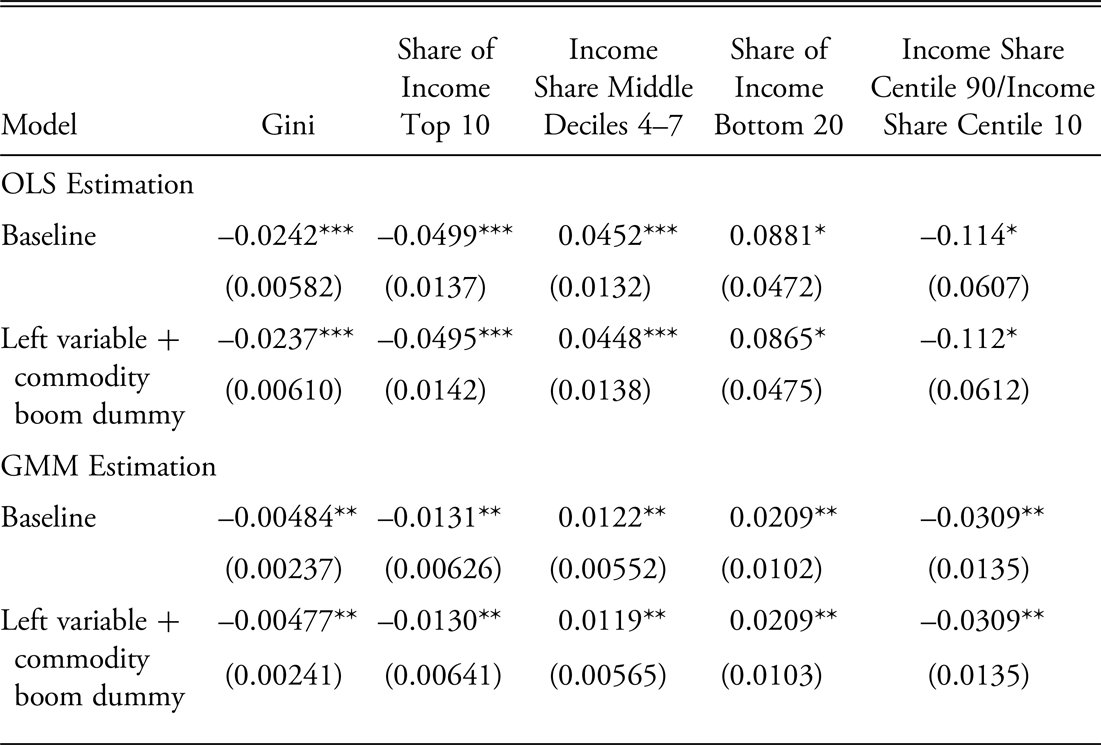
From an economic perspective, a similar logic may apply to the effect of the commodities boom on the left’s capacity to engage in redistribution. We account for this potential confounding factor in several ways. First, we control for variables that proxy for the commodities boom and its alleged effects. As a second step, we estimate models with an additional control variable: for each country, we control for the period in which it experienced a commodities boom. The commodities boom variable is equal to 1 from the first year in which the terms of trade rose until they peaked, starting in 2000, and 0 otherwise.
Table 4 shows that the point estimates and statistical significance for the left dummy in our “static” and “dynamic” models remain largely unchanged. In addition, we run models interacting the trade variables with our left indicator, to assess whether the left was more or less redistributive depending on the external context and the availability of additional fiscal rents. Our results suggest that the equalizing effect of the left does not vary across different levels of the terms (see figure A1 in appendix A2).
Left Effect and Commodities Boom
***p < 0.01, **p < 0.05, *p < 0.1.
Clustered standard errors at country level in parentheses.
Note: The commodity boom dummy is equal to one from the first year in which the terms of trade rose until they peaked, since 2000.
The Effect of the Left on Direct Transfers, Minimum Wages, and Taxation
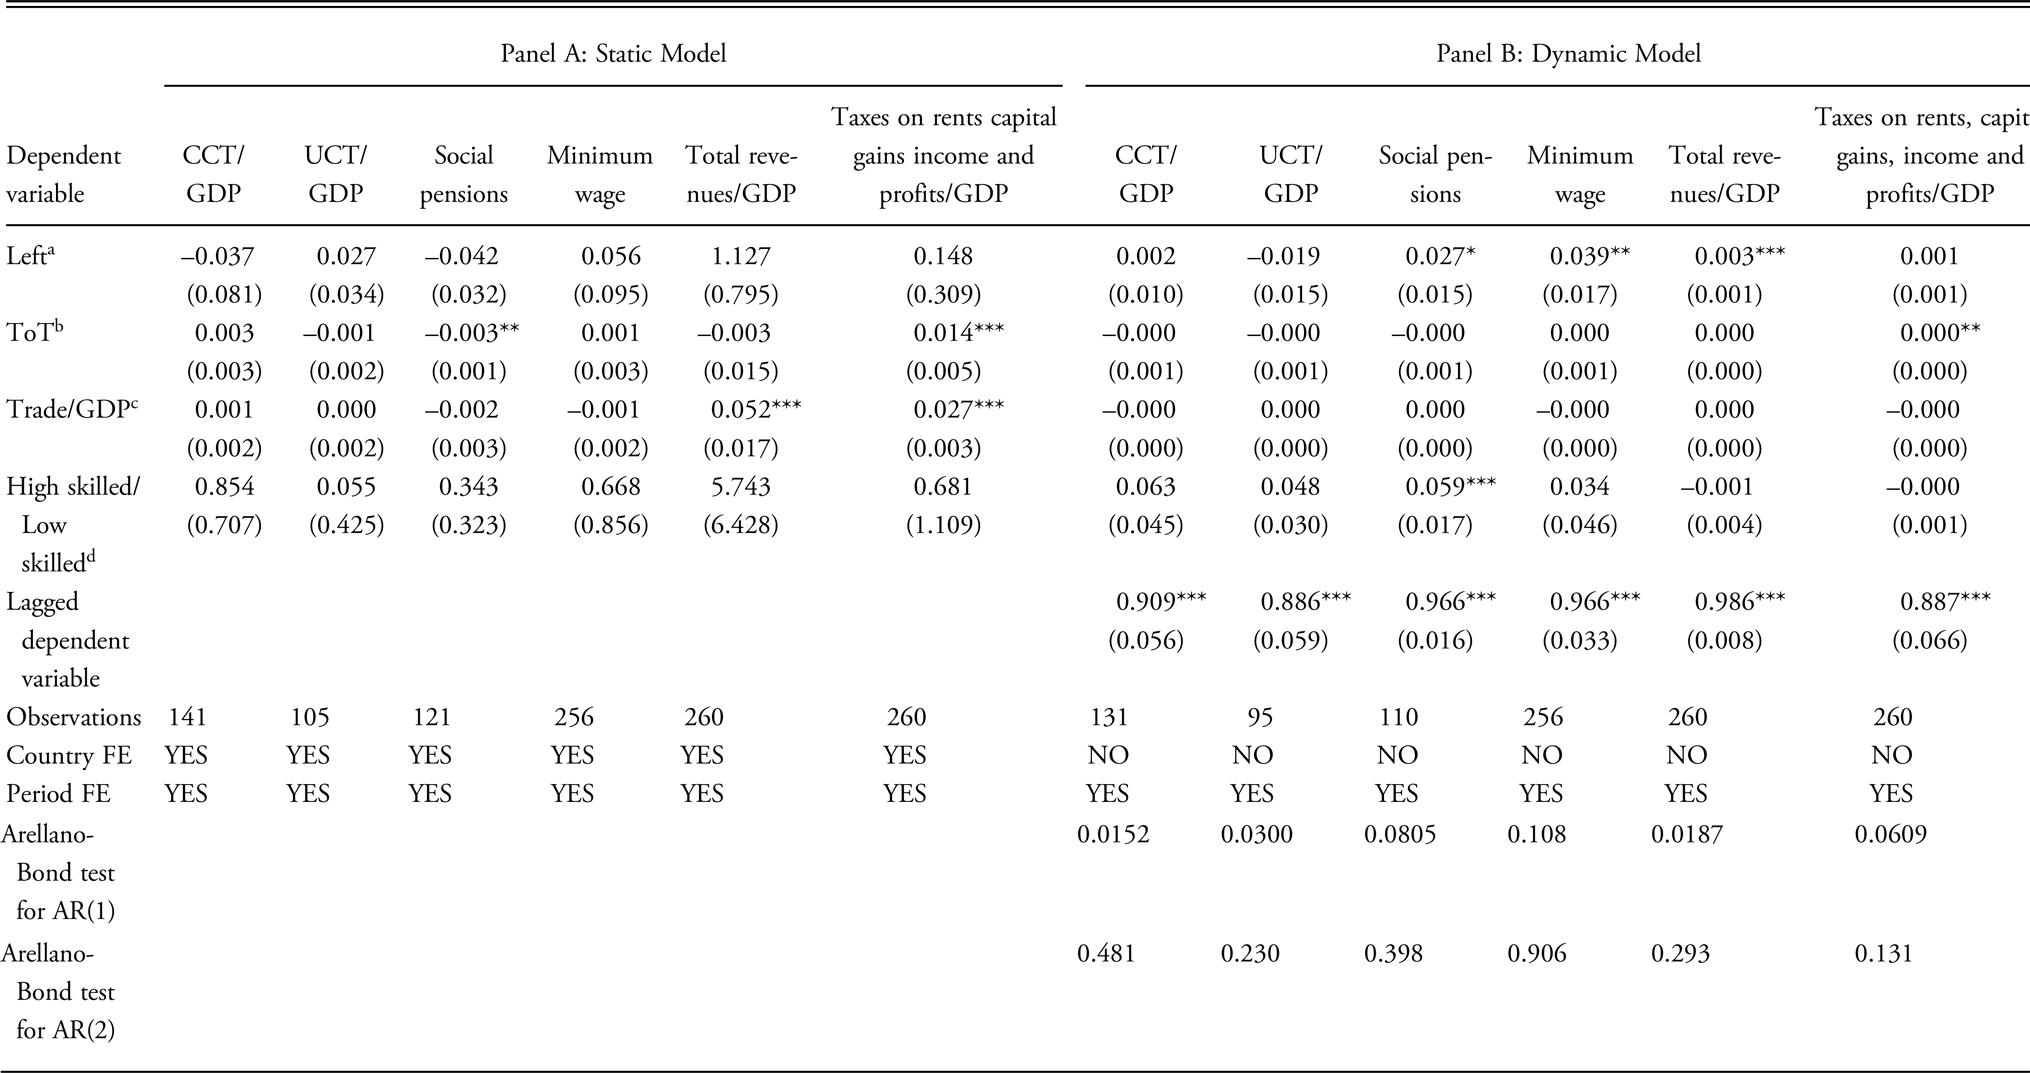
In this section, we explore the policies through which a leftist government might influence inequality performance in a country during its time in office. In particular, we examine the impact of the left on several types of direct transfers, the minimum wage, and a country’s tax policy (table 5). While the coefficient for $Lef{t_{i,t}}$
fails to achieve statistical significance at conventional levels for any of the policy outcomes in the static model, we find a significant effect of left incumbency on tax revenues, the minimum wage, and social pensions using our dynamic model. Reassuringly, the signs of the estimates for the static models are all in line with the estimates from the autoregressive models (see tables A3 and A4 in appendix 4).
$Lef{t_{i,t}}$
fails to achieve statistical significance at conventional levels for any of the policy outcomes in the static model, we find a significant effect of left incumbency on tax revenues, the minimum wage, and social pensions using our dynamic model. Reassuringly, the signs of the estimates for the static models are all in line with the estimates from the autoregressive models (see tables A3 and A4 in appendix 4).
The Effects of Left on Transfers, Social Pensions, Minimum Wages, and Taxes
***p < 0.01, **p < 0.05, *p < 0.1.
Clustered standard errors at country level in parentheses.
a Left is equal to missing after left-governed countries go back to being governed by a non-left government.
b ToT is the level of terms of trade for each country.
c Trade/GDP is the level of the ratio between all trade and GDP for each country.
d High skilled/Low skilled is the level of the ratio between high- and low-skilled workers.
Our estimation on the effect of the left on tax revenues over GDP relative to a non-leftist government ranges from 0.3 (dynamic model) to 1.13 percentage points.Footnote 22 In appendix 3, we show that if the left stayed in power for one, four, and eight years, the cumulative effect on the total tax revenues as a percentage of the GDP would be 0.6, 1.6, and 3 percentage points, respectively (see table A3 in appendix 3). These results are in line with the general findings presented in Fairfield (Reference Fairfield2015, 272–73). She shows that left governments in Argentina, Chile, and Bolivia increased revenue, for instance, by promoting large antievasion reforms, while the right skewed these policies to avoid increasing the tax burden on the rich. Fairfield also shows that the left was not weary of raising tax revenues through less progressive indirect taxes (see also Castañeda and Doyle Reference Castañeda and Doyle2019).
From Lambert’s fundamental equation on the redistributive effect of fiscal systems, we know that when taxes increase in a progressive fiscal system, the system becomes more equalizing.Footnote 23 From Lustig (Reference Lustig2020), we know that in all Latin American countries, the combination of taxes and transfers reduces inequality. In addition, 26 out of 28 studies hosted by the CEQ Data Center on Fiscal Redistribution suggest that countries in the region display progressive tax systems. Thus, one plausible mechanism through which the left redistributes income is by raising revenue at a higher pace than countries with non-leftist presidents in office, even if doing so does not affect the progressiveness of the tax system. In fact, the coefficient for the effect of left incumbency on direct taxes (i.e., taxes on rents, incomes, profits, and capital gains) is positive but small and statistically insignificant at conventional levels. Unlike Stein and Caro (Reference Stein and Caro2013), who find that leftist governments collect more taxes from direct taxes, such as income tax, our results, based on a different classification of governments, a larger time series, and a more updated version of the tax data, do not suggest significant differences in terms of income tax collection between left and non-left governments.
We also find that the left implements more generous social pensions, on average 2.7 percentage points more than countries not governed by the left. After one year of the left in office, social pensions as a percentage of the GDP would be 12.4 percentage points higher, and after four and eight years, social pensions would increase by 20.9 and 78.5 percentage points, respectively.Footnote 24 These findings match the conclusions reached by Huber and Stephens (Reference Huber and Stephens2012). While several scholars show that both left and right governments implemented social transfer policies during this period, these authors show that leftist governments promoted more generous benefits than non-left governments. Garay (Reference Garay2016) and Pribble (Reference Pribble2013) also argue that the left promoted more extensive reforms, but only under some circumstances—for example, when the party had linkages with social organizations. Instead, we find an unconditional effect of the left on the expansion of social pensions.
The level of the minimum wage also increases under the left, in line with descriptive data presented earlier. The effect of the left on the real minimum wage one year after taking office was an increase of 7.7 percentage points, 18.3 percentage points after four years, and 30.8 percentage points after eight years of being in power (figure 4). A qualitative study examining the labor policies of Argentina, Brazil, Chile, and Uruguay during the Pink Tide suggests, in a similar vein, that these governments introduced steady increases in the minimum wage, particularly in Argentina, Uruguay, and Brazil (Cook and Bazler Reference Cook and Bazler2013).
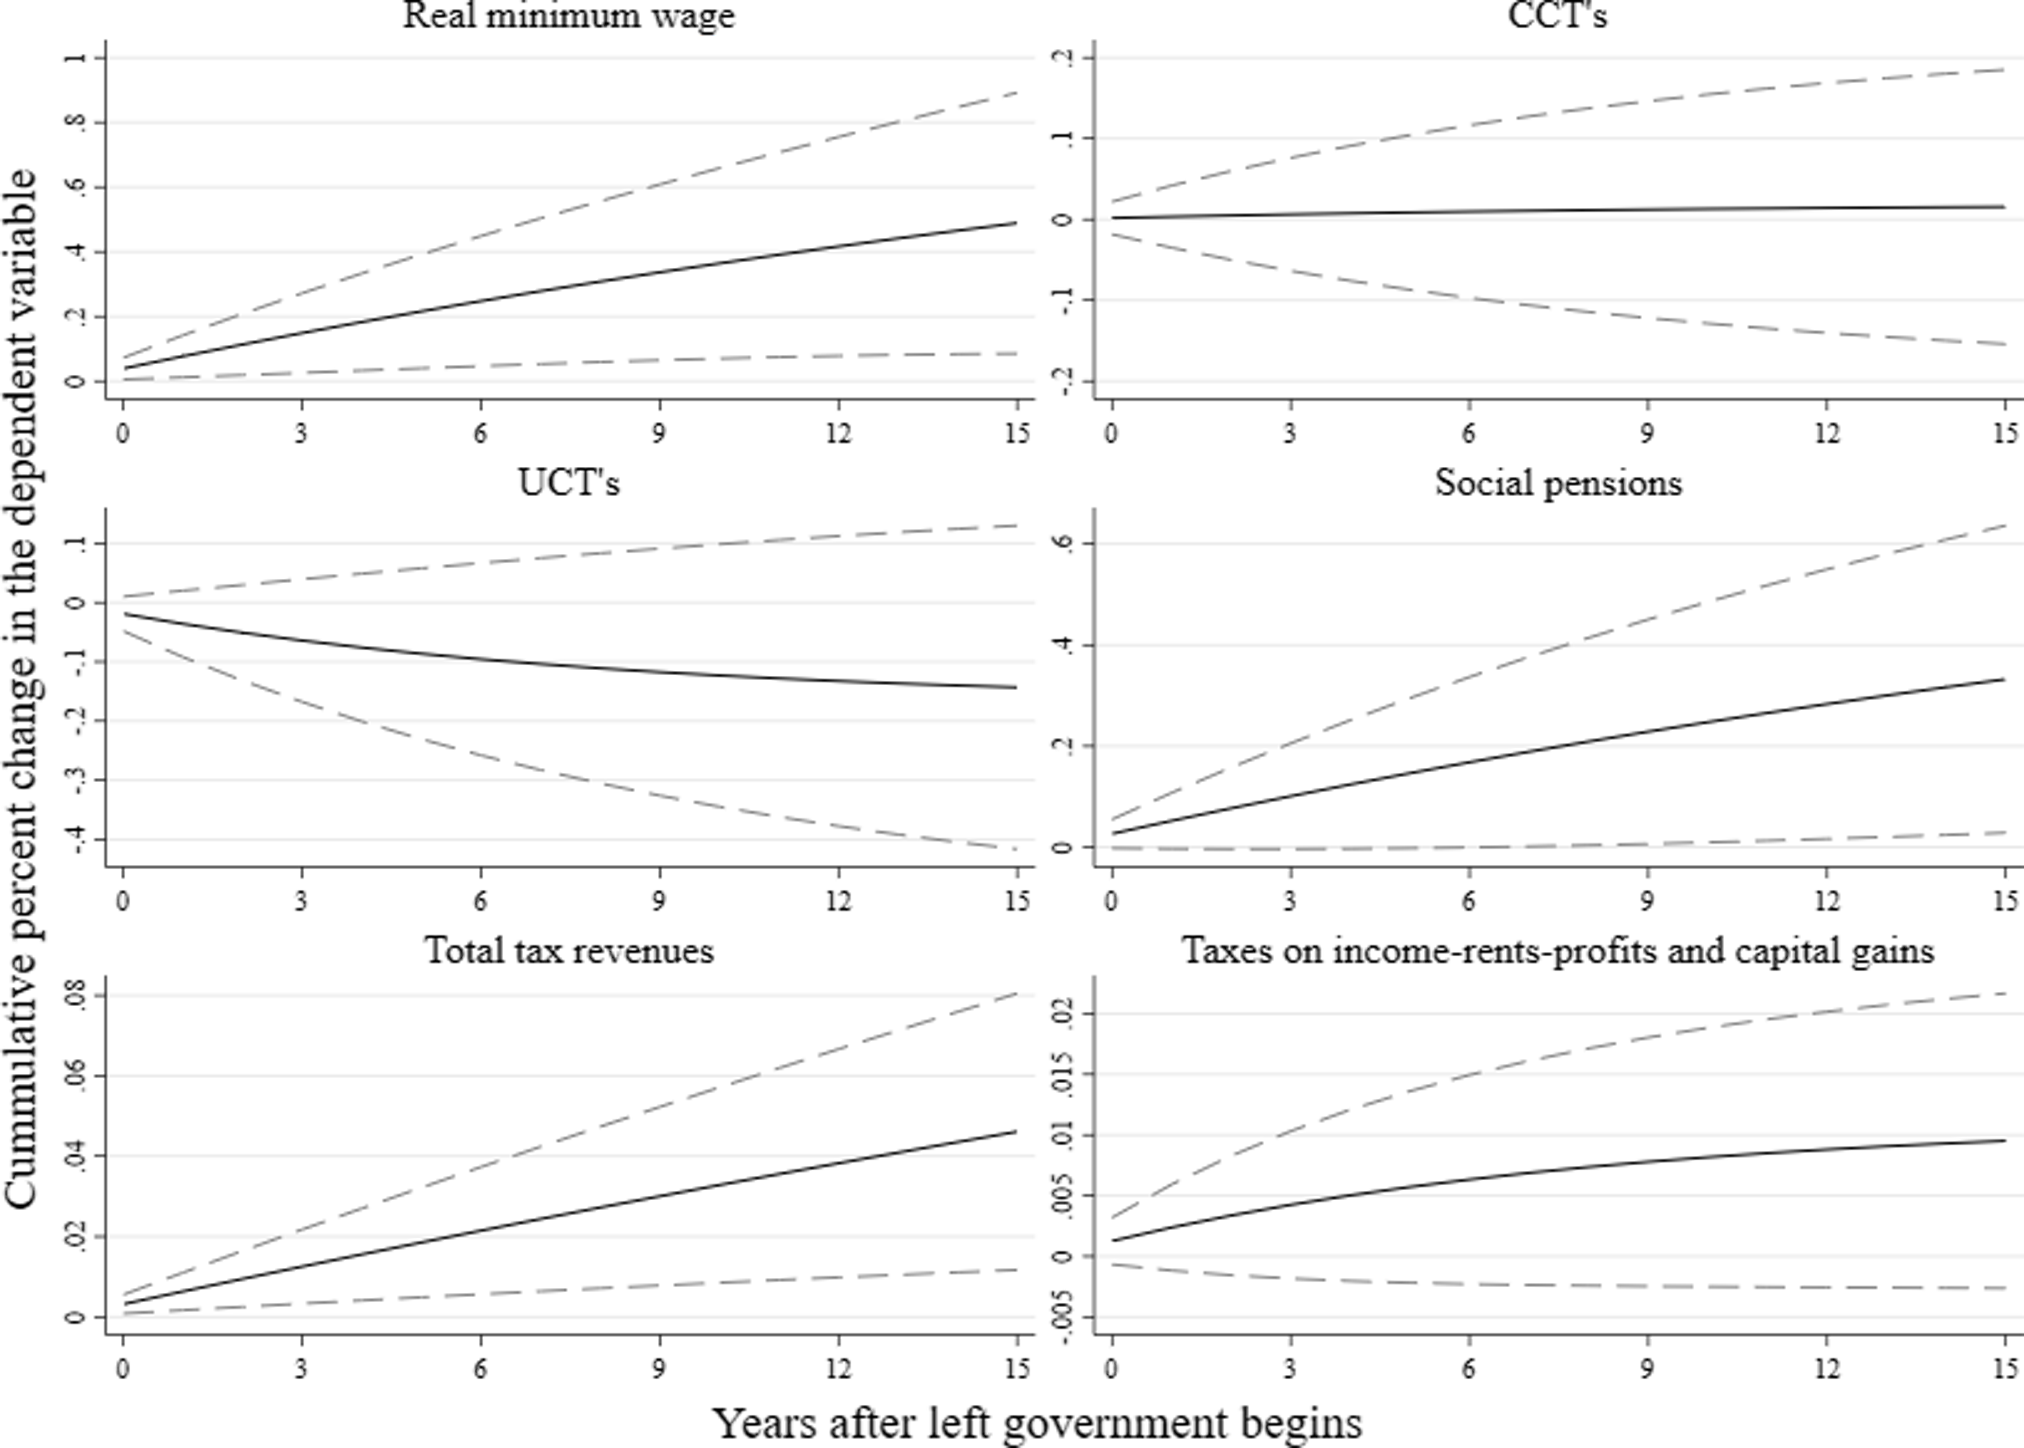
In contrast, we find no evidence that leftist governments expand cash transfers, either conditional or unconditional, more than non-leftist government. CCTs were introduced or greatly expanded during these years; this expansion took place under leftist (e.g., in Argentina, Bolivia, and Brazil) and non-leftist presidents (e.g., in Colombia and Mexico). While this is in line with studies showing that both right and left presidents were equally likely to implement CCTs (Brooks Reference Brooks2015; Díaz-Cayeros et al. Reference Díaz-Cayeros, Estévez and Magaloni2016), our findings cast some shadow on analyses suggesting that these transfers in particular were more generous or progressive under the left.
Of course, we cannot test all the potential policy channels through which the left may induce a contemporaneous reduction of inequality. In particular, we cannot tell which of the policies that the left is more likely to implement causes the “leftist premium” in inequality reduction that we identified earlier.Footnote 25 Similarly, there may be other policies ignored by the policy literature affecting inequality, or policies that affect inequality contemporaneously could interact in complex ways. That said, our analysis suggests both that inequality declines more under the left and that the left implements a range of policies that are likely to impact inequality in the same equalizing direction.
Robustness Tests
Even if the parallel trends assumption holds, other factors could compromise our results. Below, we assess the robustness of our results to varying samples, measurement choices, and the inclusion or exclusion of control variables. Figure 5 plots the coefficient estimates for our leftist government indicator for several alternative specifications.
Stability in the Point Estimates of the Difference-in-Difference Estimator
Notes: The black circle represents the point estimate of the left dummy coefficient for each one of the subsamples specified on the y axis. The horizontal dashed line shows the 95 percent confidence interval. The vertical solid line shows the value of the estimate in our preferred specification. The GDP per capita growth comes from the World Bank and is the index of the GDP per capita based on constant local currency. We use as control variables the terms of trade, trade openness, and the ratio of high-skilled to low-skilled workers.
* The data come from Latinobarometro.
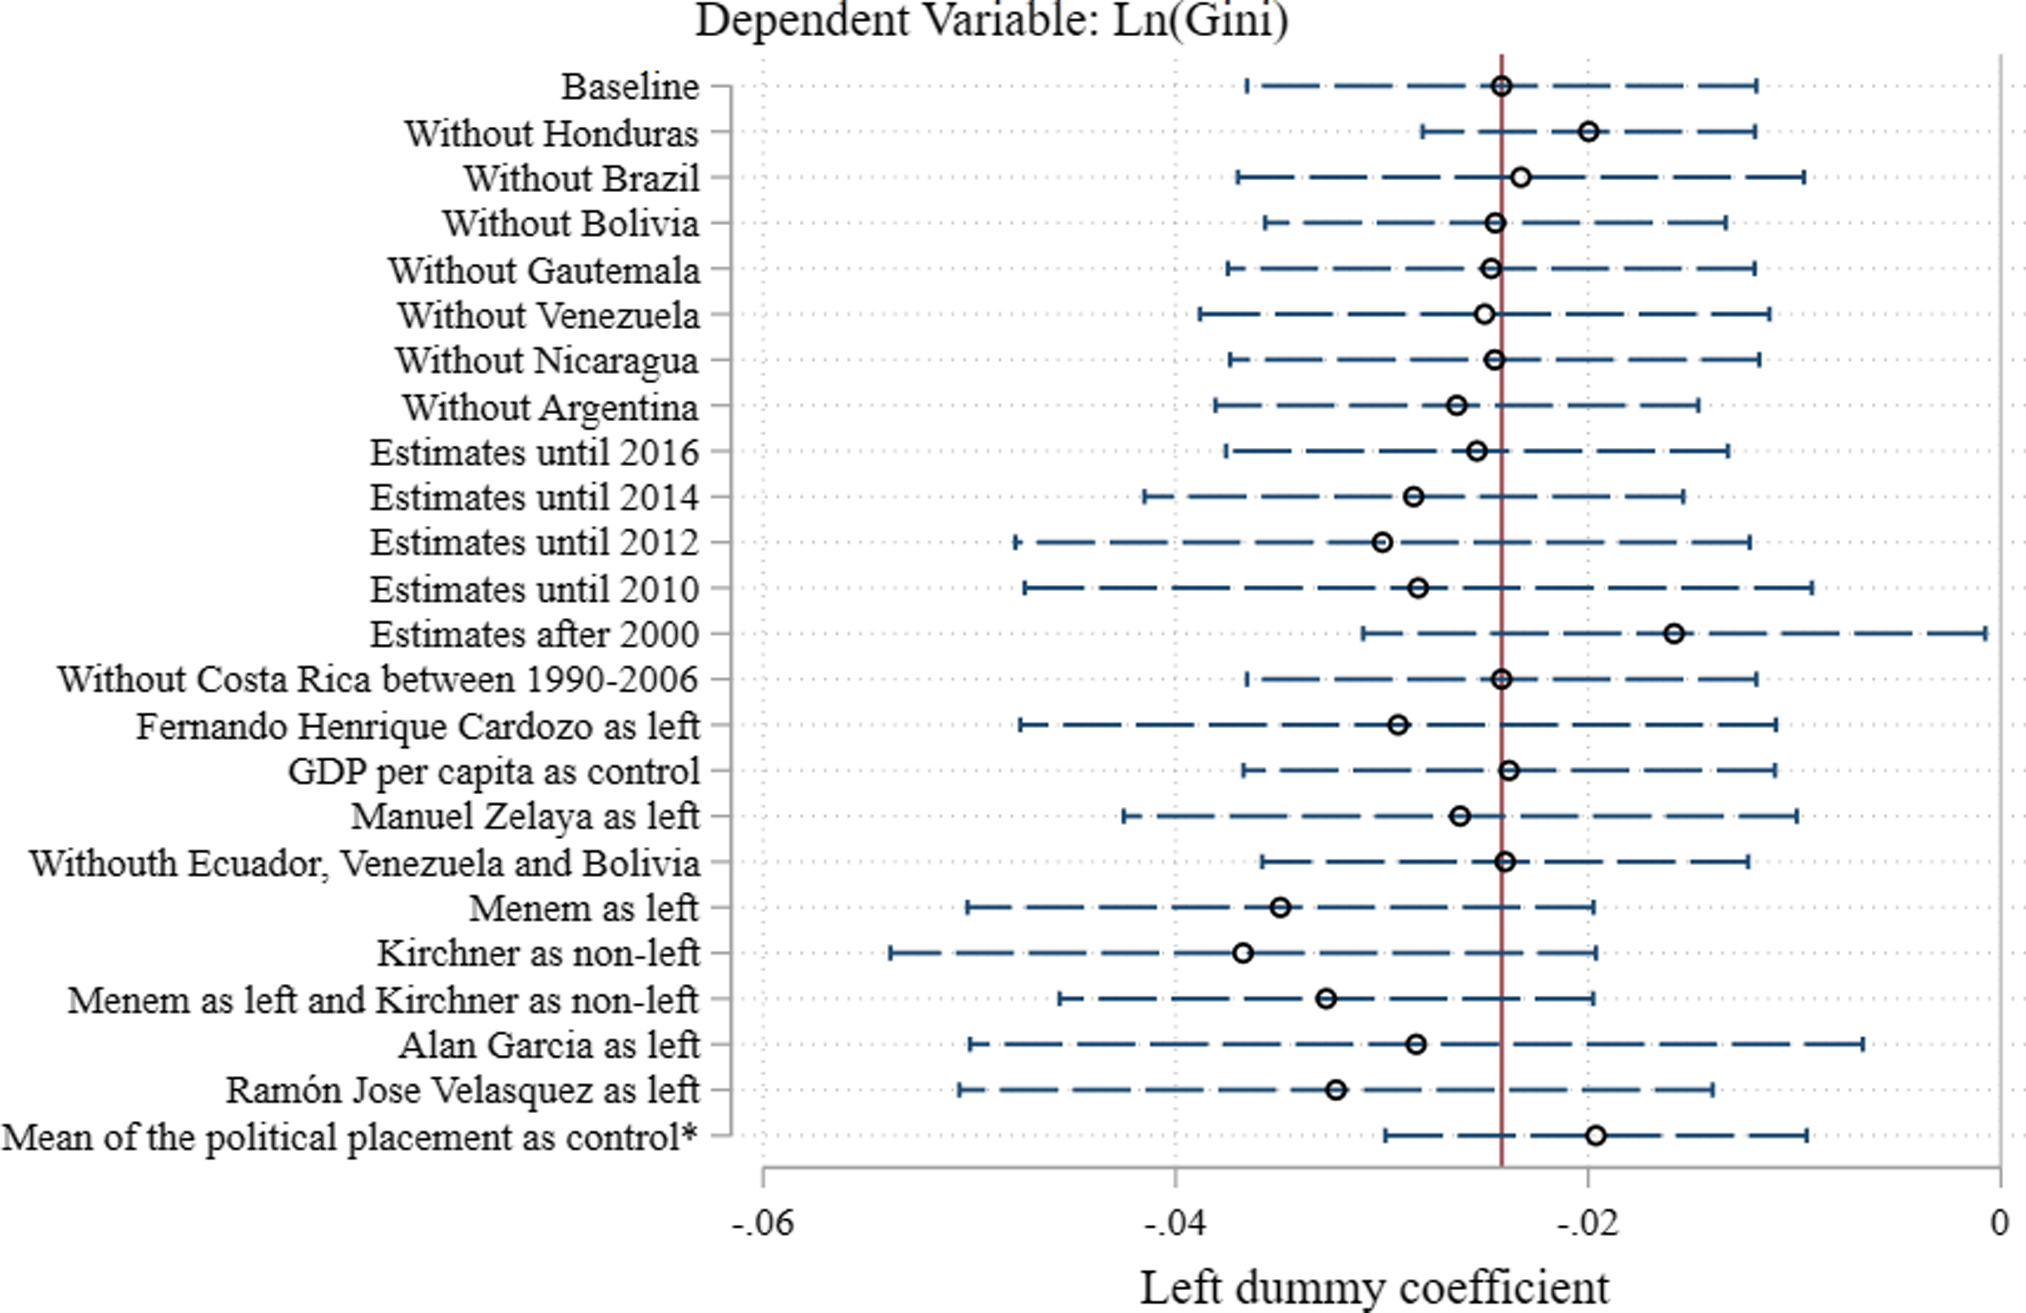
We start by analyzing the consistency of our results when we reclassify countries whose ideological denomination is not clear cut. First, we evaluate whether our results change when we code several presidencies as leftist: Cardoso (1994–2002) in Brazil, Menem (1989–99) in Argentina, Zelaya (2006–9) in Honduras, Alan García (2006–11) in Peru, and Ramón José Velázquez (1993–94) in Venezuela. For instance, while Cardoso’s Partido da Social Democracia Brasileira (PSDB) is often classified as center-right in the political science literature, Cardoso himself has a long history as a leftist public intellectual. Zelaya, in turn, was elected under the banner of a traditional party, the Partido Liberal, but soon after taking office he aligned himself and his policies with the Pink Tide presidents. Our results do not change when we reclassify these governments and include them as part of the left. They also remain unaltered if we code the Kirchner governments (2003–15) as non-left. Our results are also robust to varying the threshold we use to transform Baker and Greene’s index into our dummy left and non-left variable (appendix 11, table A8).
Second, we vary the sample by separately excluding several countries. We exclude Guatemala because we have no data for the 1990s and Honduras because it excludes nonlabor incomes in the 1990s. We also run the analysis without Brazil because up to 2003, it excluded the rural North from its household surveys. Until 1997, Bolivia measured inequality only in urban areas, so we also run a regression without Bolivia. We exclude Venezuela because it has data only up to 2006. We also run our regression without Argentina because it measures inequality only in urban areas (a little over 60 percent of the population). Furthermore, we exclude observations from predominantly gas- and oil-exporting countries from our sample: Bolivia, Ecuador, and Venezuela. In all these cases, our results remain largely the same.
If the GDP growth in countries with a left party in office is higher than in non-left countries, the government will collect more taxes. Hence, left incumbency could reduce inequality because of the fiscal space, which implies that our results would be biased. If this is true, including GDP as a control in our model should eliminate the effect of the left governments on inequality. We rerun our models, including real GDP per capita as a control variable, and the results remain unchanged.
Another concern is that if countries governed by the left experienced better terms of trade than those with a non-left incumbent, the left premium would be explained by better external conditions. To assess this hypothesis, we run another model adding the interaction between the left dummy and the terms of trade. If the hypothesis is correct, we should find that inequality reductions are more pronounced in those countries with a left government experiencing better terms of trade. However, this analysis suggests that left governments do not have significant differences in the intensity of the inequality reduction. The interaction coefficient is very close to 0 and is not statistically different from 0 (p = 0.774). In addition, over all the potential values of terms of trade for which there is common support in the data, the countries governed by the left are associated with a more pronounced decline in inequality (figure A1 in appendix 2).
We also account for changes in the ideological position of the electorate, using voters’ position on the left-right scale, with data from Latinobarómetro between 1995 and 2017. If voters moved to the left in left-governed countries, changes in inequality could simply reflect an increased demand for redistribution, rather than changes in the ideology of governments. Our results are unchanged after controlling for the average predisposition of voters in these countries.
In a similar vein, we account for the fact that the quality of democracy fluctuated across countries and over time during the Pink Tide. This may have affected governments’ capacity (e.g., weakening checks and balances) or the incentives (e.g., weaker accountability controls) to implement redistributive policies. We estimate our baseline model adding the different democracy indexes created by the V-Dem project. Table A13 in appendix 14 shows that the size of the coefficients for the left dummy is similar to those reported here; all the coefficients remain statistically significant across models and measures.
In a final test, we explore the consistency of our main findings by changing how we code our treatment variable. In the main analysis, we drop observations from leftist countries after the left is replaced by a non-leftist president. The rationale for this is to avoid any contamination from “treated” countries to the “control” group, potentially inducing endogeneity; for example, if the performance of a leftist government affects later decisions by a non-left government. Yet even when social policies are hard to deactivate by succeeding administrations, most governments have some capacity to change the policies established by the previous administration. So it might be interesting to assess what happens when the left steps down from office.
With this in mind, we recode our main variable in two ways: we code all observations equal to 1 after a country elects a left-wing government, regardless of what happens later; and we code observations according to which government is in office that year; that is, we code left-governed countries with a zero once the left is voted out of office. Table A7 in appendix 10 presents the results of the estimates for the three definitions. In all cases, our findings remain strikingly similar. Inequality declines, the total tax revenues increase, and the income shares of the first seven deciles also increase with a simultaneous decrease in the income share of the top 10 percent.Footnote 26
Concluding Remarks
Inequality fell in Latin American countries during a decade in which 11 of the 17 countries studied had a left-leaning president. The key question we asked here is, did inequality fall faster in countries governed by the left? In other words, was there a “leftist premium” above and beyond structural and conjunctural factors that caused this unprecedented equalizing wave? Because in several (but not all) countries, the period of declining inequality and the Pink Tide overlapped with unusually favorable terms of trade in international markets—that is, the commodities boom—our analysis used a range of econometric models and a series of robustness tests to disentangle the “leftist premium” from other confounding factors. Our empirical analysis suggests that countries governed by the left experienced a decline in inequality over and above what would have been predicted by other enabling factors.
Our study contributes to the empirical literature that examines the equalizing effect of the left in government. Prominent arguments suggest that left parties in the region lack the capacity or the incentives to assist the poor and engage in “broad” redistribution (Holland and Schneider Reference Holland and Ross Schneider2017; Schneider and Soskice Reference Schneider and Soskice2009). Similarly, recent work by Altman and Castiglioni (Reference Altman and Castiglioni2020) concludes that “equitable social policy … does not seem to be contingent on the ideological color of the government” (777). In contrast, our results suggest that countries experienced a more pronounced decline in income inequality after the left came to power and that the left was more likely to implement policies that redistribute incomes in favor of the lower-income deciles.
Regarding the policy mechanisms that may explain the existence of a “leftist premium,” we find that the coefficients associated with the left are significant for three policy variables: minimum wages, social (noncontributory) pensions, and tax revenues as a share of GDP. In other words, our results imply that leftist governments are more likely to raise the minimum wage, implement more generous social pensions, and expand tax-based redistribution than are non-leftist governments. Again, our findings stand in contrast to a literature that suggests that parties (especially those on the left of the political spectrum) in Latin America often abandon the policies they promote on the campaign trail for more conservative agendas.
Several questions require further analysis but are beyond the scope of this study. The determinants of inequality include policies that affect both human capital and current purchasing power. The former includes public investments in education, health, and nutrition that benefit children, especially those who live in households with low socioeconomic status. These investments will affect people’s income in the future. The analysis of the determinants of inequality dynamics in Latin America revealed that the upgrading of education played a key role in explaining why inequality fell in the 2000s. This study focused on the impact of the left on the policies that affect inequality contemporaneously. Whether leftist governments also tend to invest in the human capital of poor children more prominently than non-left regimes is a question for future research.
A final point refers to the long-term effects of the left on inequality, especially after it leaves office. In the past, short-term improvements in the terms of trade fueled the implementation of redistributive fiscal policies that proved unsustainable in the long run. Similar “time-inconsistency” concerns may affect the legacy of the 2000s Pink Tide. While a full-fledged discussion of the sustainability and long-term benefits of redistribution under leftist regimes goes beyond the scope of this article, subsequent events in the countries that significantly expanded tax-based redistribution seem to indicate that such policies were not only unsustainable but also damaging. Since the end of the commodities boom, an increase—albeit small—in inequality has occurred in Argentina, Brazil, and Paraguay and a reduction or stagnation in the rate of decline of inequality in Chile, Peru, and Uruguay.
Did the inequality reversal occur because the fiscal space to undertake further tax-based redistribution was gone once the commodity boom came to an end? Or did the policies implemented by the left actually contribute to subsequent economic stagnation, crises, and adjustment policies that worsened inequality and made the poor poorer under the successor governments? The answer, we presume, depends on the country. In some, the reversal must have been the consequence of the economic slowdown and the lower fiscal space triggered by the end of the boom. But in other countries the policies implemented by the left clearly made things worse. Argentina and Venezuela are examples of the latter. In Argentina, the large increase in public spending (in particular, public employment, social pensions, and subsidies) implemented during the Kirchners’ presidencies contributed to the subsequent macroeconomic difficulties, recession, and the 2018 crisis under the Mauricio Macri government, which succeeded the Kirchners (Gerchunoff and Rapetti Reference Gerchunoff and Rapetti2016; Gerchunoff, Rapetti, and De León Reference Gerchunoff, Rapetti and De León2020). Undoubtedly, short-sighted, short-term gains resulted in long-term pain. Even worse, the left wasted a golden opportunity to take advantage of the increased fiscal and external space during the commodities boom to implement the structural transformation that could have placed the country on a sustainable growth path (see, e.g., Fanelli and Lustig Reference Fanelli, Lustig, Dutt, Lustig, Carlos Moreno-Brid and Antonio Ocampoforthcoming).
Supplementary material
To view supplementary material for this article, please visit https://doi.org/10.1017/lap.2022.47
Supporting Information
Additional supporting materials may be found with the online version of this article at the publisher’s website: Appendix. For replication data, see the author’s file on the Harvard Dataverse website: https://dataverse.harvard.edu/dataverse/laps


 Open access

