

INTRODUCTION
Despite average African cereal yields having risen from about 1.2 t ha−1 in 1993 to over 1.6 t ha−1 in 2013, they remain very low in comparison to those in other continents and over 200 million people in Africa are undernourished (FAOSTAT, 2015). Malawi is one of the poorest countries in the world, ranking 171 out of 187 countries in the 2011 UNDP Human Development Index with >40% of the population below the poverty line of US$1 day−1 and almost half (47%) the children under five are stunted (NSO, 2010). Cereal yields in Malawi consistently averaged around 2 t ha−1 from 2009 to 2013 (FAOSTAT, 2015) while attainable maize yield was estimated at 5.4 t ha−1 (Mueller et al., Reference Mueller, Gerber, Johnston, Ray, Ramankutty and Foley2012). Closing yield gaps is not necessarily a sound economic route for smallholder farmers with other livelihood options (Beddow et al., Reference Beddow, Hurley, Pardey and Alston2014) and up to 30% of soils in sub-Saharan Africa are degraded and non-responsive, so that farmers do not achieve immediate gains from applying fertiliser, partly because of loss of soil biotic function (Tittonell and Giller, Reference Tittonell and Giller2013).
Agroforestry practices, involving using trees in fallows or as intercrops, either using regularly pruned fast-growing shrubs, or maintaining spaced mature trees in crop fields, have been increasingly advocated as a low cost and sustainable way that African smallholders can improve and sustain soil fertility (Glover et al., Reference Glover, Reganold and Cox2012). This is based on biological fixation of nitrogen from leguminous trees and the tightening of nutrient and water cycling, together with growing evidence of higher abundance and activity of beneficial soil organisms associated with trees in crop fields enhancing soil health (Barrios et al., Reference Barrios, Sileshi, Shepherd, Sinclair and Wall2012). Trees may also contribute to sustainable intensification of smallholder livelihood systems through firewood and fodder production on farm and from the sale of high-value tree products including timber, charcoal and fruit. Research on agroforestry for soil fertility management has been going on for a long time in Malawi (Le Houérou, Reference Le Houérou and Le Houérou1980) and various forms of agroforestry have been practiced by farmers and promoted in Malawi over the last quarter of a century (Acker et al., Reference Acker, Debons and Braunworth1992). However, there remains a large gap between the potential yield gains with fertiliser trees realised on research stations (Akinnifesi et al., Reference Akinnifesi, Ajayi, Sileshi and Chianu2010) and the uptake of agroforestry practices by farmers across the country.
In this paper, we set out explore the nature and consequences of variable performance of technologies and suggest approaches for dealing with it. The example is of variation in performance of agroforestry practices being promoted in Malawi as experienced by farmers who have taken part in a countrywide programme to promote them. Specifically, we aimed to:
• understand technology performance and its variation as actually experienced by farmers;
• describe the risks farmers take in following generalised recommendations based on mean performance;
• demonstrate approaches to reducing the risk to farmers by increasing the sophistication of data analysis and messages to farmers, better targeting of agroforestry options to context and continuing the research process into the initial phases of scaling up; and
• suggest ways that developing locally adapted agroforestry options could be made more effective by planning this into research and development initiatives from the outset.
These issues are relevant not only for agroforestry in Malawi but for the application of agronomy to sustainable intensification more generally.
DATA AND METHODS
Five agroforestry practices for soil fertility improvement that were promoted widely in Malawi were measured in this study: (1) dispersed systematic inter-planting of maize with F. albida (Delile) A.Chev. (faidherbia), (2) intercropping maize with G. sepium (Jacq.) Kunth ex Walp (gliricidia), (3) rotating maize with S. sesban (L.) Merr (sesbania) and annual undersowing of maize with (4) T. vogelii Hook. f. (tephrosia) or (5) C. cajan Druce (pigeon pea). These are referred to as ‘agroforestry practices’ below. The cultivation of maize without trees is referred to as ‘sole maize’, and together with the agroforestry practices these constitute the ‘cropping practices’ studied.
The study was conducted in the following districts of Malawi: Karonga and Mzimba in the northern region, Salima, Dedza, Ntcheu and Balaka in the central region and Machinga, Zomba, Mulanje, Chiradzulo and Thyolo in the southern region. Within each district, households that had tried out one or more of the agroforestry practices being promoted and had continued maintenance of the agroforestry practice for the four year period over which the promotion had taken place, were identified. At the end of each of the 2011/12 and 2012/13 cropping seasons, households that had a maize field with an agroforestry practice and another comparable maize field without trees, that they considered similar and both fields were at least 50 m away from the homestead, were selected. The number of households in the study per district varied from 1 in Balaka to 66 in Karonga. Information about the household, farming system and cropping practices were collected by questionnaire administered to the household head all of whom were owners of the fields that were assessed. A 6 m × 6 m quadrat was randomly sited in each of the agroforestry and sole maize plots for measurement of crop yield and tree – crop management practices. Longitude, latitude and altitude of each quadrat were recorded using GPS.
Data analysis was based on the difference in maize yield of the two quadrats on the same farm (Yd); that is the maize yield on the agroforestry system plot (Ya) minus the yield on the sole maize plot (Ys) in the same season, Yd = Ya – Ys.
Data were analysed using descriptive statistics and regression analysis of yield difference on plot and farm-level explanatory variables. When the two quadrats (with and without agroforestry) measured on the same farm had different levels of an explanatory variable, then analysis was via linear mixed models that included a random effect for farms. All statistical analyses were done using R (R Core Team, 2014).
RESULTS AND DISCUSSION
The results are presented and discussed in a sequence starting with conventional approaches to considering mean treatment differences, followed by description of, and possible interpretation of the causes of, variation around means.
Overall mean yields
The overall mean yields of maize grain were very similar in both seasons (Table 1). Sole maize yields were slightly higher than average yields reported for Malawi (Snapp et al., Reference Snapp, Jayne, Mhango, Benson and Ricker-gilbert2014). FAO Stat gives the 2012 average as 2.12 t ha−1, almost 30% lower than our sole maize yield. This difference is commensurate with a bias towards more fertile than average fields and more industrious than average farmers having taken part in the agroforestry promotion.
Overall mean yields of maize grain in agroforestry and matching sole crop plots. The numbers in brackets are the sample size and the p-value for the test of difference in the mean from that of sole maize.

The plots with trees had average yields from 190 to 890 kg ha−1 (6% to 32%) higher than those without, some of these differences in mean being significant by conventional test statistics. These differences do not take account of any differences that there may have been in management, including fertiliser use, between plots with and without trees. Systematic bias in interpreting the effect of trees may occur if farmers modified their management of crops in fields with trees. Since fertiliser trees were being promoted as an alternative to inorganic fertiliser, it was entirely rational for farmers that had access to fertiliser to use it preferentially on fields without trees. This represents a real world comparison in terms of how farmers incorporate trees within their farming system.
Focus on differences
The difference in maize yield between agroforestry and sole maize reflects the effect of the trees in maize as experienced by each farmer, subject to assumptions discussed below. Means of the within-farm differences (Table 2) are similar but not identical to the differences in overall means (Table 1).
Mean differences in maize grain yield (Yd, t ha−1) between paired plots with and without trees on the same farm (number of farms, p value for test of whether the mean is different from zero).

The distinction between the two analyses comes from the control plots. In Table 1, a mean for controls is estimated from all of them while in Table 2 they are grouped by the agroforestry practice on the matched plot. The mean differences in Table 2 are generally small and all are positive. They range from 0.32 to 1.04 t ha−1 more maize with agroforestry, representing 21%, 25%, 17%, 34% and 11% higher yield with gliricidia, faidherbia, pigeon pea, tephrosia and sesbania, respectively. These are much smaller than the increases of several hundred per cent that have been reported in research trials in Malawi (Akinnifesi et al., Reference Akinnifesi, Ajayi, Sileshi and Chianu2010) and more generally for sub-Saharan Africa (Sileshi et al., Reference Sileshi, Akinnifesi, Ajayi and Place2008). Yield gaps between potential and researcher-obtained yields and those obtained by farmers are familiar from previous studies and are discussed below.
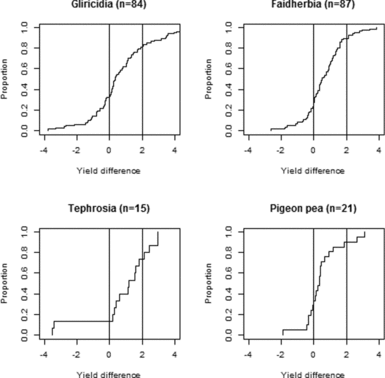
The mean effects of ‘treatments’ or technology change are widely quoted but hide variation in the size of the effect for different farmers. This variation is substantial (Figure 1). If we take a difference of 2 t ha−1 as being large enough to more than cover any added production costs and make a noticeable impact on famers’ livelihoods, then a sizable proportion of farmers achieved this with each of the agroforestry practices (9% to 26%). Importantly, though, a larger proportion (18% to 33%) experienced yield reductions on their agroforestry plots compared to sole maize. There are many possible reasons for this variation in the effect of trees which are explored below. If we know what causes the variation, then we can identify the conditions in which trees will be likely to have positive effects.
Distribution of maize yield differences (Yd, t ha−1) for four agroforestry systems. Vertical lines at yield differences of 0 and 2 t ha−1 are for reference. Sample sizes (n) are given in each title. The curve for sesbania is not plotted because the sample size was too small.

As it stands, our data suggest that a farmer in Malawi trying these agroforestry alternatives to sole maize has a risk associated with adoption that is equivalent to the cumulative probability associated with obtaining any particular yield increment, specifically in these cases a 33%, 20%, 18% and 30% chance of obtaining less maize than if he or she had not adopted agroforestry for gliricidia, faidherbia, tephrosia and pigeon pea practices, respectively. These are risks associated with a ‘one size fits all’ recommendation for any farmer to adopt these specific agroforestry practices. The risk of a lower yield with agroforestry than with sole maize is non-negligible for all practices. This does not mean that these farmers are necessarily net losers because other possible benefits, such as fodder or firewood provision from the trees have not been accounted for and neither have any longer term impacts on maize, but they are losers in term of maize grain yield in the years measured. Such non-responsiveness of some fields to soil fertility management innovations is not unusual (Vanlauwe et al., Reference Vanlauwe, Coyne, Gockowski, Hauser, Huising, Masso and Van Asten2014). The important point is that a farmer adopting any of these agroforestry practices faces a risk of substantial loss, as well as the chance of a major gain. Understanding the sources of variation that contribute to this risk will allow better targeting of the technology to sites and farmer circumstances, thereby reducing the risk that a farmer faces on adopting the innovation. Identifying what is currently understood and not understood about sources of variation may also identify important research questions.
Comparison with other studies
The promotion of agroforestry practices in Malawi evaluated here was based on positive results from previous research but there are important differences between the conclusions from the previous research and the experience of farmers reported here. To explore these differences we focus on gliricidia, as we have the most comprehensive dataset available for this practice. The distribution curve for the effect of gliricidia on maize yield (reproduced from Figure 1) indicates smaller positive effects and higher risk of yield reductions than estimates from three other sources (Figure 2). The other sources comprise:
(a) mean effects from experiments on maize and gliricidia in Malawi (Akinnifesi et al., Reference Akinnifesi, Makumba and Kwesiga2006, Reference Akinnifesi, Makumba, Sileshi, Ajayi and Mweta2007; Akinnifesi et al., Reference Akinnifesi, Ajayi, Sileshi and Chianu2010),
(b) the mean effect from a farm survey of yield effects of gliricidia on maize in Malawi (Akinnifesi et al., Reference Akinnifesi, Sileshi, Franzel, Ajayi, Harawa, Makumba and Chianu2009), and
(c) results of a meta-analysis compiling data across sub-Saharan Africa for gliricidia and several other tree species managed in a similar way to the gliricidia in the present evaluation (Sileshi et al., Reference Sileshi, Akinnifesi, Ajayi and Place2008).
Distribution of effects of intercropping gliricidia on maize. Our data compared with other published results (distribution for Sileshi (Reference Sileshi, Akinnifesi, Ajayi and Place2008); means for the Akinnifesi (Reference Akinnifesi, Makumba and Kwesiga2006, Reference Akinnifesi, Makumba, Sileshi, Ajayi and Mweta2007, Reference Akinnifesi, Sileshi, Franzel, Ajayi, Harawa, Makumba and Chianu2009 and Reference Akinnifesi, Ajayi, Sileshi and Chianu2010)).

These other published results typically report much larger effects than we found. The mean of 1.1 t ha−1 reported by Akinnifesi et al. (Reference Akinnifesi, Sileshi, Franzel, Ajayi, Harawa, Makumba and Chianu2009) based on a survey of farms, using an approach similar to ours, is closest to our mean of 0.6 t ha−1 but still higher.
Sileshi (Reference Sileshi, Akinnifesi, Ajayi and Place2008) is a meta-analysis of published results with his category ‘coppicing fallows’, not limited to gliricidia but including many observations on gliricidia managed as in our study. This analysis and the Akinnifesi papers are based on researcher managed experiments. Most of the publications quote results averaged over several replicates, treatments or seasons and hence we might expect less variation than on farm plots. However, they come from very much more diverse environments than our data and for that reason might be expected to show higher variation. The mean differences reported by Sileshi (Reference Sileshi, Akinnifesi, Ajayi and Place2008) are nearly all positive, where as we find many negative differences in our data from farms. The mean yield difference from our farm plots are around 2 t ha−1 lower than the lowest mean difference from researcher managed trials of gliricidia intercropping in Malawi.
There is a long history of description of the gap between agronomy results obtained on-station under researcher-controlled conditions, with on-farm results of innovations generally less impressive than observed in researcher-managed trials (Lobell et al., Reference Lobell, Cassman and Field2009). Some reasons include optimal management by researchers using much more labour than that available on farms, small-plot bias with experimental plots avoiding less fertile parts of fields, the filtering effect of the research cycle (trials are pursued in locations where positive results have been observed in previous trials but dropped elsewhere) and publication bias when negative or ‘uninteresting’ experimental results are not published (Coe et al., Reference Coe, Sinclair and Barrios2014). Whereas researchers often assume that productivity with respect to grain yield is the objective of growing crops, farmers are often more concerned with their overall farm or livelihood productivity and so trade-off management of any single component against others, generating differences in yield response (Tiwari et al., Reference Tiwari, Brook and Sinclair2004). It is farmer-obtained yields and yield increments on adoption of a new technology that are most relevant to farmer decision making. These differences in actual yield are also most relevant to policy decisions, such as whether to support scaling-up of a technology, but it is often the higher values from small plot experiments that are quoted by scientists promoting the upscaling of particular technologies (Garrity et al., Reference Garrity, Akinnifesi, Ajayi, Weldesemayat, Mowo, Kalinganire and Bayala2010).
Explaining variation
In seeking explanations for the variation in effects of agroforestry, we focus on the gliricidia practice because we have more comprehensive data for this practice than for the others. Consideration of theory, discussion with experts and examination of data from the first measurement year, suggested a number of factors that might explain variation in maize yield response to gliricidia including position within the topography, plot history, use of animal manure, soil type and maize variety. Consistent effects of only three factors, altitude, number of trees, and whether or not fertiliser was applied, were confirmed with the data available by the end of the second year. District was also tried as an explanatory factor, but after the other variables were include in the model it did not explain any more of the variation, suggesting that missing explanatory factors are not things that vary at the scale of districts.
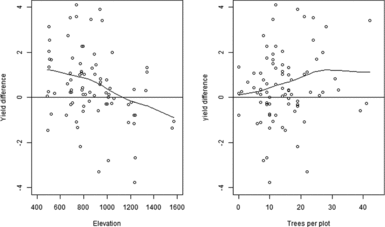
The tree plots measured vary in the range of altitudes at which they were found, with gliricidia plots from 500 to 1400 m. There is an apparent effect of elevation on the impact of gliricidia on yields, with the tree being more effective at lower altitudes (Figure 3a). This trend is most probably related to climate, with altitude acting as a proxy for temperature.
Maize yield difference (gliricidia – sole, Yd, t ha−1) plotted against (a) elevation (m) and (b) number of gliricidia trees in the 6 × 6 m sample plot. Lines are means estimated by a smoothing spline.

The number of gliricidia trees in the measured 6 × 6 m quadrat varies from 0 to 40, which is around the recommended density. There is a trend in yield difference with tree number, with mean effect of gliricidia being zero when there are no trees and increasing until about 30 trees per plot (Figure 3b). This seems reasonable as a few trees per plot cannot be expected to have much impact. Plots designated as gliricidia but with few trees represent those on which trees were established but did not survive.
Use of fertiliser is likely to be a major determinant of yield. The only reliable information on fertiliser use was whether or not it had been used on each plot. The type of fertiliser, rate and application method could not be reliably measured by farmer recall at the end of the season. This means that our reported fertiliser use data hides large variation in quantity, quality and effectiveness of management. Organic inputs (manure, compost) were also recorded for some plots but there were no consistent effects of organic inputs and average yields were sometimes lower with organics. They are not considered further here. About 20% of the plots without fertiliser have yields >3.5 t ha−1. While surprising, such yields are possible if they include the delayed effect of organic inputs or of residuals from inorganic fertiliser application in previous seasons. Cognisant of these reasons for caution in our interpretation, we look at how reported fertiliser use modifies effects of the gliricidia agroforestry practice.
Means of differences between maize yield when grown with gliridicia and as a sole crop are presented in Table 3. The paired plots on one farm did not always have the same (yes or no) fertiliser input. For gliricidia, the majority of farmers put fertiliser on both plots, suggesting they do not see gliricidia as an alternative to fertiliser. However, for the 21 farmers who put fertiliser on sole and not on the gliricidia plots the mean difference was zero. Thus, the average effect of gliricidia is indeed the same as the effect of the level of fertiliser that these farmers typically used.
Effects of gliricidia. Mean maize yield difference (gliricidia – sole, Yd, t ha−1) for plots with and without fertiliser. Number of pairs in parentheses.

The mean effect of gliricidia was higher when no fertiliser was put on either plot than when it was applied to both plots. This suggests that the fertiliser and gliricidia are providing the same limiting nutrients (probably N) and the usual diminishing returns response applies. This is not consistent with the existence of a synergistic effect when combining the application of inorganic fertiliser with gliricidia through which fertiliser use efficiency is increased by the presence of the trees (Akinnifesi et al., Reference Akinnifesi, Makumba, Sileshi, Ajayi and Mweta2007). The synergistic effects that have been reported in research trials in Malawi were in relation to combinations of N and P where there was co-limitation (Akinnifesi et al., Reference Akinnifesi, Makumba, Sileshi, Ajayi and Mweta2007). With respect to N uptake, gliricidia has been found to be competitive rather than complementary with maize while other tree species that root more deeply may capture N leached below the crop rooting zone (Rowe et al., Reference Rowe, van Noordwijk, Suprayogo, Hairiah, Giller and Cadisch2001). Clearly, the existence and size of synergistic responses will vary with soil conditions, the type of fertiliser applied and the tree species used, indicating the need for context-specific rather than general recommendations and statements about synergy and increased fertiliser use efficiency
Putting these and other potential effects into a regression model in which the dependent variable is the yield difference (maize yield under gliricidia minus yield in sole maize on each paired plot) gave clear effects only of fertiliser, tree number and altitude. The easiest way to understand the results of the model is to use it to predict expected yield increases for different contexts (Table 4), selected to represent the range of effects described by the model and discussed above using the raw data. We predicted responses for combinations of levels found in the data set as well as for the best scenario predicted by the model that was within the overall range of factor levels found in the data. The residual variance of the model, which shows no pattern across the data set, can be used to estimate the probability of yield differences of >2 t ha−1 and <0. Note that these results could not be estimated directly from the data without the model as samples sizes would be too small.
Predicted mean increments of maize yield (Yd, t ha−1) with inclusion of gliricidia for difference cases with the chance of increases >2 t ha−1 and <0.

The largest predicted mean positive effect is 2.4 t ha−1, when the gliricidia is grown at the highest density at low altitude and no fertiliser is used on either plot. The mean yield of all control plots <600 m without fertiliser is 2.3 t ha−1. So this represents a best-possible scenario of a 100% predicted increase in mean yield due to gliricidia. The largest negative effect is with a low tree density at high altitude and fertiliser applied to the sole crop plots, giving a reduction of 1.3 t ha−1.
The results in Table 4 show that while there is still considerable unexplained variation and hence risk for the typical farmer, the known effects of context can have an important impact on those risks. For the whole sample of farms with gliricidia, the chance of a difference <0 was 33% and of >2 t ha−1 was 18%. But looking at specific contexts, the chance of failing (difference <0) reduces to 7% for the best case, a risk that might well be acceptable to farmers. For the worst case, the chance of success (>2 t ha−1) is only 2%, too low to make the technology of interest.
Constraints associated with observing performance of practices on farm
By virtue of considering how agroforestry practices being promoted performed as implemented by farmers, this research was observational rather than a randomised experiment, although it incorporated a matched paired plot design. This means that there are some potential ambiguities in the data that condition the conclusions that can be drawn.
A single 6 × 6 m quadrat was measured to estimate the yield of each plot. Using a single quadrat means that no estimate of within field variation in yield can be obtained. This was a deliberate sampling strategy, based on the idea that we will get the best information about the effect of varying contexts on crop performance and tree effects by sampling as widely as possible across those contexts. The alternative of having multiple quadrats per field to estimate within field variation is not really viable. There is no reason to assume that within field variation is the same for all fields, so a minimum of 6–10 randomly placed quadrats would be needed in each field, which constitutes an unrealistic balance of within and between field sampling efforts. Since the aim is to have a good estimate of yield for the whole field, other measurement methods could be considered. Possibilities include harvesting and weighing the whole field, using farmers’ estimates and using a calibrated scoring approach. Each of these has some advantages and disadvantages (Poate, Reference Poate1988).
There is a cost in not being able to separate within-field variation from that which we aim to understand, which is predominately that between fields. It is possible that the unexplained variation in yields with and without trees is all due to within-field variation, meaning that if we had been able to measure the whole field it would have reduced to zero. If this were the case, it would be wrong to describe it as risk to farmers adopting the practice. However, we consider this a very unlikely scenario. The risk analysis is based on variances of differences between fields within a farm. This variance is inflated due to within field variation by an average factor (1+I) where
 $$\begin{equation*}
I = \frac{{{k^2}{\mu ^2}}}{{\sigma _F^2}}
\end{equation*}$$
$$\begin{equation*}
I = \frac{{{k^2}{\mu ^2}}}{{\sigma _F^2}}
\end{equation*}$$
Here, k=within-field cv, μ = overall mean and σ2F = between-field variance. With these values at 0.2 (a within-field cv of 20% is reasonable), 2 and 4 (our data), I = 0.04. In other words, the inflation is not excessive. I increases to 0.25 if the within-field cv = 50%, and it would be unlikely to exceed this. With these values, the standard deviation of within farm treatment differences is inflated by between 1.9% and 12%, which are too small to qualitatively affect the conclusions.
Farms and farmers in this research were selected from those who adopted the agroforestry practices being promoted and hence represent a non-random selection from the population of all farms and farmers. Using such contactable volunteers in research like this is a common practice but means that the results apply only to the population they represent and cannot be assumed to be valid for the whole population of farmers. Our study also excludes any farmers who tried the agroforestry technologies but dropped them for any reason before the assessment years. Reasons for farmers not continuing with practices or locally adapting them to their circumstances can be very informative although it is much less frequently reported than rates of adoption (Kiptot et al., Reference Kiptot, Hebinck, Franzel and Richards2007).
A more serious concern is that the tree technology was not randomly allocated to fields. Hence, we cannot be sure that there were no initial systematic differences between fields allocated and not allocated to the agroforestry practices. There is no way to control this other than via the covariates measured that might account for initial differences or by asking farmers the basis for the decision on where they planted trees (Nyaga et al., Reference Nyaga, Barrios, Muthuri, Öborn, Matiru and Sinclair2015). While this is a constraint on the interpretation of data, it does incorporate the real decisions that farmers will take about the citing of agroforestry practices on their farms.
Implications
The mean effect of a new technology on yield or other outcomes of interest is the primary quantity quoted by researchers and the basis for many of the standard statistical techniques used in agronomic research. It is also the focus of impact assessments (de Janvry et al., Reference de Janvry, Dunstan and Sadoulet2011). While means may be of use to some audiences, they are of limited value for decision making by farmers as very few or no farmers will experience the mean. Variation about the mean is therefore important. It is of two types, both highly relevant to farmers:
1. explained or predictable variation, that describes the specific contexts in which the technology performance is known to be higher or lower, and
2. unexplained or unpredictable variation that represents risk to farmers.
The first type of variation allows more nuanced and specific messages to be given to farmers. In the case of gliricidia intercropping, information from this study shows the impact of allowing gliricidia density to drop and can inform farmers about likely effects of using fertiliser. It can also help in targeting. For example, it would not be wise to promote the gliricidia practice in higher altitude crop zones. The three explanatory factors relating to the performance of the gliricidia practice were of three distinct types that affect how they can be addressed.
1. Altitude is a large-scale biophysical variable that can be mapped so that areas where the practice could be considered for promoting can be readily identified.
2. Tree number per plot is a field-scale management variable that individual farmers can manipulate. Farmers can be informed of the effects of tree density and make their management decisions accordingly.
3. Fertiliser use is an economic variable but, with the current fertiliser subsidy schemes in Malawi also incorporates social influences, since some farmers have access to affordable fertiliser and others do not (Holden and Lunduka, Reference Holden and Lunduka2013).
The second, unexplained source of variation, is seldom discussed or presented by researchers investigating new technology, and is rarely incorporated in the messages being transmitted to farmers and others. Variation in technology performance around the mean is not the same thing as uncertainty in predicting the value of the mean. The latter is described by statistics such as standard errors and confidence intervals that typically appear in research reports. But the former is not often explicitly described or its consequences examined. This can probably be traced to the traditional frameworks for experimental agricultural research which have generally assumed that there was ‘a treatment effect’ to detect and estimate.
The variation around the mean represents risk to farmers as it implies that the outcome of their use of the new technology is uncertain. This uncertainty is additional to the tendency for most innovations that increase agricultural productivity to be associated with a concomitant increase in risk because of the investment required to adopt them (Keating et al., Reference Keating, Carberry, Bindraban, Asseng, Meinke and Dixon2010). In the practices evaluated here, the range of possibilities included negative outcomes, even after predictable sources of variation were accounted for. Farmers are often risk-averse for obvious reasons and knowledge of the risk involved may well reduce their interest in even experimenting with the technology, prior to adoption. There are both ethical and practical issues that arise. Researchers have an ethical requirement to describe uncertainty associated with agronomic recommendations and extension agents to include that information in messages they transmit to farmers. Not appraising farmers appropriately about uncertainty can have the practical effect of reducing the credibility they accord scientific information. It is, therefore, important to foster participatory approaches with farmers, in which the sources of uncertainty and risk are understood, acknowledged and progressively reduced. This implies the need for a co-learning approach through which innovations are continuously adapted and refined to suit farmers rather than a transfer of technology paradigm (Coe et al., Reference Coe, Sinclair and Barrios2014).
The unexplained variation in our farm data was high. It has been argued, that even though the outcome is uncertain, the risk to farmers of a practice such as allowing regeneration of faidherbia in cropland is low, since they will not have lost much if it turns out to be ineffective (Garrity et al., Reference Garrity, Akinnifesi, Ajayi, Weldesemayat, Mowo, Kalinganire and Bayala2010). Our results suggest that this reasoning may not always hold and that in some circumstances farmers may face risk of reductions in the yield of their staple crop through adopting such practices. This implies a need to explicitly assess the riskiness of innovations rather than to assume that they are negligible. There are also opportunity costs for actors along the research to development continuum, in organisations involved with research, extension and policy formulation, as everyone could have been doing something more useful if the technology being developed and promoted turns out to be ineffective.
We have shown how it is possible to explore variation to find conditions that increase the chance of a positive benefit and reduce farmers’ risk. Information such as this should be part of the dialogue with farmers concerning any new technology. But how can such information be generated? The classical model of on-station technology developments followed by adaptive research with fairly small numbers of farmers and then pilot scaling-up projects, does not generate this information. What is required is research at a scale that allows performance to be compared across many contexts, with sufficient replication to generate data about variation as well as averages. The methods used in the present research, of observing farm performance following wide-scale promotion of a few practices, also compromises efficiency. As has been pointed out above, this approach results in weaknesses in being able to make unambiguous inferences from data and difficulty in disentangling the multiple effects that are potentially influencing performance. Many of the factors initially investigated such as position within the topography, plot history, use of animal manure, soil type and maize variety had estimated effects that were reasonable, meaning that they were in the directions and of a size which looked realistic, but they came with large standard errors and hence no statistical significance or possibility of drawing firm conclusions about them. This was largely a consequence of small sample sizes and collinearity of effects because the comparisons were unplanned, relying on paired plots that could be found among the project participants, as opposed to designing comparisons for efficient learning at the outset.
An approach that addresses these issues, described as ‘Research in Development’ (Coe et al., Reference Coe, Sinclair and Barrios2014), recognises the need for farmers to be offered technology options ‘now’, before complete information is available, but to embed continued learning as the scaling up process unfolds. This implies a need to couple research approaches for efficient learning with development initiatives that are sufficiently resourced to reach large numbers of farmers over wide ranges of different contexts. Planned comparisons of technology performance in different contexts are a key aspect of this approach, along with sufficient sample sizes. Whether an experimental or observational approach is used, learning will be much more efficient and effective if the following elements are included:
• Explicit and detailed hypotheses guide design. Hypotheses can be generated through examination of knowledge from literature, experts, models and farmers.
• Careful attention is paid to choice of locations for work to maximise the value of information generated.
• Sample sizes are planned to meet information requirements.
• Attention is paid to the development of protocols that increase data quality and the cost effectiveness of its acquisition. Advances in information and communication technology are rapidly expanding the scope for data to be collected and communicated efficiently by farmers.
• Social and economic factors, such as farmer's wealth and access to markets, are considered as assiduously as biophysical factors, commensurate with their importance in determining performance of agronomic innovations.
Making this routine when starting to scale-up agricultural innovations requires some changes in understanding and behaviour by all those involved along the research and development continuum.
CONCLUSIONS
The impact of a range of agroforestry practices on crop yield in Malawi was highly variable amongst farmers who had adopted them. This is probably the norm for agronomic innovations rather than something unusual. The variability can be divided into two types:
1. that explained by contextual factors, and
2. remaining unpredictable variation.
The remaining unpredictable variation represents risk to farmers who follow recommendations based on research results. Those communicating with farmers need to be honest and clear about this uncertainty. It can be reduced by seeking to convert more of the unpredictable variation to variation that can be explained by context. This should be an aim of research.
Because biophysical, social and economic contextual variables, operating at a range of scales, influence the performance of new technology options, the information about where and for whom the technology is likely to be relevant will necessarily involve some complexity. Information about new agricultural technology becomes the subject of dialogue amongst researchers and policy makes, NGOS, extension organisations and farmers. All these audiences need to hear and understand a balanced appraisal of how a new technology is likely to perform in different circumstances and to participate in refining this understanding so that options are better targeted and the risks to adoption progressively reduced.
Acknowledgements
This research was funded by the Irish Aid AFSP 1 programme and the CGIAR research programme on Forests, Trees and Agroforestry. We thank Edmundo Barrios for constructive comments on the manuscript.


 Open access