


1. Introduction
In most developed democracies, it is common to hold multiple elections and referendums on the same day. Between 2010 and 2021, 68% of OECD countries allowed voters to participate in more than one election or referendum concurrently. For example, in Colombia, Poland, Spain, and Switzerland, voters elected two national chambers on the same day. Similarly, Germany, Italy, Sweden, and the United States held elections for different parliamentary tiers simultaneously. Countries like Hungary, Lithuania, New Zealand, the UK, and Switzerland also combined referendums with local or national elections. Despite this widespread practice, we know little about how concurrent voting affects political participation.
This paper examines individual turnout and selective abstention in concurrent votes. Theoretically, we extend the classical rational choice model to account for multiple votes, introducing fixed and variable components of voting costs and benefits (Downs, Reference Downs1957; Riker and Ordeshook, Reference Riker and Ordeshook1968). Fixed costs occur once per voting day, while variable costs are vote-specific. Subtracting these from a vote’s salience gives its net benefit. We then show how the net benefits of concurrent votes shape voter utility and turnout. The utility function is a constant-elasticity-of-substitution aggregation of individual vote benefits, with two extremes: utility based on the sum of net benefits or on the highest single net benefit. For intermediate cases, turnout depends most on the marginal gain from the vote with the highest benefit. Voters abstain from individual votes if their net benefit is negative.
Empirically, we analyze survey and administrative data from Swiss federal votes (1988–2016), where voters regularly decide on binding national referendums. Using individual-level data on voting benefits and costs, we calculate net benefits per proposition and study their effect on turnout and abstention. We find that both the highest and total proposition net benefits influence turnout. This supports our model with an intermediate elasticity parameter ρ. The relevance of maximum vs. total net benefit varies with the number of propositions: when few are on the ballot, the sum matters more; with many, the top net benefit dominates. While the proposition with the highest benefit has the greatest marginal effect, others still significantly affect turnout. Regarding selective abstention, propositions with lower net benefits show higher abstention rates. A one-standard-deviation increase in net benefit lowers abstention by 3.3 percentage points. This effect is stronger than the impact of ballot position, though the latter remains significant.
Two additional analyses show that the impact of concurrent votes depends on the institutional context of the electoral system, and that our main findings can be generalized to concurrent elections and referendums. First, we find that postal voting amplifies the impact of the aggregate net benefit of concurrent votes. In particular, the proposition with the highest net benefit becomes a more significant factor in an individual’s decision to participate in voting, and the influence of the net benefit on selective abstention increases in absolute terms. Second, we find that when elections and referendums are held simultaneously on the same voting day, the turnout for both the election and the referendum increases by 6.7 percentage points. This suggests that the different information costs for elections and referendums do not undermine the external validity of our findings.
Our research adds to the understanding of concurrent referendums and elections. The main contribution of this paper is that concurrent votes have a significant impact on voter turnout and selective abstention. Specifically, higher vote net benefits lead to higher turnout and lower selective abstention. Our main explanation for this pattern is that voting has a fixed cost component that voters have to pay only once per voting, like sending the ballots to the voting office or going to the poll station. Thus, if a voter finds certain votes particularly salient on a given voting day, they are more likely to participate in other votes also taking place on that day, compared to situations where those votes are combined with less salient issues. This simple mechanism may explain why the previous literature has found that turnout in multiple concurrent elections is higher than in single elections (Geys, Reference Geys2006; Cancela and Geys, Reference Cancela and Geys2016; Garmann, Reference Garmann2016; Bracco and Revelli, Reference Bracco and Revelli2018; Leininger et al., Reference Leininger, Rudolph and Zittlau2018; Cantoni et al., Reference Cantoni, Gazzè and Schafer2021).
Our findings also have relevant implications for the explanation of selective abstention behavior. We find that the net benefit of concurrent votes is a significant determinant of selective abstention, much more important than, for example, a proposition’s ballot position (Selb, Reference Selb2008; Augenblick and Nicholson, Reference Augenblick and Nicholson2016). This raises the question of which effect dominates in concurrent votes: the turnout effect or the effect on selective abstention. In comparing these two effects, we find that concurrent votes only increase political participation for votes with relatively low salience. These findings add to the literature about how concurrent elections lead to a more representative electorate (Hajnal et al., Reference Hajnal, Kogan and Markarian2022). Our findings put these results into a new perspective as we show that concurrent referendums might not be able to increase political participation because some individuals selectively abstain.
2. Literature
There is a vast theoretical literature on rational choice models that seek to explain turnout in single elections based on a cost–benefit calculus. The starting point of this branch of theoretical research is Downs Reference Downs(1957). In his model, a citizen votes if their expected benefits, the product of the probability of being decisive times the benefits, exceed their costs of voting. More recent literature has endogenized the probability of being decisive in game-theoretic models and explains turnout even when voting costs are relatively high (Palfrey and Rosenthal, Reference Palfrey and Rosenthal1983; Ledyard, Reference Ledyard1984) and in the context of uncertainty (Palfrey and Rosenthal, Reference Palfrey and Rosenthal1985). A second branch of the literature goes back to Riker and Ordeshook Reference Riker and Ordeshook(1968) who rationalize the cost–benefit calculus by including civic duty as an additional term in voters’ utility function. One caveat of this approach is that civic duty is difficult to observe. In response to this, Coate and Conlin (Reference Coate and Conlin2004) and Feddersen and Sandroni (Reference Feddersen and Sandroni2006) endogenize the concept of civic duty and rely on the behavioral assumption that a citizen’s vote decision is driven by maximizing the welfare either of the entire population or of the political group to which they belong. Our contribution to this literature is twofold. First, our paper explains with a rational choice model why individuals vote or abstain in the context of multiple concurrent votes. We analyze how the particular net benefits of concurrent propositions add up to the final individual turnout decision on a given voting day. Second, our theoretical and empirical analysis does not rely on constant benefits and costs at the group level of supporters and opponents but allows benefits and costs to vary at the individual level.
There is also a growing empirical literature on the effects of concurrent votes, which consists of two strands. For turnout, there is mounting evidence that turnout in low-salience elections increases with concurrent high-salience elections (Geys, Reference Geys2006; Cancela and Geys, Reference Cancela and Geys2016; Bracco and Revelli, Reference Bracco and Revelli2018; Cantoni et al., Reference Cantoni, Gazzè and Schafer2021) and that the combination of multiple low-salience elections also increases turnout (Garmann, Reference Garmann2016; Leininger et al., Reference Leininger, Rudolph and Zittlau2018). The evidence about whether a concurrent low-salience election increases the turnout of the high-salience election is less conclusive (Fauvelle-Aymar and François, Reference Fauvelle-Aymar and François2015; Stutzer et al., Reference Stutzer, Baltensperger and Meier2019; Cantoni et al., Reference Cantoni, Gazzè and Schafer2021).Footnote 1 We advance this strand of literature by using a continuous salience measure at the voter level, the proposition net benefit, and by documenting how each proposition contributes to the overall turnout decision at the individual level. For selective abstention, Dehdari et al. Reference Dehdari, Meriläinen and Oskarsson(2021) explored the sociodemographic drivers and documented that people from higher socioeconomic backgrounds, immigrants, women, and older individuals are less likely to selectively abstain. This literature has also shown that selective abstention increases for votes further down on the ballot (Bowler et al., Reference Bowler, Donovan and Happ1992; Bullock and Dunn, Reference Bullock and Dunn1996; Selb, Reference Selb2008; Augenblick and Nicholson, Reference Augenblick and Nicholson2016). The paper by Augenblick and Nicholson Reference Augenblick and Nicholson(2016) uses quasi-random variation in the ballot position of state propositions in California to document this empirical pattern. While the paper provides credible causal evidence on ballot position effects, it does not analyze the impact of the net benefit on selective abstention. We contribute to this strand of literature by showing that selective abstention depends on both the net benefit of a proposition and its ballot position, but the impact of the net benefit is substantially larger than the impact of the ballot position.
Closest to our paper is the work of Degan and Merlo Reference Degan and Merlo(2011) who also study turnout and voting behavior in concurrent votes. They study simultaneous two-candidate elections in an uncertain voting model where citizens are uncertain about candidates’ positions and want to avoid voting for the “wrong” candidate. Their model differs from ours in three dimensions. First, we study a classical Downs model, while Degan and Merlo Reference Degan and Merlo(2011) use an uncertain-voter model combined with a spatial model of voting behavior. Second, their model explains selective abstention as a consequence of uncertainty and we focus on the proposition net benefits to explain selective abstention. Third, their model focuses on two simultaneous two-candidate elections in the context of U.S. Presidential and Congressional elections, whereas our study focuses on direct-democratic popular votes with multiple propositions.
3. A model of concurrent votes
According to Downs Reference Downs(1957), an individual voter i compares the benefits and costs of voting for a single vote
 \begin{equation}
U_{i}=pB_{i}-C_{i},
\end{equation}
\begin{equation}
U_{i}=pB_{i}-C_{i},
\end{equation} where all variables take positive values, the variable p denotes the perceived probability that a voter is pivotal,Footnote 2 Bi is the benefit for voter i when the preferred candidate wins (or the preferred result of the referendum is achieved), and Ci denotes the net costs of voting. Conceivably, elections and referendums with higher salience have a higher benefit Bi. The term Ci consists of two elements, fixed costs of voting Fi and information costs Ii. The fixed costs comprise the costs of going to the poll station or filling out the documents and going to the postbox. However, fixed costs may be reduced as voting entails civic virtue or expressive benefits (Riker and Ordeshook, Reference Riker and Ordeshook1968, Dhillon and Peralta, Reference Dhillon and Peralta2002). We assume net fixed costs to be positive. The two elements enter costs Ci in an additive way,  $C_i=F_i+I_i$.
Let us discuss two particular features of the utility function in Equation 1. First, the utility function should be interpreted as a reduced form of the following decision sequence: The voter has an ex-ante expectation of what the benefit of a vote could be. By incurring the information costs, the voter is able to grasp the benefit more precisely. For ease of notation, the term pB denotes both expected and realized benefits in the utility function. Second, we do not aim to solve the paradox of not voting. This paradox describes that in large elections, the probability of being pivotal and thus the term pB goes to zero. However, there is ample evidence that voters are motivated to vote by a sense of civic duty (Blais, Reference Blais2000; Campbell, Reference Campbell2006; Gerber et al., Reference Gerber, Green and Larimer2008) which is a crucial component in ethical voter models (Feddersen and Sandroni, Reference Feddersen and Sandroni2006). In the model above, voters who obtain a consumption benefit by fulfilling their civic duty have a negative net fixed cost term Ci and thus a positive turnout even in large elections.
How does this very simple model generalize to multiple elections and referendums? Assume there are N votes, indexed by j, that take place at the same time. Expected benefits pBij and information costs Iij are vote-specific, whereas net fixed costs Fi occur only once per voting day. Without net fixed costs, the net benefit for a single vote Uij is given as  $U_{ij}=pB_{ij}-I_{ij}.$
Obviously, voter i will participate in a single vote j only if  $U_{ij}\geq 0.$ When will voter i go to the polls to vote for some or all of the different votes? This depends on how the net benefits of the different votes are weighted.
With multiple votes, a voter may be attracted to cast a ballot because of a proposition with a high net benefit or because of the number of all relevant votes that the voter may decide on. To capture this idea, we assume that the utility function of voting is a constant-elasticity-of-substitution aggregation of the net benefits of the single votes. From this utility value, the net fixed costs of voting Fi are deducted. The utility of voting is
 \begin{equation}
U_{i}=\left( \sum_{j=1}^{N}\left( \hat{U}_{ij}\right) ^{\frac{1}{\rho} }\right)
^{\rho }-F_{i},
\end{equation}
\begin{equation}
U_{i}=\left( \sum_{j=1}^{N}\left( \hat{U}_{ij}\right) ^{\frac{1}{\rho} }\right)
^{\rho }-F_{i},
\end{equation} where  $\hat{U}_{ij}=\max \left\{U_{ij},0\right\}$ and $\rho \in (0,1]$. Note that the utility function in Equation 2 encompasses the Downsian formulation for a single vote in Equation 1 as a special case. If we set N = 1 and assume $pB_{i}-I_{i} \gt 0$, the index j is no longer needed. We get directly
  $U_{i}=U_{ij}-F_{i}=pB_{i}-\left(
I_{i}+F_{i}\right) =pB_{i}-C_{i}$, which is the formulation in Equation 1 above.
$U_{i}=U_{ij}-F_{i}=pB_{i}-\left(
I_{i}+F_{i}\right) =pB_{i}-C_{i}$, which is the formulation in Equation 1 above.
Definition 1. (Turnout)
Voter i will go to the polls if  $U_{i}\geq 0$ where Ui is defined by Equation 2. We define turnout $T_i=1$ if $U_{i}\geq 0$ and $T_i=0$ otherwise.
Definition 2. (Selective Abstention)
If  $U_{i}\geq 0$, a vote is cast for a single vote j if $U_{ij}=pB_{ij}-I_{ij}\geq 0.$ For votes where $U_{ij} \lt 0$, the voter will abstain.
In other words, selective abstention occurs, when the net benefit of a vote j is negative,  $U_{ij} \lt 0$, given the voter goes to the polls. We will make use of this prediction in the empirical section.
What is the role of the parameter ρ in the utility function? To understand this, note that the utility function encompasses several polar cases depending on the value of our central parameter ρ. With ρ = 1, the voter’s utility function is  $U_{i}=\sum_{j=1}^{N}\max \left\{pB_{ij}-I_{ij},0\right\} -F_{i}$ and the voter considers simply the sum of net benefits of all votes at stake minus the net fixed costs. If ρ goes to zero, Ui approaches
  $\max_{j}\left\{pB_{ij}-I_{ij}\right\}
-F_{i}$, the derivation is shown in Online Appendix A. In that case, total utility depends on the maximum net benefit of a single vote Uij only. Hence, if ρ goes to zero voting decisions are driven by the single vote with the highest net benefit.
$\max_{j}\left\{pB_{ij}-I_{ij}\right\}
-F_{i}$, the derivation is shown in Online Appendix A. In that case, total utility depends on the maximum net benefit of a single vote Uij only. Hence, if ρ goes to zero voting decisions are driven by the single vote with the highest net benefit.
For intermediate values of ρ, the theory naturally predicts that an increase in the net benefit of vote j is of higher importance for the turnout decision the higher the net benefit of vote j is.
Proposition 1. (Marginal Utility of Vote j)
If  $0 \lt \rho \lt 1$, an increase in the net benefit of vote j is of higher importance for the turnout decision the higher the net benefit of vote j is.
Proof. We calculate the partial derivative of the utility function Ui in Equation 2 with respect to a single vote  $\hat{U}_{ij}$, we get
 \begin{equation}
\frac{\partial U_{i}}{\partial \hat{U}_{ij}}=\left( U_{i}+F_{i}\right)
^{1-\frac{1}{\rho} }\left( \hat{U}_{ij}\right) ^{\frac{1}{\rho} -1}.
\end{equation}
\begin{equation}
\frac{\partial U_{i}}{\partial \hat{U}_{ij}}=\left( U_{i}+F_{i}\right)
^{1-\frac{1}{\rho} }\left( \hat{U}_{ij}\right) ^{\frac{1}{\rho} -1}.
\end{equation} The second derivative of the utility function with respect to  $\hat{U}_{ij}$ is positive since $1/\rho \gt 1$. An increase in the net benefit of a vote with higher net benefit
  $\hat{U}
_{ij}$ has a larger effect on the utility value Ui and thus on turnout than an increase of a vote where the net benefit is lower.
$\hat{U}
_{ij}$ has a larger effect on the utility value Ui and thus on turnout than an increase of a vote where the net benefit is lower.
Proposition 1 predicts that voting behavior is driven more strongly by the important votes, defined as  $\hat{U}_{ij}$ large compared to other votes, although the less important ones play a role as well. Formally, an increase in the net benefit of an important vote is more likely to render $T_{i}=1$. We will explore this prediction in the empirical section.
4. Institutional background
Switzerland is a semi-direct democracy with a bicameral parliament and regular popular votes on policy propositions. Its direct-democratic institutions include four instruments. First, a compulsory referendum is required for all constitutional amendments and memberships to international organizations. Second, an optional referendum allows voters to challenge parliamentary acts with 50,000 signatures within 100 days. Third, a popular initiative allows citizens to propose constitutional reforms with 100,000 signatures within 18 months. Fourth, a counter proposition is a parliamentary alternative to a popular initiative. It is held concurrently with the popular initiative.Footnote 3
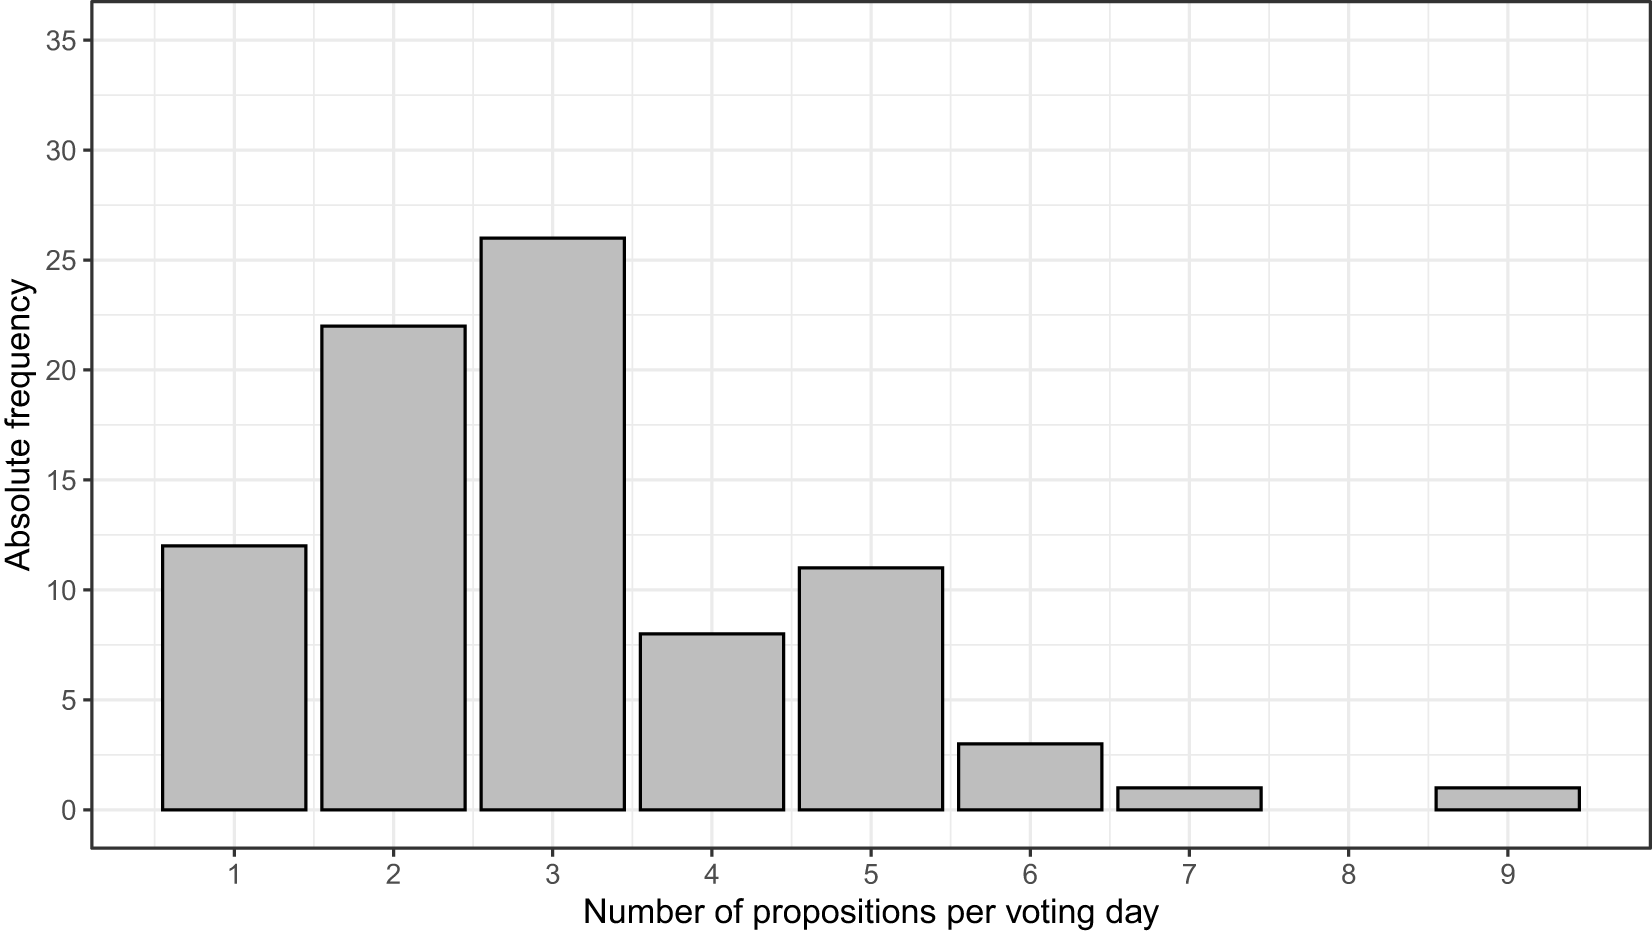
Between December 4, 1988, and June 5, 2016, Swiss voters decided on 255 federal referendums. A total of 243 propositions were held concurrent with other propositions on 72 voting days. Only 12 voting days involved a popular vote with a single proposition. The average was 3.8 propositions per day, with a maximum of nine on May 18, 2003. Figure 1 presents the distribution of the number of propositions per voting day. Most voting days include two or three propositions, and less frequently one, four, or five propositions. Very rarely, it happens that six, seven, or even nine propositions are on the ballot.
Distribution of the number of propositions per voting day.
How are the number of propositions per voting day and the importance of the propositions related? Some single-proposition votes addressed major foreign policy issues, e.g., UN membership (2002), EEA membership (1992), and EU agreements (2000 and 2005). Others, like farm subsidies (1989), were arguably less important. Turnout reflects this heterogeneity: both the highest (78.7%, EEA vote in 1992) and lowest (27.6%, Animal Disease Act in 2012) turnout occurred on single-proposition days.
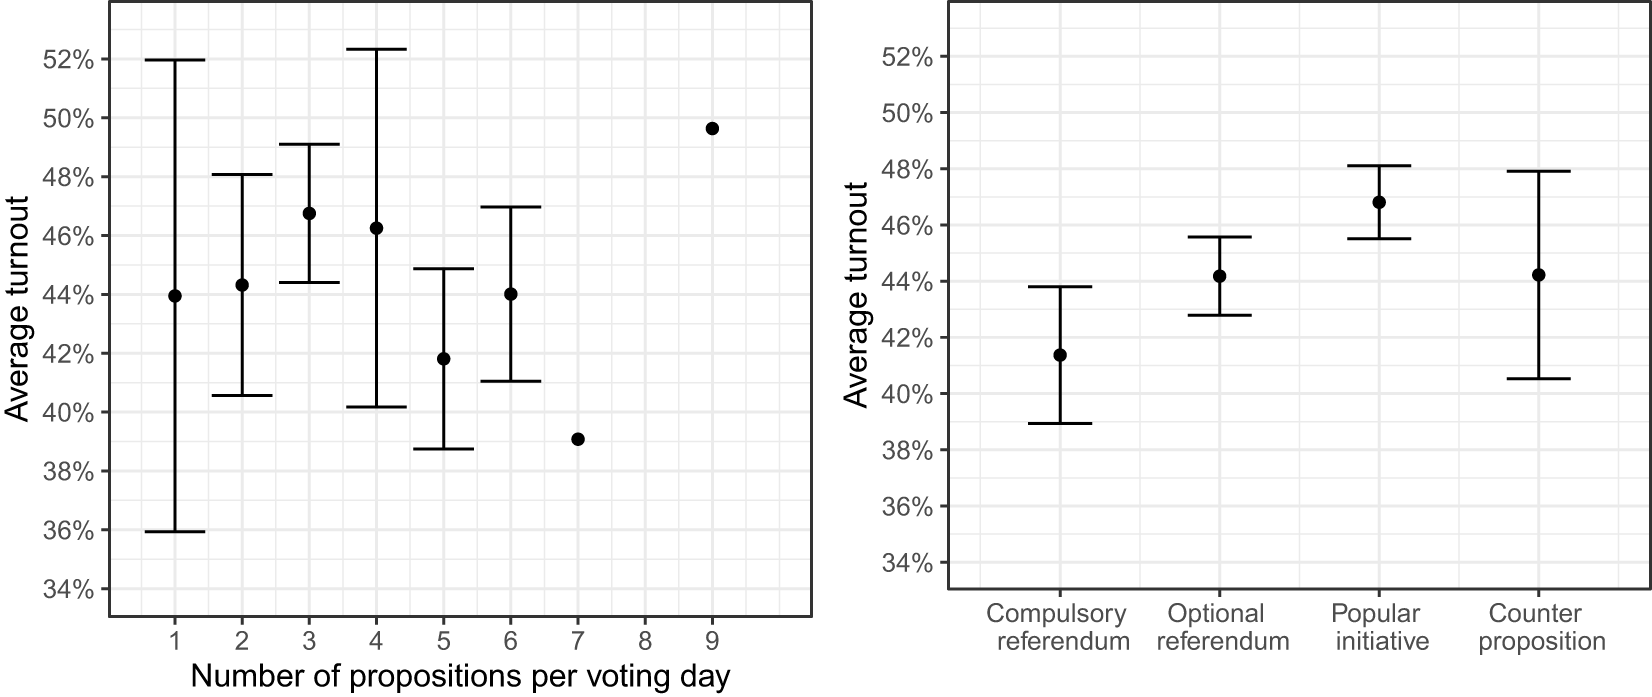
We find a similar pattern when analyzing administrative data on all propositions in our sample period (Swissvotes, 2022). The left panel in Figure 2 presents evidence that there is no obvious relationship between the number of propositions and average administrative turnout. In contrast, the legal form is related to turnout as indicated in the right panel of Figure 2. Popular initiatives have the highest average turnout (46.8%), followed by optional referendums and counter propositions (44.2%), while compulsory referendums have the lowest (41.4%).
Average turnout by number and legal form of the propositions.
The Federal Council decides which propositions are put up for a vote and the ordering of propositions on the ballot. Because these decisions are important for our identification of the ballot position on selective abstention, we have explored their legal basis for the period 1988–2016 which is our sample period. The Federal Chancellery chooses 4 voting days per year that are reserved for federal referendums.Footnote 4 Based on these voting days, the Federal Council decides which propositions will be on the ballot at least 4 months before the popular vote takes place.Footnote 5 The Chancellery follows a general rule: compulsory referendums appear first, then popular and counter initiatives, with constitutional referendums last. Within the same type, propositions are ordered by when they meet the legal requirements. We examined compliance with this practice and found deviations in 22 of 84 voting days. Our robustness checks in Section B.4 of the Online Appendix exclude these days to test sensitivity of our results.
Throughout our sample period, postal voting was introduced in a staggered way across cantons (see Luechinger et al., Reference Luechinger, Rosinger and Stutzer2007, Bechtel and Schmid, Reference Bechtel and Schmid2021). This institutional change has affected the fixed costs of voting. However, in our analysis, we use primarily within-individual variation in terms of individual net benefits. For an individual in a specific canton at a specific date, postal voting is constant and therefore this institutional change should not affect our results (see Subsection 7.2.3 for a detailed discussion of postal voting).
5. Data
We use repeated cross-sectional data on individual turnout and selective abstention from the post-vote survey VoxIt to explore how voters are mobilized on voting days featuring multiple propositions. The dataset includes 9,816 observations from 11 voting days with a single proposition and 168,347 observations from 68 voting days with multiple propositions (FORS, 2016).Footnote 6 These 68 days collectively encompass 228 federal propositions. The post-vote survey data includes individual information about the political behavior of the participants, such as their turnout decision, the salience of each proposition, and the difficulty a participant had to make up her mind about a proposition.Footnote 7 It also includes detailed personal characteristics, such as age, gender, marital status, education, political knowledge, and political ideology.
In analogy to our theoretical model, we empirically explore an individual’s decision to participate in a popular vote as the difference between the benefits and costs of voting. The costs of voting consist of two elements, net fixed costs of voting and information costs. As a measure of benefits, we use individual subjective salience. All respondents rated each proposition on a scale from 0 (not important) to 10 (very important). Information costs are based on whether respondents reported difficulty in deciding. Table 1 presents summary statistics. Panel (A) reports the data of all 9,816 individuals on voting days with a single proposition. Panel (B) presents the 53,218 participants who were asked about the propositions on voting days with multiple propositions. In both panels, we observe similar figures: average turnout is around 70%, salience ranges between 5 and 6, and slightly more than 40% of respondents report having difficulty forming an opinion. As expected, Section B.1 of the Online Appendix confirms that salience positively correlates with turnout, while decision difficulty is negatively associated.
Descriptive statistics of turnout, salience, and decision difficulty
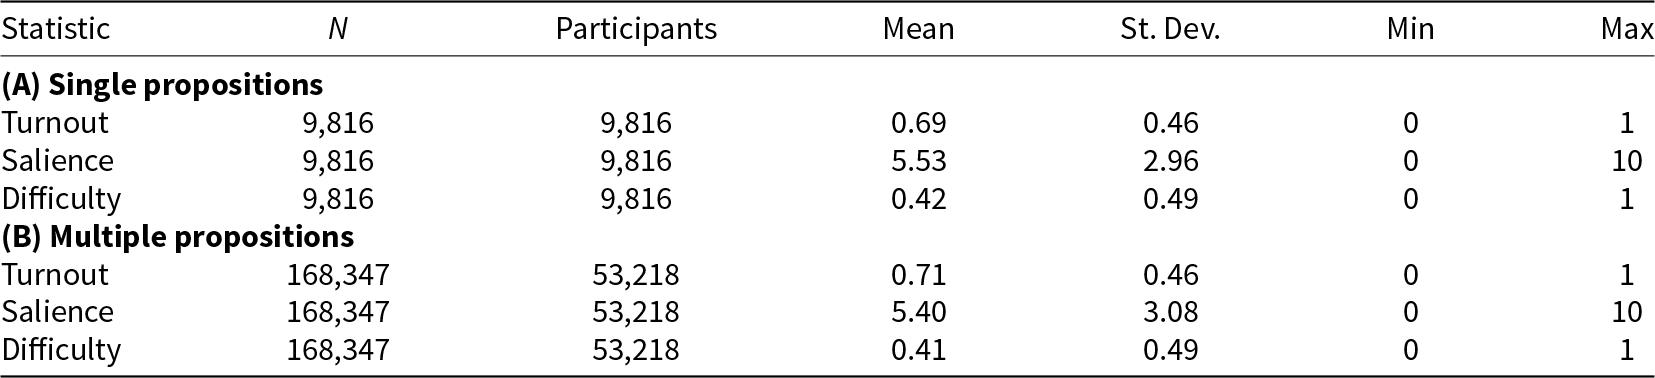
Note: This table presents the number of observations, the number of participants, the mean value, the standard deviation, and the minimum and maximum value of the variables that we use to construct the empirical cost–benefit calculus. Panel (A) contains voting days with single propositions, and Panel (B) summarizes voting days with two or more concurrent propositions.
6. Econometric framework
6.1. Construction of proposition net benefits
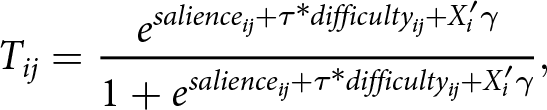
In the empirical part of our paper, we test whether our theoretical model is consistent with the data. We first need to bring the measures for the individual benefits and the individual information costs to the same scale and estimate the net fixed costs. Empirically, the probability that voter i participates in proposition j is
 \begin{align}
T_{ij}=\frac{e^{salience_{ij}+\tau*difficulty_{ij}+X_i'\gamma }}{1+e^{salience_{ij}+\tau*difficulty_{ij}+X_i'\gamma }},
\end{align}
\begin{align}
T_{ij}=\frac{e^{salience_{ij}+\tau*difficulty_{ij}+X_i'\gamma }}{1+e^{salience_{ij}+\tau*difficulty_{ij}+X_i'\gamma }},
\end{align} where the variable salience  $_{ij}$ captures the individual benefit, the variable difficulty $_{ij}$ is a proxy for information costs and Xi is a set of covariates, including age, marital status, gender, university degree, political knowledge, political ideology, and a constant. We do not include the probability of being decisive, denoted as p in Equation 1, in our empirical analysis for two reasons. First, we cannot directly observe how individuals perceive the closeness of the election in advance. Second, we contend that the probability of being decisive is reflected in the ex-post salience measure, as salience is associated with the ex post closeness of the vote. We provide evidence to support this claim in Section B.2 of the Online Appendix.
The coefficient τ standardizes the empirical measures of benefits and costs, and γ estimates individual net fixed costs. We use maximum likelihood to estimate these unobserved parameters. By focusing on voting days with single propositions, we avoid estimating parameter ρ from Equation 2, as it equals one in this case. Assuming τ and γ are constant across voting days with single and multiple propositions, we use them to construct proposition net benefits on days with multiple propositions. This enables the analysis of how each proposition’s net benefit influences turnout. Section B.3 of the Online Appendix presents the estimation results for τ and the parameters in γ used to construct net fixed costs.
In our analysis of the individual turnout decision, we include only voting days with multiple (at least two) propositions, excluding single-proposition days, where U max and U sum are identical. We aggregate proposition net benefits based on the two polar cases in Equation 2, once with ρ = 1 (sum) and once with  $\rho \rightarrow 0$ (maximum), at the voter–voting day level. This yields U sum, the total of all positive proposition net benefits, and U max, the highest net benefit on that day. For example, on a day with two propositions, if individual i has salience values of 7 and 10, difficulty of 1 for both, and fixed costs γ = 3, then $U^{sum} = (7 - 0.9*1) + (10 - 0.9*1) - 3 = 12.2$ and $U^{max} = 10 - 0.9*1 - 3 = 6.1$. The estimated value $\hat\tau = -0.9$ is from Column (2) of Table B.2 of the Online Appendix.
6.2. Descriptive statistics
Our first outcome variable is individual turnout, analyzed at the voting day level and re-scaled from 0 (abstention) to 100 (turnout). We control for institutional features by including the number of concurrent propositions, ranging from one to six,Footnote 8 and for the legal form of votes using indicators for popular initiatives, counter initiatives, and optional and compulsory referendums. We also control for individual characteristics: age, gender, university degree, marital status, political knowledge, and political ideology (on a 0-10 left–right scale). Political knowledge is a binary variable equal to one if a respondent recalls all proposition names they voted on. Panel (A) of Table 2 summarizes the dependent and independent variables used in our main turnout analysis. The average turnout in our sample is 70.3%. There are 3.2 propositions per voting day on average. In 79% of days, citizens vote on a popular initiative, 19% on a counter initiative, 66% on an optional referendum, and 34% on a compulsory referendum. The average respondent is 49 years old. Men and women are equally represented. 20% have a university degree, 62% are married, 68% have high political knowledge, and political ideology is, on average, balanced.
Descriptive statistics
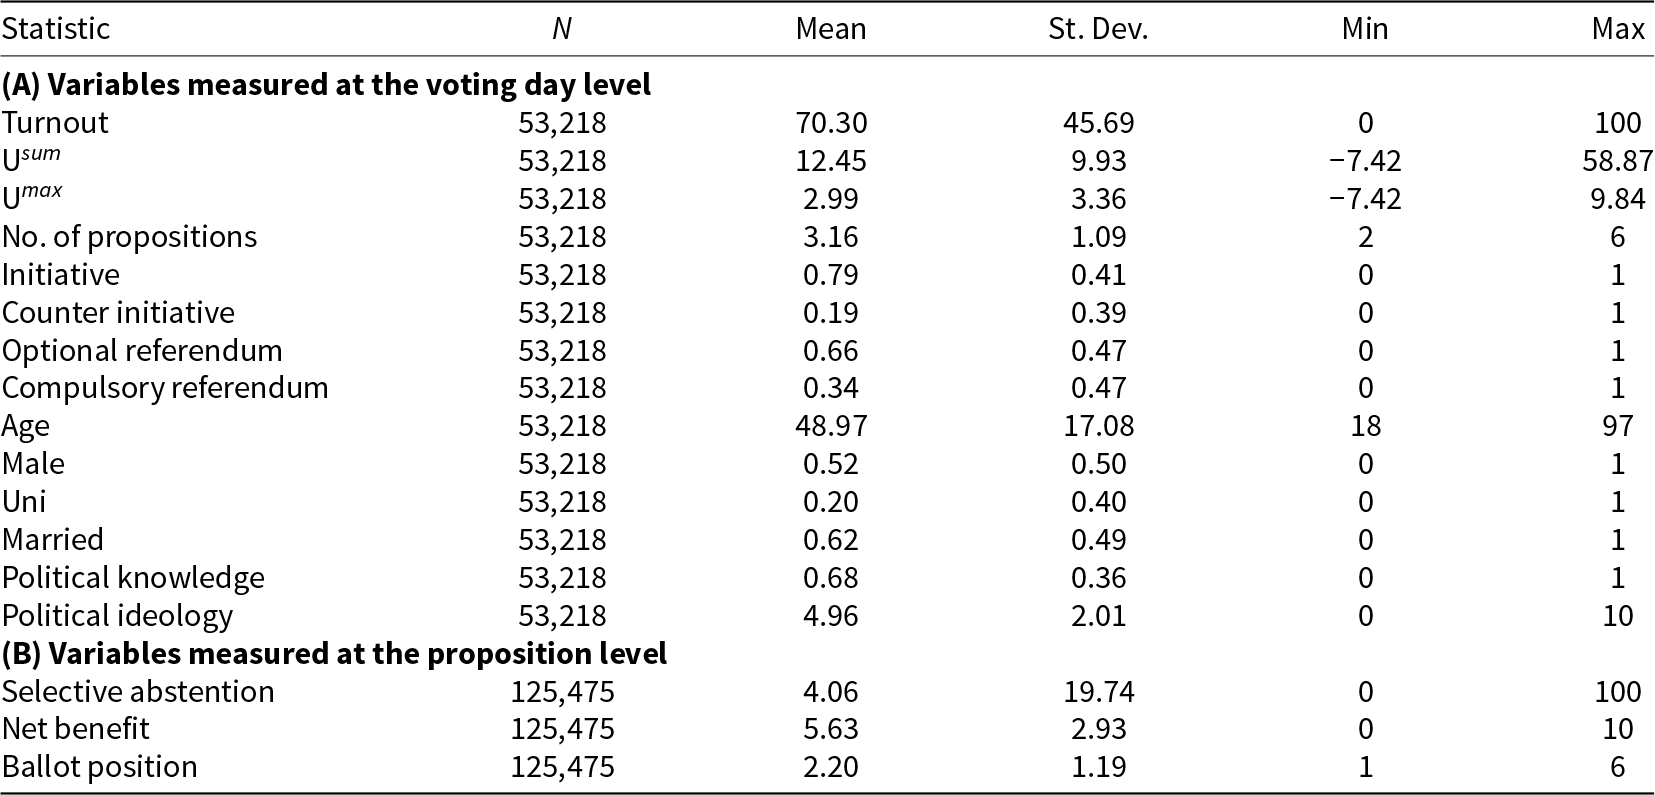
Note: The data, with 53,218 observations, are aggregated at the voting-day level and cover only voting days with at least two concurrent propositions. The data, with 125,475 observations, are at the proposition level and contain only voters, which explains the difference in the number of observations in Panel (B) of Table 1, where non-voters are also included. The columns describe the number of observations, the mean value, the standard deviation, and the minimum and maximum values. U sum is the polar case in Equation 2 with ρ = 1 and U max is the polar case with  $\rho \rightarrow 0$. The variable “net benefit” is a vote’s salience minus information costs and fixed costs.
Our second outcome variable is selective abstention, analyzed at the proposition level. We exclude non-voters from this analysis since they did not participate in any propositions. Selective abstention measures whether a voter casts an empty ballot for a proposition. Panel (B) of Table 2 shows that voters do so in 4.1% of all propositions. The main explanatory variables are the net benefit of the proposition and its position on the ballot, coded by its order on the ballot, that is, the highest proposition has a position on the ballot of one. The average net benefit in the sample is 5.6, and the average ballot position is 2.2.
6.3. Estimation equations
In our turnout analysis, we first explore whether the sum of net benefits with ρ = 1 and the maximum net benefit with  $\rho \rightarrow 0$ can explain variation in turnout. We estimate a regression of individual turnout on the sum of all proposition net benefits and the maximum proposition net benefit per voting day. We use repeated cross-section data that include a sample of eligible voters on different voting days. The main estimation equation is
 \begin{align}
Y_{icdt}= \mu_c + \delta_t + \beta_{1}U_{i}^{sum} + \beta_{2}U_{i}^{max} + X_{i}^{'} \beta + \varepsilon_{icdt},
\end{align}
\begin{align}
Y_{icdt}= \mu_c + \delta_t + \beta_{1}U_{i}^{sum} + \beta_{2}U_{i}^{max} + X_{i}^{'} \beta + \varepsilon_{icdt},
\end{align} where Yicdt denotes the turnout for individual i, living in canton c, for voting day d in year t,  $U_{i}^{sum}$ is the sum over all proposition net benefits for voting day d and $U_{i}^{max}$ is the maximum net benefit for voting day d, $X_{i}^{'}$ is a set of control variables, µc and δt are cantonal and year fixed effects, respectively, and ɛicdt is the error term. We choose the most relevant drivers of turnout that are available in the VoxIt data as control variables (see Smets and Van Ham, Reference Smets and Van Ham2013 for a review). The set of control variables consists of the number of concurrent propositions, dummies for the legal form of the propositions, and individual characteristics, such as age, gender, marital status, university degree, political knowledge, and a measure for political ideology. Our coefficients of interest are β 1 and β 2 which measure the impact of the sum over all proposition net benefits and the maximum proposition net benefit, respectively. By including canton fixed effects, we control for unobserved and time-invariant heterogeneity at the cantonal level, which might be related to the individual utility measures. The year fixed effects control for unobserved and canton-invariant factors, such as the overall decline in turnout.
We further explore how the net benefit of each proposition affects turnout by estimating regressions with each proposition’s net benefit of a respondent as a separate independent variable. For example, let us assume that there are three propositions at stake on a given voting day and that individual i has a net benefit of 3, 4, and 7 for the respective propositions. In our regression, we include three net benefit variables with an entry of 7 for the highest net benefit, 4 for the second-highest net benefit, and 3 for the third-highest net benefit. The estimation equation is
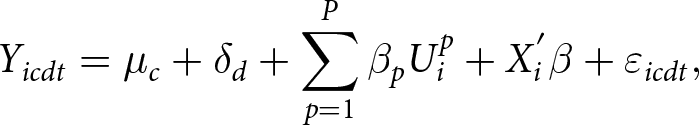 \begin{align}
Y_{icdt}= \mu_c + \delta_d + \sum_{p=1}^P \beta_{p}U_{i}^{p} + X_{i}^{'} \beta + \varepsilon_{icdt},
\end{align}
\begin{align}
Y_{icdt}= \mu_c + \delta_d + \sum_{p=1}^P \beta_{p}U_{i}^{p} + X_{i}^{'} \beta + \varepsilon_{icdt},
\end{align} where  $U_{i}^{p}$ is the proposition net benefit for proposition p with p = 1 for the proposition with the highest net benefit, p = 2 for the proposition with the second highest net benefit, and so on.
In our selective abstention analysis, we explore the impact of a proposition’s net benefit and a proposition’s ballot position by estimating
 \begin{align}
Y_{icpdf}= \mu_c + \delta_d + \gamma_f + \sigma_{df} + \beta_{1}U_{ip} + \beta_{2}BP_{pd} + X_{i}^{'} \beta + \varepsilon_{icpdf},
\end{align}
\begin{align}
Y_{icpdf}= \mu_c + \delta_d + \gamma_f + \sigma_{df} + \beta_{1}U_{ip} + \beta_{2}BP_{pd} + X_{i}^{'} \beta + \varepsilon_{icpdf},
\end{align} where Yicpdf is an indicator variable indicating whether individual i who lives in canton c casts an empty vote for proposition p of legal form f on voting day d, re-scaled from 0 (filling out the ballot with either yes or no) to 100 (casting an empty vote). Uip is the individual net benefit of proposition p and the variable BPpd measures the ballot position of proposition p on voting day d. In addition to the fixed effects for the cantons µc, voting days  $\delta_d$, and legal form $\gamma_f$, we also include voting day times legal form fixed effects $\sigma_{df}$. Therefore, we use the variation within propositions of the same legal form on a given voting day, which allows us to identify the causal effect because the ballot position is randomly assigned within propositions of the same legal form as described in Section 4. The fact that we find no statistical association between the ballot position and the individual net benefit for propositions with the same legal form supports this identification assumption (see Figure B.4 of the Online Appendix).
7. Empirical results
7.1. Main results
7.1.1. Turnout behavior in popular votes with concurrent propositions
In the first part of our analysis, we explore the impact of the propositions’ net benefit on turnout. Table 3 reports the results of estimating Equation 5. Column (1) reports the effect of the sum over all proposition net benefits per voting day, U sum, and the respondent’s maximum proposition net benefit per voting day, U max, on turnout, including all voting days with at least two propositions. The estimated effect in Panel (A) is 0.7*** percentage points for U sum and 2.5*** percentage points for U max. This indicates that both the sum of all proposition net benefits and the maximum proposition net benefit are important determinants of the individual turnout decision.Footnote 9 How do the magnitudes of these two coefficients compare in terms of a one-standard-deviation change? Panel (B) reports the standardized effects, with an estimated effect of 6.7*** percentage points for U sum and 8.4*** percentage points for U max. This indicates that U max is a slightly stronger determinant of turnout than U sum in terms of magnitude.
Effect of utility on turnout in concurrent propositions
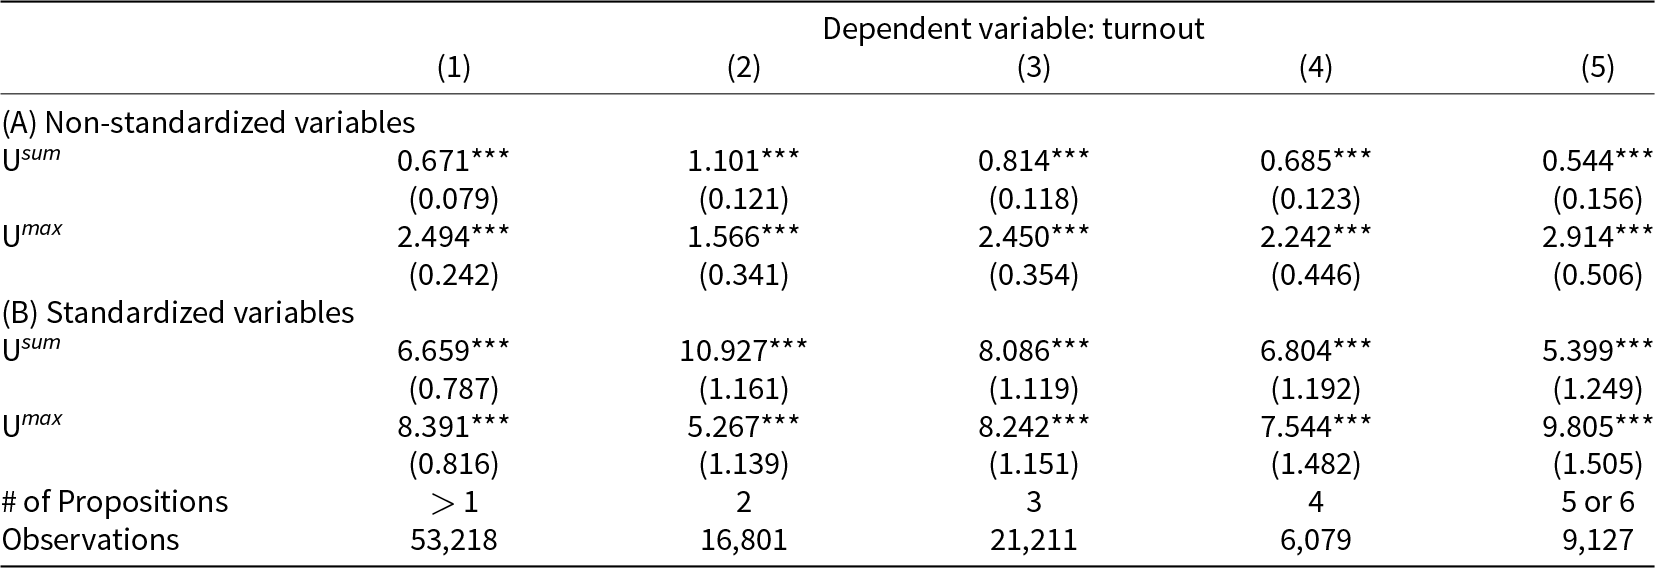
Note: In all five columns, the dependent variable is individual self-reported turnout, re-scaled to 0 and 100. All regressions include canton and year fixed effects and include control variables for gender, marital status, age, education, political knowledge, political ideology, the number of concurrent propositions, and the legal form of the propositions. Panel (A) presents the results of the non-standardized variables and Panel (B) presents the results of the standardized variables. Column (1) includes all voting days with two or more concurrent propositions, Column (2) includes voting days with two, Column (3) voting days with three, Column (4) voting days with four, and Column (5) voting days with five or six concurrent propositions. The robust standard errors in parentheses are two-way clustered by canton and voting day. *** $p \lt $0.01, ** $p \lt $0.05, and * $p \lt $0.1.
In a further step, we split the data into different groups according to the number of concurrent propositions per voting day and present the results in Columns (2)–(5). Column (2) reports the effect of U sum and U max for voting days with only two concurrent propositions. The standardized effects indicate that the sum over all proposition net benefits is a more relevant determinant with 11.0*** percentage points compared to the maximum propositions net benefit with 5.3*** percentage points. The results in Columns (3) and (4) indicate that on voting days with three and four concurrent propositions both utility measures U sum and U max exhibit a similar effect on the individual turnout decision in terms of a one-standard- deviation change. The analysis of voting days with five or six concurrent propositions yields a different picture. The results in Column (5) indicate that the proposition with the highest net benefit is a more relevant determinant of turnout than the sum of all net benefits. For voting days with five or six concurrent propositions, we find that a one-standard-deviation change in U sum increases turnout by 5.4*** percentage points, and a one-standard-deviation change in U max increases turnout by 9.8*** percentage points.
Overall, Table 3 provides two key findings. First, turnout on a voting day with multiple concurrent propositions depends on both the proposition with the highest net benefit and the sum over all proposition net benefits. Second, the relative impact of the two utility measures depends on the number of concurrent propositions per voting day. When only two propositions are on the ballot, turnout depends on both net benefits rather than just the highest. As the number of propositions increases, the influence of the highest net benefit grows, while the sum becomes less relevant.
We further explore the theoretical prediction of Proposition 1 on the differential impact of the propositions’ net benefits by including all ordered proposition net benefits of a respondent as a separate independent variable as described in Equation 6. We repeat this procedure for six different samples: the sample of all voting days with a single proposition, the sample of all voting days with two propositions, and so on. The results are depicted in Figure 3. The top-left graph presents the effect of the individual net benefit for voting days with a single proposition as a benchmark. The point estimate is 3.5 percentage points and statistically significant. The other graphs document that the proposition with the highest net benefit is the most important driver of turnout in all samples, while most coefficients for the propositions with lower net benefits are statistically significant but substantially smaller. The pattern is most pronounced for voting days with two and three propositions for which we have good statistical power.Footnote 10
Effect of ordered net benefits on turnout.
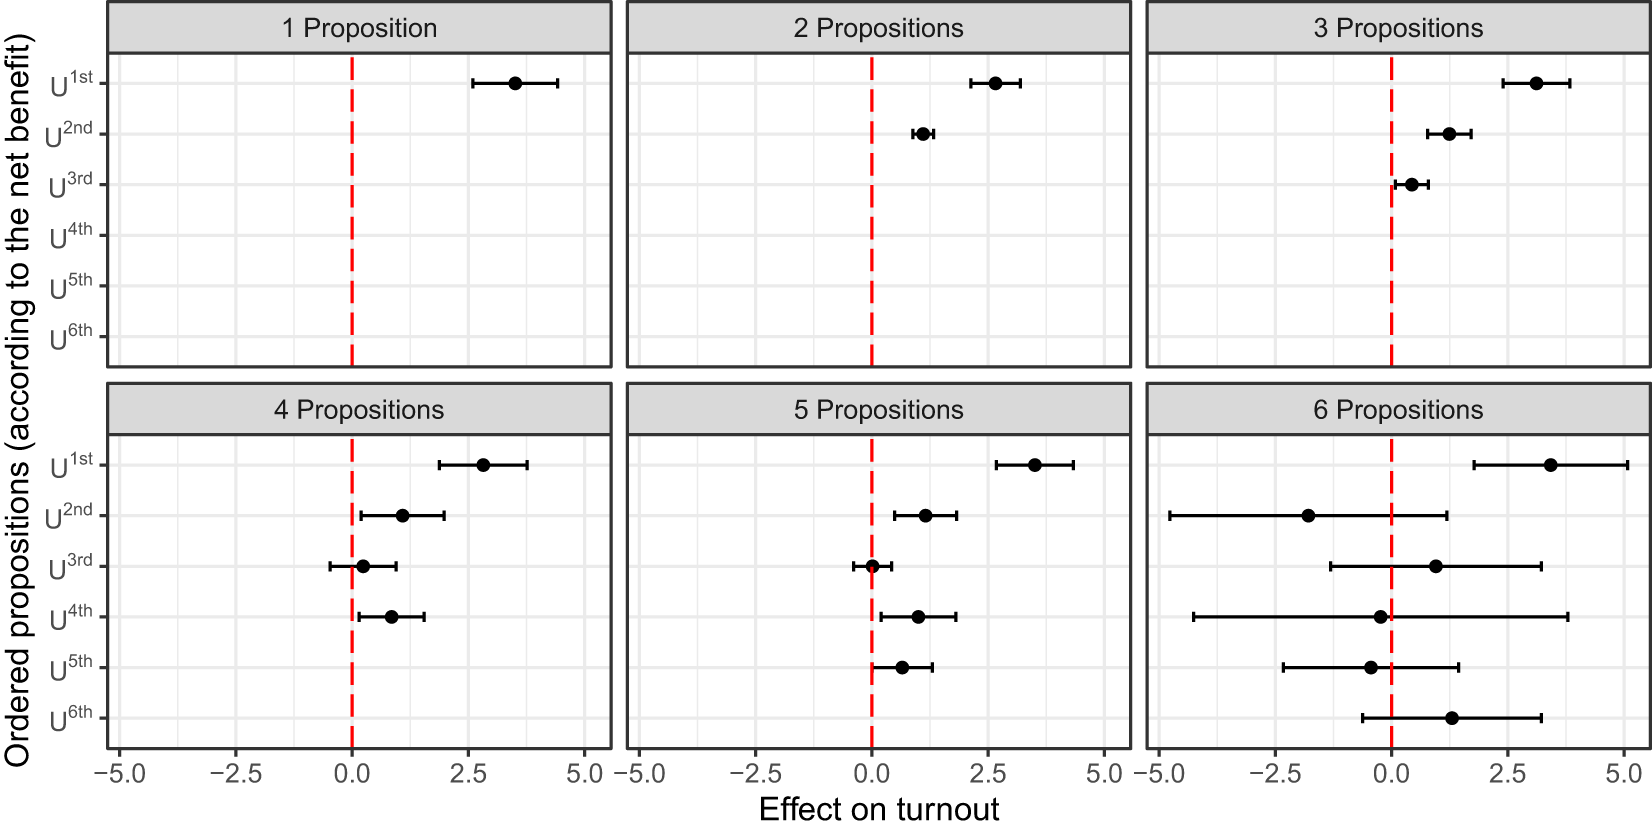
These results are in line with our theoretical model, predicting that voting behavior is driven more strongly by the important votes. The estimates are less precise but qualitatively consistent with our theoretical model for voting days with four, five, and six propositions. The reason for this is twofold. First, the difference between the net benefits of two consecutively ordered propositions declines as the number of concurrent propositions increases, making it more difficult to distinguish them empirically. Second, the statistical power decreases, e.g., there are only 2 voting days with six concurrent propositions.
7.1.2. Selective abstention in popular votes with concurrent propositions
In the second part of our analysis, we empirically analyze how voters selectively abstain on voting days with multiple concurrent propositions and present the results in Figure 4. Darker areas are associated with higher selective abstention rates. The columns are separated according to the number of propositions per voting day. Panel (A) presents the share of voters in our sample who cast an empty vote per proposition. The propositions are ordered according to the net benefit at the voter level.Footnote 11
Share of selective abstention by ordered net benefit.
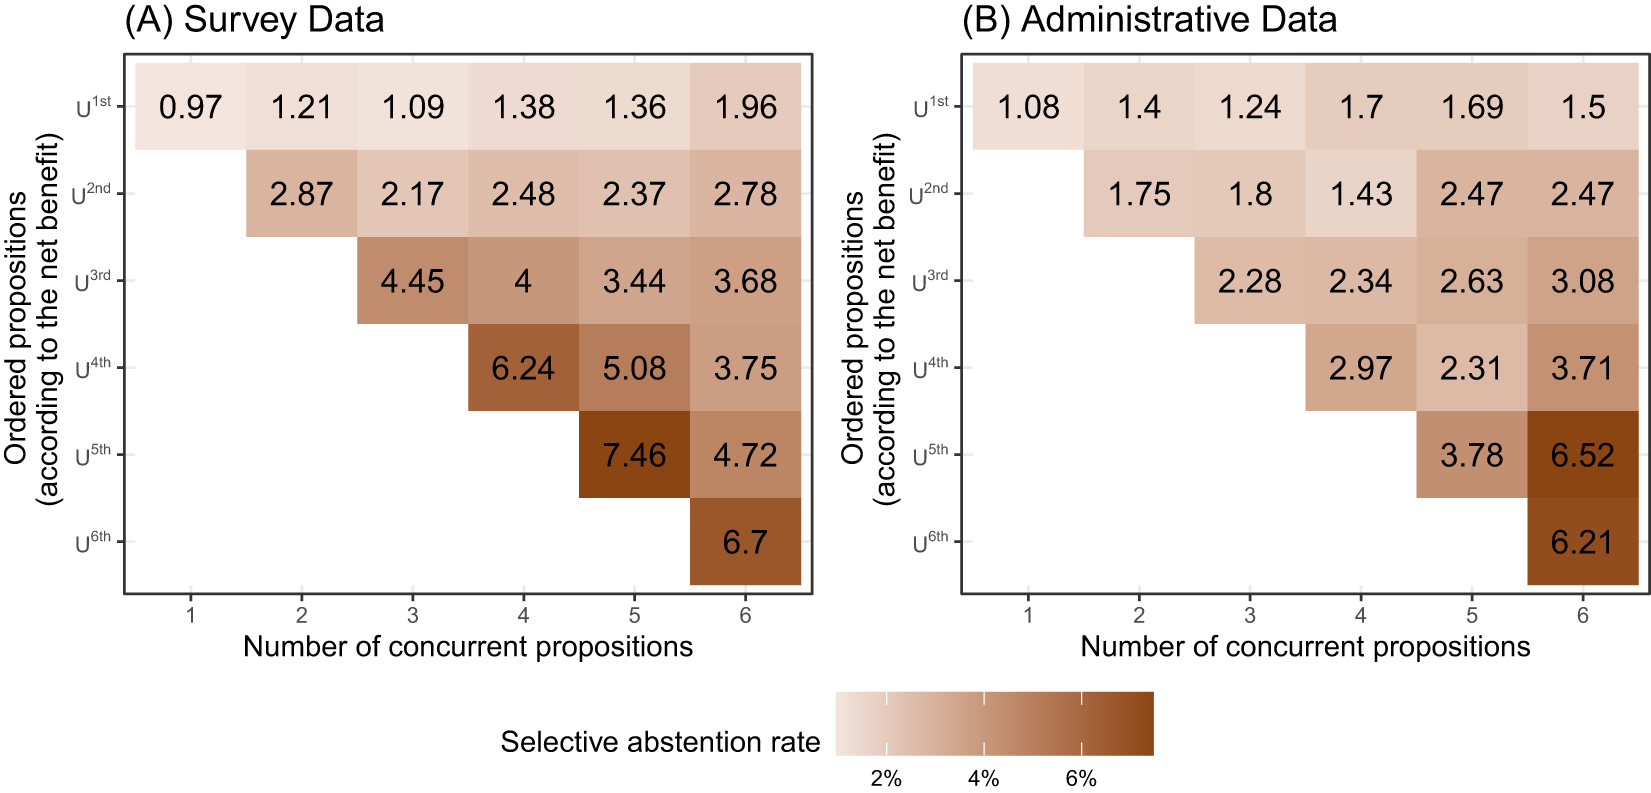
Panel (B) presents the average share of abstainers using administrative data. The propositions are ordered according to the average net benefit across all voters based on the survey data. This means that the ordering of the propositions is not individual-specific. For example, we define  $U^{1st}$ as the proposition with the highest average net benefit on a given voting day. The patterns in Panels (A) and (B) are similar and provide two major insights. First, the proposition with the highest net benefit has always the lowest average selective abstention rate per voting day. Second, the lower a proposition’s ranking according to its net benefit, the higher the share of selective abstention. As shown in Panel (B), this pattern emerges for all voting days, except those with 5 or 6 concurrent propositions, where statistical power is lowest.
We complement this descriptive analysis with a more elaborate approach by estimating Equation 7 and regressing selective abstention on the net benefit Uij and the proposition’s ballot position on the official ballot. This allows us to separate the effect of the net benefit from the effect of the ballot position on selective abstention. Table 4 presents the results and offers two important insights. First, the results indicate that the association between the net benefit and selective abstention is negative. The point estimate in Column (1) is −1.2*** percentage points and statistically significant. It is almost identical when controlling for sociodemographic control variables in Column (2). Second, we find that the position of the proposition on the ballot is also an important driver of selective abstention. In both specifications, we find that the share of selective abstention increases by 0.9*** percentage points if a proposition is ranked one position lower on the ballot list. This finding indicates that voters in Switzerland who turn out in federal popular votes with multiple concurrent propositions experience choice fatigue.Footnote 12
Effects of proposition net benefit and ballot position on selective abstention
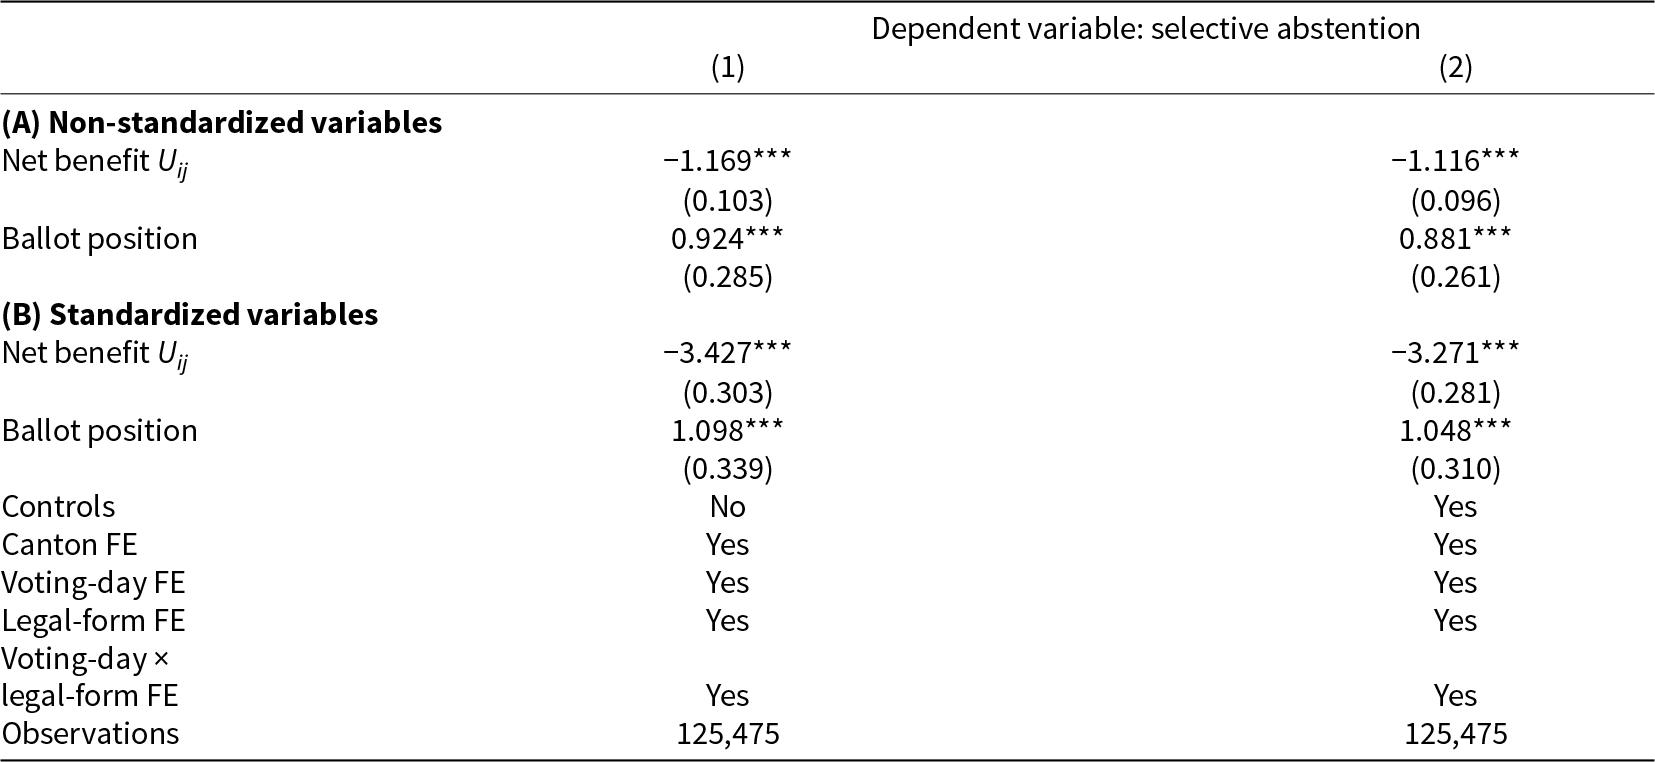
Note: The dependent variable for both regressions is self-reported abstention, re-scaled to 0 and 100. In Columns (1) and (2), we include canton, legal-form, voting-day, and voting-day × legal-form fixed effects. The regression in Column (2) additionally controls for gender, marital status, age, education, political knowledge, political ideology, and the number of propositions. The reported estimates are standardized to express the impact of a one-standard-deviation change of the explanatory variables on selective abstention. The robust standard errors with two-way clustering by individual and voting day are in parentheses. *** $p \lt $0.01, ** $p \lt $0.05, and * $p \lt $0.1.
To compare the effect of the net benefit and the effect of the ballot position, we standardize the two variables and compare their effects on selective abstention in Panel (B). In the specification with control variables in Column (2), the effect of the standardized net benefit is −3.3*** percentage points and statistically significant. In the same specification, the effect of the standardized ballot position is 1.1*** percentage points. These findings suggest that the estimated effect of a proposition’s net benefit is three times larger compared to the effect of the ballot position. Therefore, choice fatigue is a relevant determinant of selective abstention but less relevant than the net benefit.
7.2. Additional results
7.2.1. Administrative outcome data
Our main results in Section 7.1 rely on self-stated outcome variables; therefore, social desirability might bias our results. We find that the self-reported survey turnout rate exceeds the administrative turnout rate by a substantial margin of 21.8 percentage points on average. Figure B.6 of the Online Appendix presents a graphical illustration of this gap. For this purpose, we test whether our main findings remain consistent when using administrative outcome variables and present the results in Table 5. Column (1) presents the effects of U sum and U max on administrative turnout when we aggregate all variables to the canton-voting day level. This substantially reduces our sample size to 1,681 observations and prevents us from using individual-level heterogeneity in the net benefits. The coefficients for U sum and U max are both statistically insignificant with 0.1 and 0.7 percentage points, respectively. Despite limited statistical power with aggregate administrative turnout data, the results support the main finding that U max is a slightly more relevant determinant of turnout than U sum.
Administrative data
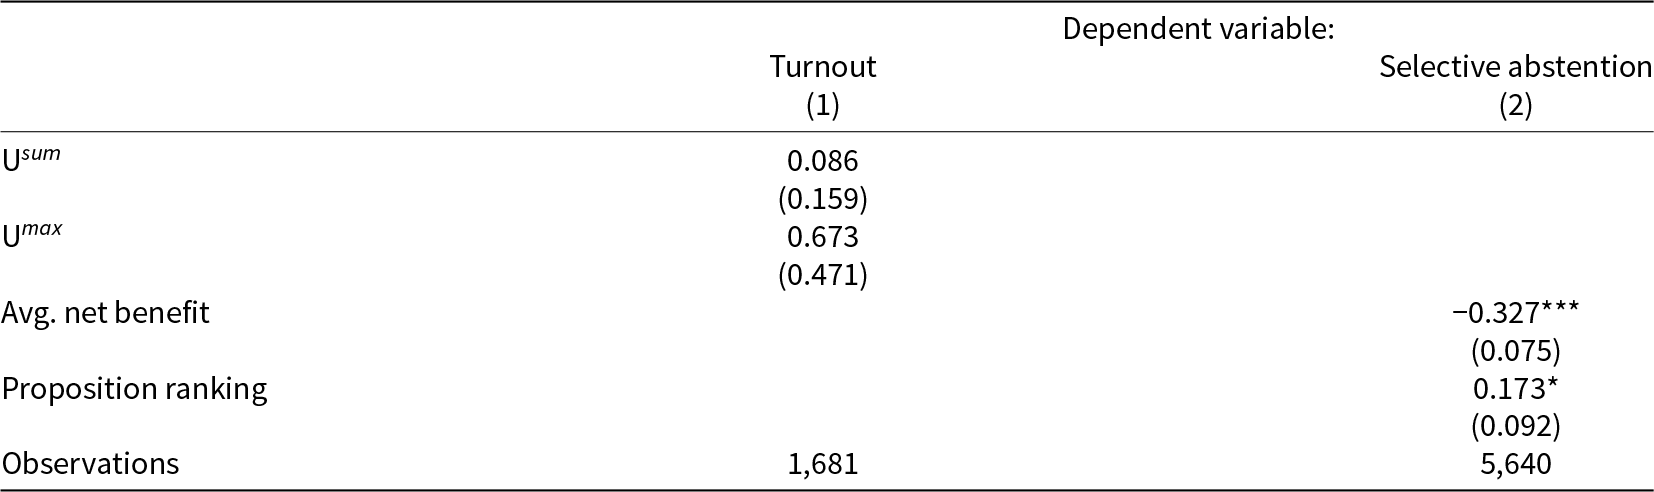
Note: The dependent variable in Column (1) is average administrative turnout per voting day and canton, and the explanatory variables U sum and U max are aggregated at the voting day and cantonal level. The dependent variable in Column (2) is the average administrative measure for selective abstention per proposition and canton and the explanatory variables consist of the average net benefit per proposition and canton and the ballot position. The regression in both columns includes the average of the socioeconomic characteristics from our sample on the cantonal-voting-day-level. The robust standard errors with two-way clustering by canton and voting day are in parentheses. *** $p \lt $0.01, ** $p \lt $0.05, and * $p \lt $0.1.
Social desirability might also bias our findings on selective abstention and therefore we estimate a regression using administrative abstention data on the average proposition net benefit and the ballot position. The results in Column (2) support the findings in Table 4 that both the net benefit and the ballot position are relevant determinants of selective abstention.
7.2.2. Assessing the turnout and selective abstention effect
Our first set of results shows that voter turnout rises when concurrent propositions have higher net benefits. In contrast, the second set reveals that bundling propositions leads to more selective abstention, particularly for those with lower net benefits. Thus, if policymakers aim to increase participation, defined as casting either a yes or no vote, they face a trade-off between boosting turnout and reducing selective abstention. While high-benefit propositions increase turnout, combining them with low-benefit propositions increases abstention rates.
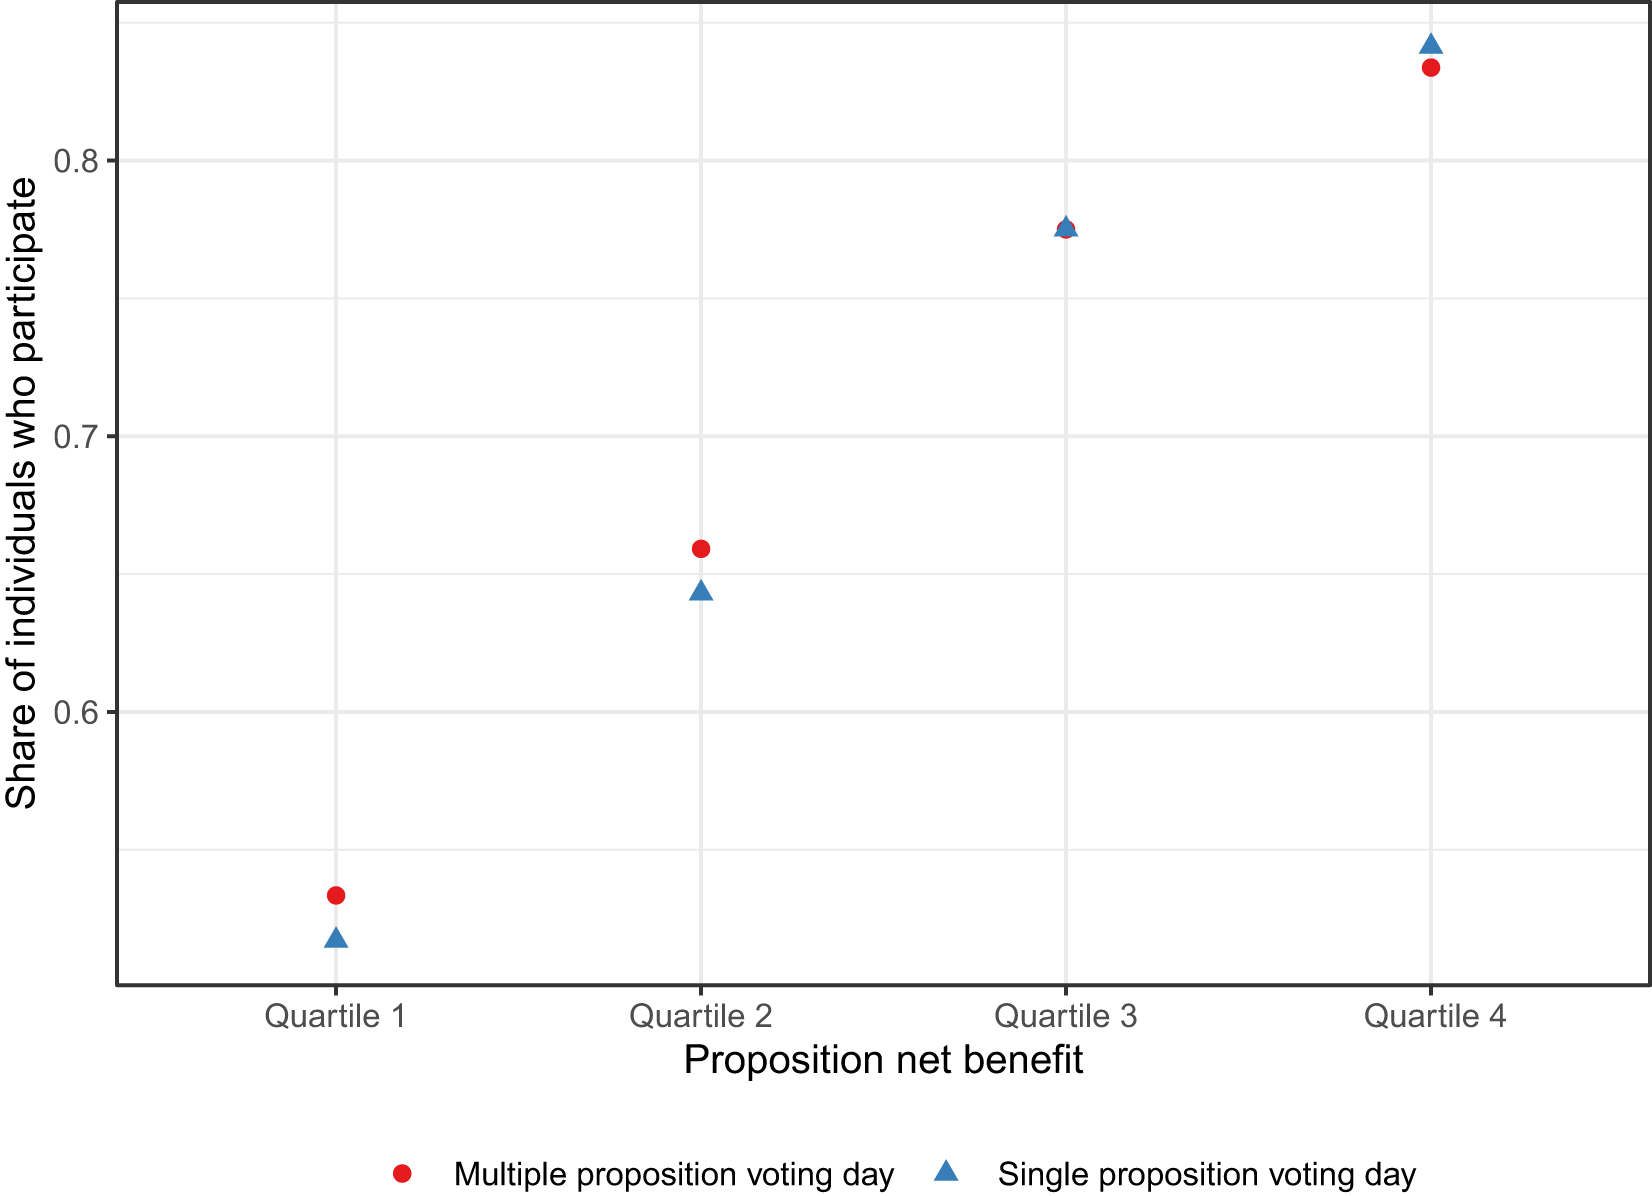
To compare turnout and abstention, we define “political participation” as 1 if a voter casts a nonempty ballot, and 0 if they selectively abstain or do not vote at all. If turnout dominates, participation should be higher on multi-proposition days despite abstention. If abstention dominates, participation should be higher on single-proposition days.
Figure 5 illustrates the share of individuals who participated in single proposition days (represented by red dots) and multiple proposition days (represented by blue triangles) on the y-axis. The x-axis displays the individual-level net benefit of a proposition. The figure shows that participation rates are higher on multiple-proposition voting days for propositions with net benefits in the first and second quartiles. This suggests concurrent voting boosts participation, especially for low-salience propositions, but not necessarily for high-salience propositions.
Voting in single and multiple propositions.
7.2.3. Impact of postal voting
In Switzerland, voters have the option to participate in elections or referendums by either going to the ballot box or voting by post. Some cantons introduced postal voting earlier during our sample period, while others did so later. To account for this, we create a dummy variable, which is 1 if postal voting was available and 0 otherwise (see Luechinger et al., Reference Luechinger, Rosinger and Stutzer2007 for a detailed overview). The staggered introduction of postal voting during our sample period raises the question of how this impacts the cost–benefit calculus, turnout, and selective abstention.
Table 6 presents the effect of introducing postal voting on turnout in Columns (1) and (2), and on selective abstention in Columns (3) and (4). We interact the dummy variable for the availability of postal voting with the aggregated net benefits U sum and U max in Column (2) and with the net benefit Uij in Column (4). The results suggest two main insights. First, the availability of postal voting increases the impact of the proposition with the highest perceived net benefit on turnout. Second, postal voting exacerbates the impact of a proposition’s net benefit on selective abstention. Overall, we conclude that our main findings are valid for periods with and without the availability of postal voting with slightly stronger results for postal voting periods.
Postal voting
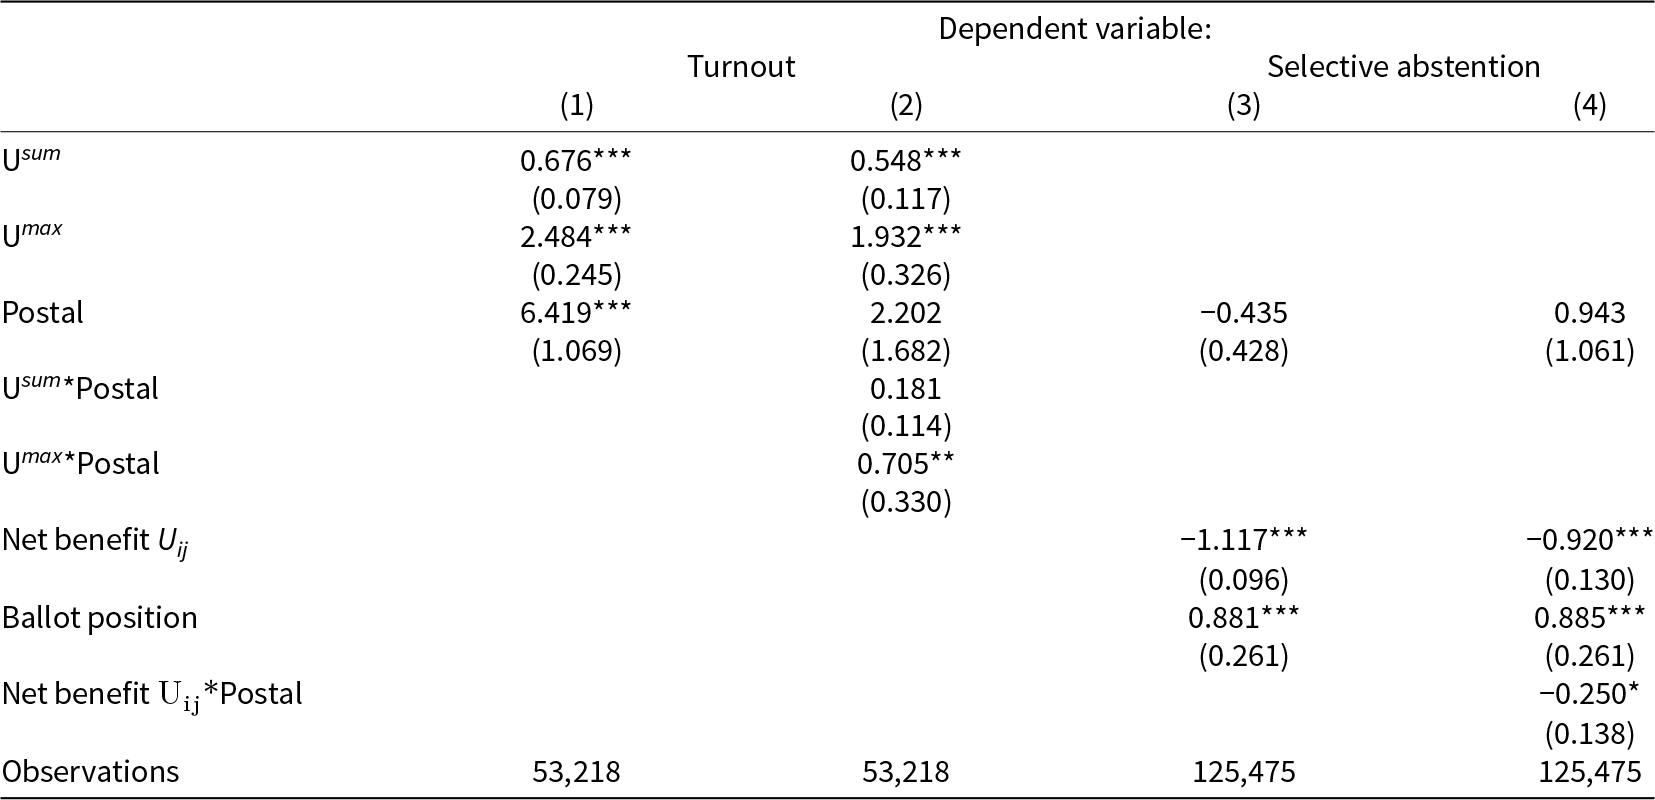
Note: The dependent variable in Columns (1) and (2) is individual self-reported turnout, and in Columns (3) and (4), it is self-reported abstention. Both outcome variables are re-scaled to 0 and 100. In all four columns, we control for gender, marital status, age, education, political knowledge, political ideology, and the number of propositions. The regressions in Columns (1) and (2) include canton and year fixed effects, and in Columns (3) and (4) canton, legal-form, voting-day, and voting-day × legal-form fixed effects. In Columns (1) and (2) the robust standard errors in parentheses are two-way clustered by canton and voting day and in Columns (3) and (4) by individual and voting day. *** $p \lt $0.01, ** $p \lt $0.05, and * $p \lt $0.1.
7.3. External validity
In our empirical analysis, we focus on federal referendums, which raises the question of whether our findings are also relevant for concurrent elections. We argue that the information costs, denoted as Iij, are lower for concurrent elections compared to concurrent referendums. This is because voters can use party cues as a decision shortcut for concurrent elections, while for referendums, voters need to understand their preferred party’s stance on every single referendum. Despite this difference in information costs, we argue that the expected benefit, pBij, varies across elections and therefore causes variation in turnout and selective abstention behavior.
To empirically test whether our key mechanisms also work for concurrent elections, we collected administrative data on turnout and selective abstention in cantonal parliamentary elections from 1988 to 2016.Footnote 13 We exploit a quasi-experiment in which some cantonal elections coincide with federal referendums. This provides exogenous variation in vote salience and enables the analysis of the effect of concurrent federal referendums on election outcomes. The data also allow us to use the concurrent election as a treatment and estimate the effect on referendum outcomes. Table 7 presents the results. Column (1) indicates that a concurrent federal referendum increases election turnout by 6.7*** percentage points. Column (2) reports a 0.3 percentage point increase in the share of empty ballots relative to all eligible ballots in cantonal elections, though the estimate is imprecise. Column (3) shows that a cantonal concurrent election increases federal referendum turnout by 6.8*** percentage points. Column (4) indicates an imprecisely estimated 0.2 percentage point effect on the share of empty ballots.
Concurrent elections and referendums
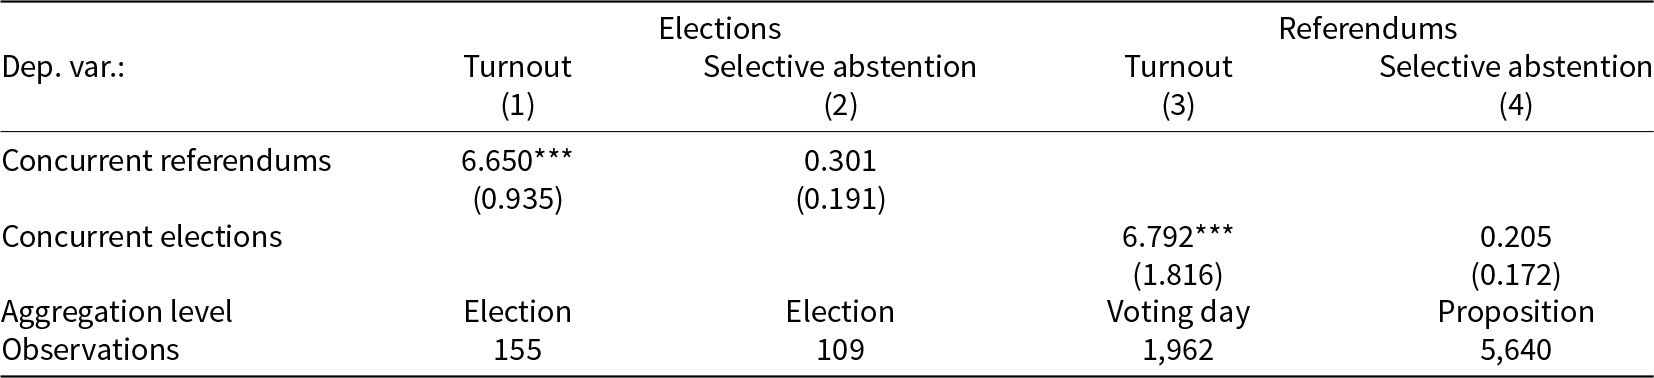
Note: The dependent variables in Columns (1) and (2) are administrative turnout and the share of empty ballots relative to all eligible ballots cast for cantonal elections and the outcomes in Columns (3) and (4) are the same but for federal referendums. Data in Columns (1) and (2) are at the cantonal and election level, in Column (3) at the voting-day and cantonal level, and in Column (4) at the proposition and cantonal level. In Columns (1) and (2), we control for canton and election period fixed effects and in Columns (3) and (4), we include canton and voting-day fixed effects. In all four columns, the robust standard errors in parentheses are one-way clustered by canton. *** $p \lt $0.01, ** $p \lt $0.05, and * $p \lt $0.1.
The findings in Columns (1) and (3), as well as in Columns (2) and (4), are very similar and indicate that our main results hold for both elections and referendums, thereby enhancing their external validity. Although information costs may differ between elections and referendums, the expected net benefit pBij seems to matter for individuals’ turnout decisions and their selective abstention behavior.
In our main empirical analysis, we focus on concurrent referendums, while this section examines how referendums influence elections and how elections, in turn, affect referendums when held concurrently. One scenario we cannot empirically analyze is when multiple elections are held simultaneously since federal elections in Switzerland never coincide with cantonal elections. However, based on our theoretical model and empirical findings, we believe that our results are also applicable in the context of concurrent elections.
8. Conclusion
Holding concurrent votes is common practice in Western democracies. In this paper, we develop a rational choice model and empirically test its implications using Swiss federal popular votes with multiple propositions. Our theoretical model captures the turnout decision on such voting days as a cost–benefit calculus with variable and fixed voting costs. The variable costs are the information costs incurred for each proposition, while the fixed costs are specific to each voting day. This distinction explains why decision-making differs between single-proposition and multi-proposition voting days. Our model relies on the assumption that the utility function of voting is a constant-elasticity-of-substitution aggregation of the net benefits of the single propositions. The two polar cases of this aggregation define the total utility of an individual as (i) the sum of net benefits of all propositions per voting day and (ii) the maximum net benefit among all single propositions on a voting day. The derivative of the utility function implies that, for intermediate values of the elasticity of substitution, the proposition with the highest net benefit is the most relevant determinant of turnout.
In the empirical part of the paper, we test the implications of the theoretical model with data on federal popular votes in Switzerland from 1988 to 2016. In our turnout analysis, we find that both the maximum and sum of all proposition net benefits affect individual turnout in concurrent votes whereby their relative impact depends on the number of concurrent propositions on the ballot. On voting days with few concurrent propositions, the sum over all proposition net benefits is a more relevant determinant. On voting days with many concurrent propositions, the maximum among all net benefits is the more relevant determinant. We also find that the highest proposition net benefit has the strongest marginal effect on turnout, with diminishing effects for lower-ranked propositions.
In our analysis of selective abstention, we find that the propositions’ net benefit is an important driver of whether individuals selectively abstain. A comparison between the impact of a proposition’s net benefit and the impact of a proposition’s ballot position suggests that both are important determinants of selective abstention but the impact of the net benefit is substantially larger. Selective abstention tends to be higher for low-salience propositions. However, the comparison of voters who cast a nonempty ballot between voting days with single and multiple propositions reveals that holding concurrent votes mainly increases participation in low-salience referendums. This suggests that the turnout effect dominates the effect on selective abstention when holding low-salience votes concurrently. These findings are relevant for organizing voting days with multiple votes. In particular, policymakers who want to improve the representativeness of a vote may use concurrent elections and referendums to increase political participation. However, our results document that this can only be achieved for votes with a relatively low salience.
We stress one important limitation of our approach. We do not consider the potential heterogeneity among different demographic groups. One fruitful area for further research would be exploring how heterogeneous parameters alter the calculus of voting.
Supplementary material
The supplementary material for this article can be found at https://doi.org/10.1017/psrm.2025.10033. To obtain replication material for this article, https://doi.org/10.7910/DVN/VTJQLK.
Competing interests
The authors declare none.


 Open access