


1. Introduction
In many western societies, individual households have become more and more responsible for their own financial well-being after retirement. Various studies, however, question the ability of consumers to act autonomously in making financial decisions, and in particular in pension choice. People typically plan insufficient for retirement, save too little, and under diversify in their retirement portfolios (Lusardi and Mitchell, Reference Lusardi and Mitchell2014). These results have also been reported for the Netherlands. Alessie et al. (Reference Alessie, Van Rooij and Lusardi2011), for example, find that only 13% of non-retired people in the Netherlands spend considerable thought on their retirement, while a substantial group of households hardly ever pays attention to their retirement. However, they also indicate that higher financial literacy drives enhanced retirement preparation. Relatedly, De Bresser and Knoef (Reference de Bresser and Knoef2015) find that a considerable group of Dutch falls short of their self-reported minimum retirement expenditures. The median difference between expected retirement income and expenditures is 25%. Even when taking private savings and housing wealth into account, about one fifth of the Dutch fall short. Although high-income individuals accumulate more wealth, their retirement ambitions rise more than proportional, making them less likely to achieve their financial goals. Most at risk, given their low pension entitlements, are females, self-employed and divorced.
It seems clear that limited retirement preparation may lead to insufficient future pension benefits. Both a lack of financial knowledge, self-efficacy, and psychological biases are at the root cause of this: many individuals find pension choice very complex, which combined with present biasedness, drives inertia in pension planning and choice.
John et al. (Reference John, Grace, Gale and Iwry2021) discusses a Retirement Dashboard as a promising innovation to assist people in better preparing for their retirement. Indeed, pension funds around the world increasingly communicate with their beneficiaries by means of a pension dashboard to provide them with an overview of entitlements and future projections for different life scenarios. Also, various countries have introduced online pension tools for their citizens. In Sweden for example, individuals can get access to an overview of their accumulated pension rights (see: https://www.minpension.se/). Moreover, pension funds in the UK aim to have dashboards up and running by 2026 (see: https://www.pensionsdashboardsprogramme.org.uk/). The implicit suggestion of a dashboard is that pension beneficiaries are in control of their pension income. Pension dashboards are popular among pension funds to fulfill their fiduciary duties, as they are a cost-efficient.
An online pension dashboard may also be more effective in communication with beneficiaries relative to static forms, such as brochures and legal documents. An online dashboard is interactive, offers the possibility of personalization, and ease of access. The creation of interactive engagement helps the beneficiary to remain motivated in the process of learning about his pension. It allows the beneficiaries to change inputs and calculate the outcomes under different scenarios. Personalization allows the information to be targeted to the individual needs of the beneficiaries. For instance, a potential user can try to calculate the impact of early or part-time retirement on his or her future pension income. Ease of access is important since online tools can usually be used at any time or day-of-the-week.
Many of these benefits are also available from a financial advisor. However, there are some noteworthy differences. The online dashboard tends to be patient, while the advisor will be limited in time, and charges per hour. On the other hand, the dashboard is only as flexible as its programming, and may not be flexible enough to adjust to the information needs of the user, while a good advisor may be more flexible in finding a way to frame the problem more in line with the user's knowledge and information needs. For pension funds, it is also an attractive alternative: once the online dashboard has been developed, the marginal cost of offering the tool in more pension plans is very low. It is therefore no surprise that pension funds are now experimenting with different forms of dashboards to actively inform their clients, and change their pension behavior.
As far as we are aware, there are not many prior studies on the effectiveness of online pension dashboards. In particular, we did not find any research based on rigorous experimental design. Some studies however surveyed participants after the introduction of a dashboard. Hackethal et al. (Reference Hackethal, Bucher-Koenen, Kasinger and Laudenbach2018) conducted a pilot with an online pension dashboard in Germany and the Italian INPS (Institute for Social Security) reports on the launch of an online pension tool in Italy. Both studies report that people perceived an increase in their knowledge and understanding of pension information after using the dashboard. Although effects of online dashboards have not been studied widely, there is a substantial literature on various other remedies tried by policy makers, in particular financial education by means of brochures, legal documents, and advisors. If pension beneficiaries spend time and have sufficient cognitive abilities, supplying them with sufficient information and knowledge can in principle solve the problems highlighted before. Higher financial literacy has been shown to improve retirement planning (Bucher-Koenen et al., Reference Bucher-Koenen, Lusardi, Alessie and Van Rooij2017), and many advert the benefits of financial education and information programs to increase this financial knowledge (Campbell, Reference Campbell2006). Others, however, cast serious doubts about the potential of education to overcome the problems of financial illiteracy. According to Willis (Reference Willis2011), effective financial education is extremely costly given the low base level of financial knowledge in the general population, the complexity of financial products (such as pensions), and the heterogeneous nature of consumer preferences and needs. Debets et al. (Reference Debets, Prast, Rossi and van Soest2020) estimate the causal link between receiving an annual pension statement on paper, self-assessed pension literacy and active pension decision making using longitudinal data from the Netherlands. Although, pension knowledge has a positive effect on active pension decision making, the effects of the annual pension statement on knowledge seem less robust. Mastrobuoni (Reference Mastrobuoni2011) analyses the causal effects of sending out an annual Social Security Statement in the US and finds a substantial increase in workers ability to estimate their future retirement benefits, although the author found no effect on retirement or savings behavior. Lusardi et al. (Reference Lusardi, Samek, Kapteyn and Glinert2017) study the effect of online educational programs on financial literacy. Specifically, the authors expose participants to a brochure, a visual interactive tool, a written narrative, and a video narrative. Although, all four interventions improve self-efficacy, only the video treatment is effective in improving both confidence and knowledge. These results are in line with Heinberg et al. (Reference Heinberg, Hung, Kapteyn, Lusardi, Samek and Yoong2014), which also provides evidence on the positive impact of short videos and narratives on financial literacy, effects that persisted for at least 8 months after the interventions. Finseraas and Jakobsson (Reference Finseraas and Jakobsson2014) estimate the causal effect on pension knowledge and plans by randomizing exposure to information brochures on a recent change in the Norwegian pension system. The brochure enhances pension knowledge, especially so for higher educated individuals, although there was no impact on retirement behavior. In a subsequent study on the same policy reform, Finseraas et al. (Reference Finseraas, Jakobsson and Svensson2017) show that their earlier reported effects are short lived: after only four months, the effect of information provision on pension knowledge disappeared.
Although, some studies indicate that educational efforts at improving financial literacy may be fruitful, others are less positive. Moreover, unlike the Finseraas and Jakobsson studies, most other studies suffer from endogeneity issues that makes causality hard to establish. Lusardi and Mitchell (Reference Lusardi and Mitchell2014) therefore plea for additional experimental work.
The objective of this paper therefore is to study the effectiveness of an online interactive pension dashboard. In general, based on the literature surveyed above, we expect a positive impact of the dashboard on a participant's ability to make adequate pension decisions. Specifically, we expect that exposure to the dashboard:
– Makes plan participants feel more prepared for their pension;
– Increases the pension knowledge of plan participants;
– Increases self-efficacy in the domain of pensions;
– Reduces the errors people make in their pension expectations;
– Increases the intention to act, conditional on the need to do so.
To investigate the impact of a pension dashboard, we set up a randomized encouragement design in cooperation with two Dutch pension funds that jointly service 14,521 active pension plan participants aged 45 and above in the Netherlands. The two funds serve participants with typically lower incomes and lower pension fund entitlements. We sent 60% of these participants a mail with an explicit invitation to visit the dashboard, while the other 40% received a mail with some general information on pensions. Subsequently, we invited all pension plan participants to participate in a survey to assess the effect of dashboard exposure. To our knowledge, only few similar tools have been rigorously tested for their effectiveness before (e.g. Lusardi et al., Reference Lusardi, Samek, Kapteyn and Glinert2017), while we believe to be the first to explicitly focus on widely used online pension dashboards.
Our main outcome variables relate to various aspects of adequate pension planning and are all self-reported. Specifically, we test for an impact on pension preparation (do participants read or think about pensions?), pension knowledge (what do plan participants actually know about pensions in general and their own pension fund in specific?), self-efficacy (how confident are plan participants in their pension knowledge and estimates?), the ability of individuals to forecast their pension entitlements (we calculate the forecast error based on the difference between actual pension entitlements and the expectations of participants) and their intention to act (are plan participants willing to work longer, economize on spending or save more?). In our analysis, the latter variable is conditioned on those that need to act given their higher likelihood to have inadequate resources at retirement (which we proxy by people with low pensions entitlement and wealth compared to their current income).
We are both interested in the causal effect from a policy maker (or pension fund) perspective that considers the introduction of a dashboard, as well as (given the substantial non-compliance we discuss later on) the impact of actually visiting the dashboard. Therefore, we report both the intention-to-treat (ITT) and local average treatment effect (LATE) in our analyses.
We find a causal effect of the dashboard, but only in some domains. Whereas pension knowledge (both general knowledge and knowledge on the specific pension fund arrangements) and pension self-efficacy raises significantly, we find no effects on pension preparation and pension expectation errors. Specifically, pension knowledge increases by 8.2% and self-efficacy by 2.2% on average. We do not find a significant increase in the willingness to act for those who need to do so. We also observe some interesting heterogeneous treatment effects. The intervention raises self-efficacy mostly for females and affects individuals that experienced a pension affecting life-event recently in different ways. Specifically, females exhibit a 7.7% increase in self-efficacy and participants who recently experienced a life event (such as a divorce or job loss) make 33% larger errors in their pension expectations. Although we must be careful not to overstate the impact of the dashboard, it seems to work mostly in the right direction.
We contribute to the literature in various ways. First, and most importantly, this paper is one of the first to study the causal effect of an existing online pension dashboard. Second, we combine survey data with administrative data from two pension funds, which enables us to compare expectations with actual accumulated pension wealth, to estimate expectation errors. Third, given the richness of our dataset we can pinpoint specific groups that may respond differently to our treatment. From a policy perspective, one may hope that those at risk (like low educated or females), and people with a high sense of immediacy (driven by being close to retirement or having experienced a pension affecting life event recently), are more responsive to our treatment.
We structure the remainder of the paper as follows. We introduce the institutional context of our experiment in section 2, and the specifics of the pension dashboard in section 3. We present our dataset and experimental design in section 4, and our identification strategy in section 5. We discuss our results in section 6, while we conclude in section 7.
2. The Dutch pension system
According to the annual survey of global pensions systems by Mercer (2022), the Dutch pension system belongs to the best pension systems in the world. According to them, the Dutch pension system provides ‘A first class and robust retirement income system that delivers good benefits, is sustainable and has a high level of integrity’. Many other countries however, have much less adequate retirement arrangements which makes their citizens more vulnerable to low retirement savings. The Mercer report highlights that apart from the Netherlands, also Iceland and Denmark provide highly reputed systems. The other 41 countries in their analysis all face significant challenges. The UK and Germany for example have ‘some areas for improvement’, the US and France face ‘major risks’, while various countries in South East Asia offer systems with ‘mayor weaknesses and/or omission that need to be addressed’. Many people around the globe thus face substantial risk of inadequate savings for their retirement.
As advocated by institutions such as the World Bank and the UN, and common in many other countries, the Netherlands has a multi-pillar system. The first pillar of the Dutch system is the pay-as-you-go state financed pension for everyone who lived in the Netherlands during his or her working liveFootnote 1. The age at which this pension starts has steadily increased over the last few years from 65 in 2013 to 66 years and 10 months in 2023. In 2024, the Dutch retirement age will be 67, after which it will increase with average life expectancy. Specifically, every 4.5 month increase in average life expectancy, increases pension age by 3 months. The Dutch Government recently announced that pension age will again increase by 3 months in 2028 as a result. This state pension aims for an income that equals 100% of the Dutch minimum wage.
The occupational pension schemes form the second pillar of the Dutch pension system. There are both industry-wide and individual company level schemes. Participation in these schemes is mandatory. As a result, a large majority of Dutch employees participates in occupational pension schemes. Only for a few industries and companies, such schemes do not exist. As a result of an ongoing consolidation trend, the number of pension funds decreased in the last 20 year from 1,060 in 1997 to 182 in 2023 (AON, 2023). Collectively these funds hold assets of over €1,511 billion in 2022, which equals almost 200% of GDP. The government worker pension fund (ABP) is the largest fund with over €460 billion in assets. Pensions paid out of the second pillar aim for a retirement income that equals 70% of the gross career-average wage. Because of a special tax treatment, this approximates 100% of the net career-average wage. Unlike for example the US, most of the Dutch pensions (94%) are currently defined benefit. Their asset allocation is conservative: approximately 50% of assets in invested in fixed income securities (European Commission, 2017). Because of low interest rates and higher live expectancies, the solvency of pension funds had come under increasing scrutiny for quite some years. Recently however, after many years in which the Dutch Central Bank as the pension fund supervisor forced many pension funds to quit the indexation of their benefits (or even lower them in nominal terms), the solvency of pension funds has improved substantially allowing again for indexation.
The third pillar consists of individual pension products like life annuities and individual retirement accountsFootnote 2. Often these products receive a special tax treatment. This third pillar is especially used by the increasing number of self-employed that are no part of the occupational pension schemes. In 2022, the Netherlands had 1.2 million self-employed people in a workforce that totaled almost 10 million (CBS, 2022). The AFM (the Dutch financial markets authority) reports however that not many people make use of these fiscal friendly arrangements. Only 5% of workers and 11% of self-employed contribute money to a third pillar financial product while also average amounts can be considered low: 90% of the contributions are below €2,500 per year (AFM, 2020).
We may also add other private savings (e.g., by means of building up equity in one's house, or by saving money on a standard savings account) to measure available wealth after retirement. Especially adding equity that is build up in one's house contributes significantly to household wealth. In 2020, 60% of all Dutch households owned their own home with an average gross worth of almost €300,000 and an average mortgage of €160,000. This surplus value represents almost 60% of non-pension wealth. Especially for those in their retirement age private savings contribute significantly to wealth: of the Dutch households where the main breadwinner is the 65 years and older 41% have a net wealth of between €100,000 and €500,000, while 15% owns more than €500,000. Still, a considerable group has low or even negative wealth (CBS, 2022).
Recently the fiduciary duties for pension providers have increased. Under the Dutch Pensions Act, pension administrators must make sure to provide correct and clear information, among other by means of a standardized annual pension statement (‘Uniform Pensioenoverzicht’, UPO) that is send to all pension participants once a year. This is in line with the EU Directive 2016/2341, which requires occupational retirement institutions to provide their participants with a Pension Benefit Statement that contains key information about the pension scheme. Pension providers are experimenting with various other ways to meet their fiduciary duty to inform their participants well. They do so, for example, by offering an online pension dashboard that allows participates to gain more insight in their retirement finances.
3. The pension dashboard
The subject of this study is a pension dashboard that is embedded in the websites of the two participating pension funds. These websites have general information on the pension fund, including a document describing the formal pension arrangements, documents aimed at the retirees explaining the most important aspects of the pension arrangements in simple terms, and a description of the institutional setting of the pension fund, its governance, and its financial situation. The dashboard opens with just a simple click. The dashboard is freely accessible for all pension fund participants and is interactive and personalized after login.
The online pension dashboard provides users with detailed and personalized information about their individual pension. The dashboard is equipped with tools to provide participants with insights on the level of their entitlements and their future pension needs. It allows participants to calculate entitlements (from both the state pension and the pension fund) under different scenarios and life events, such as becoming incapacitated or divorced. Participants can also observe consequences of various choices that the pension fund offers. For example, one may opt for early or later retirement, exchange partner pension for retirement pension, receive a part-time pension, or adjust the level of entitlement over time, and see how that affects pension entitlements.
In addition, the dashboard shows the surplus or deficit relative to expected spending needs based on basic characteristics such as owning a home, having a mortgage, having children, owning a car and travel preferences. Participants can easily adapt their expected expenses after retirement and ‘try’ various choices to observe its consequences on income and spending. To provide a general idea, we present a screen shot of one of the pages within the dashboard in Appendix C.
4. Data and experimental design
We collaborate with two medium sized industry pension funds in the Netherlands. Because of a confidentially agreement, we cannot disclose the names of the two pension funds, but they are representative for a typical Dutch industry pension fund, that has between 50,000 and 150,000 participants (these can be an active, deferred, or retired), and assets of between €2 and €4 billion. Our sample consists of all 14,531 active participants aged between 45 and 66 of both pension funds. All participants have in principle access to the dashboard, and nobody can be refused access.
We randomly assigned 60% of the participants (8,686 workers) to a treatment arm, and 40% (5,835 workers) to a control arm. Due to concerns about non-compliance, we oversampled the treatment arm. The treatment group was actively stimulated to visit the dashboard by sending them an email that embeds a link to the dashboard. For 74% of the participants, no email address was available to us. Then, we send out a letter by postal mail. Both the encouragement emails and letters were sent out during the third week of January 2017.
Six weeks later, we invited all (both encouraged and non-encouraged) pension plan participants to participate in an online survey. Two weeks later, we send a reminder to those who did not respond to the first survey invitation. Apart from the data that the survey generated, the pension funds provided us with various demographics (gender, age, income, and marital status), the expected retirement date and the amount of pension entitlement of each active pension fund participant. The pension fund also informed us about dashboard visits of all participants (encouraged and not encouraged).
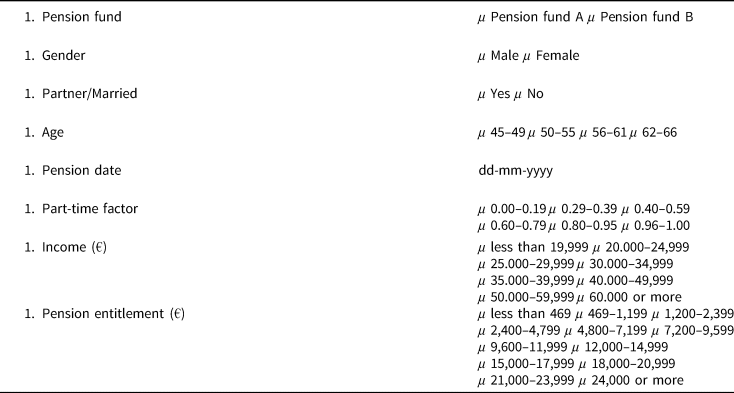
Columns 1 to 4 of Table 1 present summary statistics on the full sample of 14,521 pension plan participants and provide so-called balancing tests, which indicate whether the randomization was successful. We retrieved these background variables from the administrative records kept by the two pension funds. We received most variables as an ordinal scale because of the stringent Dutch privacy rules. Please refer to appendix A for an overview of these background variables.
Descriptive statistics [Full sample of pension fund participants]
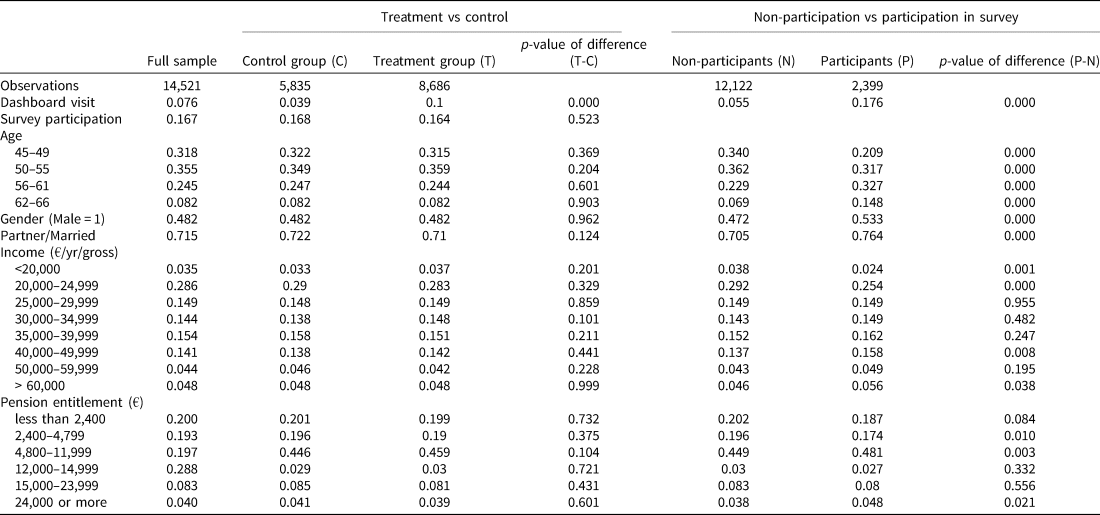
Notes: This table presents descriptives of all active pension plan participants aged 45–66 of which 60% received an encouragement to visit the pension dashboard (‘Treatment group’) while the rest did not receive such an encouragement (‘Control group’). All plan participants received an invitation to participate in a survey six weeks after the encouragement.
Dashboard visit indicates whether somebody has visited the dashboard in the two months after the encouragement was send out. On average 7.5% (1,096 of the 14,521) of our participants visited the dashboard. Dashboard visits are significantly higher for the treatment group compared to the control group (10% versus 3.6%), which indicates that our encouragement indeed increased visits to the dashboard. Specifically, of the 1,096 dashboard visitors, 80% were in the group that received an encouragement to do so, and 20% visited the dashboard without the encouragement. This higher proportion of dashboard visit of our treatment group is a prerequisite for our ‘encouragement’ design to be successful.
Survey participation provides the percentage of the population having filled in the survey. In total 2,399 people (16.7%) participated in the survey. This rate is similar for both the treatment and control group. Age is the distribution over four age groups that range from 45 to 66 years. Most pension fund participants (67%) are aged below 55 and are thus at least 12 years before retirement. Gender provides the percentage of males (48%) in the population. This (minor) overrepresentation of females is in line with the two sectors in which our pension funds operate, that harbor many female employees. Partner/Married is the percentage of the population that is married or has a formal living-together arrangement (72%). The annual gross wage distribution exhibits relatively low wages: a large proportion (62%) earns less than the median Dutch income (€36,500 in 2017). The pension entitlements are consistent with this observation, quite a large proportion has only a low entitlement. Most importantly, the absence of any significant difference between our treatment and control group (see column 4) indicated that our randomization strategy worked. Except for the percentage of participants visiting the dashboard, the control and the treatment group are largely the same without any statistically significant differences.
In the last three columns of Table 1 (Columns 5 to 7) we split our full sample of 14,521 pension plan participants into the 2,399 survey participants and the remaining 12,122 survey non-respondents. We note some significant differences between those who participated in our survey, and those that did not. Specifically, older, married males with higher incomes and pension entitlements are more likely to participate in the survey. A probit analysis (please refer to appendix D) confirms these findings. These observations require us to apply inverse survey probability weighting in our estimations, which we discuss in more detail in section 5.
In Table 2 presents descriptive statistics for the control and the treatment sample. Note that these samples will be used in all our subsequent estimations. Of the 2,399 survey participants, 978 (41%) are in the control group, while 1,421 (59%) are in the treatment group, almost exactly in line with the oversampling of the treatment arm discussed earlier.
Descriptive statistics [Sample of survey participants]
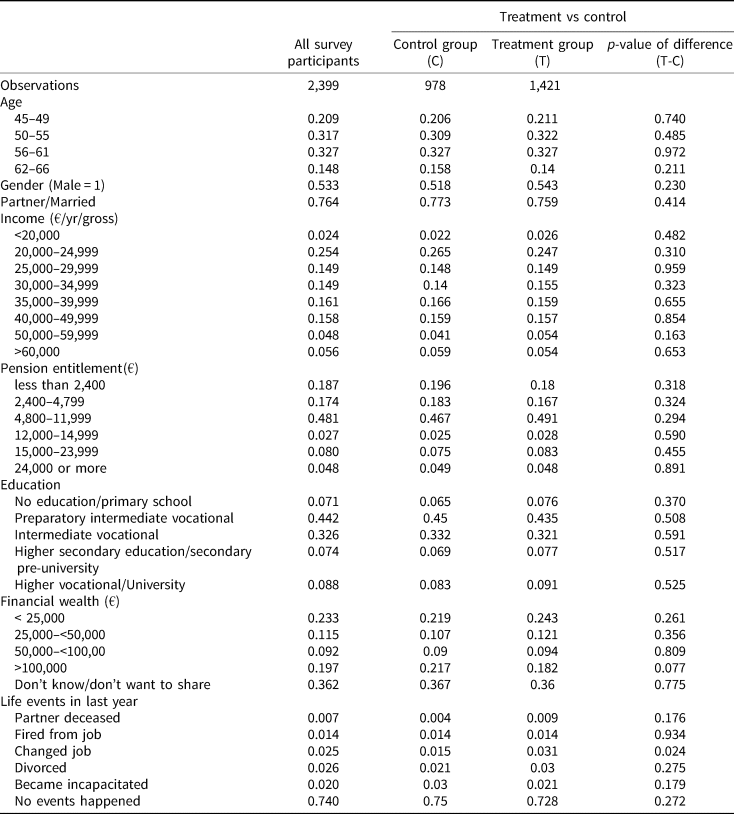
Notes: This table presents descriptives of all active pension plan participants that responded to our survey split in those that received an encouragement to visit the pension dashboard (‘Treatment group’) while the rest did not receive such an encouragement (‘Control group’). .
The survey provides additional information on education, wealth, and recent life-events. There is a modest underrepresentation of females as 47% of the survey respondents is female versus 52% of the plan participants. Also, we observe a relatively large proportion (51%) of lower educated in our survey sample, while less than 9% is highly educated (compared to more than 14% for the entire Dutch work force). These figures are consistent with pension funds operating in an industry with mostly lower educated jobs. Financial wealth refers to wealth in the form of savings, investments, and housing wealth. A considerable group (20%) owns more than €100,000, although the largest group (36%) refuses to provide an answer to this question or does not know. Recent life events that affect pensions are relatively rare; for most survey participants, no such event happened recently.
Most importantly, we observe hardly any significant difference between treated and non-treated respondents in any of the variables retrieved from the survey and the pension fund. So, although the survey participants differ from the average population of the pension plan participants, we do not need to worry about another bias within the survey sample.
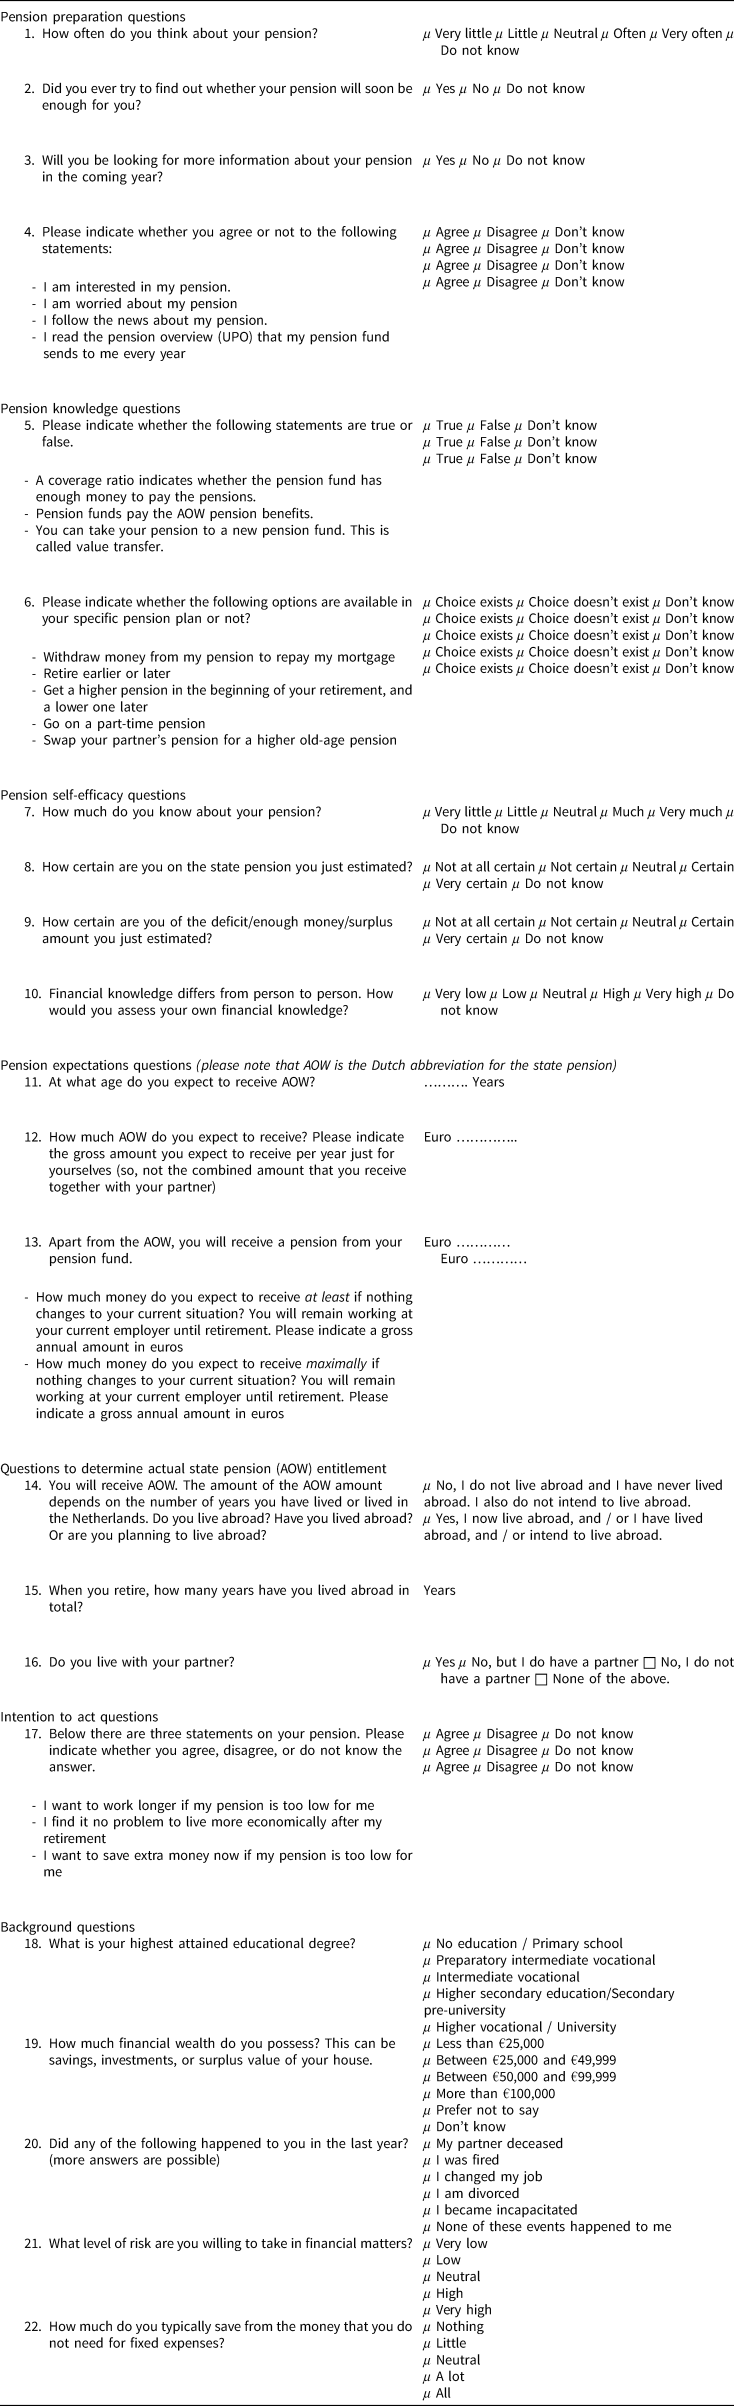
We are interested in the causal relationship between the encouragement to visit the dashboard and the process of retirement planning (from pension preparation to the intention to act). We measure five aspects of this process: preparing for pension, becoming knowledgeable about pensions, feeling capable to make decisions (pension self-efficacy), forming of pension expectations, and intending to act conditional on the need to do so. To test the effect of the dashboard on these five themes we designed survey questions covering these topics that constitute our main dependent variables. Most of these questions are retrieved from various similar survey-based studies in the pension domain (e.g., Chan and Stevens, Reference Chan and Stevens2008; Alessie et al., Reference Alessie, Van Rooij and Lusardi2011; Landerretche and Martinez, Reference Landerretche and Martínez2013; Finseraas and Jakobsson, Reference Finseraas and Jakobsson2014; De Bresser and Knoef, Reference de Bresser and Knoef2015; De Bresser and Van Soest, Reference de Bresser and van Soest2015). Specifically, we added questions in our survey on the following pension domains (between brackets we highlight the survey questions in general terms, please refer to appendix B for a detailed overview and exact wording of all underlying survey questions).
1) Pension preparedness (thinking about and checking pensions, reading pension news and the annual pension statement, being interested in and worried about pensions).
2) Pension knowledge (both general pension knowledge and specific knowledge about the individual's pension funds arrangements).
3) Self-efficacy (self-assessed knowledge and confidence in the pension domain).
4) Expectation errors (differences between pension expectations and actual entitlements, where we specifically look at: retirement age, amount of state pension and amount of second pillar pension).
5) Intention-to-act (work longer, economize on spending, save more).
We construct indices based on the individual questions relating to each of the five groups, and present estimates using these indices as dependent variables in different regressions. For pension preparedness, pension knowledge, self-efficacy, and willingness to act, the index is the average of the responses of the underlying questions. The expectation errors are based on the average of three different survey questions. The first question is about the specific pension retirement age. An error is indicated with the value one and a correct answer with the value zero. The second question is about the amount of state pension to be expected. For this question, participants are presented with intervals of the monthly amount of state pension benefits. The corresponding variable is a dummy variable equaling one for a wrong answer error and zero otherwise. The third question is about the occupational pension expectation error, which is calculated as follows. Participants are asked to provide their expected pension by providing a minimum and a maximum amount. For each participant, we check this range against the accrued benefits as identified in the administrative file of the pension fund. The dummy identifying the expectation error is set to one if the accrued benefit is outside the provided range, and otherwise to zero.
In column 1 of Table 3 we present the mean responses of all questions that constitute the dependent variables for the whole sample, and columns 3, 5, and 7 present the mean responses for the control group, the treatment group, and the difference between the control and treatment group. Column 8 presents the p values of the differences. The differences between the treatment and control group are small, and the treated group shows only a statistically significant positive effect on pension knowledge.
Univariate analysis
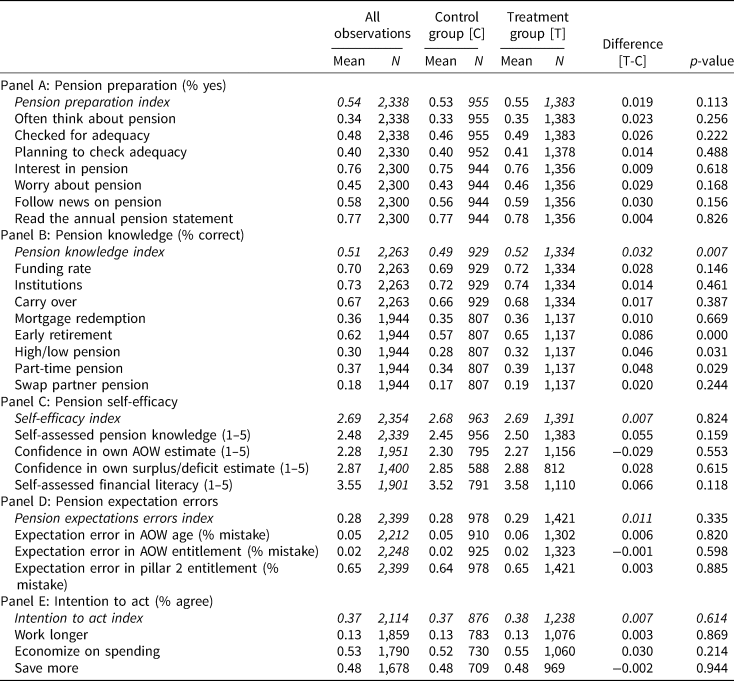
Notes: This table presents mean scores of the answers to the survey questions (listed in Appendix B) for both the Treatment and Control group that form out main dependent variables. p-values are based on a t-test.
Interesting to note (Panel A, Table 3) is that 76% of our respondents indicated to be interested in pensions and 77% reads the annual pension overview, while only 48% checked whether pension entitlements were adequate. This is in line with other studies indicating a general lack of interest in pensions (Van Rooij et al., Reference van Rooij, Lusardi and Alessie2011a, Reference Van Rooij, Lusardi and Alessie2011b). Our pension knowledge index (Panel B) indicates that on average people have 51% of the true/false questions correct. Self-efficacy (that is self-assessed knowledge and confidence in own estimates, see Panel C) is relative low, with a score of 2.69 on a 5-point scale. In panel D we present pension expectation errors, were we compare actual entitlements with expectations. Few people make estimation errors with respect to the state pension age and benefit. This is probably related to the relative simple structure of this pension. Most people make errors while estimating the second pillar entitlements compared to the ones that are derived from the funds sponsoring the dashboard. In general, people are a bit too pessimistic. Panel E signifies that in general (so, irrespective of the need to do so) few people are willing to work longer (13%). People rather prefer to economize on spending after retirement (53%) or to save more before retirement (48%).
5. Identification
We test the impact of the dashboard with several estimators. Specifically, we present post-treatment ITT effects as well as LATE. We start by presenting the ITT estimates, which provide the impact of being encouraged to go to the dashboard, irrespective of actual visiting of the dashboard. The ITT is the difference in means on our dependent variables between those that are encouraged (the treated group) and those that are not (the control group) and measures the causal effect of encouraging visiting the dashboard. This measure is the most relevant for policy making given that pension funds cannot force their participants to visit the dashboard, they can merely offer it, and encourage its use.
As many participants in the treatment group did not visit the dashboard (only 10% of the encouraged complied), and some participants of the control group did visit the dashboard (3.9% of the non-encouraged actually visited the dashboard), non-compliance is substantial. This makes it relevant to also consider LATE estimates, which provide estimates of actual dashboard visit for the compliers, i.e., those participants who behave in line with the random encouragement. These estimates thus provide the average causal effect of exposure to the dashboard for the treated group, and provide a policy maker with an estimate of whether pension plan participants are better equipped in the pension domain after actually visiting the dashboard.
A potential issue is that our outcome variables, and hence our dependent variables, are based on survey questions. If survey participation is non-random, our estimates will be biased. The problem we are facing is similar to non-random attrition. While survey response rates are similar for the treatment and control group (16.7% approximately), it appears that some observable participant characteristics are predictive for survey participation. Specifically, as already indicated in section 4, we find that older, higher earning males that have a formal relationship and have higher pension entitlements are more likely to participate in our survey than others. Not correcting for this non-random survey response, may lead to biased inferences. Therefore, we estimate all models with inverse-probability-of-non-survey response weights (similar to inverse-probability of attrition weights). That is, we first estimate a probit model to determine the probability of survey response for each participant (using pre-encouragement data for each participant; please refer to appendix D for the regression output of our probit model). Next, we take the inverse of the probability of survey response as weights in the ITT and LATE ‘impact’ regressions. This approach ensures that higher weights will be given to survey respondents with a low probability of survey response to compensate for the underrepresentation of participants with similar characteristics as those who have dropped out (that is did not respond the survey). Results without inverse probability weighting can be found in appendix E. This extra analysis shows that effects without probability weighting become somewhat stronger and more significant.
6. Results
6.1 Intention-to-treat effects
First, we use post-treatment ITT estimators. This analysis simply regresses our outcomes (indices) Y i on the treatment dummy and controls:

where Y i refers to the score on Index Y for an individual i, T i is a dummy equal to one if the participant is encouraged to go to the dashboard and zero otherwise, ${\bf X}_{i0}$ is a vector of controls (specifically: pension fund, gender, years to pension, part-time factor, having a formal relationship, income, pension entitlement, education, wealth, propensity to save, and risk attitude), and $\varepsilon _{\rm i}$
 is an error term. The coefficient of interest is β 1, which is an estimate of the effect of being encouraged to go to the dashboard. Note that, as explained above, we weight all observations with the inverse probability of survey response.
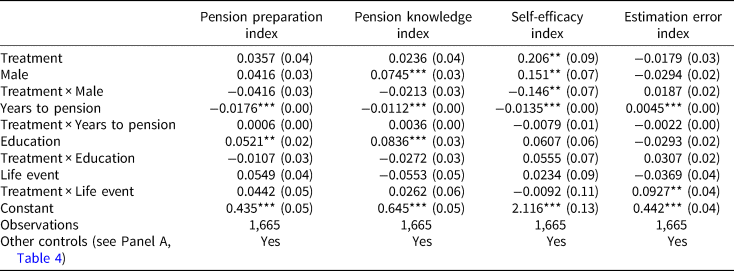
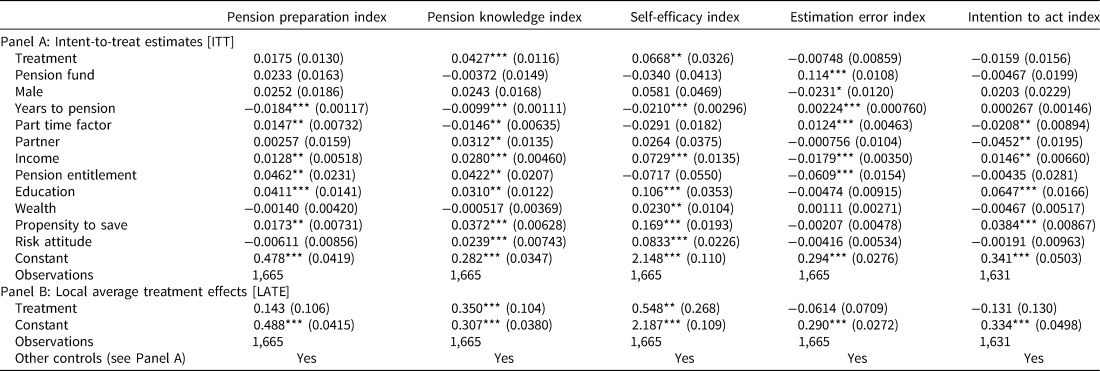
Table 4 (Panel A) presents the ITT effects of our treatment on four of our five pension indices (we analyze the ‘intention to act’ variables in section 6.3) while controlling for various relevant demographics, preferences, and pension attributes. The key variable is treatment that equals 1 if people received the encouragement to visit the dashboard, and zero otherwise. The dashboard has a positive causal effect on two of the four indices. Especially the impact on pension knowledge is highly significant, while the impact on self-efficacy is marginally significant. Pension knowledge raises with 4.2 percentage points, which implies a substantial impact of 8.2% compared to the unconditional average of 51% correct answers, and is similar in size to Finseraas and Jakobsson (Reference Finseraas and Jakobsson2014). The coefficient of the treatment on self-efficacy (0.059) implies a raise of approximately 2.2% compared to the unconditional average. Although the signs of the coefficients of treatment on pension preparation point at a positive impact of the dashboard and a negative impact on the estimation errors, these results are not statistically significant.
ITT and LATE estimates with control variables
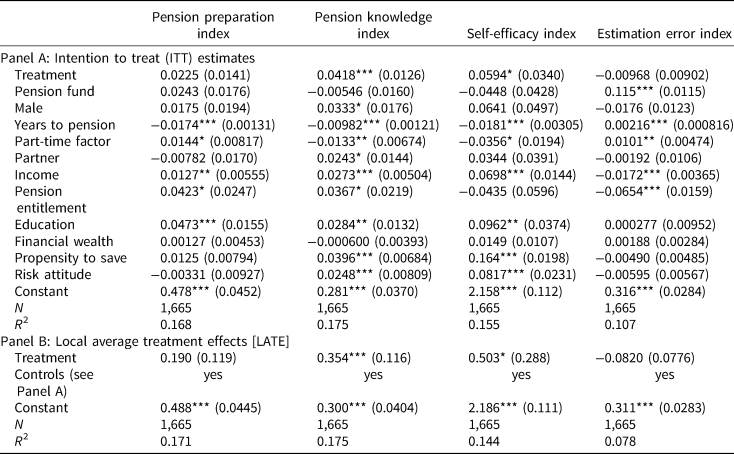
Notes: Robust standard errors in parentheses. * p < 0.05,**p < 0.01,***p < 0.001. Panel A presents intent to treat [ITT] effects and Panel B local average treatment effects [LATE] of the pension dashboard on four pension indices. The sample is inversely weighted based on survey participation probability.
Also, our control variables highlight some interesting patterns. First, males have more pension knowledge than females: the percentage of correct answers for males is 3.3 percentage points higher than for women. This finding is consistent with the literature on financial literacy that provides robust evidence of higher literacy among males (Van Rooij et al., Reference van Rooij, Lusardi and Alessie2011a, Reference Van Rooij, Lusardi and Alessie2011b). A variable that affects all our outcome variables is years to-pension. The longer people are away from their retirement date, the less they are prepared, the lower their pension knowledge and self-efficacy, and the more errors they make in their estimates, which intuitively makes sense. Finally, our proxies for sophistication have effects in the expected direction. Higher income is associated with more preparation, more knowledge, higher self-efficacy and lower expectations errors. In addition, a higher formal education relates to more pension preparation, more knowledge, and higher self-efficacy, which is in line with previous findings (Lusardi and Mitchell, 2011).
6.2 LATE estimates
Next, in Panel B of Table 4, we present LATE estimates to gauge the impact of actual dashboard visits of the compliers, that is participants who behaved in line with the randomization. We adopt an instrumental variable (IV) approach, using assignment to treatment (T) as an instrument for actual visits to the dashboard:

where Z i is the actual visit to the dashboard by a participant; $\hat{{\rm Z}}_i$ is the predicted visit. The coefficient of interest is β 1, estimating the effect of complying participants visiting the dashboard. We again use the inverse probability of survey response as a weighting scheme.
As expected, given the high fraction of non-compliers in our experiment, the coefficients of the treatment are much higher than our ITT estimates, while significance remains virtually unaffected. Visiting the dashboard has a large effect on pension knowledge: the treatment increases the percentage of correct answers on the pension knowledge questions of the compliers in the treatment group with 35 percentage points. In addition, the treatment also raises Self-efficacy by 0.503 which signals a considerable improvement compared to the unconditional average of 2.7. Again, in the other two domains, no significant effect of dashboard visit can be detected.
6.3 Intention to act
We asked our survey participants three questions that measure their willingness to act when confronted with too low pension entitlements. Specifically, we asked whether participants would be willing to work longer, live more economically after retirement, or to save more money now.
People are typically reluctant to lower their life style during their retirement (Wang et al., Reference Wang, Henkens and Van Solinge2011). Binswanger and Schunk (Reference Binswanger and Schunk2012) find that most people indicate an adequate level of retirement spending that is at least 80% of working life spending. Consequently, the willingness to act becomes more imminent if participants observe a lower pension entitlement compared to current income in the dashboard. If, however the ex-ante pension expectations are in line with what was learnt from interacting with the dashboard, we would expect no impact on the willingness to act. In addition, participants may take additional sources of wealth, such as private savings and residential housing into consideration.
We therefore created two subsamples within our sample of survey participants to allow us to condition on the need to act. One group (which we label ‘at risk’), consists of participants that have low pension entitlements in comparison to their current income, combined with low private savings and are relatively close to their retirement, while we add the remaining survey participants to the ‘not at risk’ group. We added the age criterium, because people far away from retirement are unlikely to see the need to act now. We define the ‘at risk’ group as at those respondents that have a pension entitlement (based on both 1st and 2nd pillarFootnote 3 entitlements) that is below 80% of current income, combined with private savings of less than €100,000, and are aged above 55 years. Unfortunately, we do not have additional information on other sources of private wealth, such has house ownership.
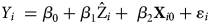
For both groups, we estimate ITT and LATE of our treatment dummy on both the willingness to act index and the 3 willingness to act variables separately. In Table 5 we present the results. The treatment dummy is insignificant for all models. Even at risk participants are not triggered by the dashboard to act. However, the coefficients for the control variables indicate some interesting results that may be relevant indirectly. Males in the at risk group are more willing to work longer and economize on spending. In addition, participants with a higher propensity to save will also more likely economize on spending and save more. In the at risk group, people who like to save are less willing to work longer. This implies that there is awareness of the trade-off between working longer and saving.
Intention to act ITT and LATE estimates with control variables
Notes: Standard errors based on robust standard errors in parentheses. * p < 0.05,**p < 0.01,***p < 0.001. This table presents intent to treat [ITT] and local average treatment effects [LATE] of the pension dashboard on three intention to act variables. The sample is split in ‘at risk’ and ‘not at risk’ where the ‘at risk’ group is defined as respondents that have a pension entitlement (based on both 1st and 2nd pillar entitlements) that is below 80% of current income, combined with a private savings of less than €100,000, and are aged above 55 years, while all others are placed in the ‘not at risk’ group. The sample is inversely weighted based on survey participation probability.
6.4 Heterogeneous treatment effects
We also examine whether our treatment has different effects for specific groups. From a policy perspective, we are interested in those participants who are potentially most vulnerable to errors in their pension decision-making. Research has shown that females and lower educated are more prone to make mistakes in their financial decision making and are less confident (Bucher-Koenen and Lusardi, Reference Bucher-Koenen and Lusardi2011; Bucher-Koenen et al., Reference Bucher-Koenen, Alessie, Lusardi and Van Rooij2021). Other research highlights that, although people show a general disinterest in retirement planning, the motivation to do so increases with a sense of immediacy (Alessie et al., Reference Alessie, Van Rooij and Lusardi2011). Therefore, we take a specific look at female and lower-educated participants and to those who have a sense of immediacy (proxied by being close to retirement or having recently experienced a life event that may impact pension entitlements).
We expect that females may benefit more from the dashboard compared to males. Females have been found to exhibit lower level of financial literacy and financial confidence (Lusardi and Mitchell, Reference Lusardi and Mitchell2008; Bucher-Koenen et al., Reference Bucher-Koenen, Alessie, Lusardi and Van Rooij2021) and are more inclined to ask for support in financial matters (Hackethal et al., Reference Hackethal, Haliassos and Jappelli2012). Females may therefore also be more willing to visit the dashboard and to be open to learn from it.
The interaction of our treatment with years to pension may go two ways. Although, being closer to retirement age provides a stronger incentive to become well informed, older people may already be better informed in the first place, and hence gain less from interacting with the dashboard (Table 6).
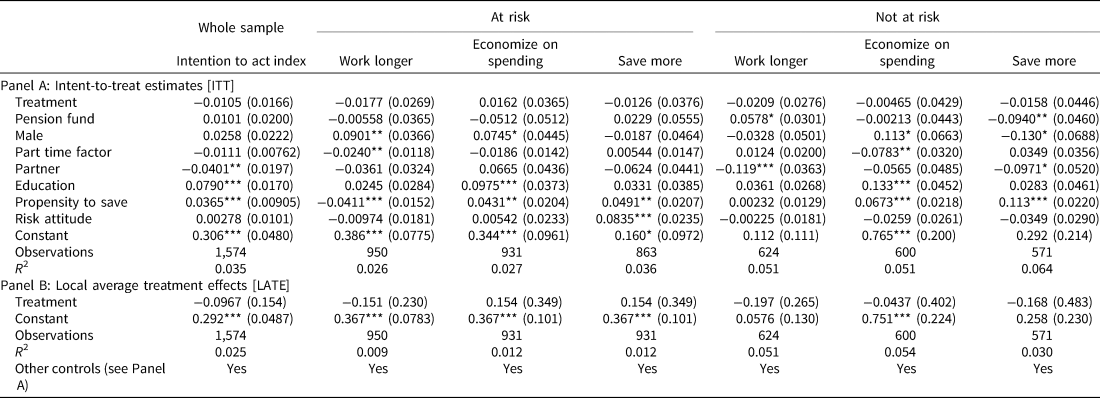
Heterogeneous treatment effects
Notes: Standard errors based on robust standard errors in parentheses. * p < 0.05,**p < 0.01,***p < 0.001. This table presents interaction effects of our treatment dummy with gender, education, years to pension, and having experienced a life event in the last year on our four pension indices, The sample is inversely weighted based on survey participation probability.
We expect that higher educated gain more from our intervention. Lower educated have less incentives to become well informed on their pension given a lower life expectancy. In addition, they face larger cognitive constraints, which limits their ability to learn.
A recent life event that may affect pension entitlements and provides an incentive to become better informed. People that recently changed jobs within their industry, got fired, got divorced, had their partner passed away, or became incapacitated may therefore benefit more from the dashboard.
Our findings support some, but not all, of the expected interaction effects. The interaction of our treatment with gender on self-efficacy implies that untreated males have an additional score of self-efficacy equal to 0.151 relative to untreated females (to put this in perspective: self-efficacy was measured on a 5 point scale, with an unconditional average score of 2.7). The treatment increases the self-efficacy for men with 0.206–0.146 = 0.06, while the self-efficacy for women increases with 0.206. Women's self-efficacy thus benefits more from visiting the dashboard, resulting in more or less the same aggregate score. This is a promising result. Farrell et al. (Reference Farrell, Fry and Risse2016) finds that higher financial self-efficacy for females is associated with better financial and more forward-looking behaviors.
Also, the interaction of life event (such as a divorce or job loss) with our treatment dummy on expectation errors is positive and highly significant. This implies that the dashboard increases the disparity between pension expectation and actual entitlements for people that recently experienced a pension affecting life event, which is contrary to our expectations. Specifically, participants who recently experienced a life event make 9.3 percentage point larger errors in their pension expectation compared to the unconditional average of 28%. It may be driven by increased confusion resulting from such an event, for which the dashboard apparently does not help much.
6. Conclusions
We study the causal effect of an online interactive pension dashboard by means of an encouragement design. We expect that exposure to the dashboard increases the ability of people to make adequate pension decisions in terms of preparation, knowledge, self-efficacy, errors in expectations, and intention to act.
First, we find that most plan participants do not visit the dashboard. Even among those that are actively encouraged, only 10% actually interacts with the dashboard. Whether or not this percentage is high or low is outside the scope of this study, but from a policy perspective, it is worrying that 90% of the participants do not care to take a look at the dashboard.
Second, we find that the dashboard is effective in increasing pension self-efficacy and pension knowledge. Self-efficacy increases by 2.2% and pension knowledge by 8.2%. We do not find positive effects on retirement preparation, errors in the expected pension levels, and intention to act. We also estimate heterogeneous treatment effects and find that the positive effect of the dashboard on self-efficacy is mostly driven by females. Many consider a lack of self-efficacy problematic especially so for more financially vulnerable groups such as females. Females are typically equipped with fewer available resources and higher life expectancies, which poses a threat to females' financial security after retirement. Self-confidence is an important element of financial literacy and has been linked to deciding on a course of action. Parker et al. (Reference Parker, De Bruin, Yoong and Willis2012) found that confidence in knowledge predicts self-reported retirement planning. Pension affecting live events may make pension participants more confused, which may drive the larger expectation errors after visiting the dashboard.
Related studies indicate a lack persistence over time. Finseraas et al. (Reference Finseraas, Jakobsson and Svensson2017) report that the initial effects on knowledge of an information campaign disappeared after 16 weeks. Although, we cannot be sure on the long-term effects of our intervention, we believe our study suffers less from capturing only short-term effects, given that we collected respondents 6 to 11 weeks after the encouragement.
The ITT effects point in the right direction, although the impact is small due to low compliance and is observed only in some pension domains. Our LATE estimates indicate large effects. So, if people visit the dashboard, their pension knowledge and pension self-efficacy raises substantially, which seems a promising result. All in all, we conclude that online pension dashboards provide some added value in the toolbox of pension policy makers: they are mildly effective, and once developed, the marginal costs of adding more dashboards in other pension plans are low.
These are important findings for policy makers in the pension domain. Pension funds that consider offering an online dashboard to educate and inform their plan participants may expect some improvement in pension knowledge and self-efficacy, which aids them in complying to their duty of care at low cost. Given the difficulty in getting participants to actually engage with the dashboard, it can only be one element in the toolkit of pension funds to inform, educate, and getting people engaged with their pension. Some venues of future research should focus on ways to improve dashboard visit, for instance by linking the dashboard in a very accessible way to another online tool that users need to visit more frequently, for instance the online system to report absence, work leaves, or any other corporate portal.
Despite becoming more knowledgeable about pensions, the dashboard does not improve the ability of participants to forecast their own entitlements, the reason that the dashboard was created in the first place. This can be interpreted as evidence that the pension entitlements are more complicated financial products relative to for instance state pensions, by providing for instance options for different retirement ages, options to swap pensions with a partner and/or options to provide additional savings. While these options are valuable from the perspective of personal financial planning, it may complicate assessments and decision making by participants. The larger expectation errors for those that recently experienced negative a life-event may be an indication of this. Although our research design was not targeted at this issue specifically, this poses a challenge for designing good pension dashboards if the increased self-efficacy leads to overconfidence.
Another finding is that participants really dislike the idea of having to work longer. Most prefer a strategy of saving more and/or economize on spending. However, saving more is an expensive strategy in terms of the time and amount of savings it takes to accrue pension benefits. Economize on spending may be the only option left, but possibly a very painful option in a high-inflation environment. From a policy perspective, it is desirable to give participants clues about what it means in practice to count on working longer, save more and/or economize on spending.
Appendix
Appendix A: Background variables (available for all 14,542 workers)
Appendix B: Survey questions
The survey was presented to the participants in Dutch. This is a translation of the original survey questions.
Appendix C. A screenshot of the dashboard

Appendix D. Probit estimate of survey participation

Appendix E: ITT and LATE estimates without inverse weighed probability weighting


 Open access