1. Introduction
Neutral atomic hydrogen (H i) plays an integral role in galaxy evolution as it provides the raw material for future star formation via conversion to molecular hydrogen (H $_2$
). The conversion from atomic to molecular gas occurs once the atomic phase reaches sufficiently high densities (
$_2$
). The conversion from atomic to molecular gas occurs once the atomic phase reaches sufficiently high densities ( $\sim$ $10\,\mathrm{M}_{\odot}\,\mathrm{pc}^{-2}$
, e.g. Martin & Kennicutt Reference Martin and Kennicutt2001; Bigiel et al. Reference Bigiel2008; Leroy et al. Reference Leroy2008; Bigiel et al. Reference Bigiel2010), hence how the H i is distributed throughout a galaxy will affect its ability to form H
$10\,\mathrm{M}_{\odot}\,\mathrm{pc}^{-2}$
, e.g. Martin & Kennicutt Reference Martin and Kennicutt2001; Bigiel et al. Reference Bigiel2008; Leroy et al. Reference Leroy2008; Bigiel et al. Reference Bigiel2010), hence how the H i is distributed throughout a galaxy will affect its ability to form H $_2$
and ultimately stars (e.g. there is little star formation observed beyond the optical disc where H i tends to be at low densities,
$_2$
and ultimately stars (e.g. there is little star formation observed beyond the optical disc where H i tends to be at low densities, $\lesssim$ $2\,\mathrm{M}_{\odot}\,\mathrm{pc}^{-2}$
, e.g. Bigiel et al. Reference Bigiel2010; Wang et al. Reference Wang2014). This highlights the importance of understanding the interplay between the distribution of H i in galaxies and other galaxy quantities (e.g. stellar structure and star formation) and in particular the H i that is co-located with regions of star formation (i.e. within the optical disc).
$2\,\mathrm{M}_{\odot}\,\mathrm{pc}^{-2}$
, e.g. Bigiel et al. Reference Bigiel2010; Wang et al. Reference Wang2014). This highlights the importance of understanding the interplay between the distribution of H i in galaxies and other galaxy quantities (e.g. stellar structure and star formation) and in particular the H i that is co-located with regions of star formation (i.e. within the optical disc).
Measuring the size of a galaxy’s stellar, star forming or H i disc is not a straightforward endeavour as there is no well defined edge to a galaxy. Deeper and more sensitive observations continue to find emission from various galaxy components at increasing radii (e.g. Meurer et al. Reference Meurer2018). As a result, astronomers have used a variety of different definitions when measuring the size of galaxies (for discussion and comparison of different size definitions see e.g. Cortese et al. Reference Cortese2012; Muñoz-Mateos et al. Reference Muñoz-Mateos2015; Sánchez Almeida Reference Sánchez Almeida2020; Trujillo, Chamba, & Knapen Reference Trujillo, Chamba and Knapen2020). Two common definitions of size used for optical images are the radius encompassing a fraction of the total light (e.g. 50% or 90%, $R_{50}$
and
$R_{50}$
and $R_{90}$
, respectively, e.g. de Vaucouleurs Reference de Vaucouleurs1948) and the radius at which the surface brightness reaches a set isophotal limit (e.g. 25 mag arcsec
$R_{90}$
, respectively, e.g. de Vaucouleurs Reference de Vaucouleurs1948) and the radius at which the surface brightness reaches a set isophotal limit (e.g. 25 mag arcsec $^{-2}$
,
$^{-2}$
, $R_{\rm{iso}}$
, e.g. Redman Reference Redman1936; Liller Reference Liller1960). Each size definition has its advantages and disadvantages. The effective (50% total light) radius is easy to measure and is less dependent on the depth of the observations (e.g. Trujillo, Graham, & Caon Reference Trujillo, Graham and Caon2001), however it is very sensitive to the brightness distribution (e.g. the presence of a bright bulge, Trujillo et al. Reference Trujillo, Chamba and Knapen2020). The isophotal radius is insensitive to the presence of a bulge and provides a better measure of the total size of a disc galaxy, but has the drawback of being limited by the observation depth (e.g. 23.5–26.5 mag arcsec
$R_{\rm{iso}}$
, e.g. Redman Reference Redman1936; Liller Reference Liller1960). Each size definition has its advantages and disadvantages. The effective (50% total light) radius is easy to measure and is less dependent on the depth of the observations (e.g. Trujillo, Graham, & Caon Reference Trujillo, Graham and Caon2001), however it is very sensitive to the brightness distribution (e.g. the presence of a bright bulge, Trujillo et al. Reference Trujillo, Chamba and Knapen2020). The isophotal radius is insensitive to the presence of a bulge and provides a better measure of the total size of a disc galaxy, but has the drawback of being limited by the observation depth (e.g. 23.5–26.5 mag arcsec $^{-2}$
, Holmberg Reference Holmberg1958; Lauberts & Valentijn Reference Lauberts and Valentijn1989; Hall et al. Reference Hall, Courteau, Dutton, McDonald and Zhu2012). Isophotal radii also produce a tighter stellar size–mass relation than effective radii and better trace the total stellar mass (e.g. Saintonge & Spekkens Reference Saintonge and Spekkens2011; Cortese et al. Reference Cortese2012; Muñoz-Mateos et al. Reference Muñoz-Mateos2015; Sánchez Almeida Reference Sánchez Almeida2020; Trujillo et al. Reference Trujillo, Chamba and Knapen2020).
$^{-2}$
, Holmberg Reference Holmberg1958; Lauberts & Valentijn Reference Lauberts and Valentijn1989; Hall et al. Reference Hall, Courteau, Dutton, McDonald and Zhu2012). Isophotal radii also produce a tighter stellar size–mass relation than effective radii and better trace the total stellar mass (e.g. Saintonge & Spekkens Reference Saintonge and Spekkens2011; Cortese et al. Reference Cortese2012; Muñoz-Mateos et al. Reference Muñoz-Mateos2015; Sánchez Almeida Reference Sánchez Almeida2020; Trujillo et al. Reference Trujillo, Chamba and Knapen2020).
Unlike optical disc radii, which are frequently defined using both isophotal and fraction of total light enclosed, H i discs are normally defined using an isodensity radius measured at $1\,\mathrm{M}_{\odot}\,\mathrm{pc}^{-2}$
(i.e. the typical H i column density sensitivity reached in observations, e.g. Wang et al. Reference Wang2016). Studies of spatially resolved H i discs find a very tight relation between a galaxy’s H i mass,
$1\,\mathrm{M}_{\odot}\,\mathrm{pc}^{-2}$
(i.e. the typical H i column density sensitivity reached in observations, e.g. Wang et al. Reference Wang2016). Studies of spatially resolved H i discs find a very tight relation between a galaxy’s H i mass, $M_{\rm{HI}}$
, and isodensity diameter,
$M_{\rm{HI}}$
, and isodensity diameter, $D_{\rm{iso,HI}}$
(e,g. Broeils & Rhee Reference Broeils and Rhee1997; Swaters et al. Reference Swaters, van Albada, van der Hulst and Sancisi2002; Wang et al. Reference Wang2016; Rajohnson et al. Reference Rajohnson2022). Using
$D_{\rm{iso,HI}}$
(e,g. Broeils & Rhee Reference Broeils and Rhee1997; Swaters et al. Reference Swaters, van Albada, van der Hulst and Sancisi2002; Wang et al. Reference Wang2016; Rajohnson et al. Reference Rajohnson2022). Using $\sim$
550 galaxies from a compilation of interferometric H i surveys, Wang et al. (Reference Wang2016) derive a best fit H i size–mass relation of
$\sim$
550 galaxies from a compilation of interferometric H i surveys, Wang et al. (Reference Wang2016) derive a best fit H i size–mass relation of
 \begin{equation} \log\!(D_{\mathrm{iso,HI}}/\mathrm{kpc}) = 0.506 \log(M_{\mathrm{HI}}/\mathrm{M}_{\odot}) - 3.293\end{equation}
with a scatter of $\sigma=0.06$
dex. This relation holds over
$\sigma=0.06$
dex. This relation holds over $\sim$
5 dex in H i mass and suggests that all galaxies (i.e. both low and high mass) have almost identical H i radial surface density profiles (e.g. Wang et al. Reference Wang2016) and that the different galaxy types have similar average H i surface densities (Broeils & Rhee Reference Broeils and Rhee1997). Stevens et al. (Reference Stevens2019) used simulated, mock H i galaxies to show that this relation is a product of the shape of H i radial surface density profiles, which tend to follow an approximately exponential shape. Stevens et al. (Reference Stevens2019) also measured the H i size–mass relation using effective radii for their mock galaxies and find that the scatter of the relation increases relative to their isodensity size–mass relation.
$\sim$
5 dex in H i mass and suggests that all galaxies (i.e. both low and high mass) have almost identical H i radial surface density profiles (e.g. Wang et al. Reference Wang2016) and that the different galaxy types have similar average H i surface densities (Broeils & Rhee Reference Broeils and Rhee1997). Stevens et al. (Reference Stevens2019) used simulated, mock H i galaxies to show that this relation is a product of the shape of H i radial surface density profiles, which tend to follow an approximately exponential shape. Stevens et al. (Reference Stevens2019) also measured the H i size–mass relation using effective radii for their mock galaxies and find that the scatter of the relation increases relative to their isodensity size–mass relation.
However, the assumed universality of H i surface density profile shapes does not hold towards the centres of the radial H i distribution. In The H i Nearby Galaxy Survey (THINGS, Walter et al. Reference Walter2008), the radial H i surface densities within the central $\sim$
6–12 kpc (
$\sim$
6–12 kpc ( $\sim$ $0.5R_{\rm{iso}}$
) vary by
$0.5R_{\rm{iso}}$
) vary by $\sim$
1–
$\sim$
1– $10\,\mathrm{M}_{\odot}\,\mathrm{pc}^{-2}$
in different galaxies (Leroy et al. Reference Leroy2008; Bigiel et al. Reference Bigiel2010). Similar variations in the central H i radial surface density profiles are also found in the Bluedisk survey (Wang et al. Reference Wang2014) and the Westerbork H i Survey of Spiral and Irregular Galaxies (WHISP, Swaters et al. Reference Swaters, van Albada, van der Hulst and Sancisi2002). Variations in the radial H i surface density profiles of galaxies are found to correlate with various galaxy quantities including galaxy morphological type (e.g. Cayatte et al. Reference Cayatte, Kotanyi, Balkowski and van Gorkom1994; Broeils & Rhee Reference Broeils and Rhee1997), H
$10\,\mathrm{M}_{\odot}\,\mathrm{pc}^{-2}$
in different galaxies (Leroy et al. Reference Leroy2008; Bigiel et al. Reference Bigiel2010). Similar variations in the central H i radial surface density profiles are also found in the Bluedisk survey (Wang et al. Reference Wang2014) and the Westerbork H i Survey of Spiral and Irregular Galaxies (WHISP, Swaters et al. Reference Swaters, van Albada, van der Hulst and Sancisi2002). Variations in the radial H i surface density profiles of galaxies are found to correlate with various galaxy quantities including galaxy morphological type (e.g. Cayatte et al. Reference Cayatte, Kotanyi, Balkowski and van Gorkom1994; Broeils & Rhee Reference Broeils and Rhee1997), H $_2$
and star formation rate surface densities (e.g. Leroy et al. Reference Leroy2008; Bigiel et al. Reference Bigiel2010), stellar mass and
$_2$
and star formation rate surface densities (e.g. Leroy et al. Reference Leroy2008; Bigiel et al. Reference Bigiel2010), stellar mass and $\mathrm{NUV}-r$
colour (e.g.Wang et al. Reference Wang2014). However, the interferometric surveys used in these studies contain only modest sample sizes (e.g. THINGS: 23, Bluedisk: 50, WHISP: 73).
$\mathrm{NUV}-r$
colour (e.g.Wang et al. Reference Wang2014). However, the interferometric surveys used in these studies contain only modest sample sizes (e.g. THINGS: 23, Bluedisk: 50, WHISP: 73).
Investigating how galaxy properties regulate the H i gas content using large galaxy samples has been limited to single-dish surveys (e.g. the Arecibo Legacy Fast ALFA survey—ALFALFA, Giovanelli et al. Reference Giovanelli2005, and the extended GALEX Arecibo SDSS Survey—xGASS, Catinella et al. Reference Catinella2018; see Saintonge & Catinella Reference Saintonge and Catinella2022 for a review). Using xGASS, Catinella et al. (Reference Catinella2018) find that the total H i gas fraction is more strongly correlated with star formation (e.g. specific star formation rate and $\mathrm{NUV}-r$
colour) than with stellar mass and stellar mass surface density. However, studying the total H i gas fraction does not provide information on where the H i gas is located (e.g. within or beyond the optical disc).
$\mathrm{NUV}-r$
colour) than with stellar mass and stellar mass surface density. However, studying the total H i gas fraction does not provide information on where the H i gas is located (e.g. within or beyond the optical disc).
Taking advantage of the tight relation between H i size and mass, Wang et al. (Reference Wang2020) developed a method of estimating the H i gas mass within the optical disc from spatially unresolved, single-dish observations. Wang et al. (Reference Wang2020) find that the scatter in the H i gas fraction scaling relations derived for H i detected disc galaxies in xGASS decreases if the total H i mass is replaced with the estimated H i mass within the optical disc. This result was also found by Naluminsa, Elson, & Jarrett (Reference Naluminsa, Elson and Jarrett2021) using a sample of 228 WHISP galaxies. Using the Wang et al. (Reference Wang2020) method, Chen,Wang, & Kong (Reference Chen, Wang and Kong2022) find a stronger correlation between the gas-phase metallicity and the H i mass within the optical disc than with the total H i mass. Pan et al. (Reference Pan, Wang, Zheng and Kong2021) also used the tightness of the H i size-mass relation to estimate H i sizes from integrated H i masses and find a weak trend of less extended H i discs relative to their optical discs in more massive galaxies.
The previous works discussed here have taken one of two avenues to investigate the spatial distribution of H i in galaxies. Many studies have looked at the spatial H i distribution in detail for small samples of galaxies with spatially resolved H i data ( $\gtrsim$
10 beams along the galaxy’s major axis, e.g. Cayatte et al. Reference Cayatte, Kotanyi, Balkowski and van Gorkom1994; Broeils & Rhee Reference Broeils and Rhee1997; Swaters et al. Reference Swaters, van Albada, van der Hulst and Sancisi2002; Noordermeer et al. Reference Noordermeer, van der Hulst, Sancisi, Swaters and van Albada2005; Leroy et al. Reference Leroy2008; Wang et al. Reference Wang2013, Reference Wang2014, Reference Wang2016, Reference Wang2017). A smaller number have taken a statistical approach and estimated simple quantities parameterising the H i distribution from large single-dish surveys (e.g. Wang et al. Reference Wang2020; Pan et al. Reference Pan, Wang, Zheng and Kong2021; Chen et al. Reference Chen, Wang and Kong2022). Recent and upcoming surveys on new radio interferometers such as the Australian Square Kilometre Array Pathfinder (ASKAP, Johnston et al. Reference Johnston2008; Hotan et al. Reference Hotan2021), the Karoo Array Telescope (MeerKAT, Jonas & MeerKAT Team Reference Jonas2016) and the APERture Tile in Focus upgrade on theWesterbork Synthesis Telescope (APERTIF, Verheijen et al. Reference Verheijen, Minchin and Momjian2008; Adams et al. Reference Adams2022) will bridge this gap and enable direct measurements quantifying the H i spatial distribution (i.e. the radial H i surface density distribution) for statistically significant samples of galaxies.
$\gtrsim$
10 beams along the galaxy’s major axis, e.g. Cayatte et al. Reference Cayatte, Kotanyi, Balkowski and van Gorkom1994; Broeils & Rhee Reference Broeils and Rhee1997; Swaters et al. Reference Swaters, van Albada, van der Hulst and Sancisi2002; Noordermeer et al. Reference Noordermeer, van der Hulst, Sancisi, Swaters and van Albada2005; Leroy et al. Reference Leroy2008; Wang et al. Reference Wang2013, Reference Wang2014, Reference Wang2016, Reference Wang2017). A smaller number have taken a statistical approach and estimated simple quantities parameterising the H i distribution from large single-dish surveys (e.g. Wang et al. Reference Wang2020; Pan et al. Reference Pan, Wang, Zheng and Kong2021; Chen et al. Reference Chen, Wang and Kong2022). Recent and upcoming surveys on new radio interferometers such as the Australian Square Kilometre Array Pathfinder (ASKAP, Johnston et al. Reference Johnston2008; Hotan et al. Reference Hotan2021), the Karoo Array Telescope (MeerKAT, Jonas & MeerKAT Team Reference Jonas2016) and the APERture Tile in Focus upgrade on theWesterbork Synthesis Telescope (APERTIF, Verheijen et al. Reference Verheijen, Minchin and Momjian2008; Adams et al. Reference Adams2022) will bridge this gap and enable direct measurements quantifying the H i spatial distribution (i.e. the radial H i surface density distribution) for statistically significant samples of galaxies.
The Widefield ASKAP L-band Legacy All-sky Blind Survey (WALLABY, Koribalski et al. Reference Koribalski2020) is one such survey providing this capability. WALLABY is currently underway on ASKAP and will detect H i emission in $\sim$ $210\,000$
galaxies and spatially resolve several thousand galaxies over
$210\,000$
galaxies and spatially resolve several thousand galaxies over $\sim$ $1.4{\unicode{x03C0}}$
sr of the southern sky out to
$1.4{\unicode{x03C0}}$
sr of the southern sky out to $z\sim0.1$
(Westmeier et al. Reference Westmeier, Deg, Spekkens, Reynolds and Shen2022). ASKAP has a 30-square-degree instantaneous field of view and, for WALLABY, provides a spatial and a spectral resolution of 30 arcsec and 4 km s
$z\sim0.1$
(Westmeier et al. Reference Westmeier, Deg, Spekkens, Reynolds and Shen2022). ASKAP has a 30-square-degree instantaneous field of view and, for WALLABY, provides a spatial and a spectral resolution of 30 arcsec and 4 km s $^{-1}$
, respectively, and can reach a nominal sensitivity of 1.6 mJy per beam per 4 km s
$^{-1}$
, respectively, and can reach a nominal sensitivity of 1.6 mJy per beam per 4 km s $^{-1}$
channel with a 16 h integration. The pilot survey phase 1 of WALLABY has observed six 30-square-degree tiles. This includes two pairs of adjacent tiles, each covering 60 square degrees, in the directions of the Hydra I cluster and the NGC 4636 galaxy group (Westmeier et al. Reference Westmeier, Deg, Spekkens, Reynolds and Shen2022).
$^{-1}$
channel with a 16 h integration. The pilot survey phase 1 of WALLABY has observed six 30-square-degree tiles. This includes two pairs of adjacent tiles, each covering 60 square degrees, in the directions of the Hydra I cluster and the NGC 4636 galaxy group (Westmeier et al. Reference Westmeier, Deg, Spekkens, Reynolds and Shen2022).
In this work, we investigate and quantify variations in the H i radial surface density profiles of $\sim$
280 nearby, gas-rich galaxies by the average H i surface density and size of the H i disc and look at how the structure of the stellar disc (quantified by stellar mass and stellar mass surface density) and star formation affect these quantities. In Section 2, we describe the data and derive the physical quantities we use for this work. We describe and characterise our sample in Section 3 and present our results in Section 4. We place our results in context with previous work and discuss possible physical drivers in Section 5. We summarise our conclusions in Section 6. Throughout, we adopt optical velocities (cz) in the heliocentric reference frame, the AB magnitude convention and we assume a flat
$\sim$
280 nearby, gas-rich galaxies by the average H i surface density and size of the H i disc and look at how the structure of the stellar disc (quantified by stellar mass and stellar mass surface density) and star formation affect these quantities. In Section 2, we describe the data and derive the physical quantities we use for this work. We describe and characterise our sample in Section 3 and present our results in Section 4. We place our results in context with previous work and discuss possible physical drivers in Section 5. We summarise our conclusions in Section 6. Throughout, we adopt optical velocities (cz) in the heliocentric reference frame, the AB magnitude convention and we assume a flat $\Lambda$
CDM cosmology with
$\Lambda$
CDM cosmology with $H_0=67.7$
km s
$H_0=67.7$
km s $^{-1}$
Mpc
$^{-1}$
Mpc $^{-1}$
(Planck Collaboration et al. 2016).
$^{-1}$
(Planck Collaboration et al. 2016).
2. Data
2.1. WALLABY
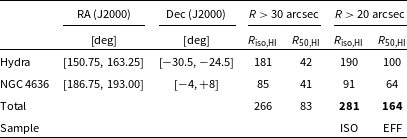
In this work, we use data from the first WALLABY pilot survey Public Data Release (PDR1,Westmeier et al. Reference Westmeier, Deg, Spekkens, Reynolds and Shen2022) covering two 60-square-degree fields in the directions of the Hydra cluster and the NGC 4636 group. For details on the WALLABY observations and data processing see Westmeier et al. (Reference Westmeier, Deg, Spekkens, Reynolds and Shen2022). Source catalogues of H i detections were produced for each field using the Source Finding Application 2 (SoFiA2, Westmeier et al. Reference Westmeier2021) and released internally to the WALLABY team. We use H i detections from the WALLABY PDR1 denoted Hydra TR2 and NGC 4636 TR1 (we list the sky coverage in Table 1). Hydra TR2 was produced from blind source finding using a median-based approximation of the root mean square (RMS) detection threshold of $3.5\sigma_{\mathrm{RMS}}$
(which is more robust against outliers than the RMS), where
$3.5\sigma_{\mathrm{RMS}}$
(which is more robust against outliers than the RMS), where $\sigma_{\mathrm{RMS}}$
is the RMS level of the H i spectral line cube (nominally
$\sigma_{\mathrm{RMS}}$
is the RMS level of the H i spectral line cube (nominally $\sigma_{\mathrm{RMS}}=1.6$
mJy beam
$\sigma_{\mathrm{RMS}}=1.6$
mJy beam $^{-1}$
, but it varies spatially and spectrally, see Westmeier et al. Reference Westmeier, Deg, Spekkens, Reynolds and Shen2022). For NGC 4636 TR1, the source finding used optical and H i position and redshift priors and a higher detection threshold of
$^{-1}$
, but it varies spatially and spectrally, see Westmeier et al. Reference Westmeier, Deg, Spekkens, Reynolds and Shen2022). For NGC 4636 TR1, the source finding used optical and H i position and redshift priors and a higher detection threshold of $4\sigma_{\mathrm{RMS}}$
due to artefacts and bright continuum residuals in the H i spectral line cube, which made blind source finding impossible (see Westmeier et al. Reference Westmeier, Deg, Spekkens, Reynolds and Shen2022 for full details on the source finding run parameters and the WALLABY PDR1 source catalogueFootnote
a
).
$4\sigma_{\mathrm{RMS}}$
due to artefacts and bright continuum residuals in the H i spectral line cube, which made blind source finding impossible (see Westmeier et al. Reference Westmeier, Deg, Spekkens, Reynolds and Shen2022 for full details on the source finding run parameters and the WALLABY PDR1 source catalogueFootnote
a
).
Sky coverage and number of galaxies with resolved isodensity ( $R_{\rm{iso,HI}}$
, ISO sample) and effective (
$R_{\rm{iso,HI}}$
, ISO sample) and effective ( $R_{\rm{50,HI}}$
, EFF sample) radii in the Hydra and NGC 4636 fields.
$R_{\rm{50,HI}}$
, EFF sample) radii in the Hydra and NGC 4636 fields.
The final source catalogue contains a total of 414 detections of H i emission in the two fields with integrated signal-to-noise ratios $\mathrm{SNR}>4$
. We note that not all these detections correspond to individual, real sources as some artefacts remain in the catalogue, SoFiA has detected multiple H i components for single sources (i.e. equivalent to shredding in optical imaging) and some detections contain multiple galaxies within a single H i envelope (i.e. close interacting systems). We limit our sample to only those H i detections with single optical counterparts with multi-wavelength (ultraviolet, optical and near-infrared) coverage (
$\mathrm{SNR}>4$
. We note that not all these detections correspond to individual, real sources as some artefacts remain in the catalogue, SoFiA has detected multiple H i components for single sources (i.e. equivalent to shredding in optical imaging) and some detections contain multiple galaxies within a single H i envelope (i.e. close interacting systems). We limit our sample to only those H i detections with single optical counterparts with multi-wavelength (ultraviolet, optical and near-infrared) coverage ( $N=282$
, see Section 3).
$N=282$
, see Section 3).
We use the method described in Reynolds et al. (Reference Reynolds2022) to calculate the H i mass and measure the H i radius. In summary, we fit a 2-dimensional Gaussian to the SoFiA produced moment 0 map, which we use to define annuli within which we measure the H i surface density and use to produce the radial H i surface density profile. However, we make the following changes to the published method. The majority of WALLABY sources are detected due to spatially and spectrally smoothing the spectral line cube at various scales with SoFiA to increase the cube SNR. As a result, these sources may not be deconvolved as they are too faint to be detected in individual channels during the deconvolution step of the ASKAPsoft processing pipeline (for further details see Westmeier et al. Reference Westmeier, Deg, Spekkens, Reynolds and Shen2022). This causes the majority of integrated H i flux measurements to be underestimated, with fainter H i detections being more severely affected. We apply the statistical correction to the integrated fluxes proposed in Westmeier et al. (Reference Westmeier, Deg, Spekkens, Reynolds and Shen2022) and presented in their equations 9 and 10. The correction is $<$
10% for fluxes
$<$
10% for fluxes $>$
$>$ $10^5$
Jy Hz, but increases from
$10^5$
Jy Hz, but increases from $\sim$
25% to
$\sim$
25% to $\sim$
60% as the measured flux decreases from
$\sim$
60% as the measured flux decreases from $\sim$ $10^{4.5}$
to
$10^{4.5}$
to $\sim$ $10^3$
Jy Hz. We also correct the radial surface brightness profiles measured from the moment 0 maps by scaling the profiles by the ratio between the measured and corrected integrated fluxes.
$10^3$
Jy Hz. We also correct the radial surface brightness profiles measured from the moment 0 maps by scaling the profiles by the ratio between the measured and corrected integrated fluxes.
We then convert the profile from surface brightness to surface density (e.g. Meyer et al. Reference Meyer2017) and measure the isodensity radius at $1\,\rm{M}_{\odot}\,\rm{pc}^{-2}$
(
$1\,\rm{M}_{\odot}\,\rm{pc}^{-2}$
( $R_{\rm{iso,HI}}$
), and the half-mass (effective,
$R_{\rm{iso,HI}}$
), and the half-mass (effective, $R_{\rm{50,HI}}$
) radius. We deconvolve these measured radii by the ASKAP synthesised beam of
$R_{\rm{50,HI}}$
) radius. We deconvolve these measured radii by the ASKAP synthesised beam of $\sim$
30 arcsec to get the final
$\sim$
30 arcsec to get the final $R_{\rm{iso,HI}}$
and
$R_{\rm{iso,HI}}$
and $R_{\rm{50,HI}}$
values (where we assume that the beam and H i disc can be approximated as Gaussians). We calculate the average H i surface density,
$R_{\rm{50,HI}}$
values (where we assume that the beam and H i disc can be approximated as Gaussians). We calculate the average H i surface density, ${\unicode{x03BC}}_{\mathrm{HI}}$
, (hereafter referred to as the H i surface density) within both the isodensity (
${\unicode{x03BC}}_{\mathrm{HI}}$
, (hereafter referred to as the H i surface density) within both the isodensity ( ${\unicode{x03BC}}_{\mathrm{iso,HI}}$
) and effective (
${\unicode{x03BC}}_{\mathrm{iso,HI}}$
) and effective ( ${\unicode{x03BC}}_{\mathrm{50,HI}}$
) radii by integrating the H i flux in the moment 0 maps contained within elliptical apertures with the semi-major axis defined by the H i radius and dividing by the area of the aperture. We then convert to units of surface density (
${\unicode{x03BC}}_{\mathrm{50,HI}}$
) radii by integrating the H i flux in the moment 0 maps contained within elliptical apertures with the semi-major axis defined by the H i radius and dividing by the area of the aperture. We then convert to units of surface density ( $\mathrm{M}_{\odot}\,\mathrm{pc}^{-2}$
). We correct all surface density measurements that we describe above for inclination (i.e. deproject to face-on). We determine the inclination from the ratio of the minor to major axes of the 2-dimensional Gaussian fit to the H i moment 0 map that we use to extract the radial surface density profile (described in Reynolds et al. Reference Reynolds2022).
$\mathrm{M}_{\odot}\,\mathrm{pc}^{-2}$
). We correct all surface density measurements that we describe above for inclination (i.e. deproject to face-on). We determine the inclination from the ratio of the minor to major axes of the 2-dimensional Gaussian fit to the H i moment 0 map that we use to extract the radial surface density profile (described in Reynolds et al. Reference Reynolds2022).
Our calculated H i surface densities assume that the H i gas is optically thin. If the gas is not optically thin, then the H i surface densities will be underestimated when we correct for inclination. However, we are also likely underestimating the inclination for poorly resolved galaxies (i.e. $<$
4 beams) due to the size of the minor axis being comparable to that of the synthesised beam. This introduces a bias towards lower inclinations for poorly resolved galaxies, which reduces the effect from correcting for inclination and counters the underestimate introduced by the assumption that the gas is optically thin. We find that the measured inclination does not correlate with either
$<$
4 beams) due to the size of the minor axis being comparable to that of the synthesised beam. This introduces a bias towards lower inclinations for poorly resolved galaxies, which reduces the effect from correcting for inclination and counters the underestimate introduced by the assumption that the gas is optically thin. We find that the measured inclination does not correlate with either ${\unicode{x03BC}}_{\mathrm{iso,HI}}$
or
${\unicode{x03BC}}_{\mathrm{iso,HI}}$
or ${\unicode{x03BC}}_{\mathrm{50,HI}}$
. We conclude that the inclination correction does not introduce a systematic bias in the H i surface densities. However, it likely contributes to the scatter in the measured H i surface densities.
${\unicode{x03BC}}_{\mathrm{50,HI}}$
. We conclude that the inclination correction does not introduce a systematic bias in the H i surface densities. However, it likely contributes to the scatter in the measured H i surface densities.
2.2. Ancillary data
We follow the method described in Reynolds et al. (Reference Reynolds2022) to derive stellar masses ( $M_*$
) and optical sizes from PanSTARRS (Chambers et al. Reference Chambers2016; Flewelling et al. Reference Flewelling2016) g- and r-band images and total star formation rates (SFRs) from GALEX (Martin et al. Reference Martin2005; Morrissey et al. Reference Morrissey2007) near-UV (NUV) and WISE (Wright et al. Reference Wright2010) W3-/W4-band magnitudes. However, we have made the following changes to the measured PanSTARRS photometry concerning local sky background removal.
$M_*$
) and optical sizes from PanSTARRS (Chambers et al. Reference Chambers2016; Flewelling et al. Reference Flewelling2016) g- and r-band images and total star formation rates (SFRs) from GALEX (Martin et al. Reference Martin2005; Morrissey et al. Reference Morrissey2007) near-UV (NUV) and WISE (Wright et al. Reference Wright2010) W3-/W4-band magnitudes. However, we have made the following changes to the measured PanSTARRS photometry concerning local sky background removal.
Initially, we measure the photometry for the PanSTARRS r-band image as described in Reynolds et al. (Reference Reynolds2022) in which the centre, position angle and inclination angle of each isophotal annulus are allowed to vary. We then fix the annulus centre, inclination angle and position angle to the values for the 25 mag arcsec $^{-2}$
isophote from the initial measurement. This also provides an initial estimate of the r-band radius,
$^{-2}$
isophote from the initial measurement. This also provides an initial estimate of the r-band radius, $R_{\mathrm{r,guess}}$
. We measure the background at
$R_{\mathrm{r,guess}}$
. We measure the background at $>$
$>$ $1.5R_{\mathrm{r,guess}}$
in five annuli of width
$1.5R_{\mathrm{r,guess}}$
in five annuli of width $0.1R_{\mathrm{r,guess}}$
and take the average of these annuli as the mean background. We subtract the mean background and remeasure the photometry using annuli with the centre, inclination angle and position angle fixed. We define the isophotal radius using the 25 mag arcsec
$0.1R_{\mathrm{r,guess}}$
and take the average of these annuli as the mean background. We subtract the mean background and remeasure the photometry using annuli with the centre, inclination angle and position angle fixed. We define the isophotal radius using the 25 mag arcsec $^{-2}$
isophote (
$^{-2}$
isophote ( $R_{\rm{iso,r}}$
, i.e. the isophote we use to define the aperture for measuring the total magnitude in the g- and r-bands). The local background subtraction has only a minor effect on the measured total magnitudes (
$R_{\rm{iso,r}}$
, i.e. the isophote we use to define the aperture for measuring the total magnitude in the g- and r-bands). The local background subtraction has only a minor effect on the measured total magnitudes ( $\sim$ $0.01\pm0.07$
mag brighter). We measure the effective radius (
$0.01\pm0.07$
mag brighter). We measure the effective radius ( $R_{\rm{50,r}}$
) at the point containing half the flux within the aperture defined by the 26 mag arcsec
$R_{\rm{50,r}}$
) at the point containing half the flux within the aperture defined by the 26 mag arcsec $^{-2}$
isophote (i.e. 1 mag fainter than the surface brightness we use for the isophotal radius). We also measure the stellar mass surface density (
$^{-2}$
isophote (i.e. 1 mag fainter than the surface brightness we use for the isophotal radius). We also measure the stellar mass surface density ( ${\unicode{x03BC}}_*$
) using the derived stellar mass and effective r-band radius as
${\unicode{x03BC}}_*$
) using the derived stellar mass and effective r-band radius as
 \begin{equation} {\unicode{x03BC}}_{\ast}=M_*/(2{\unicode[Times]{x03C0}} R_{50,r}^2), \end{equation}
where $R_{\rm{50,r}}$
is in units of kpc.
$R_{\rm{50,r}}$
is in units of kpc.
3. Sample selection and characterisation
Our goal is to measure the H i disc sizes and average surface densities in WALLABY galaxies and how these properties relate to stellar structure (which we characterise by the galaxies’ stellar mass and stellar mass surface density) and star formation. To achieve this, we require the H i detections to be of good quality and spatially resolved (i.e. no artefacts in the sources) with single optical counterparts (i.e. no closely interacting systems or multiple optical counterparts contained within a single H i detection) and have multi-wavelength coverage in PanSTARRS g- and r-bands, GALEX NUV-band and WISE W1 and W3/W4-bands. Of the original 414 WALLABY detections, 56 contain artefacts or are closely interacting systems contained within a single H i envelope. A further 76 either have incomplete PanSTARRS coverage, are impacted by foreground stars, are not detected in the PanSTARRS images or are missing GALEX coverage.
These cuts result in a sample of 282 galaxies, of which 281 are at least marginally resolved with deconvolved isodensity H i radii $R_{\mathrm{iso,HI}}>20$
arcsec (i.e.
$R_{\mathrm{iso,HI}}>20$
arcsec (i.e. $>1.3$
beams along the major axis). The sample decreases to 164 galaxies with effective H i radii
$>1.3$
beams along the major axis). The sample decreases to 164 galaxies with effective H i radii $R_{\mathrm{50,HI}}>20$
arcsec. If we further restrict our sample to slightly better spatially resolved galaxies with radii
$R_{\mathrm{50,HI}}>20$
arcsec. If we further restrict our sample to slightly better spatially resolved galaxies with radii $>30$
arcsec (i.e.
$>30$
arcsec (i.e. $>2$
beams along the major axis), the sample reduces to 266 (83) with resolved isodensity (effective) radii. We present results for the galaxy samples with
$>2$
beams along the major axis), the sample reduces to 266 (83) with resolved isodensity (effective) radii. We present results for the galaxy samples with $R_{\mathrm{iso,HI}}>20$
arcsec (
$R_{\mathrm{iso,HI}}>20$
arcsec ( $N=281$
galaxies, hereafter referred to as the ISO sample) and
$N=281$
galaxies, hereafter referred to as the ISO sample) and $R_{\mathrm{50,HI}}>20$
arcsec (
$R_{\mathrm{50,HI}}>20$
arcsec ( $N=164$
galaxies, hereafter referred to as the EFF sample) as these provide the best statistics, most notably for galaxies with resolved effective radii (i.e. nearly double the sample size, see Table 1). We find similar results if we use the radii
$N=164$
galaxies, hereafter referred to as the EFF sample) as these provide the best statistics, most notably for galaxies with resolved effective radii (i.e. nearly double the sample size, see Table 1). We find similar results if we use the radii $>30$
arcsec sample.
$>30$
arcsec sample.
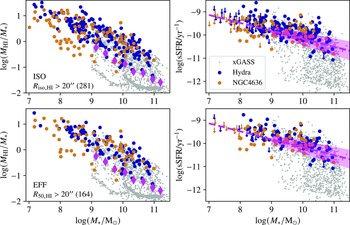
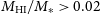
As a blind H i survey, the galaxy population that WALLABY detects is inherently biased (i.e. with increasing distance only larger and more gas-rich galaxies are easily detected). To put the WALLABY detections into a broader context, we compare the H i gas fraction ( $M_{\mathrm{HI}}/M_*$
) and specific star formation rate (sSFR) of our sample with the xGASS (Catinella et al. Reference Catinella2018) representative sample (left and right columns of Figure 1, respectively). Unlike blind H i surveys, xGASS is not biased towards H i rich systems as it is a stellar mass selected (
$M_{\mathrm{HI}}/M_*$
) and specific star formation rate (sSFR) of our sample with the xGASS (Catinella et al. Reference Catinella2018) representative sample (left and right columns of Figure 1, respectively). Unlike blind H i surveys, xGASS is not biased towards H i rich systems as it is a stellar mass selected ( $10^9 < M_*/M_\odot < 10^{11}$
), gas fraction limited (
$10^9 < M_*/M_\odot < 10^{11}$
), gas fraction limited ( $M_{\mathrm{HI}}/M_*>0.02$
–0.1) survey. We show the ISO and EFF samples in the top and bottom rows, respectively. We distinguish between galaxies detected in the Hydra and NGC 4636 fields (blue and orange, respectively) as different source finding techniques were applied to each field (Section 2.1 and Westmeier et al. Reference Westmeier, Deg, Spekkens, Reynolds and Shen2022) and the detected galaxies in each field are concentrated at different distances (
$M_{\mathrm{HI}}/M_*>0.02$
–0.1) survey. We show the ISO and EFF samples in the top and bottom rows, respectively. We distinguish between galaxies detected in the Hydra and NGC 4636 fields (blue and orange, respectively) as different source finding techniques were applied to each field (Section 2.1 and Westmeier et al. Reference Westmeier, Deg, Spekkens, Reynolds and Shen2022) and the detected galaxies in each field are concentrated at different distances ( $\sim$
55 Mpc vs
$\sim$
55 Mpc vs $\sim$
20 Mpc, respectively).
$\sim$
20 Mpc, respectively).
H i gas fraction ( $M_{\mathrm{HI}}/M_*$
, left column) and specific star formation rate (sSFR, right column) vs stellar mass (
$M_{\mathrm{HI}}/M_*$
, left column) and specific star formation rate (sSFR, right column) vs stellar mass ( $M_*$
) for galaxies with
$M_*$
) for galaxies with $R_{\rm{iso,HI}}>20$
arcsec and with
$R_{\rm{iso,HI}}>20$
arcsec and with $R_{\rm{50,HI}}>20$
arcsec (top and bottom rows, respectively). The Hydra and NGC 4636 field galaxies are indicated in blue and orange, respectively, and the grey points are the xGASS sample. The magenta diamonds in the left column are the median gas fractions for xGASS from Catinella et al. (Reference Catinella2018). In the left column, the total number of galaxies in the resolved sample is indicated within brackets in the lower left corner. In the right column, the magenta dashed line and shaded region are the star forming main sequence (SFMS) and
$R_{\rm{50,HI}}>20$
arcsec (top and bottom rows, respectively). The Hydra and NGC 4636 field galaxies are indicated in blue and orange, respectively, and the grey points are the xGASS sample. The magenta diamonds in the left column are the median gas fractions for xGASS from Catinella et al. (Reference Catinella2018). In the left column, the total number of galaxies in the resolved sample is indicated within brackets in the lower left corner. In the right column, the magenta dashed line and shaded region are the star forming main sequence (SFMS) and $1\sigma$
scatter in the SFMS from Janowiecki et al. (Reference Janowiecki, Catinella, Cortese, Saintonge and Wang2020); the down pointing arrows indicate galaxies with sSFR upper limits.
$1\sigma$
scatter in the SFMS from Janowiecki et al. (Reference Janowiecki, Catinella, Cortese, Saintonge and Wang2020); the down pointing arrows indicate galaxies with sSFR upper limits.

At fixed stellar mass, the galaxies detected by WALLABY predominantly have H i gas fractions above the xGASS medians (Catinella et al. Reference Catinella2018, magenta diamonds in the left panels of Figure 1). This illustrates that the majority of the WALLABY detections are gas-rich. Janowiecki et al. (Reference Janowiecki, Catinella, Cortese, Saintonge and Wang2020) defined a star forming main sequence (SFMS) and its $1\sigma$
scatter using xGASS, which we overlay in the right panels of Figure 1 (magenta dashed line and shaded region). For illustrative purposes, we extend the SFMS down to
$1\sigma$
scatter using xGASS, which we overlay in the right panels of Figure 1 (magenta dashed line and shaded region). For illustrative purposes, we extend the SFMS down to $M_*=10^{7}\,\mathrm{M}_{\odot}$
(i.e. below the xGASS stellar mass limit of
$M_*=10^{7}\,\mathrm{M}_{\odot}$
(i.e. below the xGASS stellar mass limit of $M_*=10^{9}\,\mathrm{M}_{\odot}$
), but only show the scatter for the xGASS stellar mass range. WALLABY detects mostly star forming galaxies that predominantly lie either above or within the scatter of the SFMS, with only a small population of galaxies with sSFR below the
$M_*=10^{9}\,\mathrm{M}_{\odot}$
), but only show the scatter for the xGASS stellar mass range. WALLABY detects mostly star forming galaxies that predominantly lie either above or within the scatter of the SFMS, with only a small population of galaxies with sSFR below the $1\sigma$
scatter in the SFMS. For 83 galaxies in the ISO sample, the derived sSFRs are classified as upper limits if they are not detected (i.e.
$1\sigma$
scatter in the SFMS. For 83 galaxies in the ISO sample, the derived sSFRs are classified as upper limits if they are not detected (i.e. $\mathrm{SNR}<5$
) in either the GALEX NUV-band or both the WISE W3- and W4-band images (indicated by the down pointing arrows in the right panels of Figure 1).
$\mathrm{SNR}<5$
) in either the GALEX NUV-band or both the WISE W3- and W4-band images (indicated by the down pointing arrows in the right panels of Figure 1).
There is a population of galaxies from the NGC 4636 field below $M_*\lesssim10^{10}\,\mathrm{M}_{\odot}$
that are offset to lower gas fractions (
$M_*\lesssim10^{10}\,\mathrm{M}_{\odot}$
that are offset to lower gas fractions ( $\sim$ $0.5$
dex lower), but no corresponding population of galaxies in the Hydra field. Above
$0.5$
dex lower), but no corresponding population of galaxies in the Hydra field. Above $M_*\gtrsim10^{10}\,\mathrm{M}_{\odot}$
, there are
$M_*\gtrsim10^{10}\,\mathrm{M}_{\odot}$
, there are $\sim$
6 galaxies from the Hydra field with similarly offset gas fractions. This is due to the NGC 4636 field containing more nearby galaxies (i.e.
$\sim$
6 galaxies from the Hydra field with similarly offset gas fractions. This is due to the NGC 4636 field containing more nearby galaxies (i.e. $<$
30 Mpc) compared to the Hydra field (i.e.
$<$
30 Mpc) compared to the Hydra field (i.e. $>$
35 Mpc) and the targeted source finding strategy applied to the NGC 4636 field (Section 2.1). Compared to the ISO sample, the EFF sample is slightly biased towards galaxies with
$>$
35 Mpc) and the targeted source finding strategy applied to the NGC 4636 field (Section 2.1). Compared to the ISO sample, the EFF sample is slightly biased towards galaxies with $M_*>10^{9}\,\mathrm{M}_{\odot}$
(i.e. for
$M_*>10^{9}\,\mathrm{M}_{\odot}$
(i.e. for $M_*<10^{9}\,\mathrm{M}_{\odot}$
and
$M_*<10^{9}\,\mathrm{M}_{\odot}$
and $M_*>10^{9}\,\mathrm{M}_{\odot}$
,
$M_*>10^{9}\,\mathrm{M}_{\odot}$
, $\sim$
50% vs
$\sim$
50% vs $\sim$
65% of galaxies in our sample have
$\sim$
65% of galaxies in our sample have $R_{\mathrm{50,HI}}>20$
arcsec, respectively).
$R_{\mathrm{50,HI}}>20$
arcsec, respectively).
4. Results
As we discuss in the introduction, many previous studies targeted relatively small numbers of galaxies selected to have high spatial resolution and were able to probe radial variations in the H i distribution in the galaxies’ inner regions (i.e. within the optical disc) with other galaxy properties on a galaxy-by-galaxy basis. Unlike these data sets, our sample is limited to the galaxies that we detect in the observed field, which includes a small fraction of well-resolved galaxies (i.e. $>$
4 beams along the major axis;
$>$
4 beams along the major axis; $\sim$
25% and
$\sim$
25% and $\sim$
10% of galaxies’ isodensity and effective sizes are resolved by
$\sim$
10% of galaxies’ isodensity and effective sizes are resolved by $>$
6 beams, respectively) and a large fraction of marginally resolved galaxies (i.e.
$>$
6 beams, respectively) and a large fraction of marginally resolved galaxies (i.e. $<$
4 beams along the major axis;
$<$
4 beams along the major axis; $\sim$
75% and
$\sim$
75% and $\sim$
90% of galaxies for the ISO and EFF samples, respectively). Due to the poor resolution of the majority of our sample, we are unable to probe radial variations in the H i on small scales. Instead, we parameterise the H i spatial distribution using quantities that we can measure for marginally resolved galaxies: the size of the H i disc and the H i surface density within the H i disc.
$\sim$
90% of galaxies for the ISO and EFF samples, respectively). Due to the poor resolution of the majority of our sample, we are unable to probe radial variations in the H i on small scales. Instead, we parameterise the H i spatial distribution using quantities that we can measure for marginally resolved galaxies: the size of the H i disc and the H i surface density within the H i disc.
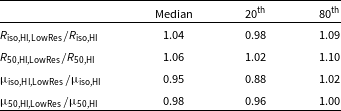
We also investigate the effect of spatial resolution on the measured radii and surface densities by convolving the moment 0 maps of galaxies resolved by $>$
2 beams to an equivalent resolution of 2 beams along the major axis. We find a difference smaller than 10% between the structural parameters measured from the two sets of maps (see Appendix A), confirming that the findings presented below are not significantly affected by differences in resolution within our sample.
$>$
2 beams to an equivalent resolution of 2 beams along the major axis. We find a difference smaller than 10% between the structural parameters measured from the two sets of maps (see Appendix A), confirming that the findings presented below are not significantly affected by differences in resolution within our sample.
4.1. Size–mass relations
Studies show that galaxies’ radial H i surface density profiles normalised by the H i radius defined at $1\,\rm{M}_{\odot}\,\rm{pc}^{-2}$
,
$1\,\rm{M}_{\odot}\,\rm{pc}^{-2}$
, $R_{\rm{iso,HI}}$
, are approximately exponential in the outer disc (i.e.
$R_{\rm{iso,HI}}$
, are approximately exponential in the outer disc (i.e. $r\gtrsim0.5R_{\rm{iso,HI}}$
, e.g. Swaters et al. Reference Swaters, van Albada, van der Hulst and Sancisi2002, Wang et al. Reference Wang2016). At smaller radii (e.g.
$r\gtrsim0.5R_{\rm{iso,HI}}$
, e.g. Swaters et al. Reference Swaters, van Albada, van der Hulst and Sancisi2002, Wang et al. Reference Wang2016). At smaller radii (e.g. $\lesssim$ $0.5R_{\rm{iso,HI}}$
), the radial H i surface density is found to vary by
$0.5R_{\rm{iso,HI}}$
), the radial H i surface density is found to vary by $\sim$
1 dex from
$\sim$
1 dex from $\sim$
1–
$\sim$
1– $10\,\rm{M}_{\odot}\,\rm{pc}^{-2}$
. In comparison with the H i, the stellar mass surface density shows a larger variation (e.g.
$10\,\rm{M}_{\odot}\,\rm{pc}^{-2}$
. In comparison with the H i, the stellar mass surface density shows a larger variation (e.g. $\sim$
2 dex, Catinella et al. Reference Catinella2018), which is due to the presence or lack of a central brightness concentration or bulge-like component. Variations in the central surface brightness and internal extinction contribute to the difference in slope and scatter in stellar size–mass relations derived using isophotal vs effective radii (e.g. Saintonge & Spekkens Reference Saintonge and Spekkens2011; Cortese et al. Reference Cortese2012; Muñoz-Mateos et al. Reference Muñoz-Mateos2015; Trujillo et al. Reference Trujillo, Chamba and Knapen2020; Sánchez Almeida Reference Sánchez Almeida2020). Although galaxies do not have similar central concentrations of H i, variations in the inner H i surface density may produce differences between H i size–mass relations derived from isodensity vs effective radii.
$\sim$
2 dex, Catinella et al. Reference Catinella2018), which is due to the presence or lack of a central brightness concentration or bulge-like component. Variations in the central surface brightness and internal extinction contribute to the difference in slope and scatter in stellar size–mass relations derived using isophotal vs effective radii (e.g. Saintonge & Spekkens Reference Saintonge and Spekkens2011; Cortese et al. Reference Cortese2012; Muñoz-Mateos et al. Reference Muñoz-Mateos2015; Trujillo et al. Reference Trujillo, Chamba and Knapen2020; Sánchez Almeida Reference Sánchez Almeida2020). Although galaxies do not have similar central concentrations of H i, variations in the inner H i surface density may produce differences between H i size–mass relations derived from isodensity vs effective radii.
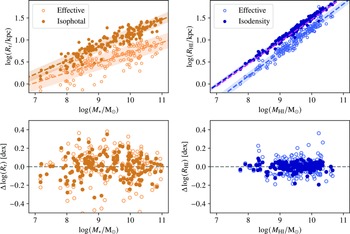
We plot the optical r-band and H i size–mass relations for our EFF sample in Figure 2 (left and right panels of top row, respectively). We plot both effective (light, unfilled circles) and isophotal/isodensity (dark, filled circles) defined radii and fit linear least-square regressions to the size–mass relations. The best fit parameters and $1\sigma$
scatter (dashed lines and shaded regions) are listed in Table 2. The lower panels show the offsets from the corresponding size–mass relations in the top row. The stellar and isodensity H i relations are consistent within uncertainties if we use the ISO sample.
$1\sigma$
scatter (dashed lines and shaded regions) are listed in Table 2. The lower panels show the offsets from the corresponding size–mass relations in the top row. The stellar and isodensity H i relations are consistent within uncertainties if we use the ISO sample.
Top: Size–mass relations for r-band/stellar (left) and H i (right) discs. The isophotal/isodensity radii are plotted as filled, dark circles and the effective radii as unfilled, light circles. The dashed lines and shaded regions show the linear least-square regression best fit relations and the $1\sigma$
scatter for each radius definition. The dashed magenta line in the top right panel is the best fit H i size–mass relation from Wang et al. (Reference Wang2016). Bottom: Residual vertical offsets of galaxies from the best fit size–mass relations.
$1\sigma$
scatter for each radius definition. The dashed magenta line in the top right panel is the best fit H i size–mass relation from Wang et al. (Reference Wang2016). Bottom: Residual vertical offsets of galaxies from the best fit size–mass relations.
Focusing first on the stellar size–mass relation (top left panel), we find that isophotal sizes produce a steeper and less scattered relation than effective sizes ( $a=0.31$
vs 0.23 and
$a=0.31$
vs 0.23 and $\sigma=0.12$
vs 0.17, respectively). The bottom left panel shows that individual galaxies scatter significantly around both relations (i.e.
$\sigma=0.12$
vs 0.17, respectively). The bottom left panel shows that individual galaxies scatter significantly around both relations (i.e. $\sim$ $0.4$
dex and
$0.4$
dex and $\sim$ $0.5$
dex for isophotal and effective radii, respectively). The differing slopes and scatters that we measure for the isophotal and effective stellar size–mass relations are consistent with the literature (e.g. Muñoz-Mateos et al. Reference Muñoz-Mateos2015; Cortese et al. Reference Cortese2012; Trujillo et al. Reference Trujillo, Chamba and Knapen2020; Sánchez Almeida Reference Sánchez Almeida2020).
$0.5$
dex for isophotal and effective radii, respectively). The differing slopes and scatters that we measure for the isophotal and effective stellar size–mass relations are consistent with the literature (e.g. Muñoz-Mateos et al. Reference Muñoz-Mateos2015; Cortese et al. Reference Cortese2012; Trujillo et al. Reference Trujillo, Chamba and Knapen2020; Sánchez Almeida Reference Sánchez Almeida2020).
Our results for the stellar relations indicate that effective radii increase more slowly than isophotal radii with increasing stellar mass and that the isophotal size is a better tracer for a galaxy’s total stellar mass. Both of these effects are a result of the sensitivity of effective radii to central stellar concentrations, which are more prominent in higher mass galaxies. In our galaxy sample, the central surface brightnesses of the r-band radial profiles span $\sim$
19–25 mag arcsec
$\sim$
19–25 mag arcsec $^{-2}$
(a factor of
$^{-2}$
(a factor of $\sim$
250). We note that our sample contains predominantly late-type galaxies, few of which are likely to contain a true bulge component (i.e. using
$\sim$
250). We note that our sample contains predominantly late-type galaxies, few of which are likely to contain a true bulge component (i.e. using $R_{\mathrm{90,r}}/R_{\mathrm{50,r}}$
as a proxy for the bulge-to-total ratio,
$R_{\mathrm{90,r}}/R_{\mathrm{50,r}}$
as a proxy for the bulge-to-total ratio, $\sim$
85% of our sample has
$\sim$
85% of our sample has $R_{\mathrm{90,r}}/R_{\mathrm{50,r}}<2.5$
which is consistent with being disc-dominated systems, e.g. Ferreras et al. Reference Ferreras, Lisker, Carollo, Lilly and Mobasher2005). The majority of galaxies with
$R_{\mathrm{90,r}}/R_{\mathrm{50,r}}<2.5$
which is consistent with being disc-dominated systems, e.g. Ferreras et al. Reference Ferreras, Lisker, Carollo, Lilly and Mobasher2005). The majority of galaxies with $R_{\mathrm{90,r}}/R_{\mathrm{50,r}}>2.5$
have
$R_{\mathrm{90,r}}/R_{\mathrm{50,r}}>2.5$
have $M_*>10^{9}\,\mathrm{M}_{\odot}$
.
$M_*>10^{9}\,\mathrm{M}_{\odot}$
.
Moving to the H i size–mass relations (top right panel of Figure 2), we find that isodensity sizes produce a shallower and less scattered relation than effective sizes ( $a=0.51$
vs 0.55 and
$a=0.51$
vs 0.55 and $\sigma=0.04$
vs 0.09, respectively). The bottom right panel highlights the tightness of both H i relations with few galaxies scattering by more than 0.1–0.2 dex. Our isodensity H i size–mass relation agrees well with the Wang et al. (Reference Wang2016) relation (magenta line in the top right panel;
$\sigma=0.04$
vs 0.09, respectively). The bottom right panel highlights the tightness of both H i relations with few galaxies scattering by more than 0.1–0.2 dex. Our isodensity H i size–mass relation agrees well with the Wang et al. (Reference Wang2016) relation (magenta line in the top right panel; $a_{\mathrm{W16}}=0.506$
,
$a_{\mathrm{W16}}=0.506$
, $b_{\mathrm{W16}}=3.594$
).Footnote
b
However, our relation is tighter (
$b_{\mathrm{W16}}=3.594$
).Footnote
b
However, our relation is tighter ( $\sigma=0.04$
vs 0.06), which may be due to the uniform WALLABY sample compared to the compilation of interferometric H i surveys used by Wang et al. (Reference Wang2016). A similar increase in scatter for the effective vs isodensity H i size–mass relation is also found in simulations (Stevens et al. Reference Stevens2019).
$\sigma=0.04$
vs 0.06), which may be due to the uniform WALLABY sample compared to the compilation of interferometric H i surveys used by Wang et al. (Reference Wang2016). A similar increase in scatter for the effective vs isodensity H i size–mass relation is also found in simulations (Stevens et al. Reference Stevens2019).
The steeper effective H i size–mass relation indicates that, unlike the stellar equivalent, H i effective radii grow faster than isodensity radii with increasing mass. The difference in slopes is small, but significant (i.e. $\sim$
4 times the uncertainty in the measured slopes, Table 2). Similar to the results for the stellar component, isodensity H i radii better trace the total H i mass than effective radii. However, effective H i radius is still a fairly good tracer as the scatter is less than that for either stellar size–mass relations. The smaller differences between the H i size–mass relations compared to the stellar relations discussed above are likely due to the the exponential shape of the outer H i profiles and the lower dynamic range of the central H i surface densities (i.e. spanning
$\sim$
4 times the uncertainty in the measured slopes, Table 2). Similar to the results for the stellar component, isodensity H i radii better trace the total H i mass than effective radii. However, effective H i radius is still a fairly good tracer as the scatter is less than that for either stellar size–mass relations. The smaller differences between the H i size–mass relations compared to the stellar relations discussed above are likely due to the the exponential shape of the outer H i profiles and the lower dynamic range of the central H i surface densities (i.e. spanning $\sim$
1 dex).
$\sim$
1 dex).
We conclude that the increased scatter in the effective H i size–mass relation is due to variations in the H i spatial distribution in the central regions (i.e. within the effective radius) of galaxies (e.g. illustrated for early- vs late-type galaxies by Wang et al. Reference Wang2016 in their figure 2).
In the following sections, we investigate variations in the size of the H i disc normalised to the optical r-band disc size, $R_{\mathrm{HI}}/R_{\mathrm{r}}$
, and the H i surface density,
$R_{\mathrm{HI}}/R_{\mathrm{r}}$
, and the H i surface density, ${\unicode{x03BC}}_{\mathrm{HI}}$
, for both the isodensity and effective radii. We investigate how these quantities correlate with stellar mass, stellar mass surface density, sSFR,
${\unicode{x03BC}}_{\mathrm{HI}}$
, for both the isodensity and effective radii. We investigate how these quantities correlate with stellar mass, stellar mass surface density, sSFR, $\mathrm{NUV}-r$
colour and the offset from the star forming main sequence (
$\mathrm{NUV}-r$
colour and the offset from the star forming main sequence ( $\Delta\,\rm{SFMS}$
) defined using xGASS by Janowiecki et al. (Reference Janowiecki, Catinella, Cortese, Saintonge and Wang2020), shown in the right panels of Figure 1 by the dashed magenta line, to identify possible drivers responsible for producing differences in the H i spatial distributions.
$\Delta\,\rm{SFMS}$
) defined using xGASS by Janowiecki et al. (Reference Janowiecki, Catinella, Cortese, Saintonge and Wang2020), shown in the right panels of Figure 1 by the dashed magenta line, to identify possible drivers responsible for producing differences in the H i spatial distributions.
4.2. The normalised HI disc size
Beyond the effective radius, H i radial profiles are approximately exponential. We probe the outer part of the radial H i profile using the size of the H i disc relative to the optical disc, which provides a measure of the size of the H i gas reservoir. H i beyond the optical disc will not directly impact the inner star-forming disc, but provides a reservoir that has the potential to be funnelled towards the galaxy centre for future star formation (e.g. Schmidt et al. Reference Schmidt, Bigiel, Klessen and de Blok2016). We normalise the H i radius by the equivalent r-band radius (i.e. isodensity H i by isophotal r-band, $R_{\rm{iso,HI}}/R_{\rm{iso,r}}$
, and effective H i by effective r-band,
$R_{\rm{iso,HI}}/R_{\rm{iso,r}}$
, and effective H i by effective r-band, $R_{\rm{50,HI}}/R_{\rm{50,r}}$
).
$R_{\rm{50,HI}}/R_{\rm{50,r}}$
).
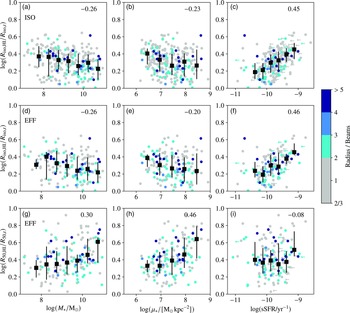
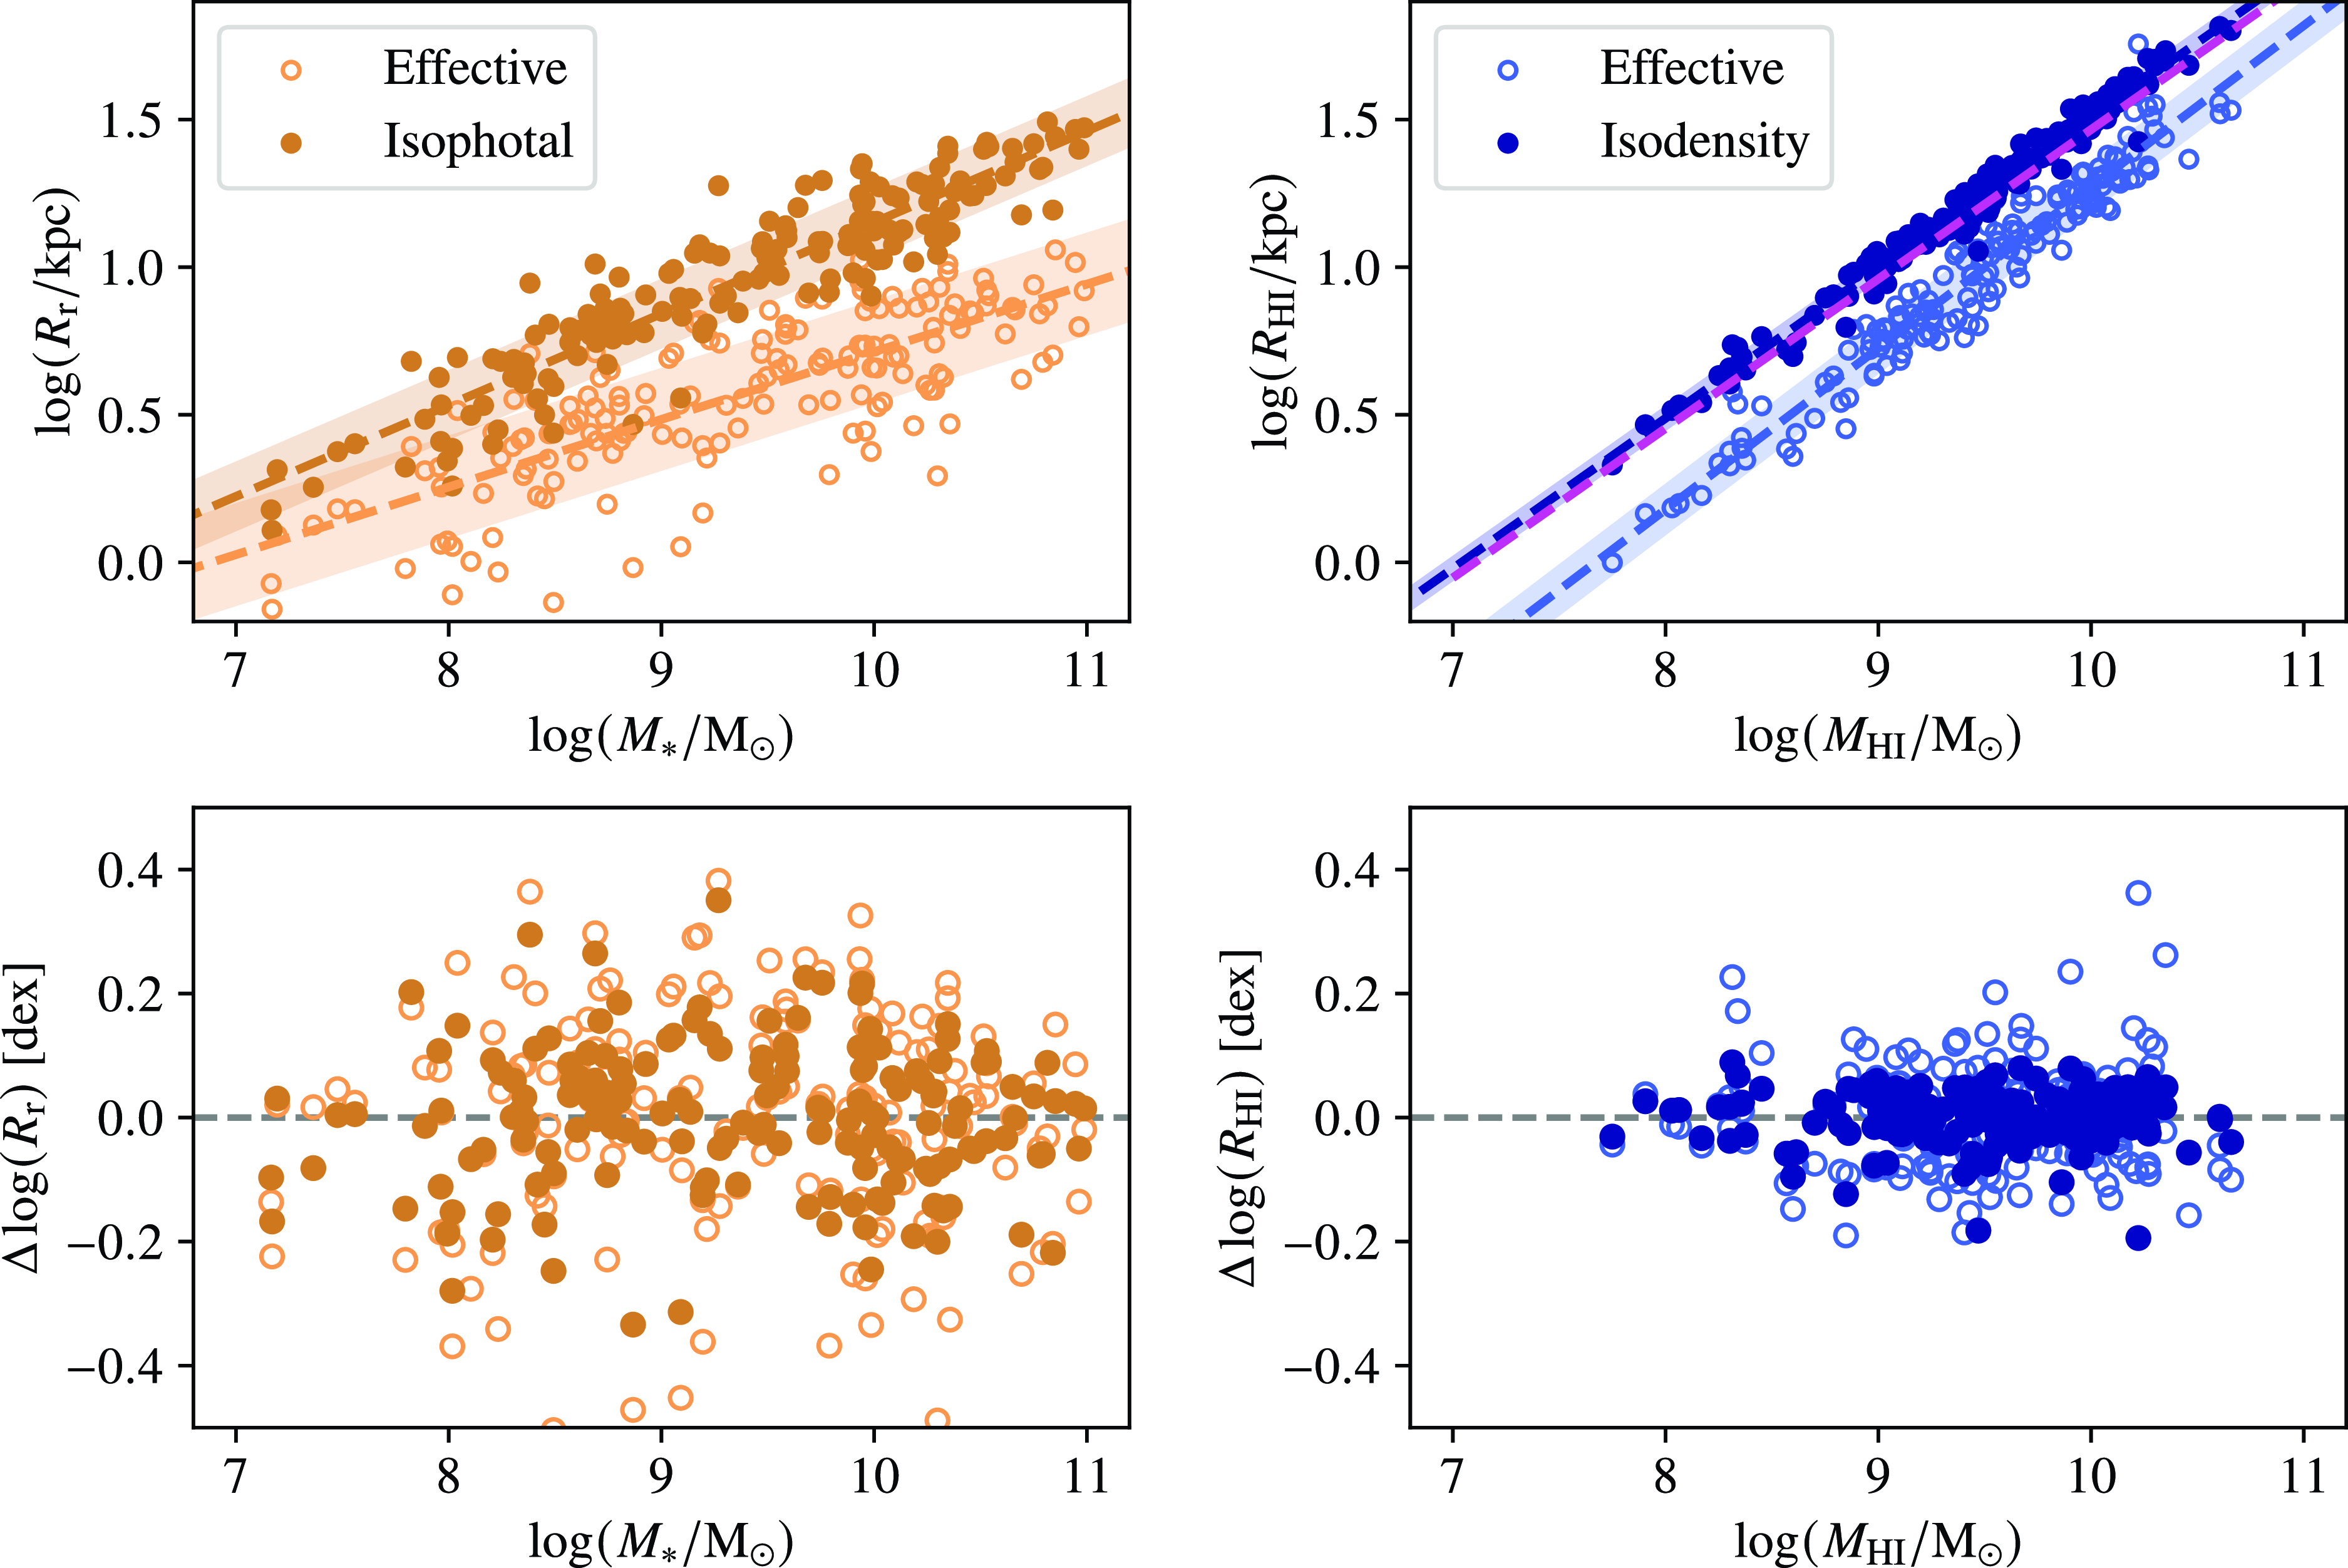
In Figure 3, we show how $R_{\rm{iso,HI}}/R_{\rm{iso,r}}$
varies as a function of
$R_{\rm{iso,HI}}/R_{\rm{iso,r}}$
varies as a function of $M_*$
,
$M_*$
, ${\unicode{x03BC}}_*$
and sSFR (top row, panels a–c, respectively) for the ISO sample. To guide the reader’s eye, we plot medians with error bars indicating the 20
${\unicode{x03BC}}_*$
and sSFR (top row, panels a–c, respectively) for the ISO sample. To guide the reader’s eye, we plot medians with error bars indicating the 20 ${^{\rm{th}}}$
and 80
${^{\rm{th}}}$
and 80 ${^{\rm{th}}}$
percentiles as black squares (all bins contain
${^{\rm{th}}}$
percentiles as black squares (all bins contain $>$
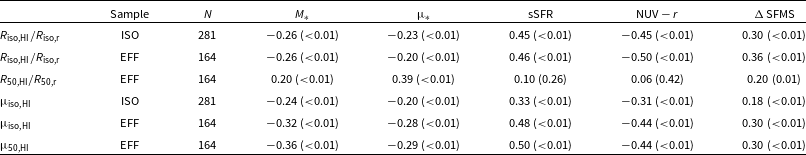
5 galaxies). We quantify the level of correlation between each pair of quantities using the Pearson correlation coefficient (
$>$
5 galaxies). We quantify the level of correlation between each pair of quantities using the Pearson correlation coefficient ( ${\unicode{x03C1}}$
), which we show in the upper right corner of each panel and list in the first row of Table 3. The significance of the correlations is indicated by the p-values (in brackets), where the correlation is deemed significant if the p-value is
${\unicode{x03C1}}$
), which we show in the upper right corner of each panel and list in the first row of Table 3. The significance of the correlations is indicated by the p-values (in brackets), where the correlation is deemed significant if the p-value is $<$
$<$ $0.05$
. We note that the Pearson correlations are calculated on the data directly, not from the medians. Although we do not plot
$0.05$
. We note that the Pearson correlations are calculated on the data directly, not from the medians. Although we do not plot $R_{\rm{iso,HI}}/R_{\rm{iso,r}}$
as a function of
$R_{\rm{iso,HI}}/R_{\rm{iso,r}}$
as a function of $\mathrm{NUV}-r$
colour and
$\mathrm{NUV}-r$
colour and $\Delta\,\rm{SFMS}$
, we include the Pearson correlations in Table 3. We indicate galaxies with upper limit derived SFRs by the left pointing arrows in panel c. A large fraction of our sample is marginally resolved, which may bias our results by over-estimating the H i sizes. We indicate spatially resolved galaxies with radii
$\Delta\,\rm{SFMS}$
, we include the Pearson correlations in Table 3. We indicate galaxies with upper limit derived SFRs by the left pointing arrows in panel c. A large fraction of our sample is marginally resolved, which may bias our results by over-estimating the H i sizes. We indicate spatially resolved galaxies with radii $>2$
beams in progressively darker shades of blue (galaxies with radii
$>2$
beams in progressively darker shades of blue (galaxies with radii $<2$
beams are in grey). There is no apparent correlation between the derived galaxy quantities and either poorly or well resolved galaxies and we conclude that spatial resolution is not introducing artificial correlations.
$<2$
beams are in grey). There is no apparent correlation between the derived galaxy quantities and either poorly or well resolved galaxies and we conclude that spatial resolution is not introducing artificial correlations.
The normalised isodensity H i radius correlates weakly with the stellar properties: $M_*$
and
$M_*$
and ${\unicode{x03BC}}_*$
(
${\unicode{x03BC}}_*$
( ${\unicode{x03C1}}=-0.26$
and
${\unicode{x03C1}}=-0.26$
and $-0.23$
, panels a and b). Galaxies with higher stellar masses and/or higher stellar surface densities tend to have marginally less extended H i discs for their optical sizes. The correlations are stronger between
$-0.23$
, panels a and b). Galaxies with higher stellar masses and/or higher stellar surface densities tend to have marginally less extended H i discs for their optical sizes. The correlations are stronger between $R_{\rm{iso,HI}}/R_{\rm{iso,r}}$
and sSFR (
$R_{\rm{iso,HI}}/R_{\rm{iso,r}}$
and sSFR ( ${\unicode{x03C1}}=0.45$
, panel c). The
${\unicode{x03C1}}=0.45$
, panel c). The $\mathrm{NUV}-r$
colour and
$\mathrm{NUV}-r$
colour and $\Delta\,\rm{SFMS}$
also show stronger correlations with
$\Delta\,\rm{SFMS}$
also show stronger correlations with $R_{\rm{iso,HI}}/R_{\rm{iso,r}}$
(see Table 3). These correlations indicate that galaxies with more extended H i reservoirs (relative to their stellar discs) tend to be more star forming. The weaker correlation with
$R_{\rm{iso,HI}}/R_{\rm{iso,r}}$
(see Table 3). These correlations indicate that galaxies with more extended H i reservoirs (relative to their stellar discs) tend to be more star forming. The weaker correlation with $\Delta\,\rm{SFMS}$
compared to sSFR indicates that the correlation between
$\Delta\,\rm{SFMS}$
compared to sSFR indicates that the correlation between $R_{\rm{iso,HI}}/R_{\rm{iso,r}}$
and
$R_{\rm{iso,HI}}/R_{\rm{iso,r}}$
and $M_*$
contributes to the strong correlation with sSFR as sSFR has a weak dependence on stellar mass (e.g. Figure 1). However, the weakened correlation with
$M_*$
contributes to the strong correlation with sSFR as sSFR has a weak dependence on stellar mass (e.g. Figure 1). However, the weakened correlation with $\Delta\,\rm{SFMS}$
may also be due to the bias of our galaxy sample toward star forming galaxies on or above the SFMS (i.e. we have poor statistics below the SFMS, see Section 3).
$\Delta\,\rm{SFMS}$
may also be due to the bias of our galaxy sample toward star forming galaxies on or above the SFMS (i.e. we have poor statistics below the SFMS, see Section 3).
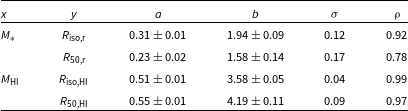
Parameters of the linear least-square regression best fit size–mass relations of the form $\log(y/\mathrm{kpc}) = a \log(x/\mathrm{M}_{\odot}) - b$
. The scatter in the relations and Pearson correlation coefficients are given by
$\log(y/\mathrm{kpc}) = a \log(x/\mathrm{M}_{\odot}) - b$
. The scatter in the relations and Pearson correlation coefficients are given by $\sigma$
and
$\sigma$
and ${\unicode{x03C1}}$
, respectively.
${\unicode{x03C1}}$
, respectively.

Switching to the EFF sample, we find that the correlations are sensitive to the chosen radius. The second and third row of Figure 3 show the correlations for the isodensity and effective normalised radii, respectively, measured for the same galaxies (see also Table 3). $R_{\rm{50,HI}}/R_{\rm{50,r}}$
shows positive correlations with
$R_{\rm{50,HI}}/R_{\rm{50,r}}$
shows positive correlations with $M_*$
and
$M_*$
and ${\unicode{x03BC}}_*$
(opposite to
${\unicode{x03BC}}_*$
(opposite to $R_{\rm{iso,HI}}/R_{\rm{iso,r}}$
), no significant correlations with sSFR or
$R_{\rm{iso,HI}}/R_{\rm{iso,r}}$
), no significant correlations with sSFR or $\mathrm{NUV}-r$
colour and a weaker positive correlation with
$\mathrm{NUV}-r$
colour and a weaker positive correlation with $\Delta\,\rm{SFMS}$
. The change in the correlations is not due to the smaller EFF sample size as the correlations with
$\Delta\,\rm{SFMS}$
. The change in the correlations is not due to the smaller EFF sample size as the correlations with $R_{\rm{iso,HI}}/R_{\rm{iso,r}}$
show only small changes for the EFF sample (panels d–f of Figure 3 and second row of Table 3). We note that some of the correlation between
$R_{\rm{iso,HI}}/R_{\rm{iso,r}}$
show only small changes for the EFF sample (panels d–f of Figure 3 and second row of Table 3). We note that some of the correlation between $R_{\rm{50,HI}}/R_{\rm{50,r}}$
and
$R_{\rm{50,HI}}/R_{\rm{50,r}}$
and ${\unicode{x03BC}}_*$
(Equation (2)) is due to the axes being correlated.
${\unicode{x03BC}}_*$
(Equation (2)) is due to the axes being correlated.
This raises the question of what causes the correlations to invert ( $M_*$
and
$M_*$
and ${\unicode{x03BC}}_*$
) or be removed (star formation) between isodensity/isophotal and effective radii measured in the H i and r-band. As discussed in Section 4.1, galaxies’ effective H i and r-band radii increase at different rates with H i/stellar mass relative to their isodensity/isophotal radii (Figure 2, Table 2). As a result, the effective size relative to the isodensity/isophotal size of the H i/r-band disc changes with mass. The difference between
${\unicode{x03BC}}_*$
) or be removed (star formation) between isodensity/isophotal and effective radii measured in the H i and r-band. As discussed in Section 4.1, galaxies’ effective H i and r-band radii increase at different rates with H i/stellar mass relative to their isodensity/isophotal radii (Figure 2, Table 2). As a result, the effective size relative to the isodensity/isophotal size of the H i/r-band disc changes with mass. The difference between $R_{\rm{50,HI}}$
and
$R_{\rm{50,HI}}$
and $R_{\rm{iso,HI}}$
(
$R_{\rm{iso,HI}}$
( $\Delta R_{\rm{HI}}$
) at
$\Delta R_{\rm{HI}}$
) at $M_{\mathrm{HI}}=10^{8}$
vs
$M_{\mathrm{HI}}=10^{8}$
vs $10^{10}\,\mathrm{M}_{\odot}$
is
$10^{10}\,\mathrm{M}_{\odot}$
is $\Delta R_{\rm{HI}}=0.29$
vs 0.21 dex, respectively. In contrast, in the r-band, the relative difference is
$\Delta R_{\rm{HI}}=0.29$
vs 0.21 dex, respectively. In contrast, in the r-band, the relative difference is $\Delta R_{\rm{r}}=0.28$
vs 0.44 dex (at
$\Delta R_{\rm{r}}=0.28$
vs 0.44 dex (at $M_{\mathrm{*}}=10^{8}$
vs
$M_{\mathrm{*}}=10^{8}$
vs $10^{10}\,\mathrm{M}_{\odot}$
, respectively). We conclude that the switch from normalising by the isophotal to effective r-band radius is responsible for the inverted/removed correlations with
$10^{10}\,\mathrm{M}_{\odot}$
, respectively). We conclude that the switch from normalising by the isophotal to effective r-band radius is responsible for the inverted/removed correlations with $R_{\rm{50,HI}}/R_{\rm{50,r}}$
. Galaxies with higher stellar masses, which tend to have higher
$R_{\rm{50,HI}}/R_{\rm{50,r}}$
. Galaxies with higher stellar masses, which tend to have higher ${\unicode{x03BC}}_*$
and lower levels of star formation (Figure 1), have larger
${\unicode{x03BC}}_*$
and lower levels of star formation (Figure 1), have larger $R_{\rm{50,HI}}/R_{\rm{50,r}}$
than
$R_{\rm{50,HI}}/R_{\rm{50,r}}$
than $R_{\rm{iso,HI}}/R_{\rm{iso,r}}$
.
$R_{\rm{iso,HI}}/R_{\rm{iso,r}}$
.
4.3. The HI surface density
The trends that we find with the normalised H i disc size in Section 4.2 depend on the choice of isophotal or effective r-band radius, which are linked to $M_*$
and
$M_*$
and ${\unicode{x03BC}}_*$
. To remove this dependence and investigate the interplay between H i structure and galaxy properties directly, we measure the H i surface density,
${\unicode{x03BC}}_*$
. To remove this dependence and investigate the interplay between H i structure and galaxy properties directly, we measure the H i surface density, ${\unicode{x03BC}}_{\rm{HI}}$
, within apertures defined by the effective and isodensity radii. Similarly to
${\unicode{x03BC}}_{\rm{HI}}$
, within apertures defined by the effective and isodensity radii. Similarly to $R_{\rm{iso,HI}}/R_{\rm{iso,r}}$
, we investigate the variation in the isodensity
$R_{\rm{iso,HI}}/R_{\rm{iso,r}}$
, we investigate the variation in the isodensity ${\unicode{x03BC}}_{\rm{iso,HI}}$
as a function of
${\unicode{x03BC}}_{\rm{iso,HI}}$
as a function of $M_*$
,
$M_*$
, ${\unicode{x03BC}}_*$
and sSFR in panels a–c of Figure 4 for the ISO sample. We show the Pearson correlation coefficients in the upper right corner of each panel of Figure 4 and list them in the fourth row of Table 3.
${\unicode{x03BC}}_*$
and sSFR in panels a–c of Figure 4 for the ISO sample. We show the Pearson correlation coefficients in the upper right corner of each panel of Figure 4 and list them in the fourth row of Table 3.
The H i radius normalised by the r-band radius ( $R_{\rm{HI}}/R_{\rm{r}}$
) plotted against stellar mass (
$R_{\rm{HI}}/R_{\rm{r}}$
) plotted against stellar mass ( $M_*$
), stellar mass surface density (
$M_*$
), stellar mass surface density ( ${\unicode{x03BC}}_*$
) and specific star formation rate (sSFR; columns from left to right, respectively). The top row shows the normalised isodensity H i disc size (
${\unicode{x03BC}}_*$
) and specific star formation rate (sSFR; columns from left to right, respectively). The top row shows the normalised isodensity H i disc size ( $R_{\rm{iso,HI}}/R_{\rm{iso,r}}$
) for the ISO sample. The middle row shows
$R_{\rm{iso,HI}}/R_{\rm{iso,r}}$
) for the ISO sample. The middle row shows $R_{\rm{iso,HI}}/R_{\rm{iso,r}}$
for the EFF sample. The bottom row shows the normalised effective H i disc size (
$R_{\rm{iso,HI}}/R_{\rm{iso,r}}$
for the EFF sample. The bottom row shows the normalised effective H i disc size ( $R_{\rm{50,HI}}/R_{\rm{50,r}}$
) for the EFF sample. The corresponding Pearson correlation coefficients (top right corner of each panel) are tabulated in the first three rows of Table 3. The symbols are coloured by the radius expressed in terms of the number of beams (e.g.
$R_{\rm{50,HI}}/R_{\rm{50,r}}$
) for the EFF sample. The corresponding Pearson correlation coefficients (top right corner of each panel) are tabulated in the first three rows of Table 3. The symbols are coloured by the radius expressed in terms of the number of beams (e.g. $R_{\mathrm{iso,HI}}=60$
arcsec is 2 beams). The black squares show binned medians with the error bars showing the 20
$R_{\mathrm{iso,HI}}=60$
arcsec is 2 beams). The black squares show binned medians with the error bars showing the 20 $^{\rm{th}}$
and 80
$^{\rm{th}}$
and 80 $^{\rm{th}}$
percentiles (all bins contain
$^{\rm{th}}$
percentiles (all bins contain $>5$
galaxies). In the right column (sSFR), we indicate galaxies whose sSFRs are upper limits by left pointing arrows.
$>5$
galaxies). In the right column (sSFR), we indicate galaxies whose sSFRs are upper limits by left pointing arrows.
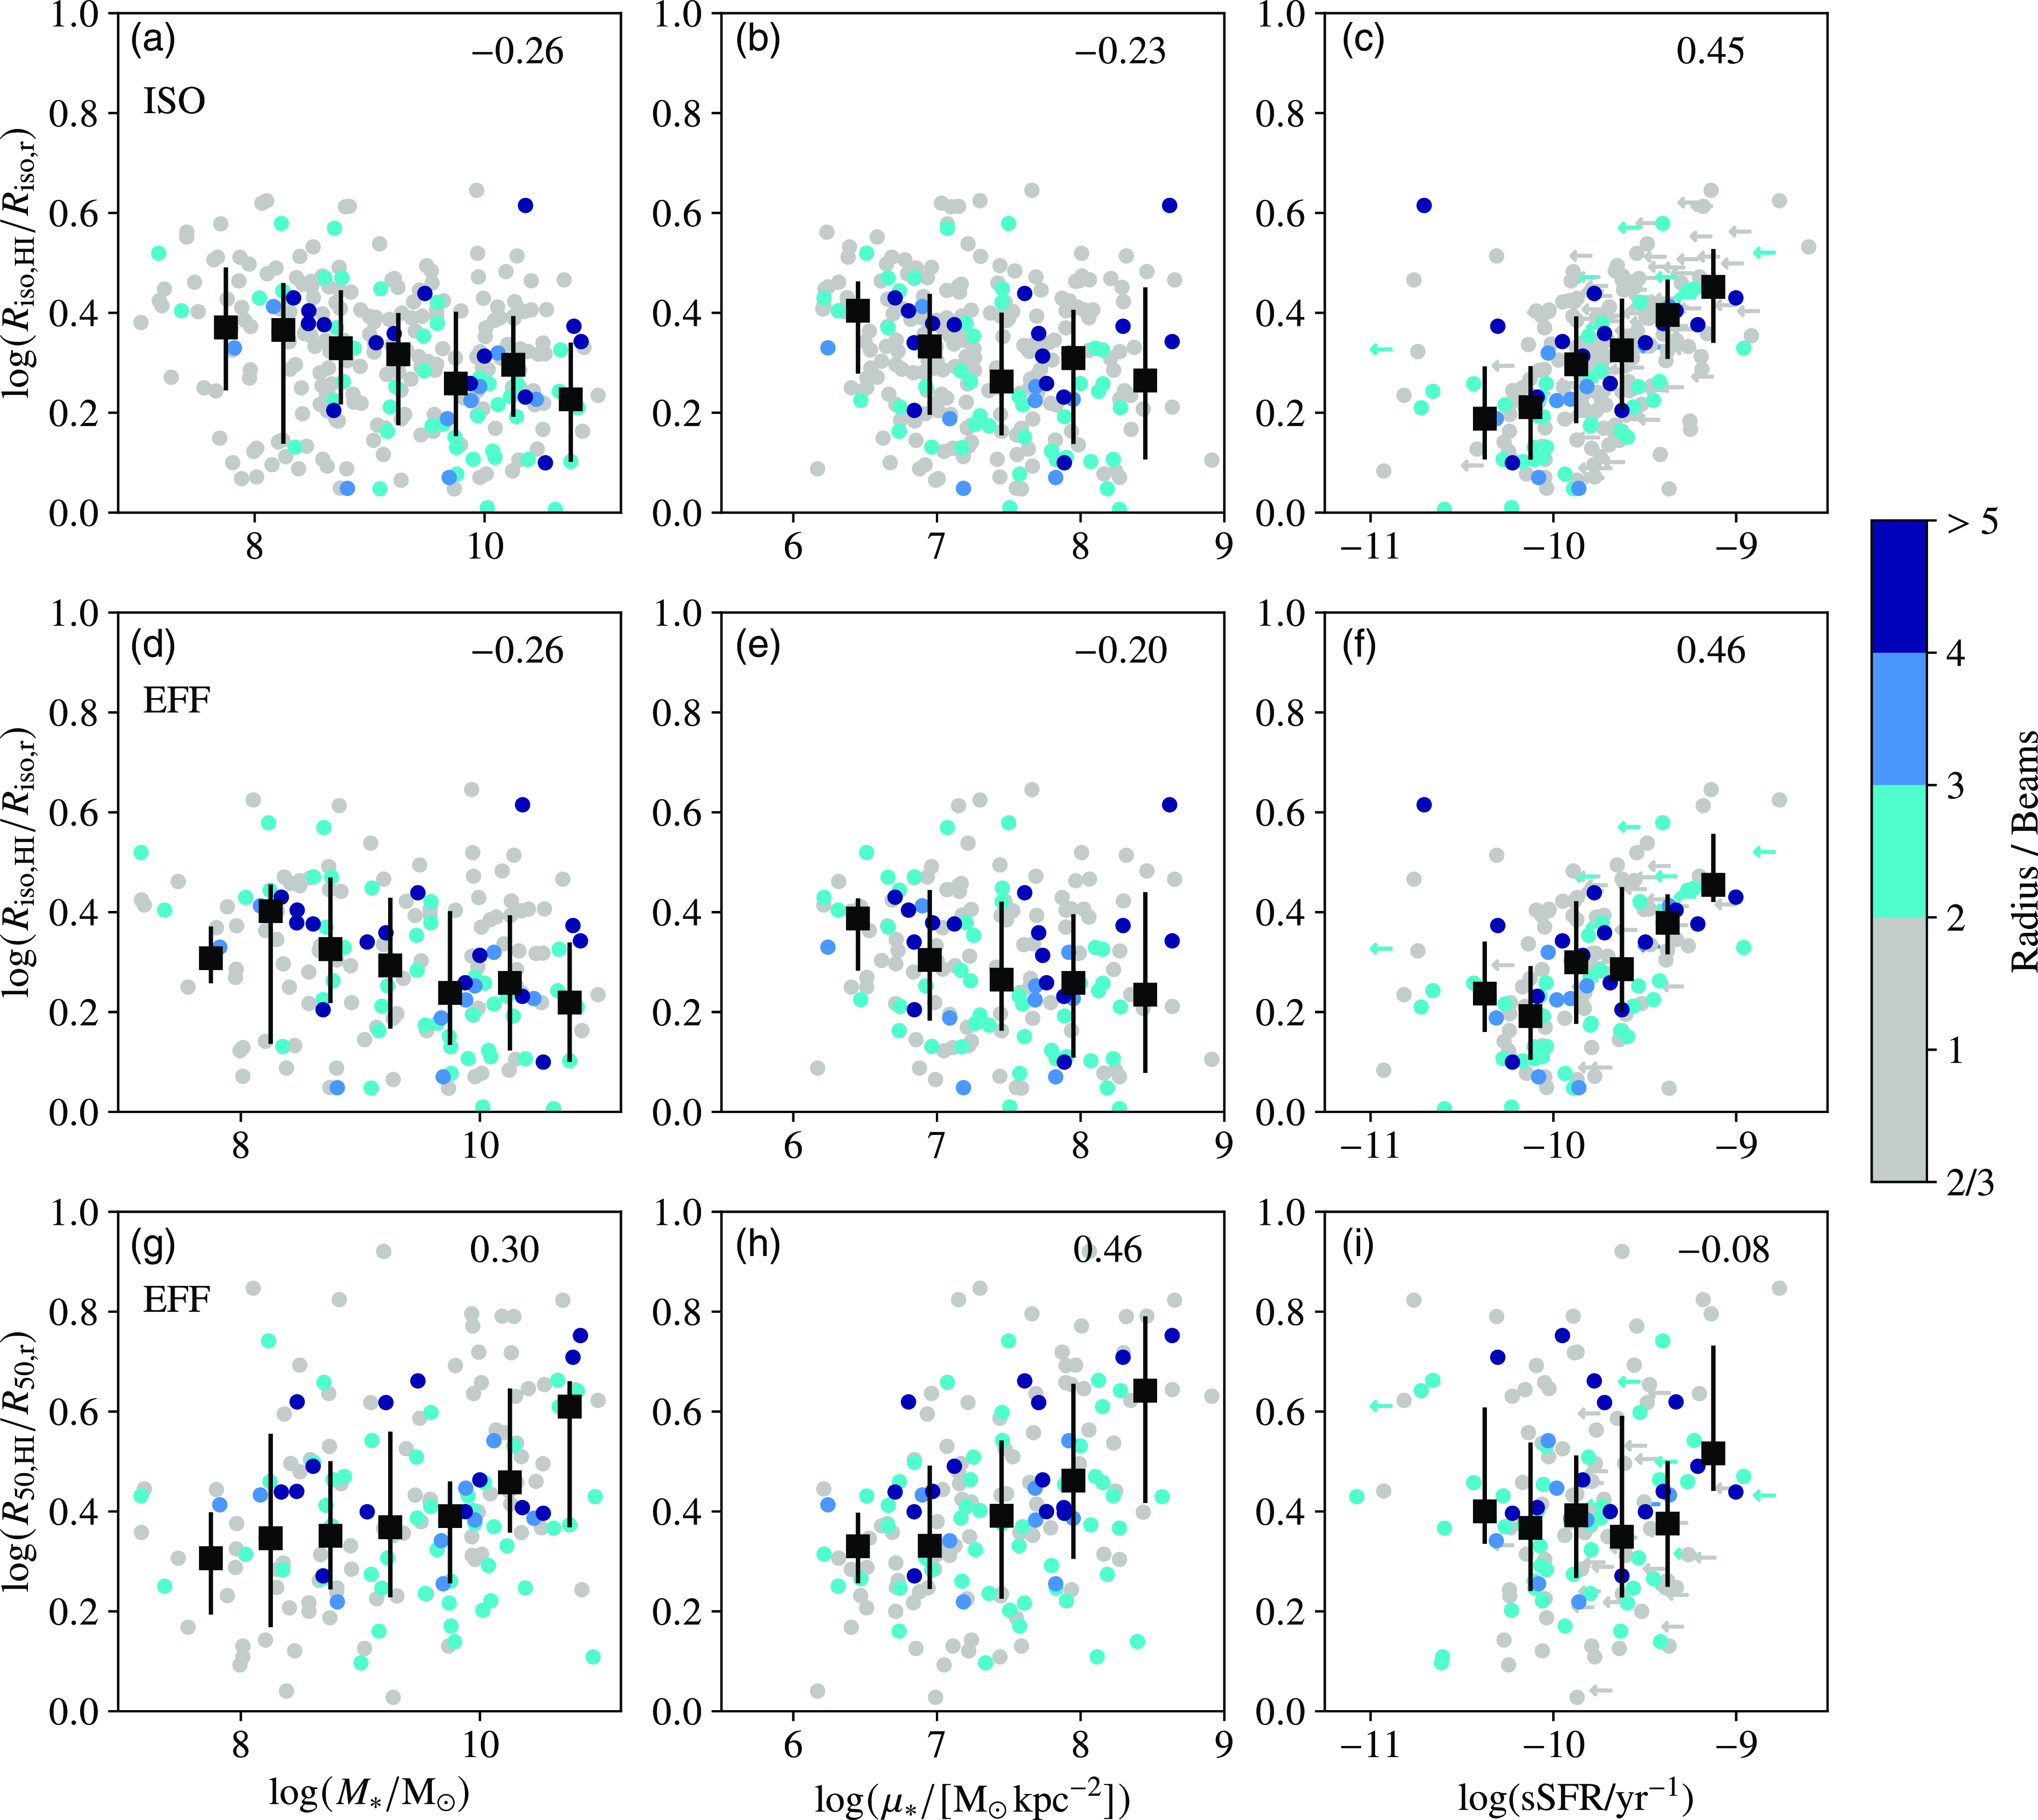
We find that galaxies with $M_*>10^{9}\,\mathrm{M}_{\odot}$
and/or
$M_*>10^{9}\,\mathrm{M}_{\odot}$
and/or ${\unicode{x03BC}}_*>10^{7}\,\mathrm{M}_{\odot}\,\mathrm{kpc}^{-2}$
tend to have marginally lower H i surface densities (i.e. where the median
${\unicode{x03BC}}_*>10^{7}\,\mathrm{M}_{\odot}\,\mathrm{kpc}^{-2}$
tend to have marginally lower H i surface densities (i.e. where the median ${\unicode{x03BC}}_{\rm{iso,HI}}$
values decrease in panels a and b;
${\unicode{x03BC}}_{\rm{iso,HI}}$
values decrease in panels a and b; ${\unicode{x03C1}}=-0.37$
and
${\unicode{x03C1}}=-0.37$
and $-0.32$
, respectively), while there is no trend with
$-0.32$
, respectively), while there is no trend with ${\unicode{x03BC}}_{\rm{iso,HI}}$
for galaxies with lower stellar masses and mass surface densities. Galaxies with higher levels of star formation have higher H i surface densities and these correlations strengthen if we only consider galaxies within
${\unicode{x03BC}}_{\rm{iso,HI}}$
for galaxies with lower stellar masses and mass surface densities. Galaxies with higher levels of star formation have higher H i surface densities and these correlations strengthen if we only consider galaxies within $\pm0.5$
dex above/below the SFMS (
$\pm0.5$
dex above/below the SFMS ( ${\unicode{x03C1}}=0.37$
,
${\unicode{x03C1}}=0.37$
, $-0.35$
and 0.26 for sSFR,
$-0.35$
and 0.26 for sSFR, $\mathrm{NUV}-r$
colour and
$\mathrm{NUV}-r$
colour and $\Delta\,\rm{SFMS}$
, respectively). Star formation shows weaker correlation with
$\Delta\,\rm{SFMS}$
, respectively). Star formation shows weaker correlation with ${\unicode{x03BC}}_{\rm{iso,HI}}$
than with
${\unicode{x03BC}}_{\rm{iso,HI}}$
than with $R_{\rm{iso,HI}}/R_{\rm{iso,r}}$
.
$R_{\rm{iso,HI}}/R_{\rm{iso,r}}$
.
A possible explanation for the weak correlations of $M_*$
,
$M_*$
, ${\unicode{x03BC}}_*$
and sSFR with
${\unicode{x03BC}}_*$
and sSFR with ${\unicode{x03BC}}_{\rm{iso,HI}}$
is that this averages the H i surface density over the entire H i disc, which is not well matched to the optical/star-forming disc (i.e.
${\unicode{x03BC}}_{\rm{iso,HI}}$
is that this averages the H i surface density over the entire H i disc, which is not well matched to the optical/star-forming disc (i.e. $\langle R_{\rm{iso,HI}}/R_{\rm{iso,r}}\rangle = 2.1$
). Hence, we expect to find stronger correlations within the effective radius for
$\langle R_{\rm{iso,HI}}/R_{\rm{iso,r}}\rangle = 2.1$
). Hence, we expect to find stronger correlations within the effective radius for ${\unicode{x03BC}}_{\rm{50,HI}}$
, which more closely traces the H i within the optical disc (i.e.
${\unicode{x03BC}}_{\rm{50,HI}}$
, which more closely traces the H i within the optical disc (i.e. $\langle R_{\rm{50,HI}}/R_{\rm{iso,r}}\rangle = 1.2$
) and is co-located with recent star formation. We measure the correlations with the effective
$\langle R_{\rm{50,HI}}/R_{\rm{iso,r}}\rangle = 1.2$
) and is co-located with recent star formation. We measure the correlations with the effective ${\unicode{x03BC}}_{\rm{50,HI}}$
for the EFF sample (panels g–i of Figure 4). Although we find stronger correlations between
${\unicode{x03BC}}_{\rm{50,HI}}$
for the EFF sample (panels g–i of Figure 4). Although we find stronger correlations between ${\unicode{x03BC}}_{\rm{50,HI}}$
and the five galaxy properties (see the sixth row of Table 3), we find similarly strengthened correlations with the isodensity
${\unicode{x03BC}}_{\rm{50,HI}}$
and the five galaxy properties (see the sixth row of Table 3), we find similarly strengthened correlations with the isodensity ${\unicode{x03BC}}_{\rm{iso,HI}}$
for the EFF sample (panels d–f of Figure 4 and the fifth row of Table 3). Comparing the lower two rows also highlights that
${\unicode{x03BC}}_{\rm{iso,HI}}$
for the EFF sample (panels d–f of Figure 4 and the fifth row of Table 3). Comparing the lower two rows also highlights that ${\unicode{x03BC}}_{\rm{50,HI}}$
has nearly twice the dynamic range of
${\unicode{x03BC}}_{\rm{50,HI}}$
has nearly twice the dynamic range of ${\unicode{x03BC}}_{\rm{iso,HI}}$
(i.e.
${\unicode{x03BC}}_{\rm{iso,HI}}$
(i.e. ${\unicode{x03BC}}_{\rm{50,HI,max}}\lesssim10$
vs
${\unicode{x03BC}}_{\rm{50,HI,max}}\lesssim10$
vs ${\unicode{x03BC}}_{\rm{iso,HI,max}}\lesssim5\,\mathrm{M}_{\odot}\,\mathrm{pc}^{-2}$
). The reduced dynamic range of
${\unicode{x03BC}}_{\rm{iso,HI,max}}\lesssim5\,\mathrm{M}_{\odot}\,\mathrm{pc}^{-2}$
). The reduced dynamic range of ${\unicode{x03BC}}_{\rm{iso,HI}}$
is due to the exponential decline of the radial profile beyond
${\unicode{x03BC}}_{\rm{iso,HI}}$
is due to the exponential decline of the radial profile beyond $r \gtrsim R_{\mathrm{50,HI}}$
.
$r \gtrsim R_{\mathrm{50,HI}}$
.
The strengthened ${\unicode{x03BC}}_{\rm{iso,HI}}$
correlations for the EFF sample suggest that galaxies with poor spatial resolution (i.e.
${\unicode{x03BC}}_{\rm{iso,HI}}$
correlations for the EFF sample suggest that galaxies with poor spatial resolution (i.e. $R_{\mathrm{50,HI}}<20$
arcsec) are responsible for weakening the correlations in the ISO sample. This also explains the stronger correlations that we find above
$R_{\mathrm{50,HI}}<20$
arcsec) are responsible for weakening the correlations in the ISO sample. This also explains the stronger correlations that we find above $M_*>10^{9}\,\mathrm{M}_{\odot}$
and
$M_*>10^{9}\,\mathrm{M}_{\odot}$
and ${\unicode{x03BC}}_*>10^{7}\,\mathrm{M}_{\odot}\,\mathrm{kpc}^{-2}$
in the ISO sample. A larger fraction of these more massive galaxies are resolved by
${\unicode{x03BC}}_*>10^{7}\,\mathrm{M}_{\odot}\,\mathrm{kpc}^{-2}$
in the ISO sample. A larger fraction of these more massive galaxies are resolved by $>$
4 beams (e.g.
$>$
4 beams (e.g. $\sim$
5% vs
$\sim$
5% vs $\sim$
30% of galaxies with
$\sim$
30% of galaxies with $M_*<10^{9}\,\mathrm{M}_{\odot}$
and
$M_*<10^{9}\,\mathrm{M}_{\odot}$
and $M_*>10^{9}\,\mathrm{M}_{\odot}$
, respectively). Hence, compared to the normalised H i disc size, correlations with the H i surface density are more sensitive to the spatial resolution of the observations (i.e.
$M_*>10^{9}\,\mathrm{M}_{\odot}$
, respectively). Hence, compared to the normalised H i disc size, correlations with the H i surface density are more sensitive to the spatial resolution of the observations (i.e. ${\unicode{x03BC}}_{\rm{HI}}$
is less well constrained in marginally resolved sources).
${\unicode{x03BC}}_{\rm{HI}}$
is less well constrained in marginally resolved sources).
5. Discussion
Our results show that galaxies with more extended H i discs relative to their isophotal optical discs and higher H i surface densities (measured within the isodensity H i radius) tend to be more star forming. We find weaker correlations with stellar masses and stellar mass surface densities, which shows that galaxies with higher $M_*$
and/or
$M_*$
and/or ${\unicode{x03BC}}_*$
tend to have less extended H i discs and lower H i surface densities. Limiting our sample to better spatially resolved galaxies strengthens the correlations with the H i surface density and we find similar results if we measure the H i surface density within the effective H i radius. We find that normalising the H i disc radius by the optical effective radius inverts or removes correlations compared to using the optical isophotal radius: galaxies with higher
${\unicode{x03BC}}_*$
tend to have less extended H i discs and lower H i surface densities. Limiting our sample to better spatially resolved galaxies strengthens the correlations with the H i surface density and we find similar results if we measure the H i surface density within the effective H i radius. We find that normalising the H i disc radius by the optical effective radius inverts or removes correlations compared to using the optical isophotal radius: galaxies with higher $M_*$
and/or
$M_*$
and/or ${\unicode{x03BC}}_*$
tend to have more extended H i discs and there are no correlations with star formation.
${\unicode{x03BC}}_*$
tend to have more extended H i discs and there are no correlations with star formation.
There are different possible pathways to introduce the diversity in the inner H i surface densities and the relative sizes of the H i discs that we find. Variations may be due to physical processes acting within a galaxy (e.g. conversion from H i to H $_2$
and subsequent star formation, inflow of gas towards the inner star forming disc, ejection of gas by internal feedback), interactions between galaxies and the environment (e.g galaxy mergers, Toomre & Toomre Reference Toomre and Toomre1972; tidal stripping, Gunn & Gott Reference Gunn and Gott1972; or ram pressure stripping, Moore et al. Reference Moore, Katz, Lake, Dressler and Oemler1996, Reference Moore, Lake, Quinn and Stadel1999; see also Cortese, Catinella, & Smith Reference Cortese, Catinella and Smith2021 for a recent review) or may be encoded into the galaxy as it forms (i.e. during the initial collapse of gas to form a disc if the gas is more evenly distributed or centrally concentrated). We discuss physical processes that may be responsible for the correlations that we find and how our results compare to previous work.
$_2$
and subsequent star formation, inflow of gas towards the inner star forming disc, ejection of gas by internal feedback), interactions between galaxies and the environment (e.g galaxy mergers, Toomre & Toomre Reference Toomre and Toomre1972; tidal stripping, Gunn & Gott Reference Gunn and Gott1972; or ram pressure stripping, Moore et al. Reference Moore, Katz, Lake, Dressler and Oemler1996, Reference Moore, Lake, Quinn and Stadel1999; see also Cortese, Catinella, & Smith Reference Cortese, Catinella and Smith2021 for a recent review) or may be encoded into the galaxy as it forms (i.e. during the initial collapse of gas to form a disc if the gas is more evenly distributed or centrally concentrated). We discuss physical processes that may be responsible for the correlations that we find and how our results compare to previous work.
Pearson correlation coefficients, ${\unicode{x03C1}}$
, and p-values (in brackets) for the isodensity and effective
${\unicode{x03C1}}$
, and p-values (in brackets) for the isodensity and effective $R_{\rm{HI}}/R_{\rm{r}}$
and
$R_{\rm{HI}}/R_{\rm{r}}$
and ${\unicode{x03BC}}_{\rm{HI}}$
as functions of
${\unicode{x03BC}}_{\rm{HI}}$
as functions of $M_*$
,
$M_*$
, ${\unicode{x03BC}}_*$
, sSFR,
${\unicode{x03BC}}_*$
, sSFR, $\mathrm{NUV}-r$
colour and
$\mathrm{NUV}-r$
colour and $\Delta\,\rm{SFMS}$
(See Figures 3 and 4). The number of galaxies used to measure the Pearson correlations is given by N.
$\Delta\,\rm{SFMS}$
(See Figures 3 and 4). The number of galaxies used to measure the Pearson correlations is given by N.


Several studies in the literature find links between variations of galaxies’ H i radial profiles and stellar structure quantified by morphological type (e.g. Broeils & Rhee Reference Broeils and Rhee1997; Cayatte et al. Reference Cayatte, Kotanyi, Balkowski and van Gorkom1994; Swaters et al. Reference Swaters, van Albada, van der Hulst and Sancisi2002; Noordermeer et al. Reference Noordermeer, van der Hulst, Sancisi, Swaters and van Albada2005) and stellar properties (e.g. Wang et al. Reference Wang2013, Reference Wang2014). In particular, Wang et al. (Reference Wang2013) find stronger negative correlations between $R_{\rm{iso,HI}}/R_{\rm{iso,r}}$
and
$R_{\rm{iso,HI}}/R_{\rm{iso,r}}$
and $M_*$
and
$M_*$
and ${\unicode{x03BC}}_*$
(
${\unicode{x03BC}}_*$
( ${\unicode{x03C1}}=-0.44$
and
${\unicode{x03C1}}=-0.44$
and $-0.31$
, respectively) in the Bluedisk galaxy sample (driven by low gas fraction galaxies), than we find in this work. Our results indicate that galaxies’ stellar structure (i.e.
$-0.31$
, respectively) in the Bluedisk galaxy sample (driven by low gas fraction galaxies), than we find in this work. Our results indicate that galaxies’ stellar structure (i.e. $M_*$
and
$M_*$
and ${\unicode{x03BC}}_*$
; traced by emission in the g- and r-band) plays a smaller role in regulating how H i is distributed than suggested by previous studies.
${\unicode{x03BC}}_*$
; traced by emission in the g- and r-band) plays a smaller role in regulating how H i is distributed than suggested by previous studies.
Contributing to our differing results are the observation bias to preferentially detect gas-rich galaxies (Section 3 and Figure 1) and the limited spatial resolution. Compared to previous work, which used high spatial resolution observations, $\sim$
75% of our galaxies are marginally resolved (e.g.
$\sim$
75% of our galaxies are marginally resolved (e.g. $\gtrsim$
10 vs
$\gtrsim$
10 vs $<$
4 beams across the H i disc, respectively). Hence, we are insensitive to the impact from the centre of the stellar/star-forming disc in our poorly resolved galaxies. Our results are similar to the findings based on estimated
$<$
4 beams across the H i disc, respectively). Hence, we are insensitive to the impact from the centre of the stellar/star-forming disc in our poorly resolved galaxies. Our results are similar to the findings based on estimated ${\unicode{x03BC}}_{\rm{HI}}$
within the optical disc (
${\unicode{x03BC}}_{\rm{HI}}$
within the optical disc ( $R_{90}$
) and
$R_{90}$
) and $R_{\rm{iso,HI}}/R_{\rm{iso,r}}$
for xGASS disc galaxies (i.e. no spatial information is present in their H i data) from Wang et al. (Reference Wang2020) and Pan et al. (Reference Pan, Wang, Zheng and Kong2021), respectively.
$R_{\rm{iso,HI}}/R_{\rm{iso,r}}$
for xGASS disc galaxies (i.e. no spatial information is present in their H i data) from Wang et al. (Reference Wang2020) and Pan et al. (Reference Pan, Wang, Zheng and Kong2021), respectively.
As expected, our results show that the H i structural parameters are more sensitive to the star formation quantities sSFR and $\mathrm{NUV}-r$
colour than to
$\mathrm{NUV}-r$
colour than to $M_*$
and
$M_*$
and ${\unicode{x03BC}}_*$
, since H i is the raw fuel for future star formation and H i and SFR surface densities are found to be correlated (e.g. Bigiel et al. Reference Bigiel2010; Wang et al. Reference Wang2017). Wang et al. (Reference Wang2014) find similar results in the Bluedisk survey with larger differences in the median H i surface density profiles within
${\unicode{x03BC}}_*$
, since H i is the raw fuel for future star formation and H i and SFR surface densities are found to be correlated (e.g. Bigiel et al. Reference Bigiel2010; Wang et al. Reference Wang2017). Wang et al. (Reference Wang2014) find similar results in the Bluedisk survey with larger differences in the median H i surface density profiles within $\sim$ $0.5R_{\rm{iso,HI}}$
as a function of star forming properties than with
$0.5R_{\rm{iso,HI}}$
as a function of star forming properties than with $M_*$
and
$M_*$
and ${\unicode{x03BC}}_*$
. The correlations that we find with
${\unicode{x03BC}}_*$
. The correlations that we find with $\Delta\,\rm{SFMS}$
are weaker than with sSFR and
$\Delta\,\rm{SFMS}$
are weaker than with sSFR and $\mathrm{NUV}-r$
colour (i.e. when controlling for stellar mass), but are in general agreement with the results of Wang et al. (Reference Wang2020).
$\mathrm{NUV}-r$
colour (i.e. when controlling for stellar mass), but are in general agreement with the results of Wang et al. (Reference Wang2020).
We find that the H i structural parameters show a weaker dependence on the stellar and star formation quantities ( $M_*$
,
$M_*$
, ${\unicode{x03BC}}_*$
, sSFR and
${\unicode{x03BC}}_*$
, sSFR and $\mathrm{NUV}-r$
) than the H i gas fraction (
$\mathrm{NUV}-r$
) than the H i gas fraction ( $M_{\mathrm{HI}}/M_*$
) for a control xGASS sample (
$M_{\mathrm{HI}}/M_*$
) for a control xGASS sample ( ${\unicode{x03C1}}=-0.83$
,
${\unicode{x03C1}}=-0.83$
, $-0.73$
,
$-0.73$
, $0.69$
and
$0.69$
and $-0.78$
, respectively, where we have taken a subsample from xGASS with
$-0.78$
, respectively, where we have taken a subsample from xGASS with $M_{\mathrm{HI}}/M_*$
above the xGASS medians and sSFR
$M_{\mathrm{HI}}/M_*$
above the xGASS medians and sSFR $>2\sigma$
below the xGASS SFMS from Janowiecki et al. Reference Janowiecki, Catinella, Cortese, Saintonge and Wang2020, i.e. galaxies comparable to our WALLABY sample). We find that the median
$>2\sigma$
below the xGASS SFMS from Janowiecki et al. Reference Janowiecki, Catinella, Cortese, Saintonge and Wang2020, i.e. galaxies comparable to our WALLABY sample). We find that the median $M_{\mathrm{HI}}/M_*$
decreases by
$M_{\mathrm{HI}}/M_*$
decreases by $\sim$
1 dex across 2 dex in stellar mass from
$\sim$
1 dex across 2 dex in stellar mass from $M_*=10^{9}$
–
$M_*=10^{9}$
– $10^{11}\,{\rm M}_{\odot}$
. In contrast, over
$10^{11}\,{\rm M}_{\odot}$
. In contrast, over $\sim$
3 dex from
$\sim$
3 dex from $M_*=10^{8}$
–
$M_*=10^{8}$
– $10^{11}\,{\rm M}_{\odot}$
,
$10^{11}\,{\rm M}_{\odot}$
, ${\unicode{x03BC}}_{\rm{iso,HI}}$
and
${\unicode{x03BC}}_{\rm{iso,HI}}$
and $R_{\rm{iso,HI}}/R_{\rm{iso,r}}$
both vary by
$R_{\rm{iso,HI}}/R_{\rm{iso,r}}$
both vary by $\sim$ $0.2$
dex. This indicates that, while the relative amount of H i decreases as
$0.2$
dex. This indicates that, while the relative amount of H i decreases as $M_*$
and
$M_*$
and ${\unicode{x03BC}}_*$
increase and the level of star formation decreases, the H i surface density and the H i disc size relative to that of the optical disc vary little for the average galaxy. However, the scatter (
${\unicode{x03BC}}_*$
increase and the level of star formation decreases, the H i surface density and the H i disc size relative to that of the optical disc vary little for the average galaxy. However, the scatter ( $\sim$ $0.1$
dex) in the H i structural parameters indicates that there is significant galaxy-to-galaxy variation in
$0.1$
dex) in the H i structural parameters indicates that there is significant galaxy-to-galaxy variation in ${\unicode{x03BC}}_{\rm{iso,HI}}$
and
${\unicode{x03BC}}_{\rm{iso,HI}}$
and $R_{\rm{iso,HI}}/R_{\rm{iso,r}}$
. Some of this scatter is due to effects of low spatial resolution for many galaxies in our sample (Section 2.1), however there are physical mechanisms that are also likely contributing, which we discuss below.
$R_{\rm{iso,HI}}/R_{\rm{iso,r}}$
. Some of this scatter is due to effects of low spatial resolution for many galaxies in our sample (Section 2.1), however there are physical mechanisms that are also likely contributing, which we discuss below.
Our sample contains galaxies in a range of environments: field galaxies and galaxies in and around the Hydra cluster and NGC 4636 galaxy group. Reynolds et al. (Reference Reynolds2022) show that, compared to field galaxies, Hydra cluster members have smaller normalised H i discs (i.e. median H i to optical r-band diameter ratios of 3.5 vs 1.9) and conclude that this H i disc truncation is likely due to ram pressure stripping, which Wang et al. (Reference Wang2021) identify as impacting many galaxies detected by WALLABY in the Hydra cluster. Hence, some of the scatter present in $R_{\rm{iso,HI}}/R_{\rm{iso,r}}$
is due to environmental processes (e.g. ram pressure stripping, which is also observed in group environments, Rasmussen et al. Reference Rasmussen, Ponman and Mulchaey2006; Westmeier, Braun, & Koribalski Reference Westmeier, Braun and Koribalski2011; Rasmussen et al. Reference Rasmussen2012; Cortese et al. Reference Cortese, Catinella and Smith2021). The scatter in
$R_{\rm{iso,HI}}/R_{\rm{iso,r}}$
is due to environmental processes (e.g. ram pressure stripping, which is also observed in group environments, Rasmussen et al. Reference Rasmussen, Ponman and Mulchaey2006; Westmeier, Braun, & Koribalski Reference Westmeier, Braun and Koribalski2011; Rasmussen et al. Reference Rasmussen2012; Cortese et al. Reference Cortese, Catinella and Smith2021). The scatter in ${\unicode{x03BC}}_{\rm{iso,HI}}$
is similar to that of
${\unicode{x03BC}}_{\rm{iso,HI}}$
is similar to that of $R_{\rm{iso,HI}}/R_{\rm{iso,r}}$
(
$R_{\rm{iso,HI}}/R_{\rm{iso,r}}$
( $\sim$ $0.1$
dex). Ram pressure stripping likely has less impact on
$0.1$
dex). Ram pressure stripping likely has less impact on ${\unicode{x03BC}}_{\rm{iso,HI}}$
and contributes less to the observed scatter as H i is preferentially stripped from a galaxy’s outskirts and, for the galaxy sample detected by WALLABY, does not impact star formation or H i within the optical disc (e.g. as shown by Reynolds et al. Reference Reynolds2022). Hence ram pressure stripping is likely to be a second-order effect. Galaxy mergers and tidal stripping are unlikely to affect many galaxies in our sample as we see no obvious signs of disturbances in the optical images and we exclude systems with multiple optical counterparts contained within the H i envelope of each detection (Section 3).
${\unicode{x03BC}}_{\rm{iso,HI}}$
and contributes less to the observed scatter as H i is preferentially stripped from a galaxy’s outskirts and, for the galaxy sample detected by WALLABY, does not impact star formation or H i within the optical disc (e.g. as shown by Reynolds et al. Reference Reynolds2022). Hence ram pressure stripping is likely to be a second-order effect. Galaxy mergers and tidal stripping are unlikely to affect many galaxies in our sample as we see no obvious signs of disturbances in the optical images and we exclude systems with multiple optical counterparts contained within the H i envelope of each detection (Section 3).
H i does not form stars directly, but via conversion to H $_2$
, which likely contributes to several of our results. Assuming no interactions, mergers or gas replenishment, the conversion of H i to H
$_2$
, which likely contributes to several of our results. Assuming no interactions, mergers or gas replenishment, the conversion of H i to H $_2$
in the galaxies’ inner regions has little effect on
$_2$
in the galaxies’ inner regions has little effect on $R_{\rm{iso,HI}}/R_{\rm{iso,r}}$
, which can explain the stronger correlations that we find with
$R_{\rm{iso,HI}}/R_{\rm{iso,r}}$
, which can explain the stronger correlations that we find with $R_{\rm{iso,HI}}/R_{\rm{iso,r}}$
compared to
$R_{\rm{iso,HI}}/R_{\rm{iso,r}}$
compared to ${\unicode{x03BC}}_{\rm{HI}}$
with star formation. The stellar disc grows and the H i surface density decreases as the gas is consumed, which leads to lowering the level of star formation. If there is no further accretion of H i, then the relative size of the H i disc decreases.
${\unicode{x03BC}}_{\rm{HI}}$
with star formation. The stellar disc grows and the H i surface density decreases as the gas is consumed, which leads to lowering the level of star formation. If there is no further accretion of H i, then the relative size of the H i disc decreases.
The conversion of H i to H $_2$
likely has a greater impact on our results with the H i surface density as
$_2$
likely has a greater impact on our results with the H i surface density as ${\unicode{x03BC}}_{\rm{HI}}$
provides an incomplete picture of the gas within the disc (e.g. Lee et al. Reference Lee2022 detect CO, a proxy for H
${\unicode{x03BC}}_{\rm{HI}}$
provides an incomplete picture of the gas within the disc (e.g. Lee et al. Reference Lee2022 detect CO, a proxy for H $_2$
, in a sample of 10 galaxies in the NGC 4636 group above
$_2$
, in a sample of 10 galaxies in the NGC 4636 group above $M_*>10^{9}\,\mathrm{M}_{\odot}$
). To first order, below
$M_*>10^{9}\,\mathrm{M}_{\odot}$
). To first order, below $M_*<10^{9.5}\,\mathrm{M}_{\odot}$
and
$M_*<10^{9.5}\,\mathrm{M}_{\odot}$
and ${\unicode{x03BC}}_*<10^{7.5}\,\mathrm{M}_{\odot}\,\mathrm{kpc}^{-2}$
we find that
${\unicode{x03BC}}_*<10^{7.5}\,\mathrm{M}_{\odot}\,\mathrm{kpc}^{-2}$
we find that ${\unicode{x03BC}}_{\rm{HI}}$
does not correlate with either
${\unicode{x03BC}}_{\rm{HI}}$
does not correlate with either $M_*$
or
$M_*$
or ${\unicode{x03BC}}_*$
. However, the significant scatter in
${\unicode{x03BC}}_*$
. However, the significant scatter in ${\unicode{x03BC}}_{\rm{iso,HI}}$
and
${\unicode{x03BC}}_{\rm{iso,HI}}$
and ${\unicode{x03BC}}_{\rm{50,HI}}$
(0.1 and 0.2 dex, respectively) shows that
${\unicode{x03BC}}_{\rm{50,HI}}$
(0.1 and 0.2 dex, respectively) shows that ${\unicode{x03BC}}_{\rm{HI}}$
is not constant and the conversion of H i to H
${\unicode{x03BC}}_{\rm{HI}}$
is not constant and the conversion of H i to H $_2$
likely plays a role, but future studies are needed.
$_2$
likely plays a role, but future studies are needed.
We find more significant trends of decreasing ${\unicode{x03BC}}_{\rm{iso,HI}}$
and
${\unicode{x03BC}}_{\rm{iso,HI}}$
and ${\unicode{x03BC}}_{\rm{50,HI}}$
at higher stellar masses. This may be due to higher stellar mass surface densities as we find similar decreases in
${\unicode{x03BC}}_{\rm{50,HI}}$
at higher stellar masses. This may be due to higher stellar mass surface densities as we find similar decreases in ${\unicode{x03BC}}_{\rm{iso,HI}}$
and
${\unicode{x03BC}}_{\rm{iso,HI}}$
and ${\unicode{x03BC}}_{\rm{50,HI}}$
for galaxies with high
${\unicode{x03BC}}_{\rm{50,HI}}$
for galaxies with high ${\unicode{x03BC}}_*$
. The change in
${\unicode{x03BC}}_*$
. The change in ${\unicode{x03BC}}_{\rm{iso,HI}}$
and
${\unicode{x03BC}}_{\rm{iso,HI}}$
and ${\unicode{x03BC}}_{\rm{50,HI}}$
may also provide some information on quenching mechanisms acting in these higher mass galaxies (e.g. stellar winds, supernova feedback, H i remaining stable against fragmentation and collapse into H
${\unicode{x03BC}}_{\rm{50,HI}}$
may also provide some information on quenching mechanisms acting in these higher mass galaxies (e.g. stellar winds, supernova feedback, H i remaining stable against fragmentation and collapse into H $_2$
, low star formation efficiency and/or gas removal by stripping by the environment; see review by Cortese et al. Reference Cortese, Catinella and Smith2021). Our analysis shows how there is more diversity in the H i properties than what may have been thought. The full WALLABY survey will provide further insights into what physical processes are affecting the H i surface density.
$_2$
, low star formation efficiency and/or gas removal by stripping by the environment; see review by Cortese et al. Reference Cortese, Catinella and Smith2021). Our analysis shows how there is more diversity in the H i properties than what may have been thought. The full WALLABY survey will provide further insights into what physical processes are affecting the H i surface density.
6. Conclusions
We have investigated how variations in H i structural parameters of nearby galaxies correlate with $M_*$
,
$M_*$
, ${\unicode{x03BC}}_*$
and properties measuring star formation using uniformly measured, spatially resolved H i data from WALLABY and multi-wavelength imaging data from PanSTARRS, GALEX, and WISE. We quantify the H i structure using the H i surface density,
${\unicode{x03BC}}_*$
and properties measuring star formation using uniformly measured, spatially resolved H i data from WALLABY and multi-wavelength imaging data from PanSTARRS, GALEX, and WISE. We quantify the H i structure using the H i surface density, ${\unicode{x03BC}}_{\rm{HI}}$
, and H i disc size normalised by the optical disc,
${\unicode{x03BC}}_{\rm{HI}}$
, and H i disc size normalised by the optical disc, $R_{\rm{HI}}/R_{\rm{r}}$
, measured using effective and isodensity (at 1
$R_{\rm{HI}}/R_{\rm{r}}$
, measured using effective and isodensity (at 1 $\mathrm{M}_{\odot}\,\mathrm{pc}^{-2}$
) H i radii. Our main results are as follows:
$\mathrm{M}_{\odot}\,\mathrm{pc}^{-2}$
) H i radii. Our main results are as follows:
The H i size–mass relations derived using isodensity and effective radii have similar slopes, which indicates that both radii increase at a similar rate with the H i mass. However, the effective size–mass relation has a larger scatter than the isodensity relation, which we attribute to variations in the inner H i surface density (e.g. within the effective radius, ${\unicode{x03BC}}_{\mathrm{50,HI}}\sim1$
–10
$\mathrm{M}_{\odot}\,\mathrm{pc}^{-2}$
).
${\unicode{x03BC}}_{\mathrm{50,HI}}\sim1$
–10
$\mathrm{M}_{\odot}\,\mathrm{pc}^{-2}$
).Galaxies with higher stellar masses and stellar surface densities tend to have lower H i surface densities and less extended H i discs relative to their optical extent. We find weak correlations between the isodensity H i quantities (
${\unicode{x03BC}}_{\rm{iso,HI}}$
and
$R_{\rm{iso,HI}}/R_{\rm{iso,r}}$
) and stellar quantities (
$M_*$
and
${\unicode{x03BC}}_*$
). This may indicate that these stellar structure quantities play a minor role in regulating the H i surface density and disc extent. However, the majority of our sample is marginally resolved, which limits our ability to probe H i located within the stellar disc and contributes to weakening the correlations. We find stronger correlations if we limit our sample to galaxies with
$M_*>10^{9}\,{\rm M}_{\odot}$
and
${\unicode{x03BC}}_*>10^{7}\,\mathrm{M}_{\odot}\,\mathrm{kpc}^{-2}$
, which includes a higher fraction of galaxies spatially resolved by
$>$
4 beams.Galaxies with higher levels of star formation (higher sSFR, lower
$\mathrm{NUV}-r$
colour and above the main sequence) tend to have more extended H i discs and higher
${\unicode{x03BC}}_{\rm{iso,HI}}$
: the isodensity
${\unicode{x03BC}}_{\rm{iso,HI}}$
and
$R_{\rm{iso,HI}}/R_{\rm{iso,r}}$
are more strongly correlated with the star-forming quantities (sSFR,
$\mathrm{NUV}-r$
colour,
$\Delta\,\rm{SFMS}$
).The two H i structural parameters have significant scatter, which highlights the diversity of the H i properties when controlling for
$M_*$
,
${\unicode{x03BC}}_*$
or star formation. Limited spatial resolution is partially responsible, but environmental processes (e.g. ram pressure stripping) and the conversion from H i to H
$_2$
likely also contribute to observed scatter.Care must be taken when defining the optical radius as it affects the correlations with the normalised H i disc size. The negative correlations with
$M_*$
and
${\unicode{x03BC}}_*$
using isophotal radii become positive and the correlations with sSFR and
$\mathrm{NUV}-r$
colour using isophotal radii are removed if the H i radius is normalised by the effective r-band radius. This is due to the growth of the effective optical and H i radii relative to the isophotal/isodensity radii in more massive galaxies.


Our results show qualitative agreement with previous studies that used either smaller galaxy samples of spatially resolved H i observations or estimated H i sizes and average surface densities from single-dish observations and the H i mass–size relation. This work, although limited in spatial resolution, is the first step in providing large, statistical samples of galaxies with spatially resolved H i from which H i surface densities and disc sizes can be directly measured and compared with other galaxy quantities. With the full WALLABY survey due to start in late 2022, the number of galaxies detected by WALLABY will begin to grow rapidly and WALLABY will produce truly statistically significant galaxy samples with spatially resolved H i data.
Acknowledgement
We thank the anonymous referee for their comments.
This research was conducted by the Australian Research Council Centre of Excellence for All Sky Astrophysics in 3 Dimensions (ASTRO 3D), through project number CE170100013.
The Australian SKA Pathfinder is part of the Australia Telescope National Facility which is managed by the Commonwealth Scientific and Industrial Research Organisation (CSIRO). Operation of ASKAP is funded by the Australian Government with support from the National Collaborative Research Infrastructure Strategy. ASKAP uses the resources of the Pawsey Supercomputing Centre. Establishment of ASKAP, the Murchison Radio-astronomy Observatory (MRO) and the Pawsey Supercomputing Centre are initiatives of the Australian Government, with support from the Government of Western Australia and the Science and Industry Endowment Fund. We acknowledge the Wajarri Yamatji as the traditional owners of the Observatory site. We also thank the MRO site staff. This paper includes archived data obtained through the CSIRO ASKAP Science Data Archive, CASDA (http://data.csiro.au).
L.C. acknowledges support from the Australian Research Council Discovery Project and Future Fellowship funding schemes (DP210100337, FT180100066).
P.K. acknowledges financial support by the German Federal Ministry of Education and Research (BMBF) under grant 05A17PC2 (Verbundprojekt D-MeerKAT-II).
J.M.vdH. acknowledges funding from the Europeaní Research Council under the European Union’s Seventh Framework Programme (FP/2007-2013)/ERC Grant Agreement No. 291531 (‘HIStoryNU’).
D.A.L. and K.S. acknowledge support from the Natural Science and Engineering Research Council of Canada.
A.B. acknowledges support from the Centre National d’Etudes Spatiales (CNES), France.
F.B. would like to acknowledge funding from the European Research Council (ERC) under the European Union’s Horizon 2020 research and innovation programme (grant agreement No.726384/Empire).
The Pan-STARRS1 Surveys (PS1) and the PS1 public science archive have been made possible through contributions by the Institute for Astronomy, the University of Hawaii, the Pan-STARRS Project Office, the Max-Planck Society and its participating institutes, the Max Planck Institute for Astronomy, Heidelberg and the Max Planck Institute for Extraterrestrial Physics, Garching, The Johns Hopkins University, Durham University, the University of Edinburgh, the Queen’s University Belfast, the Harvard-Smithsonian Center for Astrophysics, the Las Cumbres Observatory Global Telescope Network Incorporated, the National Central University of Taiwan, the Space Telescope Science Institute, the National Aeronautics and Space Administration under Grant No. NNX08AR22G issued through the Planetary Science Division of the NASA Science Mission Directorate, the National Science Foundation Grant No. AST-1238877, the University of Maryland, Eotvos Lorand University (ELTE), the Los Alamos National Laboratory, and the Gordon and Betty Moore Foundation.
This publication makes use of data products from the Wide-field Infrared Survey Explorer (WISE), which is a joint project of the University of California, Los Angeles, and the Jet Propulsion Laboratory/California Institute of Technology, funded by the National Aeronautics and Space Administration.
This work is based in part on observations made with the Galaxy Evolution Explorer (GALEX). GALEX is a NASA Small Explorer, whose mission was developed in cooperation with the Centre National d’Etudes Spatiales (CNES) of France and the Korean Ministry of Science and Technology. GALEX is operated for NASA by the California Institute of Technology under NASA contract NAS5-98034.
Data Availability
Not applicable.
Appendix A. Beam Resolution
As discussed in Section 3, the majority of our galaxy sample is poorly resolved, with a spatial resolution of $<$
2 beams along the semi-major axis. We investigate how the spatial resolution affects the measured isodensity and effective radii and average surface densities by convolving the moment 0 maps of galaxies resolved by
$<$
2 beams along the semi-major axis. We investigate how the spatial resolution affects the measured isodensity and effective radii and average surface densities by convolving the moment 0 maps of galaxies resolved by $>$
2 beams to a spatial resolution equivalent to 2 beams. We achieve this by scaling the ASKAP 30 arcsec synthesised beam by the number of beams by which each galaxy’s isodensity and effective radii are resolved, and then convolving the moment 0 map with a 2 dimensional Gaussian with a standard deviation set by this scaled synthesised beam. We then follow the exact same procedure described in Section 2.1 and in Reynolds et al. (Reference Reynolds2022) to measure isodensity (effective) radii and surface densities from the moment 0 maps convolved to a spatial resolution of 2 beams along the isodensity (effective) diameter.
$>$
2 beams to a spatial resolution equivalent to 2 beams. We achieve this by scaling the ASKAP 30 arcsec synthesised beam by the number of beams by which each galaxy’s isodensity and effective radii are resolved, and then convolving the moment 0 map with a 2 dimensional Gaussian with a standard deviation set by this scaled synthesised beam. We then follow the exact same procedure described in Section 2.1 and in Reynolds et al. (Reference Reynolds2022) to measure isodensity (effective) radii and surface densities from the moment 0 maps convolved to a spatial resolution of 2 beams along the isodensity (effective) diameter.
In Figure A1 we compare the radii measured from these low resolution maps with their original values, and colour the points by the inclination angle measured from the full resolution maps. In both ISO (left) and EFF (right) cases, the data points scatter around the 1 to 1 relation (black dashed line) but tend to lie slightly above it, indicating that radii measured from low resolution maps are somewhat larger. This is a result of the convolution smoothing out and extending the H i emission in the maps to larger radii. Correspondingly, we find that the surface densities measured from the low resolution maps slightly decrease (marginally more so for the ISO surface densities). These differences are quantified in Table A1, where we tabulate the medians, 20th and 80th percentiles of the ratios between the radii and surface densities measured from the low and full resolution maps. In all cases, the quantities measured from the low resolution moment 0 maps are within 5–10% of their original values. Hence, we conclude that the poorly resolved ( $<$
2 beams) galaxies in our sample have marginally larger radii and lower surface densities than would be measured from higher resolution observations.
$<$
2 beams) galaxies in our sample have marginally larger radii and lower surface densities than would be measured from higher resolution observations.
The ISO (left) and EFF (right) radii measured from moment 0 maps convolved to a resolution of 2 beams along the major axis are plotted against the radii measured from the full resolution moment 0 maps. The black dash line indicates the 1 to 1 line. The colour bar indicates the inclination of each galaxy as measured from the full resolution moment 0 maps.
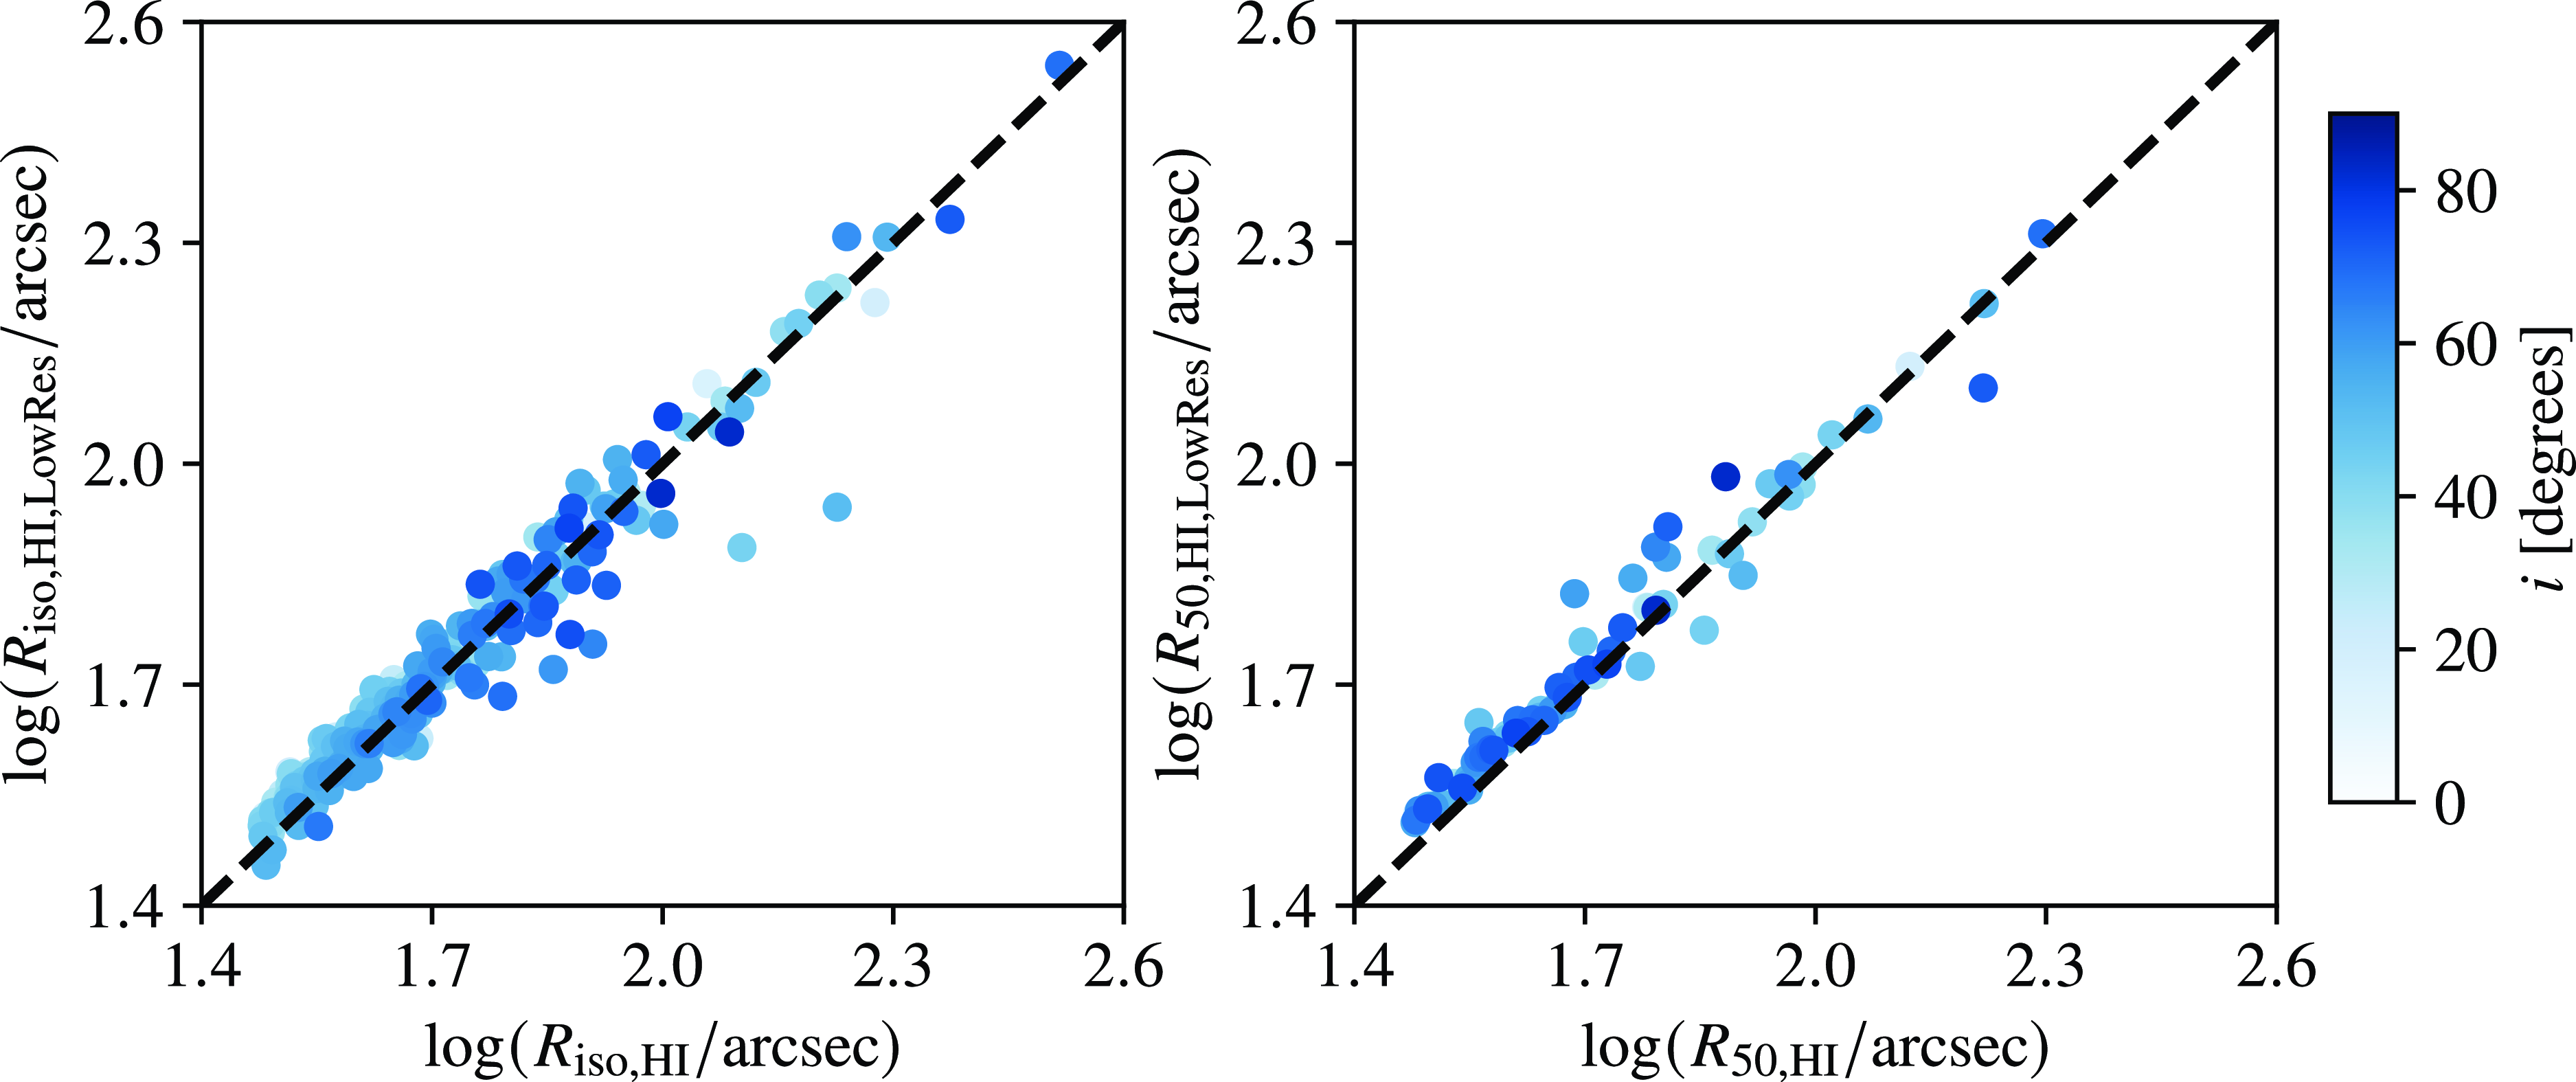
Median, 20th and 80th percentiles for the distributions in ratios of measured radii and surface densities measured from low and full resolution moment 0 maps.

Appendix B. Supplementary Data
We provide a supplementary table in FITS format containing all measured and derived galaxy properties that we use in this work. We show the first 10 rows of this file in Table B1 with descriptions of the table columns provided here.
Name: WALLABY source detection name
Team Release: Internal WALLABY team release identifier
-
$D_{\rm{L}}$
: Luminosity distance (Mpc)
-
$\log(M_{\rm{HI}})$
: Base-10 logarithm of the H i mass (M
$_{\odot}$
)
-
$R_{\rm{50,HI}}$
: Effective H i radius (kpc)
-
$R_{\rm{iso,HI}}$
:
$1\,\mathrm{M}_{\odot}\,\mathrm{pc}^{-2}$
isodensity H i radius (kpc)
-
${\unicode{x03BC}}_{\rm{50,HI}}$
: H i surface density measured within the effective H i radius (
$\mathrm{M}_{\odot}\,\mathrm{pc}^{-2}$
)
-
${\unicode{x03BC}}_{\rm{iso,HI}}$
: H i surface density measured within the isodensity H i radius (
$\mathrm{M}_{\odot}\,\mathrm{pc}^{-2}$
)
-
$\log(M_{\rm{*}})$
: Base-10 logarithm of the stellar mass (M
$_{\odot}$
)
-
$R_{\rm{50,r}}$
: Effective r-band radius (kpc)
-
$R_{\rm{iso,r}}$
: 25 mag arcsec
$^{-2}$
isophotal r-band radius (kpc)
-
$\log({\unicode{x03BC}}_*)$
: Base-10 logarithm of the stellar mass surface density (
$\mathrm{M}_{\odot}\,\mathrm{kpc}^{-2}$
)
-
$\log(\mathrm{sSFR})$
: Base-10 logarithm of the specific star formation rate (yr
$^{-1}$
)
-
$\mathrm{NUV}-r$
:
$\mathrm{NUV}-r$
colour (mag)
-
$\Delta\,\rm{SFMS}$
: Offset from the star forming main sequence defined from xGASS by Janowiecki et al. (Reference Janowiecki, Catinella, Cortese, Saintonge and Wang2020) (dex)
flag
$_{\rm{SFR}}$
: Flag indicating if the sSFR is an upper limit. For galaxies detected in both GALEX and WISE: flag
$_{\rm{SFR}}=0$
. For galaxies non-detected (i.e.
$\mathrm{SNR}<5$
) in either GALEX or WISE (i.e. derived sSFR is an upper limit): flag
$_{\rm{SFR}}=1$
.


The measured and derived properties for H i detected galaxies. The full table is available as supplementary material.