


1. Introduction
The innermost region of the Milky Way (MW; $\mathrm{R}_\mathrm{gal} \lt 200 \, \text{pc}$
) harbours the central molecular zone (CMZ; Morris & Serabyn Reference Morris and Serabyn1996). This region contains a large amount of molecular gas whose volumetric density is at least two orders of magnitude higher than that found in the galactic disc (Ferrière, Gillard, & Jean Reference Ferrière, Gillard and Jean2007; Molinari et al. Reference Molinari2011; Longmore et al. Reference Longmore2013; Kruijssen et al. Reference Kruijssen, Longmore, Elmegreen, Murray, Bally, Testi and Kennicutt2014; Ginsburg et al. 2016; Battersby, Bally, & Svoboda Reference Battersby, Bally and Svoboda2017). Observational studies confirm the existence of dense cores of cold gas with low star formation rate (SFR; Yusef-Zadeh et al. Reference Yusef-Zadeh2009; Immer et al. Reference Immer, Menten, Schuller and Lis2012; Longmore et al. Reference Longmore2013; Barnes et al. Reference Barnes, Longmore, Battersby, Bally, Kruijssen, Henshaw and Walker2017). The gas in this region is subjected to extreme physical conditions compared with the star formation peak in galaxies in the universe’s early stages (Crocker et al. Reference Crocker, Jones, Melia, Ott and Protheroe2010; Chuss et al. Reference Chuss, Davidson, Dotson, Darren Dowell, Hildebrand, Novak and Vaillancourt2003; Ginsburg et al. 2016; Immer et al. Reference Immer, Kauffmann, Pillai, Ginsburg and Menten2016; Krieger et al. Reference Krieger2017; Longmore et al. Reference Longmore2017; Mills et al. Reference Mills, Ginsburg, Immer, Barnes, Wiesenfeld, Faure, Morris and Requena-Torres2018; Mangilli et al. Reference Mangilli2019).
$\mathrm{R}_\mathrm{gal} \lt 200 \, \text{pc}$
) harbours the central molecular zone (CMZ; Morris & Serabyn Reference Morris and Serabyn1996). This region contains a large amount of molecular gas whose volumetric density is at least two orders of magnitude higher than that found in the galactic disc (Ferrière, Gillard, & Jean Reference Ferrière, Gillard and Jean2007; Molinari et al. Reference Molinari2011; Longmore et al. Reference Longmore2013; Kruijssen et al. Reference Kruijssen, Longmore, Elmegreen, Murray, Bally, Testi and Kennicutt2014; Ginsburg et al. 2016; Battersby, Bally, & Svoboda Reference Battersby, Bally and Svoboda2017). Observational studies confirm the existence of dense cores of cold gas with low star formation rate (SFR; Yusef-Zadeh et al. Reference Yusef-Zadeh2009; Immer et al. Reference Immer, Menten, Schuller and Lis2012; Longmore et al. Reference Longmore2013; Barnes et al. Reference Barnes, Longmore, Battersby, Bally, Kruijssen, Henshaw and Walker2017). The gas in this region is subjected to extreme physical conditions compared with the star formation peak in galaxies in the universe’s early stages (Crocker et al. Reference Crocker, Jones, Melia, Ott and Protheroe2010; Chuss et al. Reference Chuss, Davidson, Dotson, Darren Dowell, Hildebrand, Novak and Vaillancourt2003; Ginsburg et al. 2016; Immer et al. Reference Immer, Kauffmann, Pillai, Ginsburg and Menten2016; Krieger et al. Reference Krieger2017; Longmore et al. Reference Longmore2017; Mills et al. Reference Mills, Ginsburg, Immer, Barnes, Wiesenfeld, Faure, Morris and Requena-Torres2018; Mangilli et al. Reference Mangilli2019).
The CMZ hosts massive young clusters (MYCs), such as Arches and Quintuplet (these clusters achieve masses $\gtrsim 10^{4}\,M_{\odot}$
; Figer et al. Reference Figer, Kim, Morris, Serabyn, Michael Rich and McLean1999). Walker et al. (Reference Walker, Longmore, Bastian, Kruijssen, Rathborne, Jackson, Foster and Contreras2015) compare the distribution of the mass as a function of the ratio with the possible progenitor clouds of these clusters, finding a conflict between these two quantities, concluding that the conveyor-belt mechanism is more suitable in this process than the monolithic collapse for the formation of the MYC.
$\gtrsim 10^{4}\,M_{\odot}$
; Figer et al. Reference Figer, Kim, Morris, Serabyn, Michael Rich and McLean1999). Walker et al. (Reference Walker, Longmore, Bastian, Kruijssen, Rathborne, Jackson, Foster and Contreras2015) compare the distribution of the mass as a function of the ratio with the possible progenitor clouds of these clusters, finding a conflict between these two quantities, concluding that the conveyor-belt mechanism is more suitable in this process than the monolithic collapse for the formation of the MYC.
An open question that remains in discussion is the morphology of the CMZ. As first proposed by Binney et al. (Reference Binney, Gerhard, Stark, Bally and Uchida1991), the gas that follows orbits corresponding to the x1 family switches to the x2-typeFootnote a of orbits forming an inner disc-like structure. In that sense, the existence of these two families of periodic orbits must be conditioned to the presence of a non-axisymmetric structure, like a galactic bar.
The galactic bar in the inner region of the MW has been clearly established, both through photometric and dynamical studies. The first evidence of the existence of a galactic bar was obtained by Blitz & Spergel (Reference Blitz and Spergel1991) by analysing the $2.4\,\mu$
m emission from the galactic centre. Later on, Dwek et al. (Reference Dwek1995) used near-infrared data from COBE DIRBE to characterise the morphology of the galactic bulge, and they found that the bulge resembles a barred-shaped structure with its end near the first quadrant of the galactic plane. Other important observational works support the fact that the MW is a barred galaxy (Binney, Gerhard, & Spergel Reference Binney, Gerhard and Spergel1997; Wegg & Gerhard Reference Wegg and Gerhard2013b). From the dynamical point of view, the first galactic models that included a bar were proposed by Mulder & Liem (Reference Mulder and Liem1986). Other works that include the dynamical effects of a galactic bar in order to fit structures observed in different data sets include Englmaier & Gerhard (Reference Englmaier and Gerhard1999), Bissantz, Englmaier, & Gerhard (Reference Bissantz, Englmaier and Gerhard2003), Rodriguez-Fernandez & Combes (Reference Rodriguez-Fernandez and Combes2008), Sormani, Binney, & Magorrian (Reference Sormani, Binney and Magorrian2015a), Sormani et al. (Reference Sormani, Binney and Magorrian2015b), Li et al. (Reference Li, Gerhard, Shen, Portail and Wegg2016), among others.
$2.4\,\mu$
m emission from the galactic centre. Later on, Dwek et al. (Reference Dwek1995) used near-infrared data from COBE DIRBE to characterise the morphology of the galactic bulge, and they found that the bulge resembles a barred-shaped structure with its end near the first quadrant of the galactic plane. Other important observational works support the fact that the MW is a barred galaxy (Binney, Gerhard, & Spergel Reference Binney, Gerhard and Spergel1997; Wegg & Gerhard Reference Wegg and Gerhard2013b). From the dynamical point of view, the first galactic models that included a bar were proposed by Mulder & Liem (Reference Mulder and Liem1986). Other works that include the dynamical effects of a galactic bar in order to fit structures observed in different data sets include Englmaier & Gerhard (Reference Englmaier and Gerhard1999), Bissantz, Englmaier, & Gerhard (Reference Bissantz, Englmaier and Gerhard2003), Rodriguez-Fernandez & Combes (Reference Rodriguez-Fernandez and Combes2008), Sormani, Binney, & Magorrian (Reference Sormani, Binney and Magorrian2015a), Sormani et al. (Reference Sormani, Binney and Magorrian2015b), Li et al. (Reference Li, Gerhard, Shen, Portail and Wegg2016), among others.
Recently, there has been theoretical work focused on exploring the dynamical origin of the CMZ. Kruijssen, Dale, & Longmore (Reference Kruijssen, Dale and Longmore2015) reported a best fit open orbit (a rosette), integrated in an axisymmetric background potential, that in principle adjusts the positions of the largest molecular clouds in this region. However, Tress et al. (Reference Tress, Sormani, Glover, Klessen, Battersby, Clark, Perry Hatchfield and Smith2020) claim that there is no inconsistency between the open orbit and scenarios that associate the CMZ to an x2 orbit since the molecular clouds could follow quasi-periodic trajectories around a given x2 periodic orbit. On the other hand, Sormani et al. (Reference Sormani, Sobacchi, Fragkoudi, Ridley, Treß, Glover and Klessen2018) predicts the size of stable rings based on the fact that regions of reverse shear are favourable to form stable rings if the sound speed is low.
The three-dimensional (3D) structure of the CMZ is still controversial. In the literature, we can find kinematic studies of longitude-velocity diagrams in order to unravel the actual 3D morphology of this region (Sofue Reference Sofue1995; Oka et al. Reference Oka, Hasegawa, Sato, Tsuboi and Miyazaki1998; Tsuboi, Handa, & Ukita Reference Tsuboi, Handa and Ukita1999; Kruijssen et al. Reference Kruijssen, Dale and Longmore2015; Sofue Reference Sofue2017; Henshaw et al. Reference Henshaw2016; Tokuyama et al. Reference Tokuyama, Oka, Takekawa, Iwata, Tsujimoto, Yamada, Furusawa and Nomura2019; Sofue Reference Sofue2022). In Sofue (Reference Sofue2022) by making a detail comparison between CO and HI maps and LV diagrams, found that CMZ is a plateau distribution of molecular gas distributed in a ring-like structure that traces a double-loop shape, as seen projected onto plane of the sky. Henshaw et al. (Reference Henshaw2016) studied the kinematics of dense gas in the region containing the CMZ and shows the distribution of gas velocities, as traced by HNCO, in l-b space. Sofue (Reference Sofue2022) traced the CMZ using CO and HI lines, concluding that it lies in a range of $l\sim \pm 2^{\circ}$
and
$l\sim \pm 2^{\circ}$
and $b\sim \pm 0.5^{\circ}$
.
$b\sim \pm 0.5^{\circ}$
.
Despite the studies of gas and stellar dynamics associated with the galactic bar, its connection with the CMZ has not been explored in detail. In principle, the self-interacting gas that follows x1 orbits shocks in the regions of high curvature and falls to the x2 region following the so-called dust channels (Sormani et al. Reference Sormani, Binney and Magorrian2015a; Tress et al. Reference Tress, Sormani, Glover, Klessen, Battersby, Clark, Perry Hatchfield and Smith2020; Hatchfield et al. Reference Hatchfield, Sormani, Tress and Battersby2021). Depending on the nature of the potential, there are regions (close to the 4:1 resonance) in which members of the x1 family develop big loops. In these cases, the dust channels tend to avoid this regions and form straight-line shocks (Pastras, Patsis, & Athanassoula Reference Pastras, Patsis and Athanassoula2022). Patsis & Athanassoula (Reference Patsis and Athanassoula2000), by using SPH simulations of strong bar models, concluded that the inflow of the gas via the dust channels increases as the sound speed increases. On the other hand, the increase of the inflow is stronger when the bar is imposed in an abrupt manner. Recently, Sormani, Sobacchi, and Sanders (Reference Sormani, Sobacchi and Sanders2024) proposed that the bar potential excites strong trailing density waves that generate a gap close to the ILR, removing angular momentum and transporting the gas inwards. In this scenario, the mechanism to form the CMZ would originate around the ILR as opposed to the gas dynamics at bar scales.
Regarding star formation, despite the high densities achieved in the CMZ, the SFR found in this region is low compared with the outer parts of the galaxy. Observations of the dust ridge at $870\,\mu\text{m}$
confirm that the region contains one of the most massive reservoirs of molecular gas found in the galaxy, in which the temperatures achieved by the densest clouds are low, suggesting a very early stage of star formation (Immer et al. Reference Immer, Menten, Schuller and Lis2012). In Longmore et al. (Reference Longmore2013) by taking into account the low activity of star formation in the CMZ, the authors inferred a relevant physical mechanism that suppresses star formation. This mechanism relates with an additional term or threshold in the star formation relations which takes into account the turbulent energy that would suppress gravitational collapse. On the other hand, it is worth to consider that the gas in the central region of the galaxy is subjected to extreme physical conditions, including tidal forces that could reduce the critical mass for gravitational collapse (Zavala-Molina et al. Reference Zavala-Molina, Ballesteros-Paredes, Gazol and Palau2023).
$870\,\mu\text{m}$
confirm that the region contains one of the most massive reservoirs of molecular gas found in the galaxy, in which the temperatures achieved by the densest clouds are low, suggesting a very early stage of star formation (Immer et al. Reference Immer, Menten, Schuller and Lis2012). In Longmore et al. (Reference Longmore2013) by taking into account the low activity of star formation in the CMZ, the authors inferred a relevant physical mechanism that suppresses star formation. This mechanism relates with an additional term or threshold in the star formation relations which takes into account the turbulent energy that would suppress gravitational collapse. On the other hand, it is worth to consider that the gas in the central region of the galaxy is subjected to extreme physical conditions, including tidal forces that could reduce the critical mass for gravitational collapse (Zavala-Molina et al. Reference Zavala-Molina, Ballesteros-Paredes, Gazol and Palau2023).
In this work we developed a hydrodynamic simulation in arepo in which we imposed an external axisymmetric potential composed by a halo, a disc, and a bulge. The bulge, adiabatically transfers part of its mass to a Ferrers bar during the first $667 \, \, \text{Myr}$
of the simulation. During this imposition, we observed an internal ringed structure. This ring passes three main phases, namely: formation, instability, and a quasi-stationary state. We analysed the density maps in the three phases and created plane-of-the-sky projections to observe the evolution of the structure in
$667 \, \, \text{Myr}$
of the simulation. During this imposition, we observed an internal ringed structure. This ring passes three main phases, namely: formation, instability, and a quasi-stationary state. We analysed the density maps in the three phases and created plane-of-the-sky projections to observe the evolution of the structure in $l-b$
diagrams. Additionally, we studied the gas flow induced by the bar during the phases of the ring. We also studied the star formation and its relation with the geometry of the ring. This paper is organised as follows: in Section 2, we explained the set-up of the simulation, we introduce the dynamical and geometric parameters of the external potential, and the process of imposition of the bar. In Section 3, we discuss the x2 region given by the autonomous model by computing periodic orbits of the x1 and x2 family. Also in Section 3, we discuss the main phases of the ring, namely formation, instability, and quasi-stationary stages. In Section 4, we study the gas flow at different radii. In Section 5, we analyse the star formation activity in the ring and we relate the SFR with the geometry of the ring. Finally, in Section 6, we present the main conclusions of our work.
$l-b$
diagrams. Additionally, we studied the gas flow induced by the bar during the phases of the ring. We also studied the star formation and its relation with the geometry of the ring. This paper is organised as follows: in Section 2, we explained the set-up of the simulation, we introduce the dynamical and geometric parameters of the external potential, and the process of imposition of the bar. In Section 3, we discuss the x2 region given by the autonomous model by computing periodic orbits of the x1 and x2 family. Also in Section 3, we discuss the main phases of the ring, namely formation, instability, and quasi-stationary stages. In Section 4, we study the gas flow at different radii. In Section 5, we analyse the star formation activity in the ring and we relate the SFR with the geometry of the ring. Finally, in Section 6, we present the main conclusions of our work.
2. Simulation
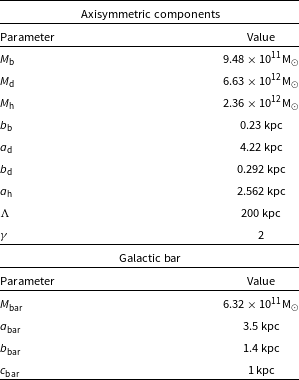
We performed the simulation using the moving-mesh code arepo (Springel Reference Springel2010; Weinberger, Springel, & Pakmor Reference Weinberger, Springel and Pakmor2020). We imposed the axisymmetric potential from Allen & Santillan (Reference Allen and Santillan1991), with the parameters proposed by Irrgang et al. (Reference Irrgang, Wilcox, Tucker and Schiefelbein2013). We summarise these parameters in Table 1. This model comprises a disc, a dark halo, and a bulge. In addition to the axisymmetric part we impose a rigid ellipsoidal Ferrers’ bar that rotates clockwise with a pattern speed of $\varOmega_{p}=40 \, \text{km s}^{-1} \, \text{kpc}^{-1}$
. The pattern speed of the bar is one of the most important dynamic parameters since it determines the location of the resonances. The value used in this work is consistent with recent observational studies that have constrained this parameter. For instance in Portail et al. (Reference Portail, Gerhard, Wegg and Ness2017), with a combination of VVV, UKIDSS, 2MASS, BRAVA, OGLE, and ARGOS surveys, the estimated value for the pattern speed estimated to be
$\varOmega_{p}=40 \, \text{km s}^{-1} \, \text{kpc}^{-1}$
. The pattern speed of the bar is one of the most important dynamic parameters since it determines the location of the resonances. The value used in this work is consistent with recent observational studies that have constrained this parameter. For instance in Portail et al. (Reference Portail, Gerhard, Wegg and Ness2017), with a combination of VVV, UKIDSS, 2MASS, BRAVA, OGLE, and ARGOS surveys, the estimated value for the pattern speed estimated to be $\varOmega_{p}=39\pm 3.5 \, \text{km s}^{-1} \, \text{kpc}^{-1}$
. Other works in which the estimated pattern speed is close to the value used here include Launhardt, Zylka, & Mezger (Reference Launhardt, Zylka and Mezger2002), Sormani et al. (Reference Sormani, Binney and Magorrian2015b), Bland-Hawthorn & Gerhard (Reference Bland-Hawthorn and Gerhard2016), Sanders et al. (Reference Sanders, Smith and Wyn Evans2019), and Sormani et al. (Reference Sormani, Tress, Glover, Klessen, Battersby, Clark, Perry Hatchfield and Smith2020).
$\varOmega_{p}=39\pm 3.5 \, \text{km s}^{-1} \, \text{kpc}^{-1}$
. Other works in which the estimated pattern speed is close to the value used here include Launhardt, Zylka, & Mezger (Reference Launhardt, Zylka and Mezger2002), Sormani et al. (Reference Sormani, Binney and Magorrian2015b), Bland-Hawthorn & Gerhard (Reference Bland-Hawthorn and Gerhard2016), Sanders et al. (Reference Sanders, Smith and Wyn Evans2019), and Sormani et al. (Reference Sormani, Tress, Glover, Klessen, Battersby, Clark, Perry Hatchfield and Smith2020).
Parameters of the galactic model.
 $M_\mathrm{b}$
: Bulge mass,
$M_\mathrm{b}$
: Bulge mass, $M_\mathrm{d}$
: disc mass,
$M_\mathrm{d}$
: disc mass, $M_\mathrm{h}$
: halo mass,
$M_\mathrm{h}$
: halo mass, $b_\mathrm{b}$
: buldge radial scale parameter,
$b_\mathrm{b}$
: buldge radial scale parameter, $a_\mathrm{d}$
: disc radial scale parameter,
$a_\mathrm{d}$
: disc radial scale parameter, $b_\mathrm{d}$
: disc vertical scale parameter,
$b_\mathrm{d}$
: disc vertical scale parameter, $a_\mathrm{h}$
: halo radial scale parameter,
$a_\mathrm{h}$
: halo radial scale parameter, $\Lambda$
: halo cut off parameter,
$\Lambda$
: halo cut off parameter, $\gamma$
: free parameter introduced to avoid singularities at the origin,
$\gamma$
: free parameter introduced to avoid singularities at the origin, $M_\mathrm{b}$
: bar mass,
$M_\mathrm{b}$
: bar mass, $a_\mathrm{bar}$
: bar semi-major axis,
$a_\mathrm{bar}$
: bar semi-major axis, $b_\mathrm{bar}$
: bar semi-minor axis, and
$b_\mathrm{bar}$
: bar semi-minor axis, and $c_\mathrm{bar}$
: bar vertical semi axis.
$c_\mathrm{bar}$
: bar vertical semi axis.
In order to set the initial density distribution of the gaseous galactic disc, we defined a radius $R_\mathrm{in} = 3 \, \text{kpc}$
and set the midplane density constant for
$R_\mathrm{in} = 3 \, \text{kpc}$
and set the midplane density constant for $R \lt R_\mathrm{in}$
and with an exponential profile with a
$R \lt R_\mathrm{in}$
and with an exponential profile with a $8 \, \text{kpc}$
scale for
$8 \, \text{kpc}$
scale for $R \gt R_\mathrm{in}$
. The gas density at
$R \gt R_\mathrm{in}$
. The gas density at $R = 8 \, \text{kpc}$
was set as
$R = 8 \, \text{kpc}$
was set as $1 \, \text{cm}^{-3}$
. In the vertical direction, the density is defined following hydrostatic equilibrium with the background axisymmetric potential. We distributed
$1 \, \text{cm}^{-3}$
. In the vertical direction, the density is defined following hydrostatic equilibrium with the background axisymmetric potential. We distributed $5 \times 10^6$
gas cells in the simulation at random positions following this density profile leading to an initial resolution of approximately
$5 \times 10^6$
gas cells in the simulation at random positions following this density profile leading to an initial resolution of approximately $2\times 10^4 \, \text{M}_\odot$
per cell. Since arepo allows for mass flow between cells, this resolution does not remain uniform during the evolution.
$2\times 10^4 \, \text{M}_\odot$
per cell. Since arepo allows for mass flow between cells, this resolution does not remain uniform during the evolution.
The gas is initially at a uniform temperature of $8 \times 10^3 \,\text{K}$
, but it is then allowed to thermally evolve. We used the cooling function proposed by Koyama & Inutsuka (Reference Koyama and Inutsuka2002),Footnote
b
using the exponential cooling model described in Vázquez-Semadeni et al. (Reference Vázquez-Semadeni, Gómez, Katharina Jappsen, Ballesteros-Paredes, González and Klessen2007). This function induces a thermally bistable behaviour in the gas with an unstable regime for densities in the approximate range of 1 through
$8 \times 10^3 \,\text{K}$
, but it is then allowed to thermally evolve. We used the cooling function proposed by Koyama & Inutsuka (Reference Koyama and Inutsuka2002),Footnote
b
using the exponential cooling model described in Vázquez-Semadeni et al. (Reference Vázquez-Semadeni, Gómez, Katharina Jappsen, Ballesteros-Paredes, González and Klessen2007). This function induces a thermally bistable behaviour in the gas with an unstable regime for densities in the approximate range of 1 through $10 \, \text{cm}^{-3}$
.
$10 \, \text{cm}^{-3}$
.
To avoid transient effects, the bar is imposed adiabatically by transferring part of the mass of the bulge to the bar (Dehnen Reference Dehnen2000) during the first 667 Myr, so that the bar’s final mass is $\sim$ $79 \%$
of the initial bulge’s mass. This approach has been adopted in other works including Kim & Stone (Reference Kim and Stone2012), Seo & Kim (Reference Seo and Kim2013), Armillotta et al. (Reference Armillotta, Krumholz, Di Teodoro and McClure-Griffiths2019), Seo et al. (Reference Seo, Kim, Kwak, Hsieh, Han and Hopkins2019), Armillotta, Krumholz, & Di Teodoro (Reference Armillotta, Krumholz and Di Teodoro2020), Li et al. (Reference Li, Shen, Gerhard and Clarke2022). After this time, the background gravitational potential remains constant, although the gas’ self-gravity is calculated throughout the simulation.
$79 \%$
of the initial bulge’s mass. This approach has been adopted in other works including Kim & Stone (Reference Kim and Stone2012), Seo & Kim (Reference Seo and Kim2013), Armillotta et al. (Reference Armillotta, Krumholz, Di Teodoro and McClure-Griffiths2019), Seo et al. (Reference Seo, Kim, Kwak, Hsieh, Han and Hopkins2019), Armillotta, Krumholz, & Di Teodoro (Reference Armillotta, Krumholz and Di Teodoro2020), Li et al. (Reference Li, Shen, Gerhard and Clarke2022). After this time, the background gravitational potential remains constant, although the gas’ self-gravity is calculated throughout the simulation.
However, if we assume that the hydrodynamic forces and gas self-gravity are negligible compared to the general orbital dynamics, the gas kinematics may be approximated to the ballistic model of test particles under the potential as applied to the simulation at that time. Under this approximation, the purpose of retaining a fraction of the bulge’s mass is to allow for a suitable x2 orbital region that the gas could follow. Our simulation is stopped after $5 \, \text{Gyr}$
of evolution.
$5 \, \text{Gyr}$
of evolution.
3. CMZ: The x2 region
The morphology of the CMZ has been associated with a ring-like structure of molecular gas that is confined to the inner region of the MW galaxy ( $R \lt 250 \, \text{pc}$
; Zubovas & Nayakshin Reference Zubovas and Nayakshin2012; Oka & Geballe Reference Oka and Geballe2020; Sormani et al. Reference Sormani, Tress, Glover, Klessen, Battersby, Clark, Perry Hatchfield and Smith2020). Similar structures have been observed in barred external galaxies and are associated with the gas flow that originates from the galactic bar tips. As the orbital dynamics pushes the gas to follow trajectories similar to x1 periodic orbits (Gómez, Pichardo, & Martos Reference Gómez, Pichardo and Martos2013), it shocks and forms the observed dust channels (Athanassoula Reference Athanassoula1992b). The CMZ is associated with x2 periodic orbits (Regan & Teuben Reference Regan and Teuben2003; Li, Shen, & Kim Reference Li2015; Sormani et al. Reference Sormani, Sobacchi, Fragkoudi, Ridley, Treß, Glover and Klessen2018).
$R \lt 250 \, \text{pc}$
; Zubovas & Nayakshin Reference Zubovas and Nayakshin2012; Oka & Geballe Reference Oka and Geballe2020; Sormani et al. Reference Sormani, Tress, Glover, Klessen, Battersby, Clark, Perry Hatchfield and Smith2020). Similar structures have been observed in barred external galaxies and are associated with the gas flow that originates from the galactic bar tips. As the orbital dynamics pushes the gas to follow trajectories similar to x1 periodic orbits (Gómez, Pichardo, & Martos Reference Gómez, Pichardo and Martos2013), it shocks and forms the observed dust channels (Athanassoula Reference Athanassoula1992b). The CMZ is associated with x2 periodic orbits (Regan & Teuben Reference Regan and Teuben2003; Li, Shen, & Kim Reference Li2015; Sormani et al. Reference Sormani, Sobacchi, Fragkoudi, Ridley, Treß, Glover and Klessen2018).
The phase-space available for x2 orbits depends on the existence and location of the inner Lindblad resonance (ILR). The presence of a massive bulge might split the ILR into two: inner and outer (iILR and oILR, respectively; Contopoulos & Grosbol Reference Contopoulos and Grosbol1989; Athanassoula Reference Athanassoula1992a). If this is the case, the x2 orbits will survive only between the iILR and oILR (van Albada & Sanders Reference van Albada and Sanders1982), and so the gaseous ring of the CMZ could exist only in this region. In this work, we set the extension of the x2 region by retaining some fraction of the bulge contribution after the bar potential is imposed to the gaseous disc in the simulation (see Section 2).
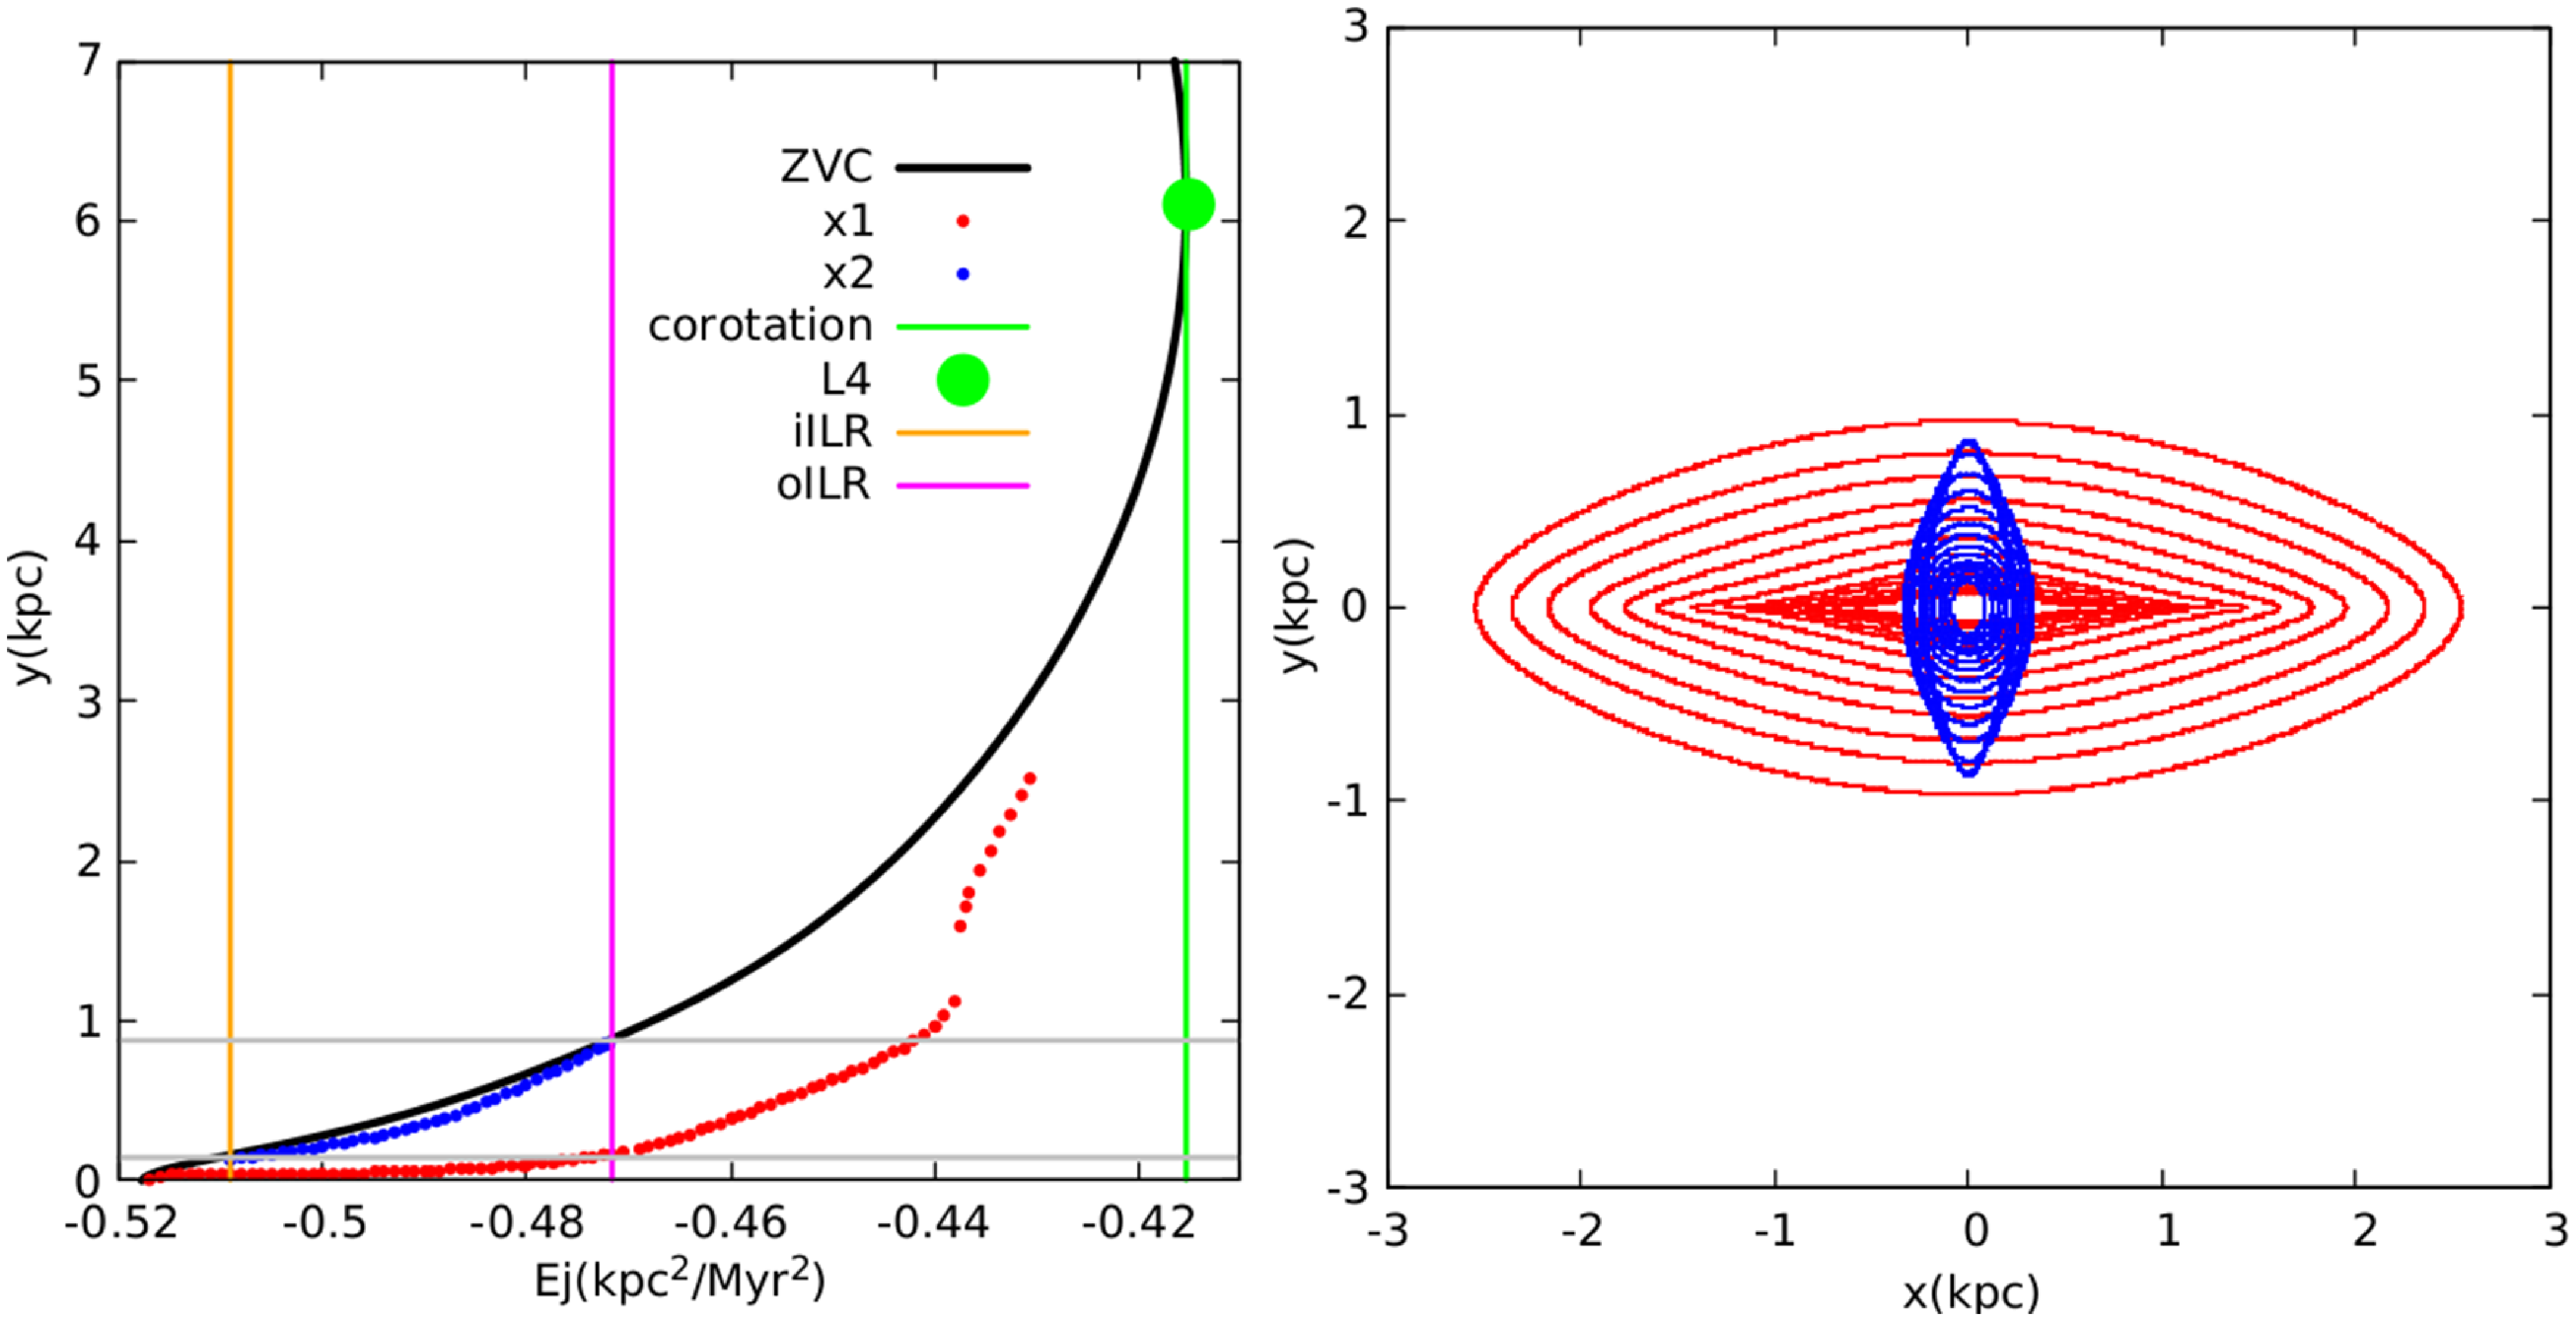
On the left panel of Fig. 1 we show the $E_\mathrm{J}$
versus y diagram of the autonomous model. The zero-velocity curve (black line) and the energies corresponding to both inner Lindblad resonances existing in the model (orange for the iILR, magenta for the oILR) are also shown.Footnote
c
Corotation, defined as the position of the L4 Lagrangian point, is located at
$E_\mathrm{J}$
versus y diagram of the autonomous model. The zero-velocity curve (black line) and the energies corresponding to both inner Lindblad resonances existing in the model (orange for the iILR, magenta for the oILR) are also shown.Footnote
c
Corotation, defined as the position of the L4 Lagrangian point, is located at $y \approx 6.11\text{kpc}$
. The red dots denote the periodic orbits corresponding to members of the main x1 family and the blue points are members of the x2 family. We notice that the x2 region is limited by the iILR and the oILR, between
$y \approx 6.11\text{kpc}$
. The red dots denote the periodic orbits corresponding to members of the main x1 family and the blue points are members of the x2 family. We notice that the x2 region is limited by the iILR and the oILR, between $y \approx 0.12$
and
$y \approx 0.12$
and $0.86\text{kpc}$
. On the right panel of Fig. 1 we show a sample of members of the x1 and x2 families of periodic orbits (in red and blue, respectively). The x1 orbits support and shape the galactic bar, while the x2 orbits support the internal ring, or in this case the CMZ.
$0.86\text{kpc}$
. On the right panel of Fig. 1 we show a sample of members of the x1 and x2 families of periodic orbits (in red and blue, respectively). The x1 orbits support and shape the galactic bar, while the x2 orbits support the internal ring, or in this case the CMZ.
(Left): Jacobi energy ( $E_\mathrm{J}$
) versus the intersection with the y-axis for periodic orbits of the x1 (red dots) and the x2 (blue dots) families in the autonomous model. The black curve corresponds to the zero velocity curve. The green, orange, and magenta vertical lines show the position of the corotation radius, the iILR, and the oILR, respectively. The horizontal grey lines show the extension of the x2 region. (Right): A sample of members of the x1 and the x2 orbit families (red and blue lines, respectively).
$E_\mathrm{J}$
) versus the intersection with the y-axis for periodic orbits of the x1 (red dots) and the x2 (blue dots) families in the autonomous model. The black curve corresponds to the zero velocity curve. The green, orange, and magenta vertical lines show the position of the corotation radius, the iILR, and the oILR, respectively. The horizontal grey lines show the extension of the x2 region. (Right): A sample of members of the x1 and the x2 orbit families (red and blue lines, respectively).
Gas parcels try to follow periodic orbits (as long as the orbit does not cross itself) since the pressure forces are much smaller than the gravitational forces. Therefore, we should see gas structures associated to the bar (when the gas follows x1 orbits) or to the internal ring (when the gas follows x2 orbits).
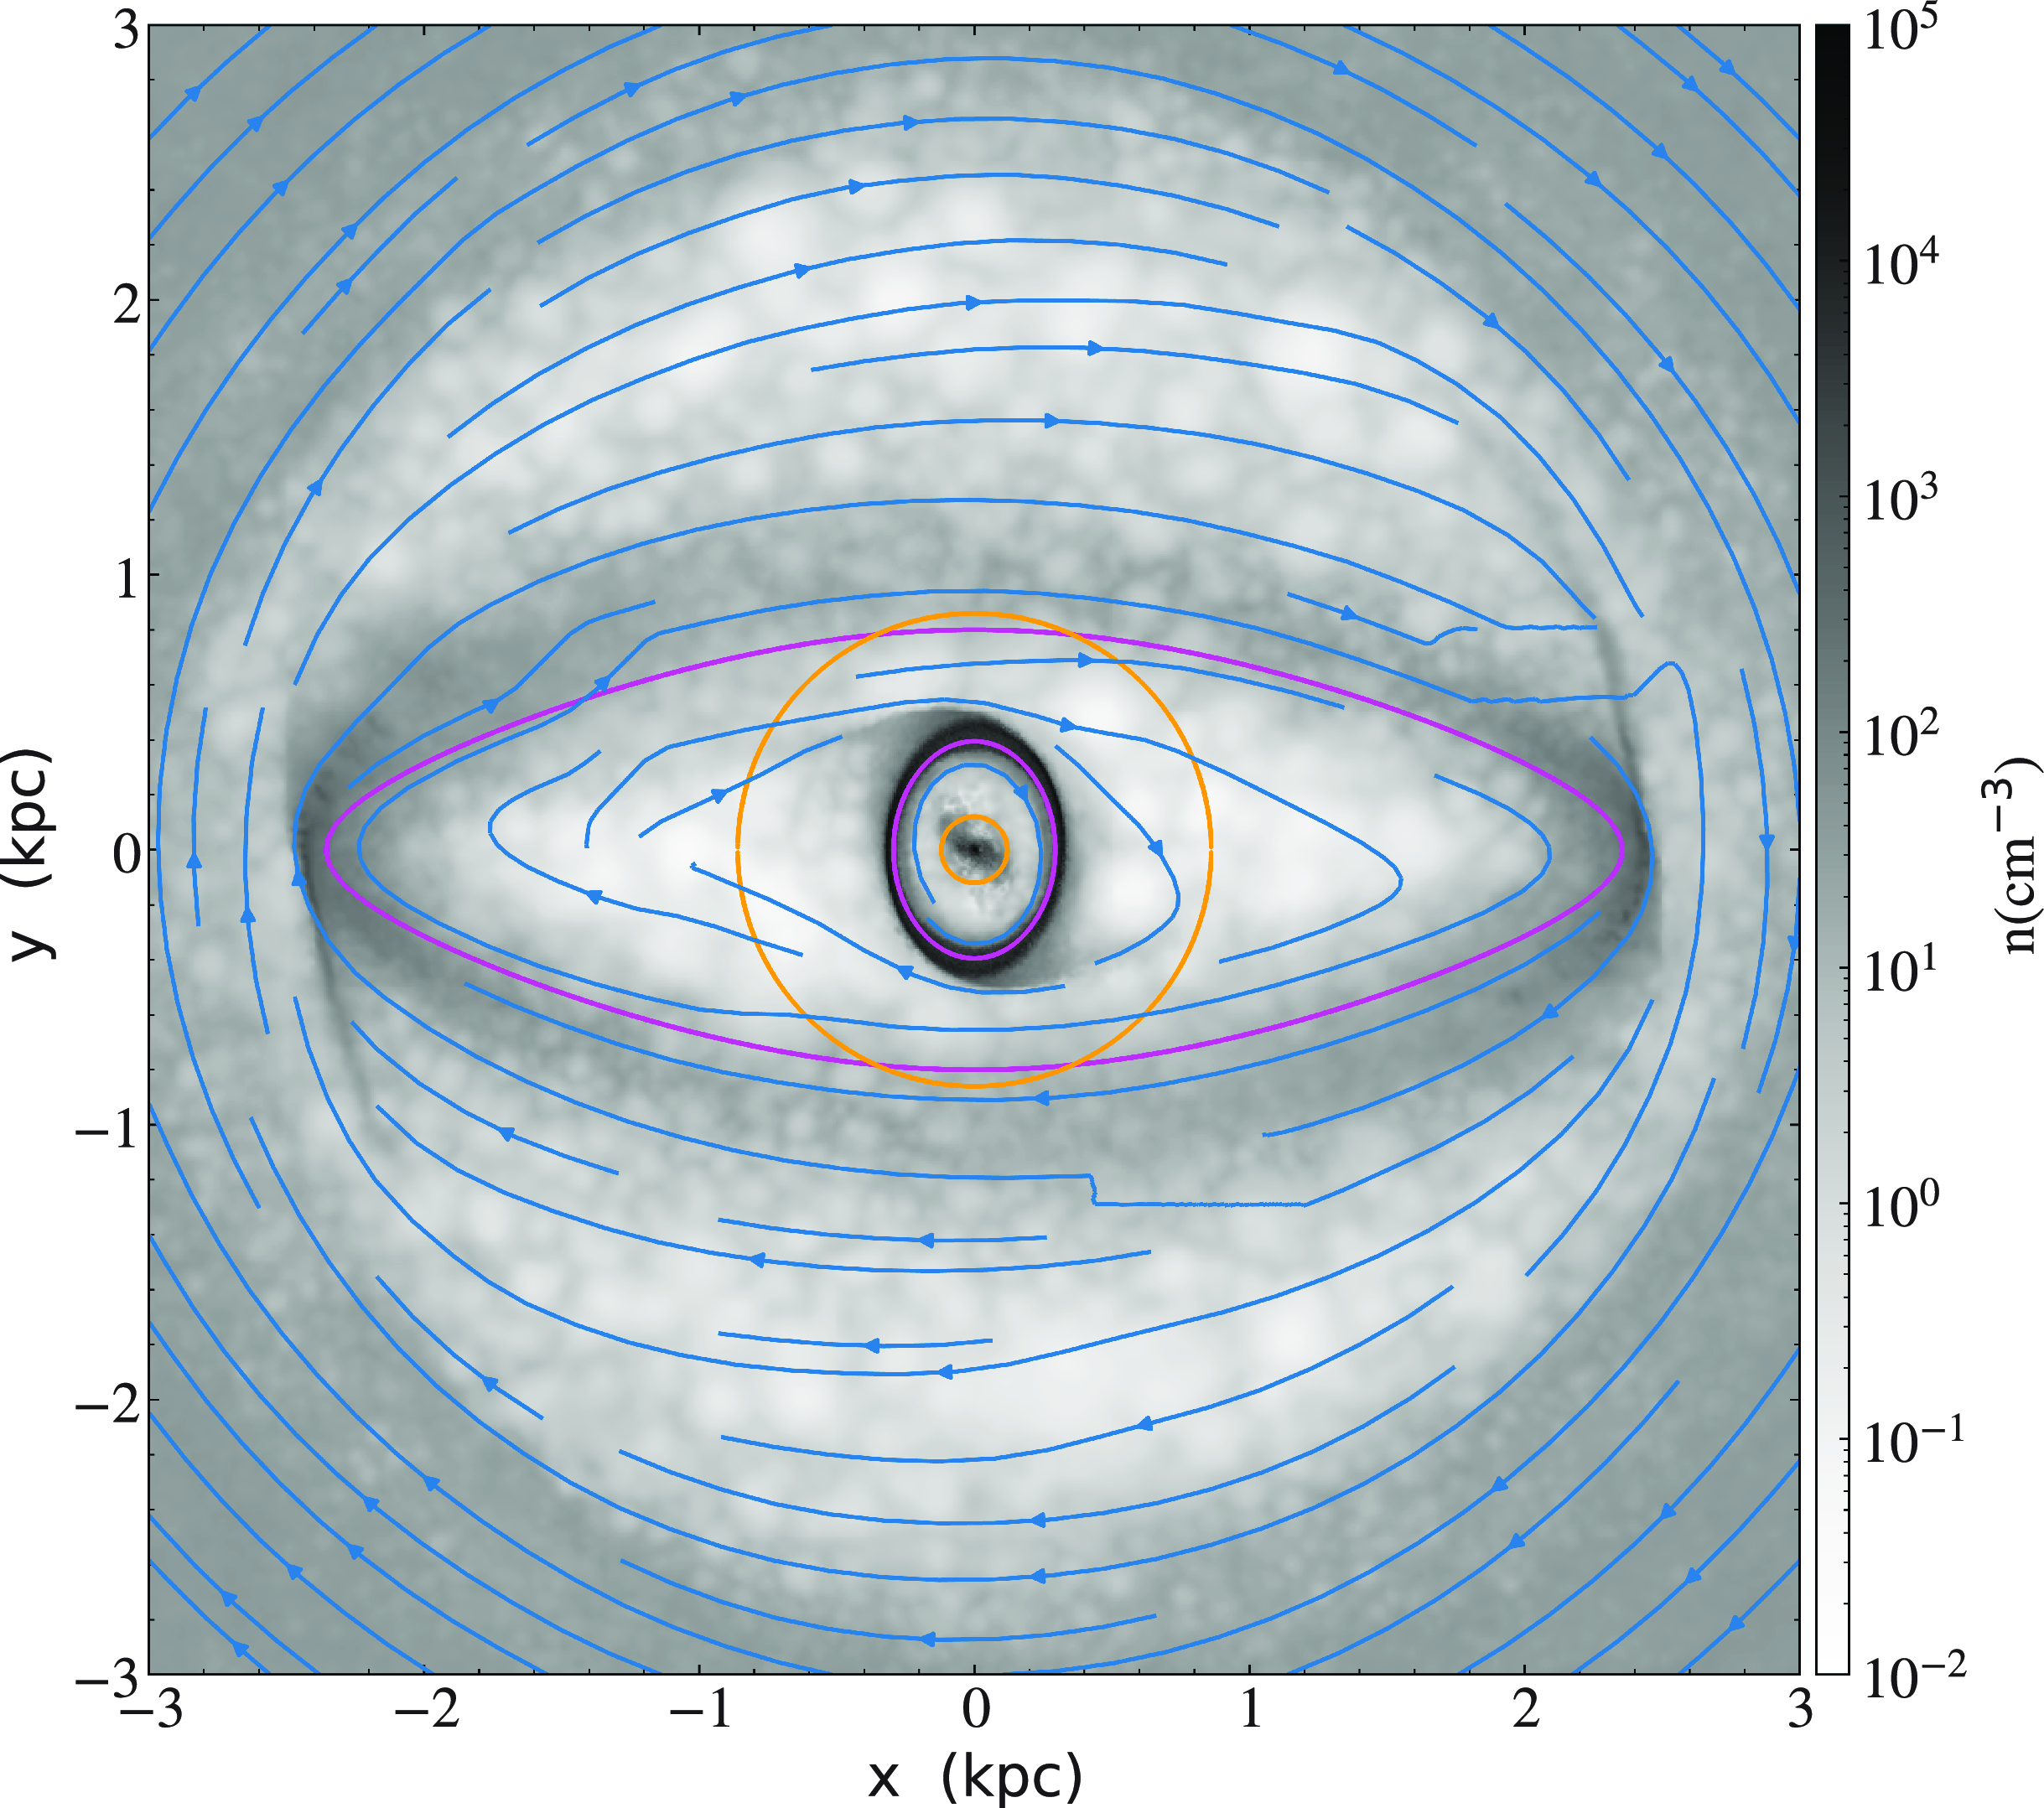
In Fig. 2, we show the gas density distribution after $2\text{Gyr}$
of evolution. We observe a bar structure with an approximately
$2\text{Gyr}$
of evolution. We observe a bar structure with an approximately $2.4 \, \text{kpc}$
semi-major axis and an internal ring in the region between the two ILRs (defined with the two green circles). This ring structure appears to be generated by gas following x2 orbits. The internal magenta orbit corresponds to an x2 orbit that approximately matches the CMZ and the external magenta orbit corresponds to a member of the x1 family that matches the bar.
$2.4 \, \text{kpc}$
semi-major axis and an internal ring in the region between the two ILRs (defined with the two green circles). This ring structure appears to be generated by gas following x2 orbits. The internal magenta orbit corresponds to an x2 orbit that approximately matches the CMZ and the external magenta orbit corresponds to a member of the x1 family that matches the bar.
Density map at $t=2\,000 \, \text{Myr}$
. The magenta lines correspond to two orbits from the x1 (outer line,
$t=2\,000 \, \text{Myr}$
. The magenta lines correspond to two orbits from the x1 (outer line, $E_\mathrm{J}= -0.444 \, \text{kpc}^{2}/\text{Myr}^{2}$
) and x2 family (inner line,
$E_\mathrm{J}= -0.444 \, \text{kpc}^{2}/\text{Myr}^{2}$
) and x2 family (inner line, $E_\mathrm{J}=-0.486 \, \text{kpc}^{2}/\text{Myr}^{2}$
). The orange circles denote the positions of the iILR and the oILR.
$E_\mathrm{J}=-0.486 \, \text{kpc}^{2}/\text{Myr}^{2}$
). The orange circles denote the positions of the iILR and the oILR.
3.1 Phases of the ring
The internal ring formed in this simulation presents abrupt changes in morphology during the simulation. Three phases of evolution are distinguishable, which we identify as formation, instability, and quasi-stationary state. The main changes in morphology occur during the phases of formation and instability. After the instability phase, the ring achieves a stationary state in morphology and star formation. In this section, we discuss these phases.
3.1.1 Formation
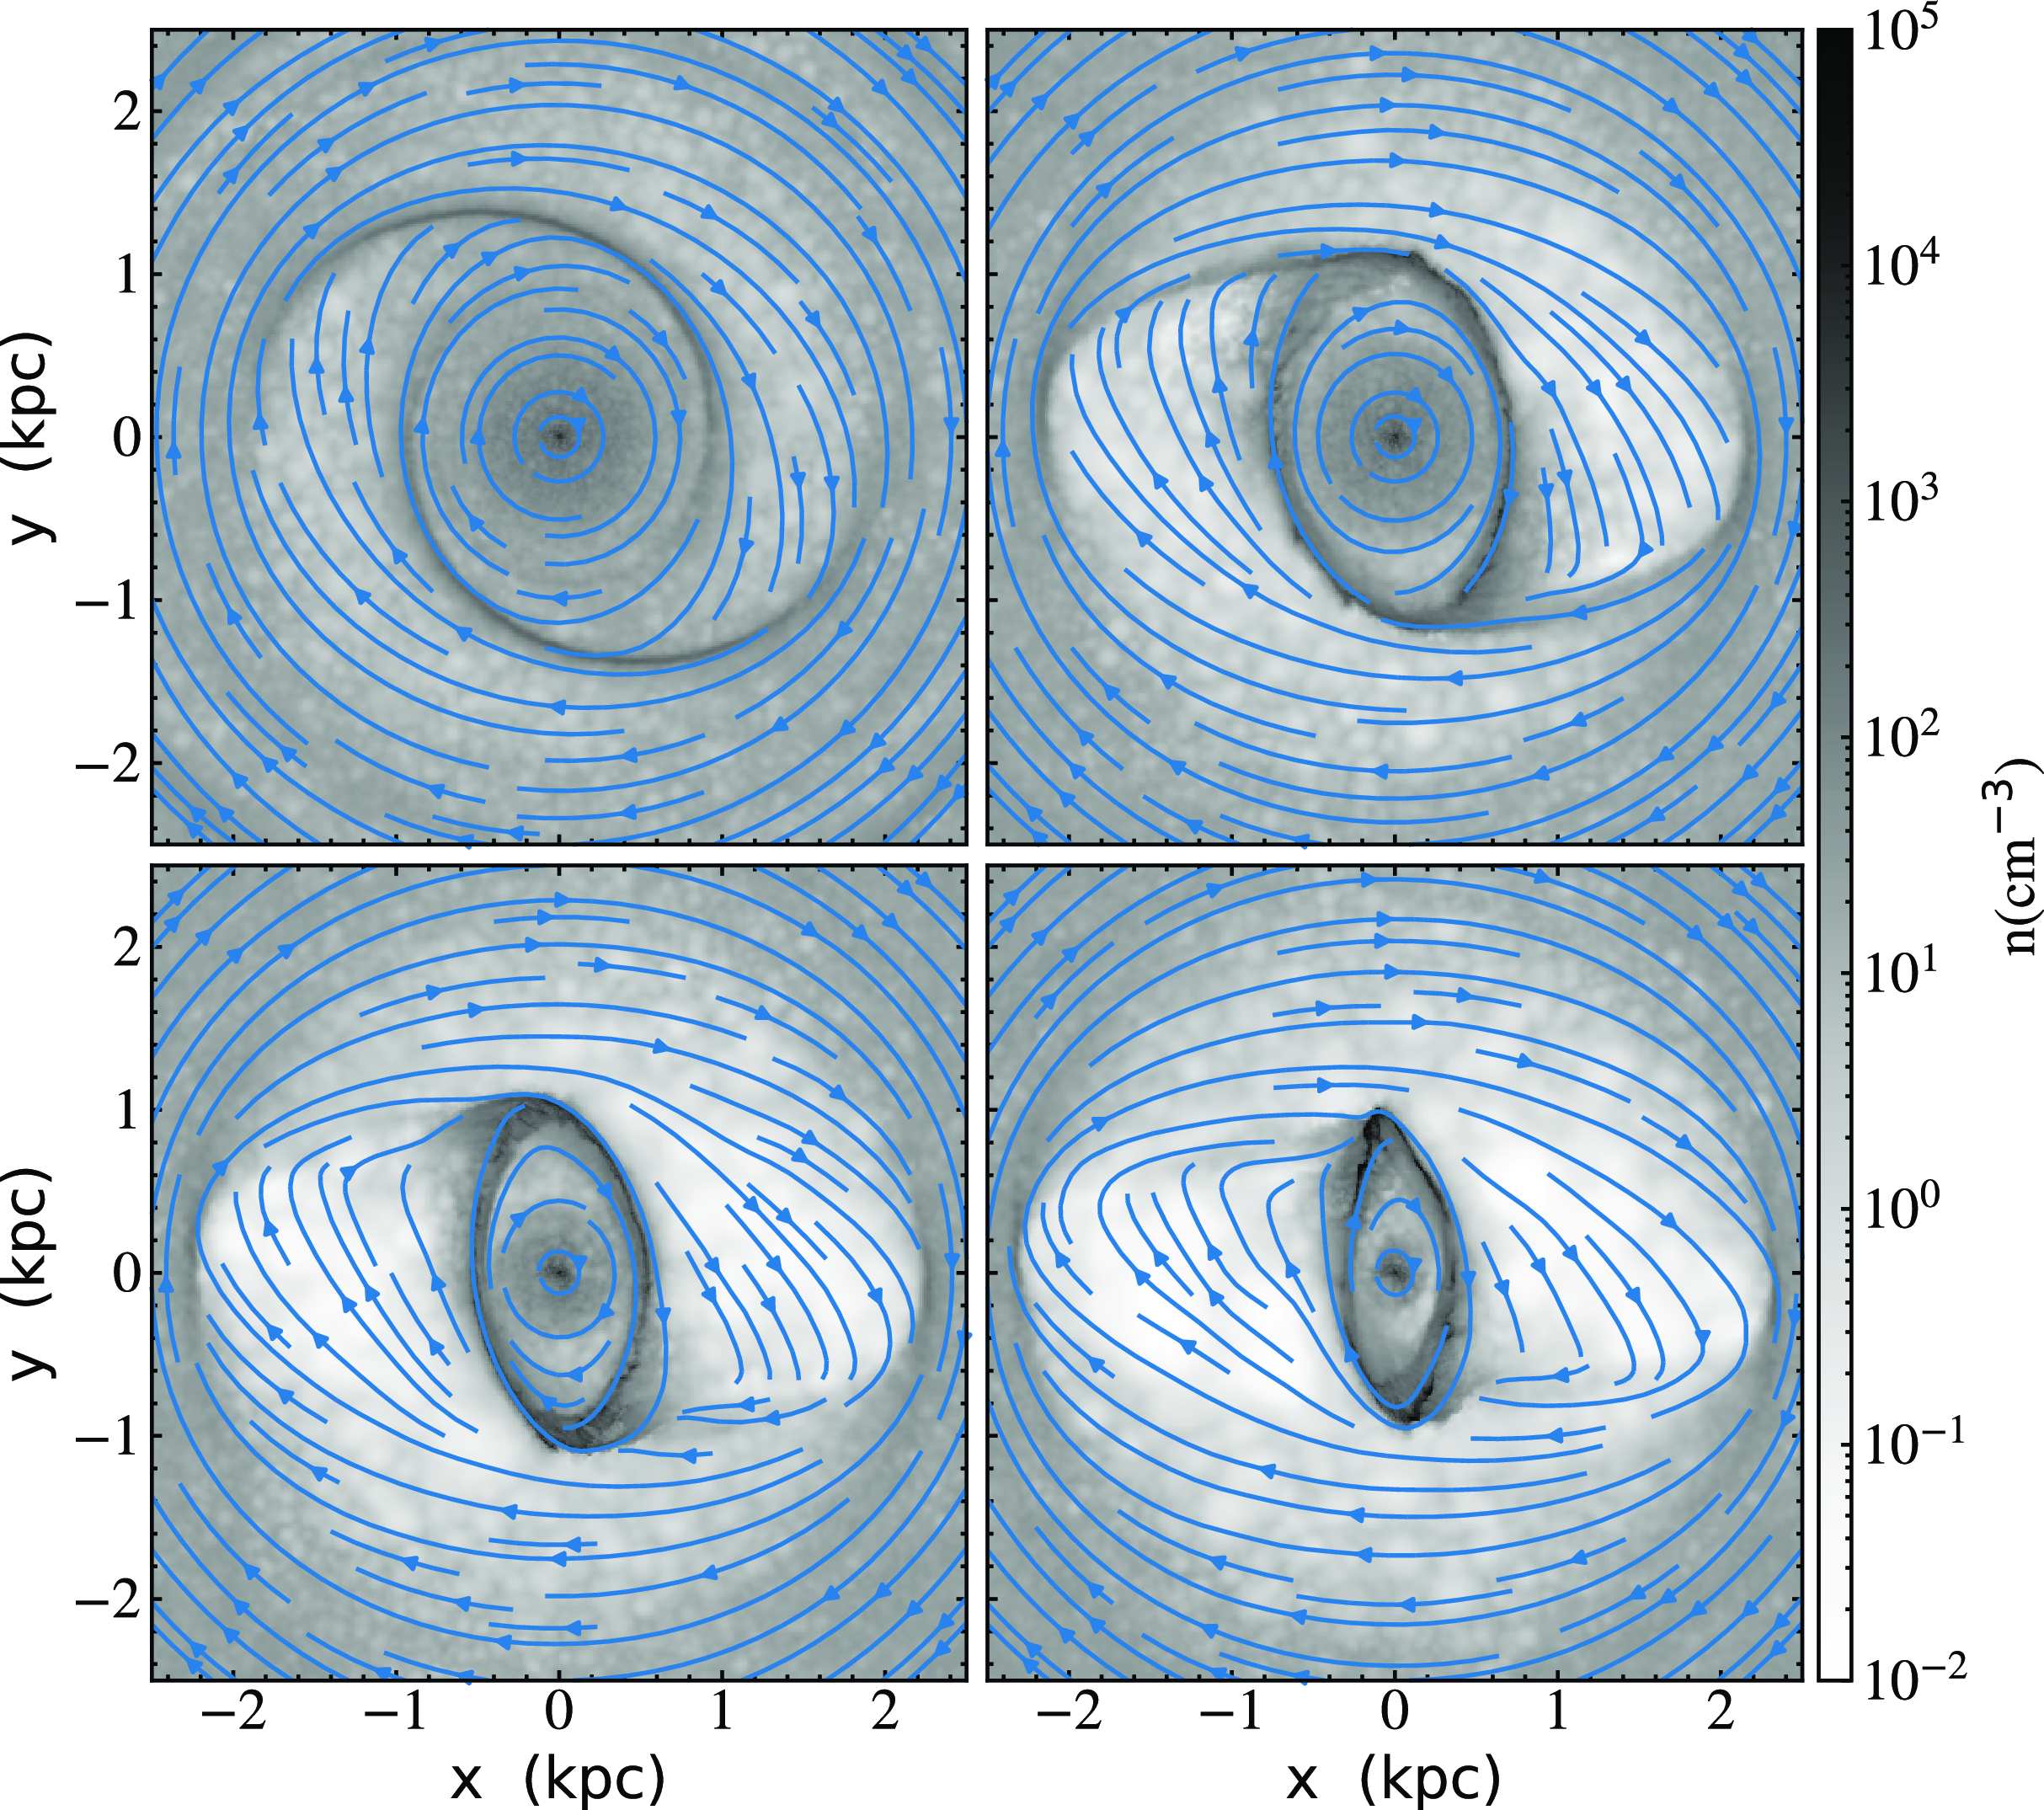
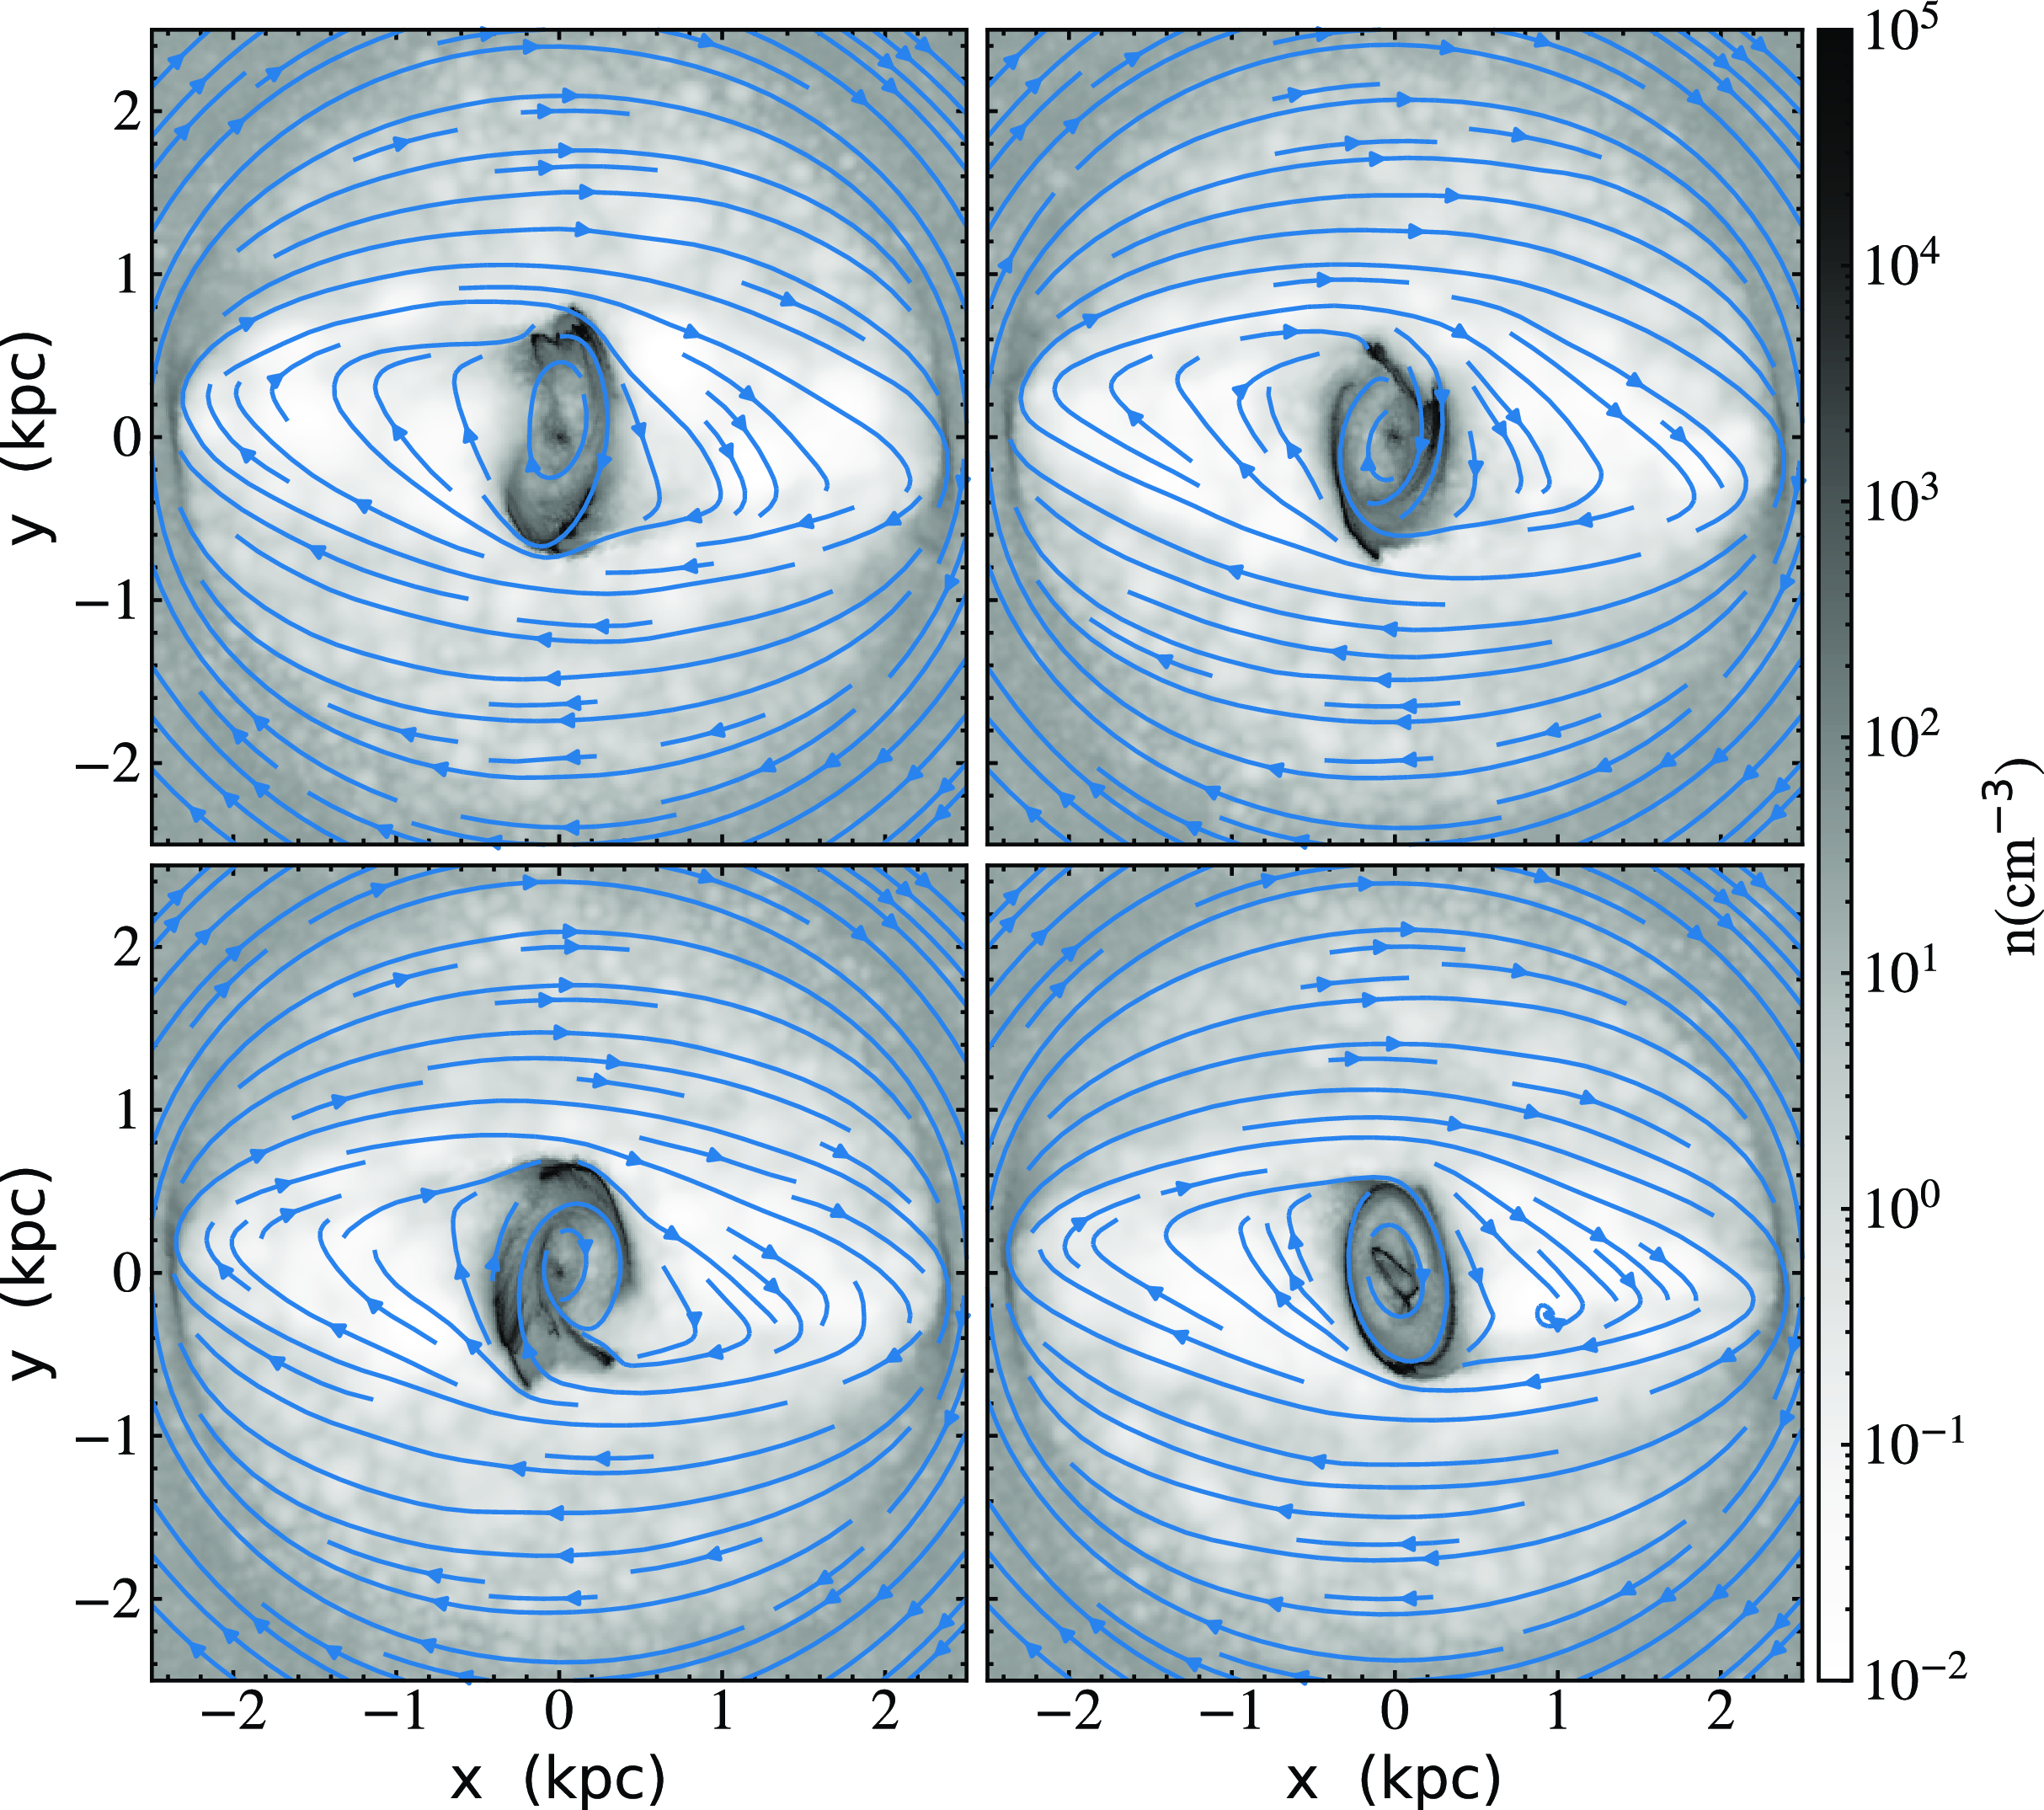
Fig. 3 shows the evolution of the ring from 300 through $650 \, \text{Myr}$
. Since this period roughly corresponds to the time during which the bar is imposed and the bulge mass diminished, the location of the resonances in the system slowly changes. At
$650 \, \text{Myr}$
. Since this period roughly corresponds to the time during which the bar is imposed and the bulge mass diminished, the location of the resonances in the system slowly changes. At $t=300 \, \text{Myr}$
spiral arms are formed in the gas within a
$t=300 \, \text{Myr}$
spiral arms are formed in the gas within a $2 \, \text{kpc}$
radius. According to Sormani et al. (Reference Sormani, Sobacchi and Sanders2024), these spirals correspond to density waves that have been excited by the bar potential in regions close to the oILR. In principle, these waves remove angular momentum from the gas and, consequently, the material is transported inside the oILR, forming the inner ring. The streamlines show that the trajectory of the gas particles at this time is almost circular since the bar is still weak (23% of the bulge mass at this time). The spirals lead to an oval structure that becomes apparent at later times. As the bulge becomes more massive than the bar, the model presents a strong contribution of the x2 orbital family and the gas begins to accumulate in this resonance.
$2 \, \text{kpc}$
radius. According to Sormani et al. (Reference Sormani, Sobacchi and Sanders2024), these spirals correspond to density waves that have been excited by the bar potential in regions close to the oILR. In principle, these waves remove angular momentum from the gas and, consequently, the material is transported inside the oILR, forming the inner ring. The streamlines show that the trajectory of the gas particles at this time is almost circular since the bar is still weak (23% of the bulge mass at this time). The spirals lead to an oval structure that becomes apparent at later times. As the bulge becomes more massive than the bar, the model presents a strong contribution of the x2 orbital family and the gas begins to accumulate in this resonance.
Midplane gaseous density at $t = 300$
, 450 (top row), 570, and
$t = 300$
, 450 (top row), 570, and $650\text{Myr}$
(bottom row) into the simulation. Blue streamlines trace the velocity field of the gas. During this time the model is evolving since the bar is growing at the expense of the bulge mass. It can be seen that the formation of the internal ring structure is due to the perturbation of trailing density waves from the bar.
$650\text{Myr}$
(bottom row) into the simulation. Blue streamlines trace the velocity field of the gas. During this time the model is evolving since the bar is growing at the expense of the bulge mass. It can be seen that the formation of the internal ring structure is due to the perturbation of trailing density waves from the bar.
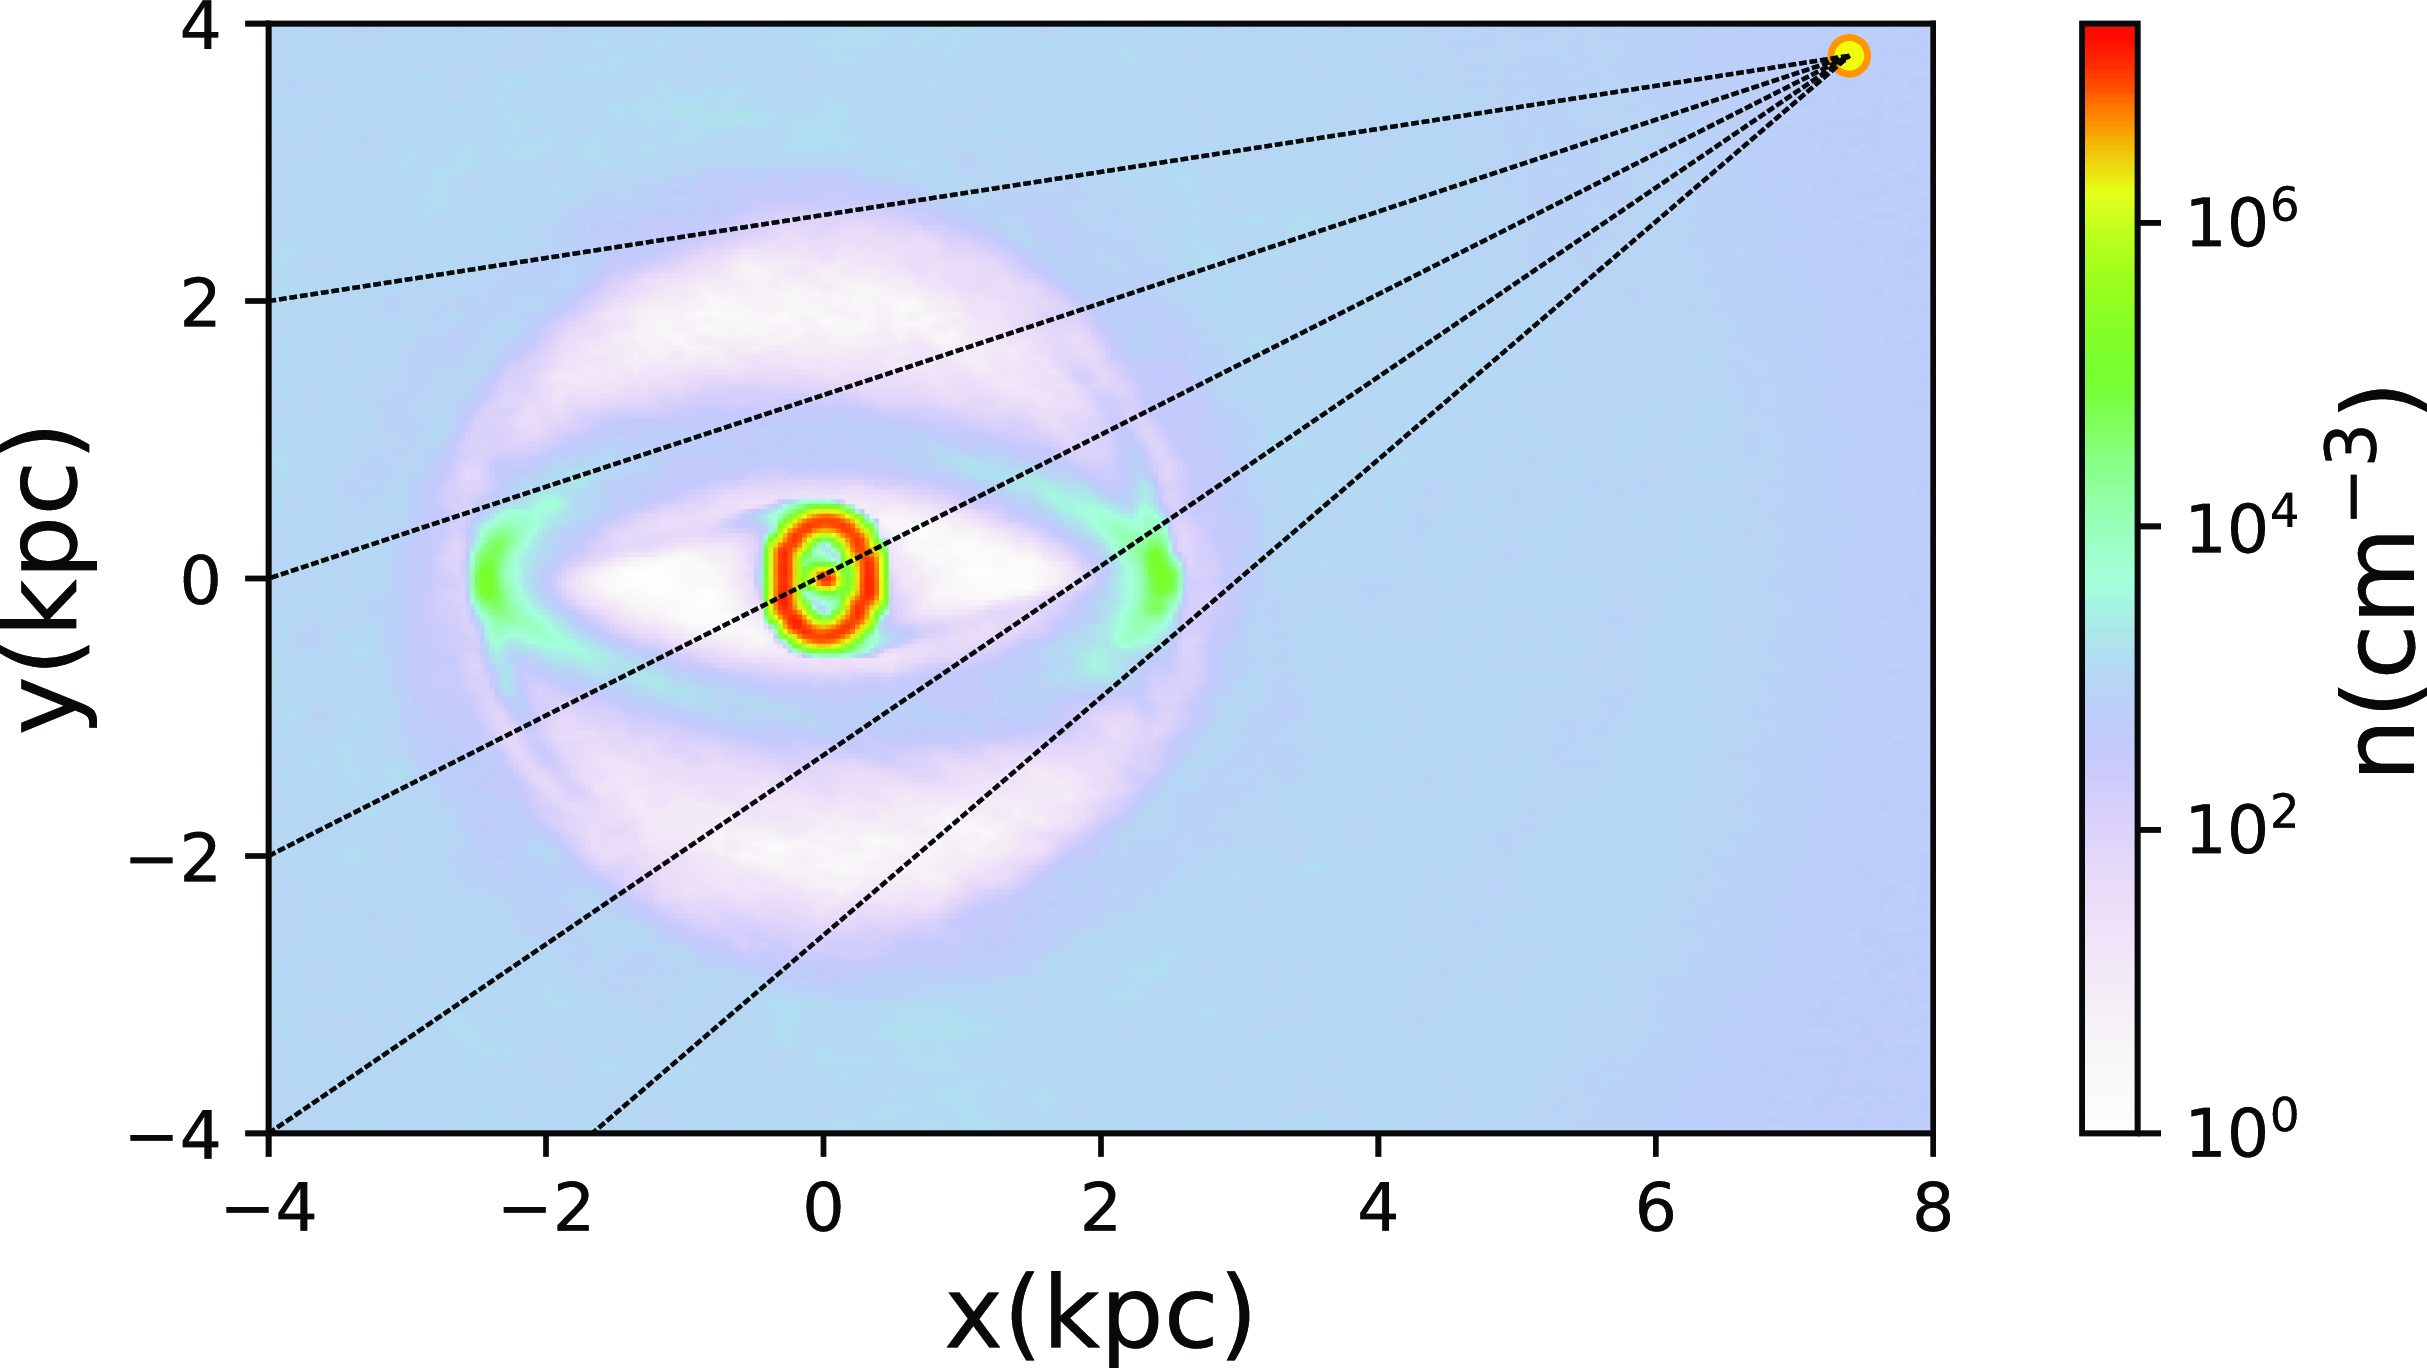
Position selected for the observer in the simulated $l-b$
visualisations. The semi-major axis of the galactic bar forms an angle of
$l-b$
visualisations. The semi-major axis of the galactic bar forms an angle of $-27^{o}$
with respect to the line between the galactic centre and the Sun at
$-27^{o}$
with respect to the line between the galactic centre and the Sun at $8.3 \, \text{kpc}$
(yellow dot). Colours show the gaseous density distribution at
$8.3 \, \text{kpc}$
(yellow dot). Colours show the gaseous density distribution at $t=2 \, \text{Gyr}$
.
$t=2 \, \text{Gyr}$
.
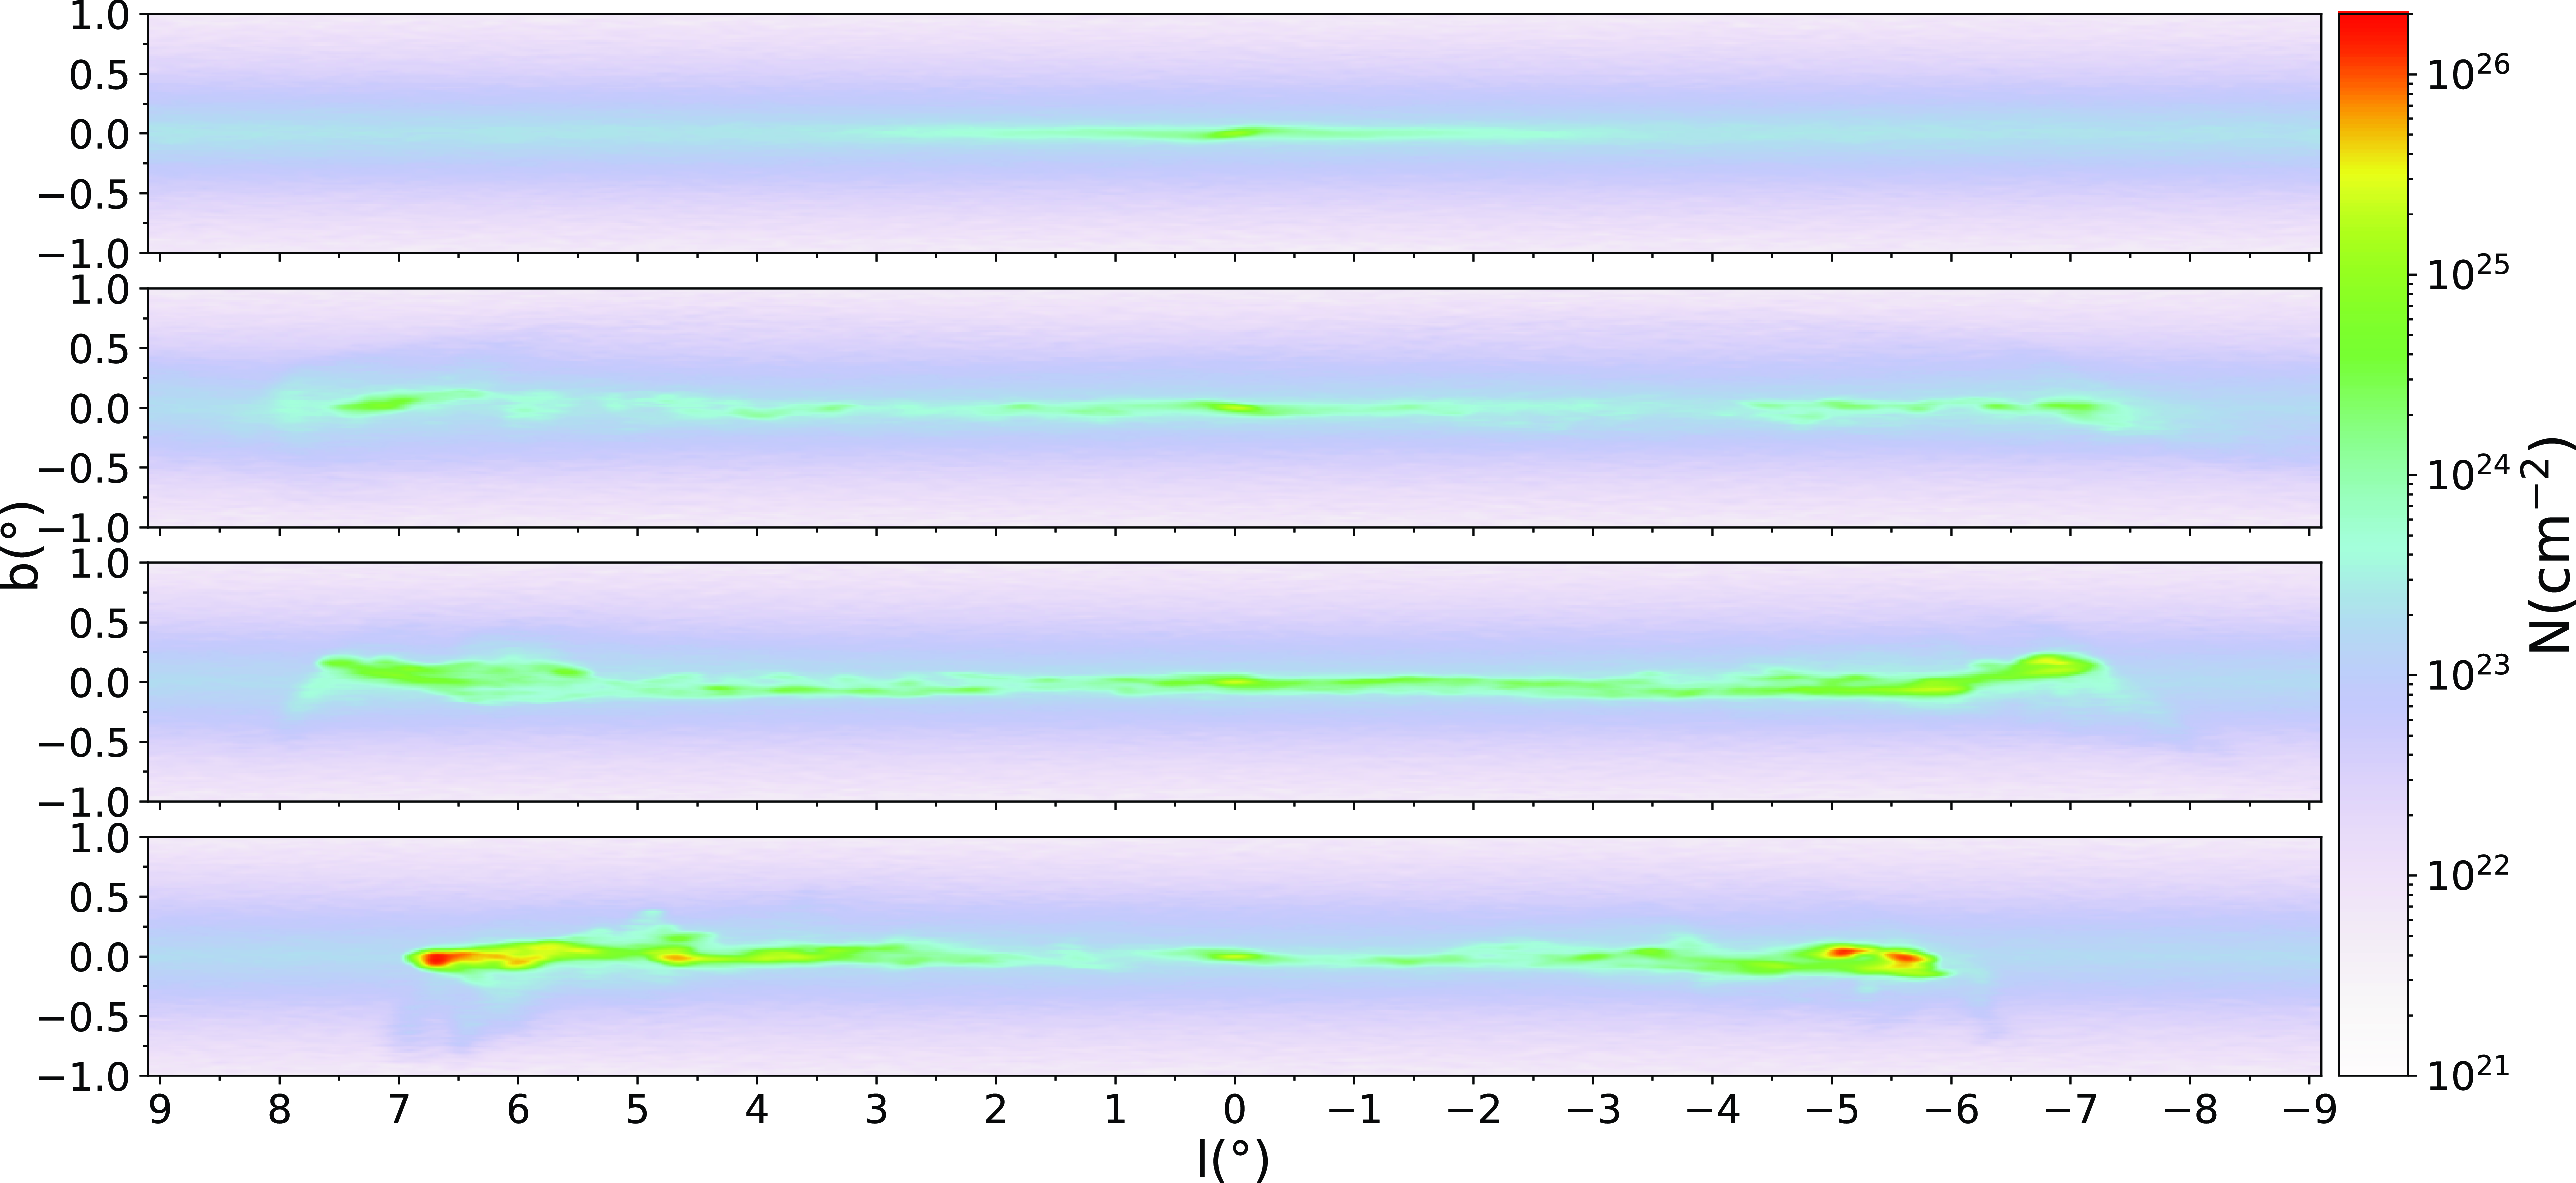
Views of the ring structure projected to the plane of the sky in galactic coordinates (l-b) for the same times as in Fig. 3: down from the top panel, $t=300, 450, 570$
, and
$t=300, 450, 570$
, and $650 \, \text{Myr}$
.
$650 \, \text{Myr}$
.
At $t=450 \, \text{Myr}$
, a well defined ringed structure appears with densities around
$t=450 \, \text{Myr}$
, a well defined ringed structure appears with densities around $2\times10^{2} \, \text{cm}^{-3}$
containing small regions above
$2\times10^{2} \, \text{cm}^{-3}$
containing small regions above $10^{3} \, \text{cm}^{-3}$
. The velocity streamlines show distorted gas motion around the ring with over-densities at the ends of the remnants of the spiral. From these overdensities, dust channels leading to the tips of the (now oval) ring are clearly seen. These dust channels are the trajectories of the gas from the borders of the bar toward the ring.
$10^{3} \, \text{cm}^{-3}$
. The velocity streamlines show distorted gas motion around the ring with over-densities at the ends of the remnants of the spiral. From these overdensities, dust channels leading to the tips of the (now oval) ring are clearly seen. These dust channels are the trajectories of the gas from the borders of the bar toward the ring.
At $t=570 \, \text{Myr}$
, the ring is more elongated and it has reduced its size, presumably since the increased mass of the bar has reduced the region where x2 orbits are allowed. Although the ring is smaller, its gas density is increased. The dust channels are less visible in density but are still discernible as abrupt direction changes in the gas streamlines.
$t=570 \, \text{Myr}$
, the ring is more elongated and it has reduced its size, presumably since the increased mass of the bar has reduced the region where x2 orbits are allowed. Although the ring is smaller, its gas density is increased. The dust channels are less visible in density but are still discernible as abrupt direction changes in the gas streamlines.
At $650 \, \text{Myr}$
, the imposition of the bar is almost complete. We observe regions near the apocentres of the ring with densities above
$650 \, \text{Myr}$
, the imposition of the bar is almost complete. We observe regions near the apocentres of the ring with densities above $10^{4} \, \text{cm}^{-3}$
. Note that the ring eccentricity is higher than at previous times. Also, the ring is smaller because the region between the ILRs shrinks. At this time, the gas density within the bar potential reaches its lowest values.
$10^{4} \, \text{cm}^{-3}$
. Note that the ring eccentricity is higher than at previous times. Also, the ring is smaller because the region between the ILRs shrinks. At this time, the gas density within the bar potential reaches its lowest values.
To compare the kinematics and star formation in the ring to the observed CMZ, we placed an imaginary observer at $8.3 \, \text{kpc}$
from the galactic centre, along a line inclined
$8.3 \, \text{kpc}$
from the galactic centre, along a line inclined $-27^{\circ}$
with respect to the bar’s axis (Wegg & Gerhard Reference Wegg and Gerhard2013a; Bland-Hawthorn & Gerhard Reference Bland-Hawthorn and Gerhard2016), as shown in Fig. 4. Based in this geometry,Fig. 5 shows the projections onto the plane of the sky corresponding to the same evolution times from Fig. 3. The projected ring slowly decreases its angular size in galactic longitude, finally reaching from
$-27^{\circ}$
with respect to the bar’s axis (Wegg & Gerhard Reference Wegg and Gerhard2013a; Bland-Hawthorn & Gerhard Reference Bland-Hawthorn and Gerhard2016), as shown in Fig. 4. Based in this geometry,Fig. 5 shows the projections onto the plane of the sky corresponding to the same evolution times from Fig. 3. The projected ring slowly decreases its angular size in galactic longitude, finally reaching from $l \sim -6.5^{\circ}$
to
$l \sim -6.5^{\circ}$
to $\sim$ $7^{\circ}$
.
$7^{\circ}$
.
Between $t=667$
and
$t=667$
and $730 \, \text{Myr}$
, a little after the end of the imposition of the bar, the ring does not suffer significant morphological changes. However, the star formation reaches its highest activity in this period (see Section 5).
$730 \, \text{Myr}$
, a little after the end of the imposition of the bar, the ring does not suffer significant morphological changes. However, the star formation reaches its highest activity in this period (see Section 5).
3.1.2 Instability
During the second stage of the ring evolution, the morphology of the ring changes rapidly for a period of almost $118 \, \text{Myr}$
. Fig. 6 shows density maps between 730 and
$118 \, \text{Myr}$
. Fig. 6 shows density maps between 730 and $785\text{Myr}$
into the simulation. At the beginning of this period, the ring undergoes a strong disruption with large regions with densities above
$785\text{Myr}$
into the simulation. At the beginning of this period, the ring undergoes a strong disruption with large regions with densities above $10^{4}\text{cm}^{-3}$
. Since the external potential remains static at this stage, we attribute the high densities achieved to gravitational collapse within the ring. At later times, these two segments orbit the galactic centre and the ring morphology approaches an x2 orbit again.
$10^{4}\text{cm}^{-3}$
. Since the external potential remains static at this stage, we attribute the high densities achieved to gravitational collapse within the ring. At later times, these two segments orbit the galactic centre and the ring morphology approaches an x2 orbit again.
Gaseous density at $t = 730$
(top Left), 735 (top Right), 745 (down left), and
$t = 730$
(top Left), 735 (top Right), 745 (down left), and $785 \, \text{Myr}$
(down right). During this lapse, the morphology of the ring manifests an irregular behaviour which we attribute to self-gravity.
$785 \, \text{Myr}$
(down right). During this lapse, the morphology of the ring manifests an irregular behaviour which we attribute to self-gravity.
Evolution of the ring region projected on the sky. Down from the top, panels show the simulation at $t=730$
, 735, 745, and
$t=730$
, 735, 745, and $785 \, \text{Myr}$
.
$785 \, \text{Myr}$
.
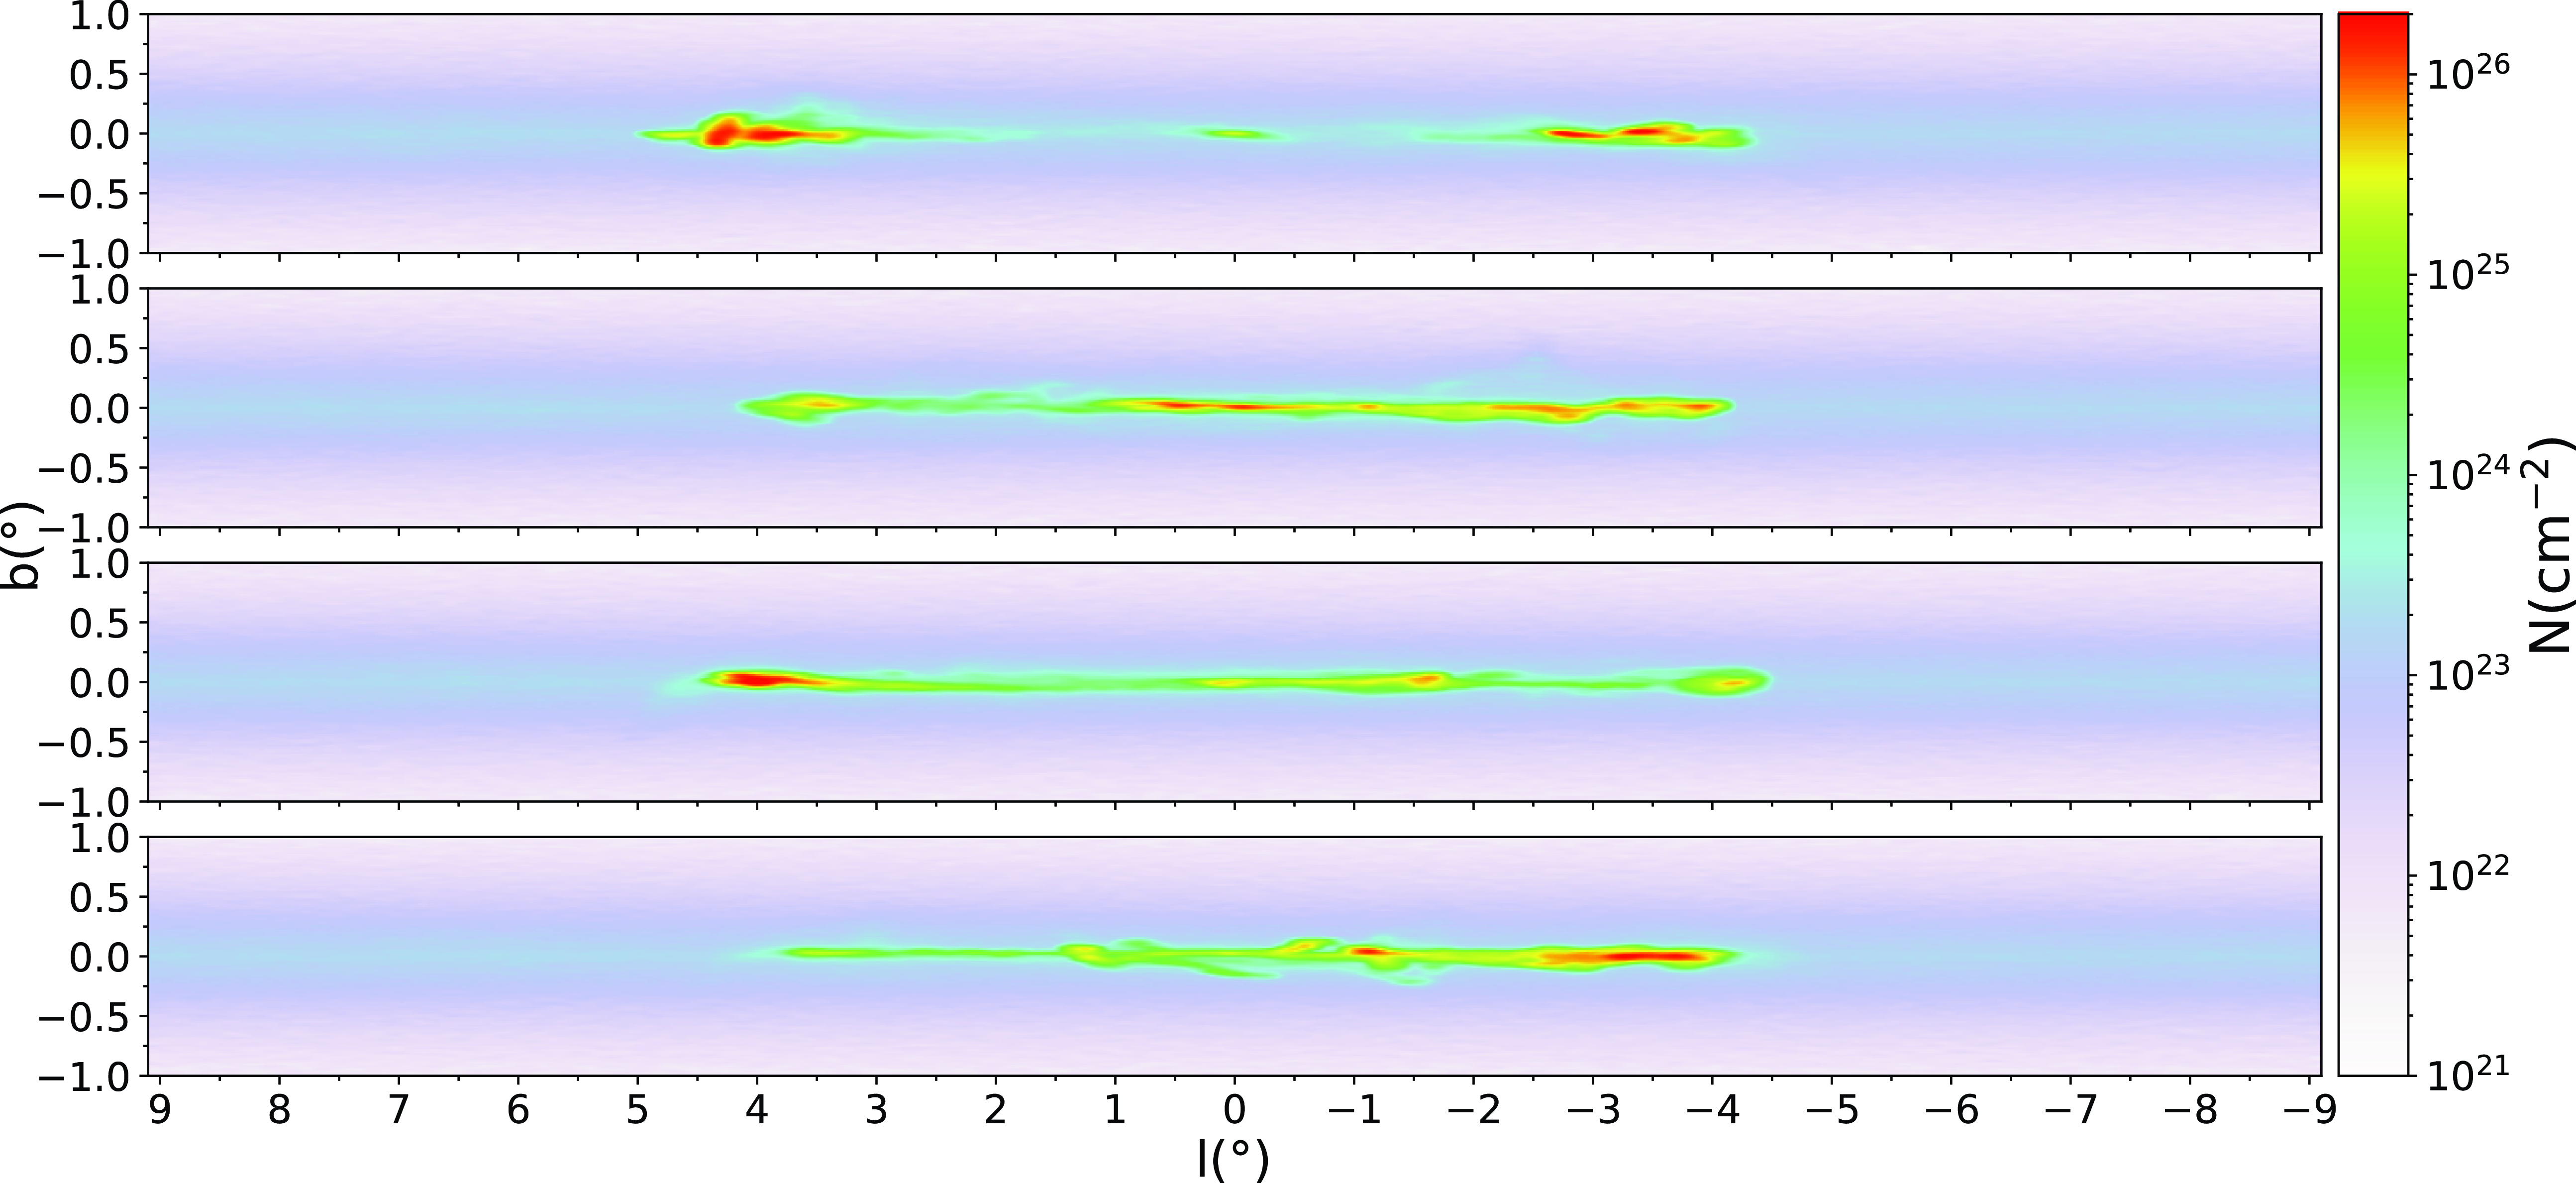
Fig. 7 shows the plane-of-the-sky projection for this period. At $730 \, \text{Myr}$
, on the borders of the structure, we observe surface number densities above
$730 \, \text{Myr}$
, on the borders of the structure, we observe surface number densities above $10^{26} \, \text{cm}^{-2}$
and the extension of the ring decreases even if the bar and bulge potentials remain unchanged and the x2-orbit region size is constant. Although high-density regions can be seen above or below the galactic midplane during the formation stage, during the instability stage these departures appear to be more organised, suggesting that the condensations might follow off-plane oscillating orbits.
$10^{26} \, \text{cm}^{-2}$
and the extension of the ring decreases even if the bar and bulge potentials remain unchanged and the x2-orbit region size is constant. Although high-density regions can be seen above or below the galactic midplane during the formation stage, during the instability stage these departures appear to be more organised, suggesting that the condensations might follow off-plane oscillating orbits.
3.1.3 Quasi-stationary state
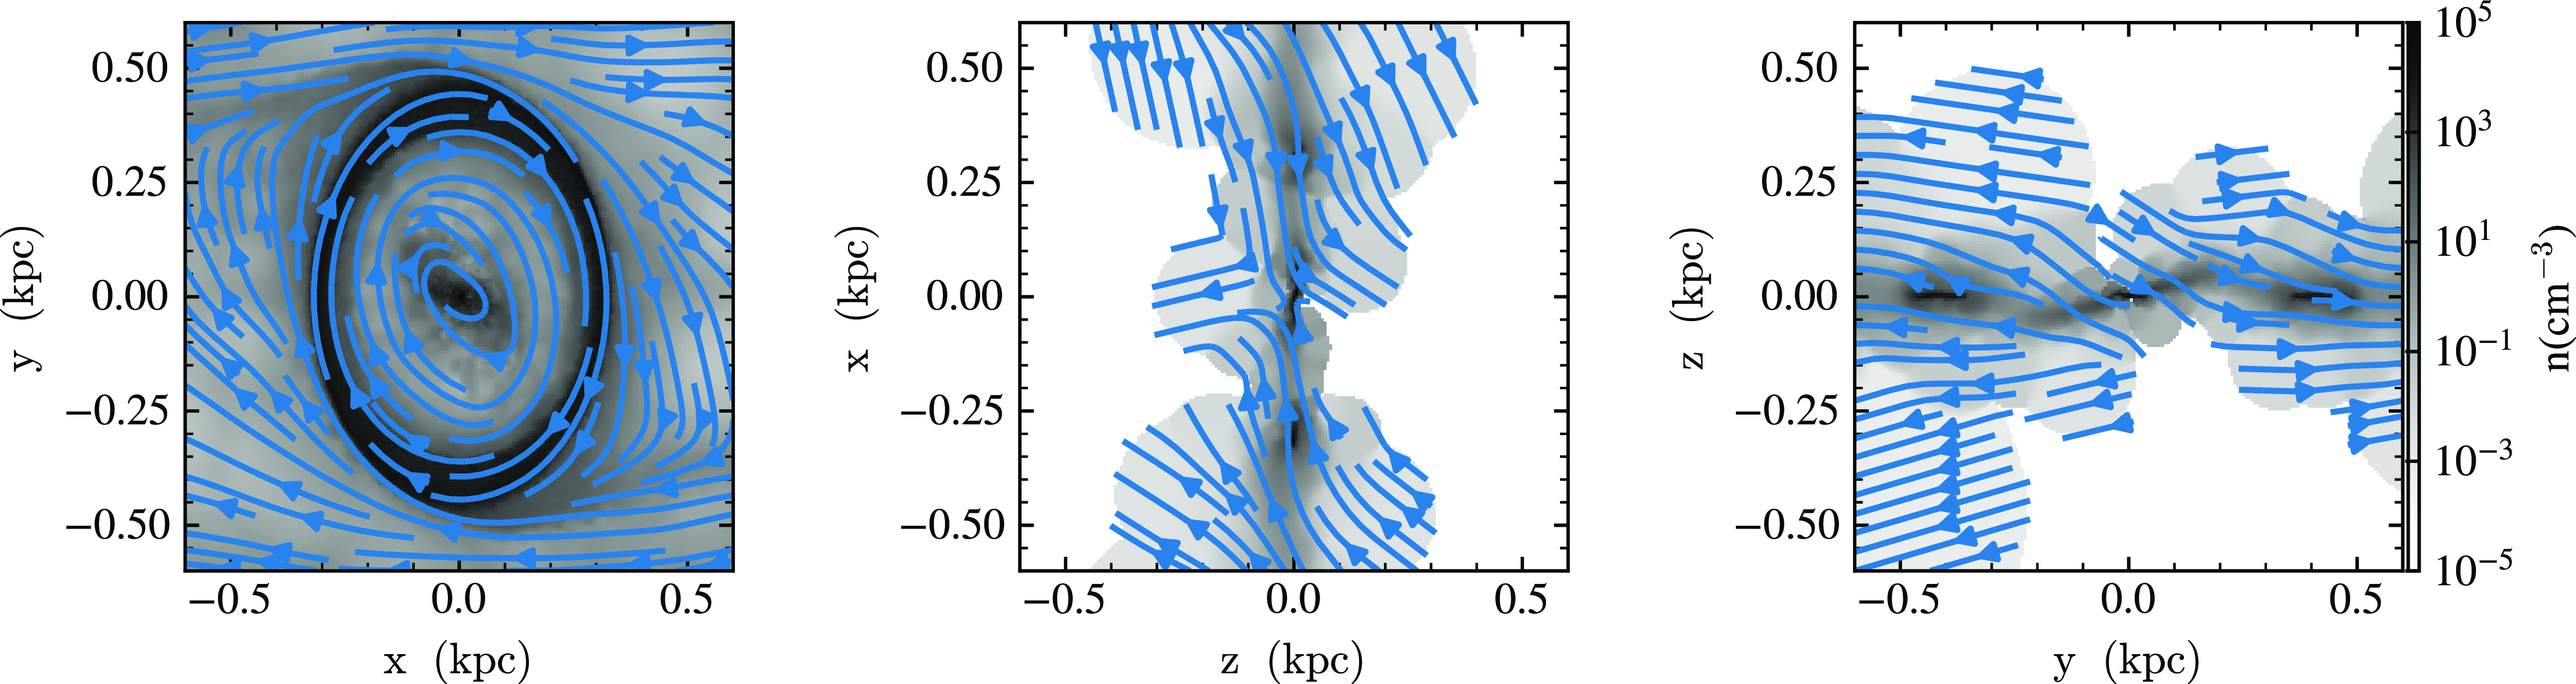
After the instability stage, the ring further reduces its size and enters a quasi-stationary state until the end of the simulation. Fig. 8 shows the three-dimensional structure of the ring region at $t=2 \, \text{Gyr}$
. Comparison of the
$t=2 \, \text{Gyr}$
. Comparison of the $x-y$
plane (left panel) with Fig. 2, which also corresponds to this stage, shows that the ring closely follows an x2 orbit. Also, faint dust channels can be distinguished in Fig. 2. Sofue (Reference Sofue2022) analysed CO and HI line emission data cubes of the galactic centre region and concluded that the CMZ seems to be embedded in the HI disc of radius
$x-y$
plane (left panel) with Fig. 2, which also corresponds to this stage, shows that the ring closely follows an x2 orbit. Also, faint dust channels can be distinguished in Fig. 2. Sofue (Reference Sofue2022) analysed CO and HI line emission data cubes of the galactic centre region and concluded that the CMZ seems to be embedded in the HI disc of radius $\approx 320 \, \text{pc}$
and vertical scale height
$\approx 320 \, \text{pc}$
and vertical scale height $\approx 70 \, \text{pc}$
. Their analysis suggests a ring-like structure that encloses an area from
$\approx 70 \, \text{pc}$
. Their analysis suggests a ring-like structure that encloses an area from $l=-1^{\circ}.1$ $(-157 \, \text{pc}$
) to
$(-157 \, \text{pc}$
) to $-1^{\circ}.8$ $(257 \, \text{pc}$
). Our results at
$(257 \, \text{pc}$
). Our results at $2\, \, \text{Gyr}$
suggest a ring associated with the x2 orbital configuration of semi-major axis of
$2\, \, \text{Gyr}$
suggest a ring associated with the x2 orbital configuration of semi-major axis of $\approx$ $390 \, \text{pc}$
. Density cuts along the xz and yz planes in Fig. 8 show that the ring is not completely planar but presents fluctuations characterised by excursions on the z axis. The excursions on the vertical direction remain inside
$390 \, \text{pc}$
. Density cuts along the xz and yz planes in Fig. 8 show that the ring is not completely planar but presents fluctuations characterised by excursions on the z axis. The excursions on the vertical direction remain inside $|z| \lt 0.1 \, \text{pc}$
.
$|z| \lt 0.1 \, \text{pc}$
.
Density maps of the ring region at $t=2\,000\text{Myr}$
. Greyscale in the panels show cuts in the simulation box, while blue lines show velocity flowlines in the corresponding plane.
$t=2\,000\text{Myr}$
. Greyscale in the panels show cuts in the simulation box, while blue lines show velocity flowlines in the corresponding plane.
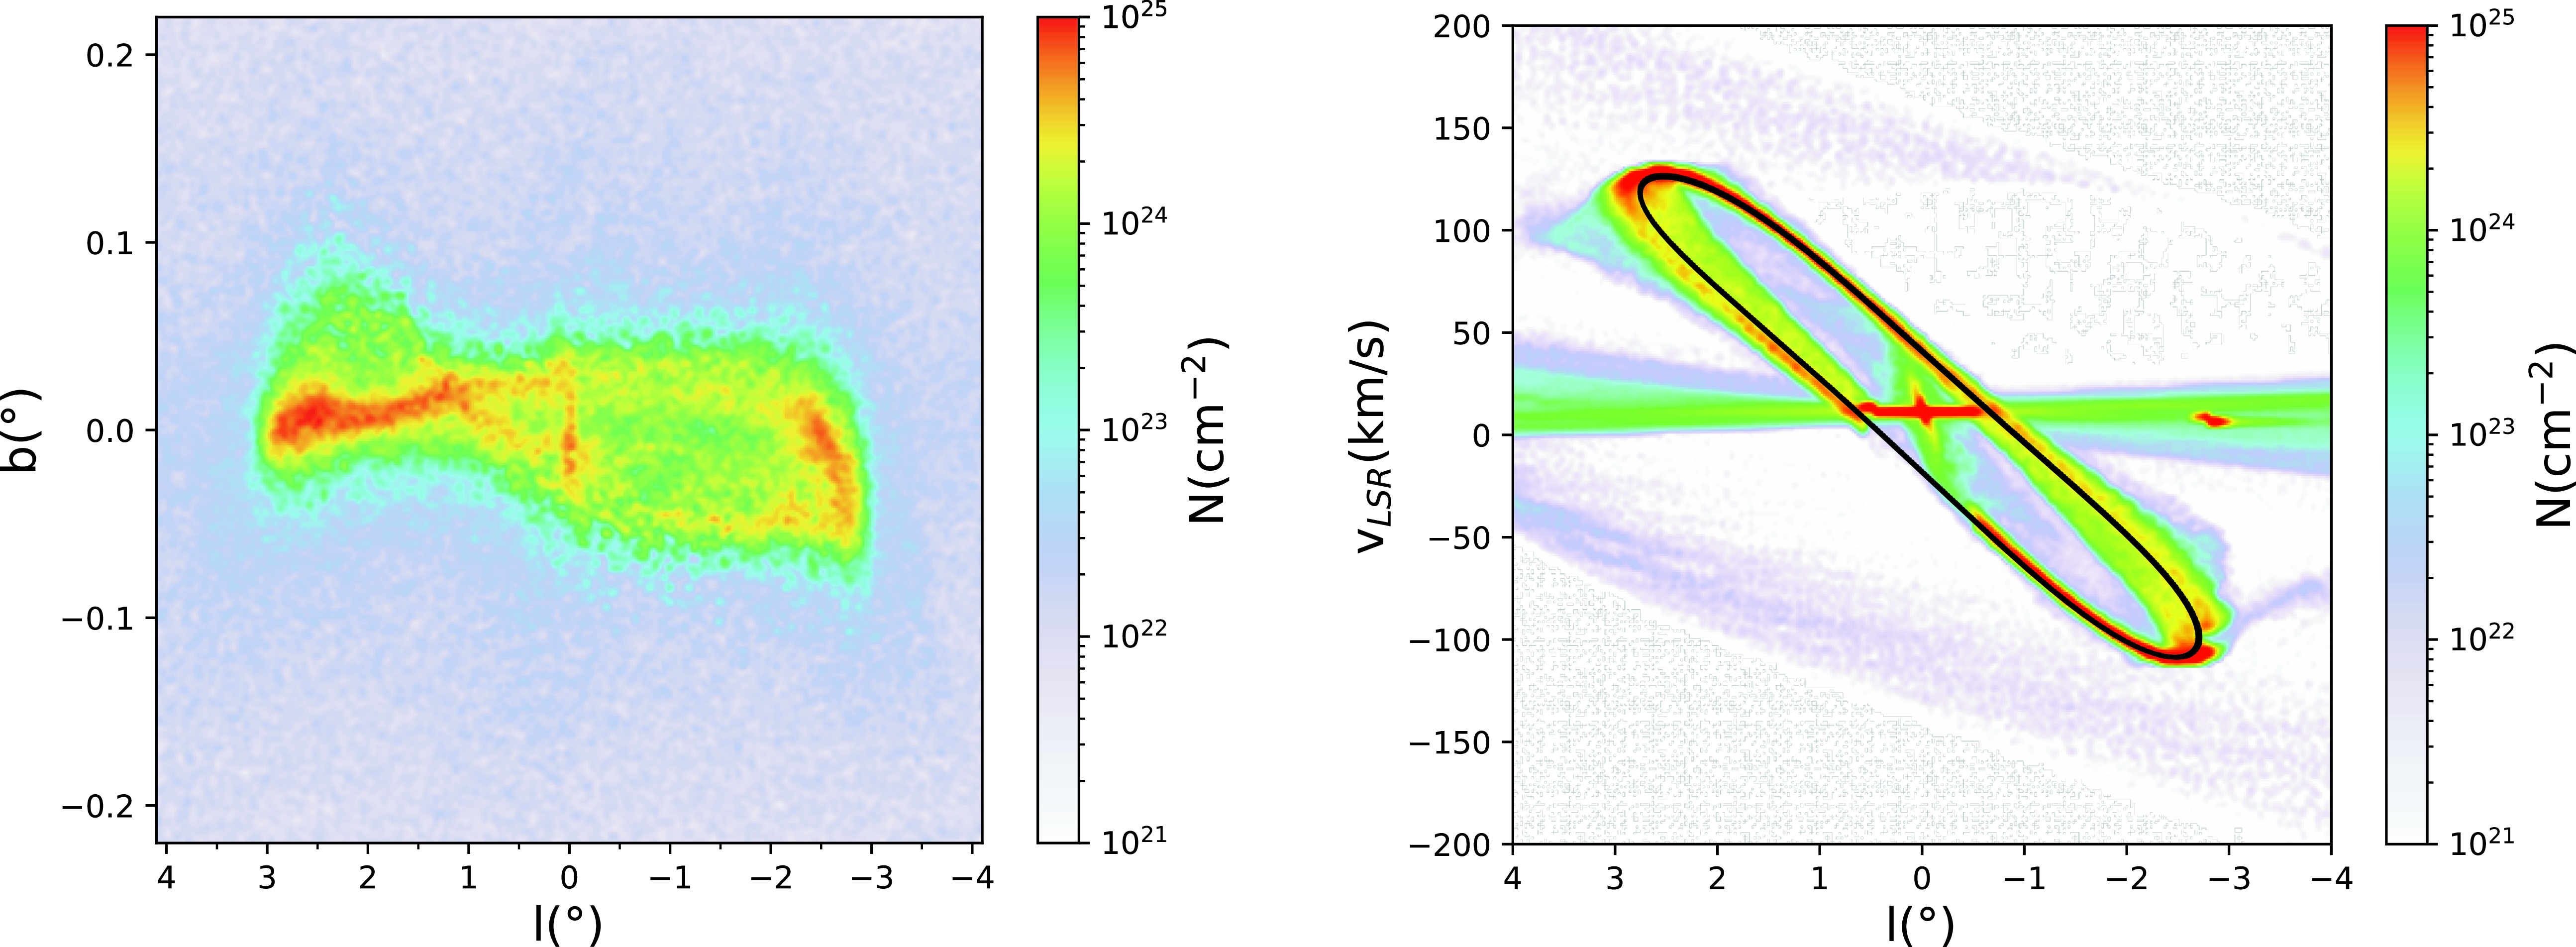
(Left): Column density of the internal region at $t=2 \, \mathrm{Gyr}$
. The ring structure lies mainly in the galactic plane, with a width of
$t=2 \, \mathrm{Gyr}$
. The ring structure lies mainly in the galactic plane, with a width of $\sim$ $6^\circ$
in longitude. (Right):
$6^\circ$
in longitude. (Right): $l-V_{LSR}$
diagram at the internal region of the galaxy at
$l-V_{LSR}$
diagram at the internal region of the galaxy at $t=2 \, \text{Gyr}$
. The black line is an x2 orbit that matches the CMZ.
$t=2 \, \text{Gyr}$
. The black line is an x2 orbit that matches the CMZ.
The $l-b$
diagrams presented in Figure 4 of Sofue (Reference Sofue2022) show a warped ring traced by the Sgr B1, B2, C, D, and E molecular clouds. This trace indicates excursions of the ring out of the galactic plane. Fig. 9, shows the
$l-b$
diagrams presented in Figure 4 of Sofue (Reference Sofue2022) show a warped ring traced by the Sgr B1, B2, C, D, and E molecular clouds. This trace indicates excursions of the ring out of the galactic plane. Fig. 9, shows the $l-b$
diagram resulting from our simulation at
$l-b$
diagram resulting from our simulation at $t=2 \, \text{Gyr}$
(Left panel). Projected on the plane of the sky, the ring adopts the shape of an asymmetric double-loop between
$t=2 \, \text{Gyr}$
(Left panel). Projected on the plane of the sky, the ring adopts the shape of an asymmetric double-loop between $l\sim-3^{\circ}$
and
$l\sim-3^{\circ}$
and $\sim +3^{\circ}$
, and
$\sim +3^{\circ}$
, and $b \sim-0^{\circ}.07$
and
$b \sim-0^{\circ}.07$
and $\sim +0^{\circ}.1$
. On the right panel of Fig. 9, we show the
$\sim +0^{\circ}.1$
. On the right panel of Fig. 9, we show the $l-V_{LSR}$
diagram corresponding to the internal region of our galactic model at
$l-V_{LSR}$
diagram corresponding to the internal region of our galactic model at $t=2 \, \text{Gyr}$
. The dense, oval structure corresponds to our CMZ since it matches the periodic x2 orbit shown (black line). The
$t=2 \, \text{Gyr}$
. The dense, oval structure corresponds to our CMZ since it matches the periodic x2 orbit shown (black line). The $l-V_{LSR}$
diagram found in figure 2 of Armillotta, Krumholz, & Di Teodoro (Reference Armillotta, Krumholz and Di Teodoro2020) constructed with NH
$l-V_{LSR}$
diagram found in figure 2 of Armillotta, Krumholz, & Di Teodoro (Reference Armillotta, Krumholz and Di Teodoro2020) constructed with NH $_3$
emission data, shows the distribution of the dense and giant molecular clouds that define the CMZ. The NH
$_3$
emission data, shows the distribution of the dense and giant molecular clouds that define the CMZ. The NH $_3$
diagram has qualitative similarities with ours since the molecular clouds seem to follow a closed structure in the
$_3$
diagram has qualitative similarities with ours since the molecular clouds seem to follow a closed structure in the $l-V_{LSR}$
view. On the other hand, Sofue (Reference Sofue2017) analyses the three-dimensional structure of the CMZ, studying the molecular gas distribution in the internal region of the galaxy. The
$l-V_{LSR}$
view. On the other hand, Sofue (Reference Sofue2017) analyses the three-dimensional structure of the CMZ, studying the molecular gas distribution in the internal region of the galaxy. The $l-V_{LSR}$
diagram resulting from our simulation, shown in Fig. 9, represents a good qualitative approximation for the morphology of Sofue (Reference Sofue2017) observations. While the three-dimensional structure of the CMZ is still debated, the morphological similarities of the ring in the quasi-stationary stage and observations point to a connection between the CMZ and the gaseous ring associated to the x2 orbits that result from the autonomous model.
$l-V_{LSR}$
diagram resulting from our simulation, shown in Fig. 9, represents a good qualitative approximation for the morphology of Sofue (Reference Sofue2017) observations. While the three-dimensional structure of the CMZ is still debated, the morphological similarities of the ring in the quasi-stationary stage and observations point to a connection between the CMZ and the gaseous ring associated to the x2 orbits that result from the autonomous model.
4. Gas flow
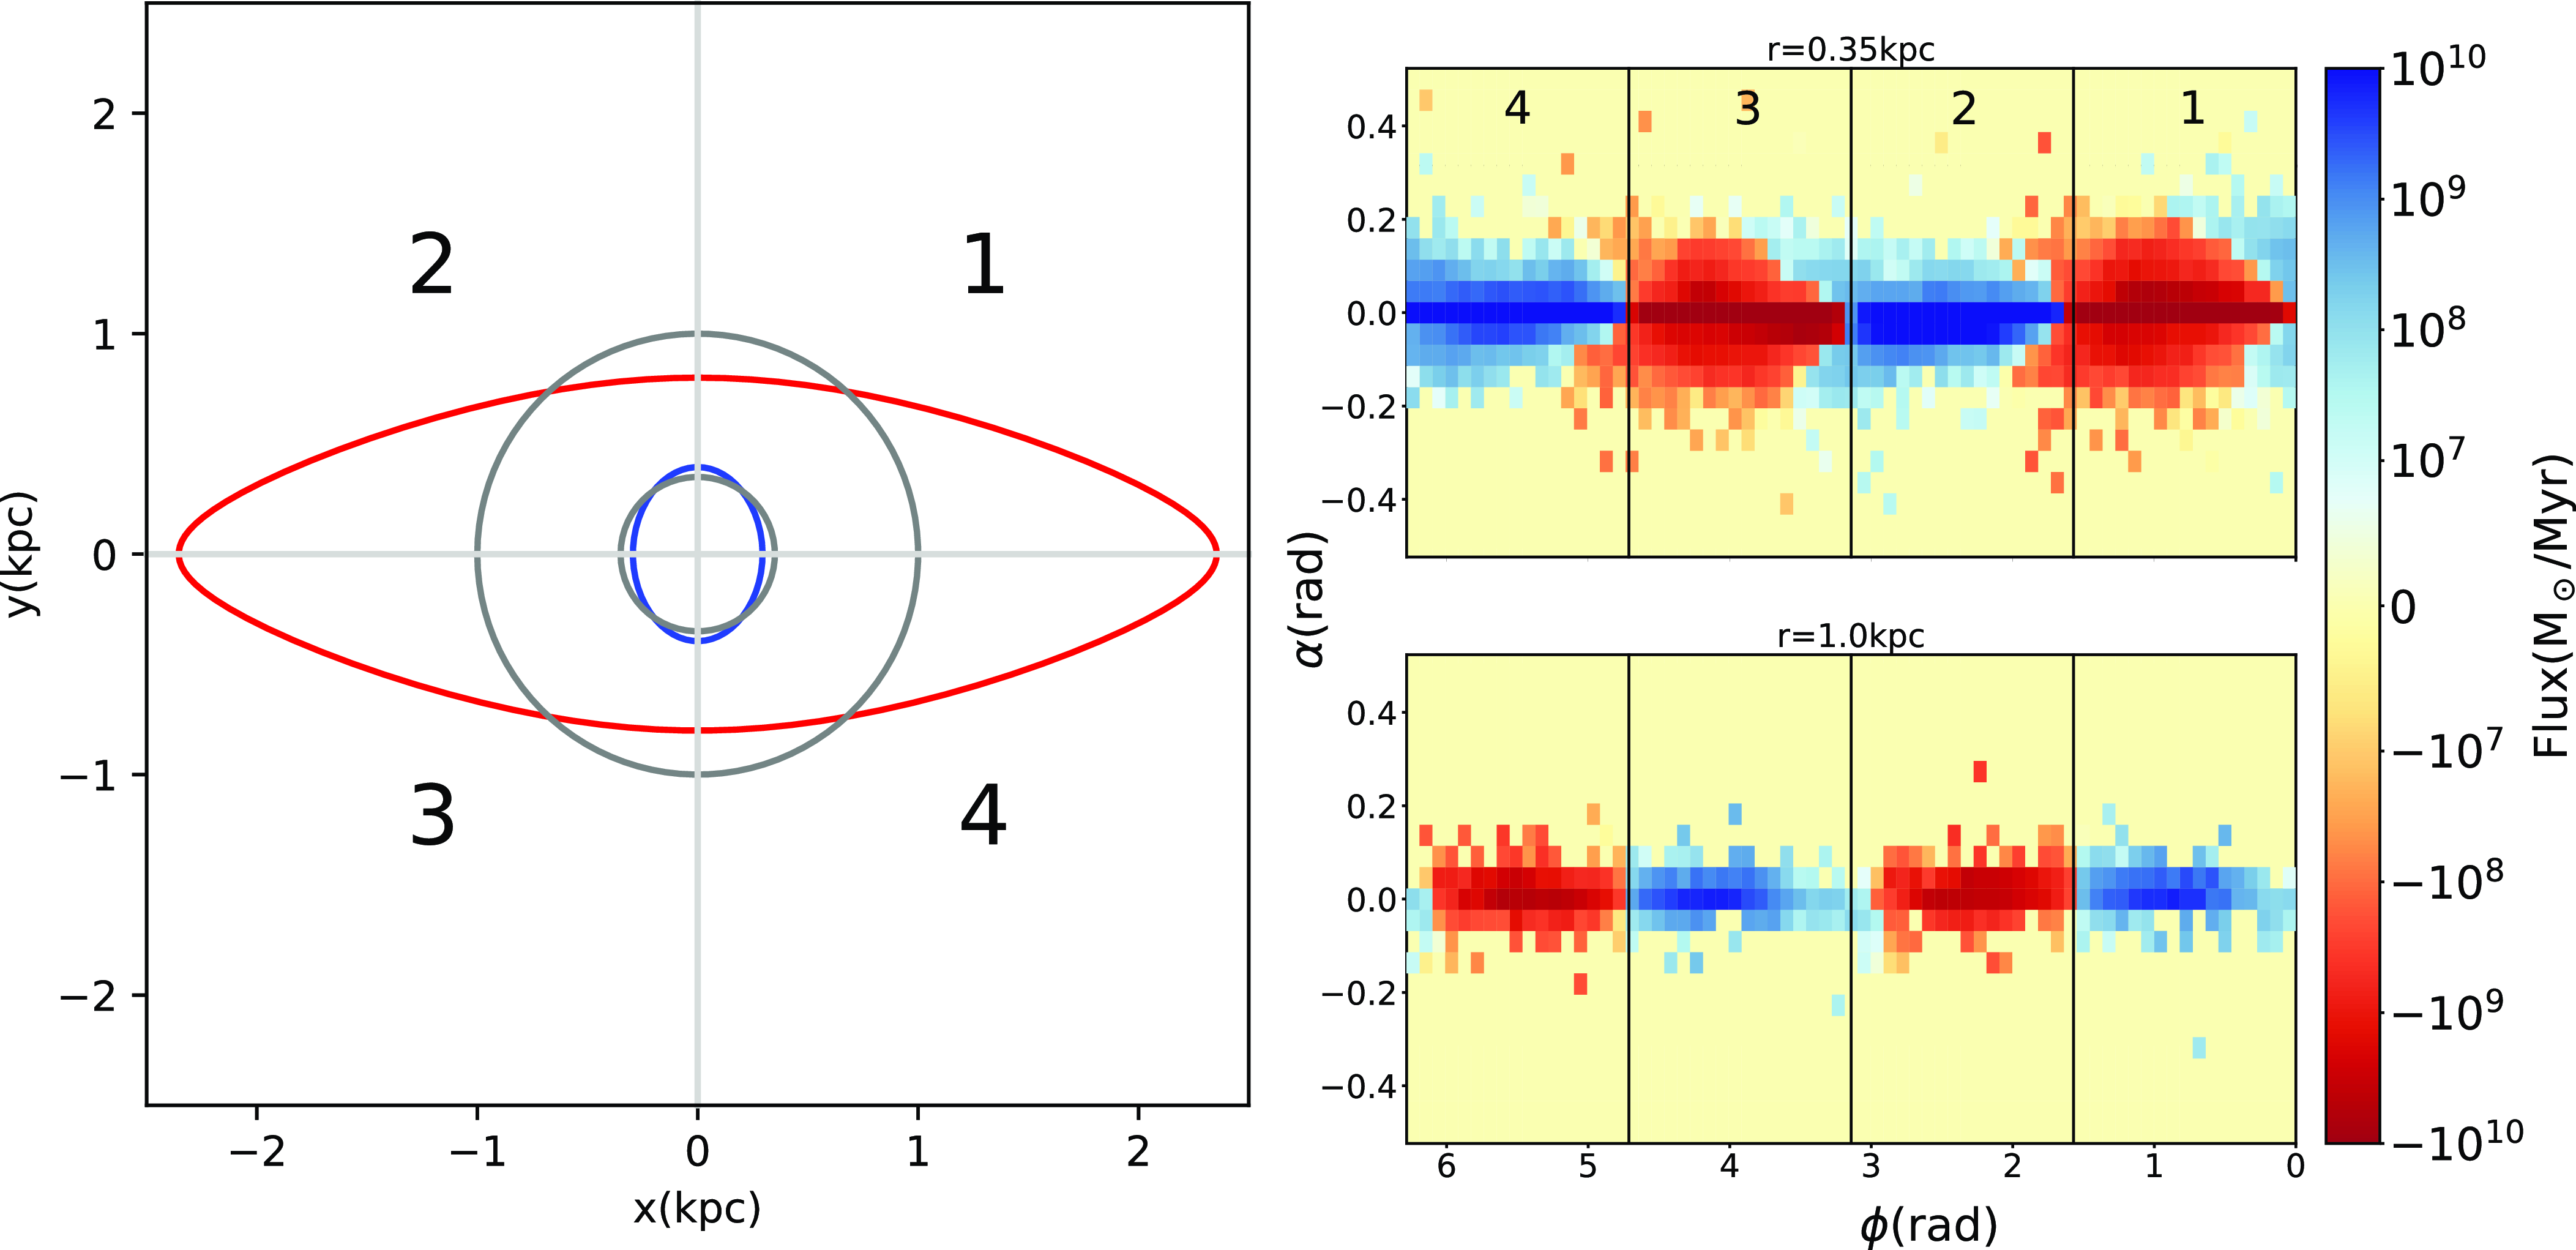
In this section, we discuss the flow of gas during the main phases of the simulation described in Section 3.1. For clarity, we divided the simulation domain into quadrants; the left panel in Fig. 10 shows this division. Consider a particle (or gas parcel) that follows an x1 orbit (red line). In quadrants 1 and 3, the particle’s radial velocity is positive, which implies an outward flux. The opposite happens in quadrants 2 and 4: the particle’s negative velocity implies accretion towards the inner galaxy. The situation reverses for particles that follow an x2 orbit (blue line), namely inward flux in quadrants 1 and 3, and outward flux in quadrants 2 and 4. The right panel of Fig. 10 shows the gaseous mass flux across two constant radius surfaces during the stationary stage of the ring. It can be seen that the gas in the ring (at $r \sim 0.35\text{kpc}$
) follows the pattern corresponding to the x2 orbit, while gas in the bar region (at
$r \sim 0.35\text{kpc}$
) follows the pattern corresponding to the x2 orbit, while gas in the bar region (at $r \sim 1 \, \text{kpc}$
) tends to follow the x1 orbit.
$r \sim 1 \, \text{kpc}$
) tends to follow the x1 orbit.
(Left): Division of the galactic plane in quadrants. The blue line shows the location of an x2 periodic orbit corresponding to the position of the inner ring, and the red line shows an x1 periodic orbit from the bar region. The inner and outer grey lines correspond to circles of $0.5$
and
$0.5$
and $1 \, \text{kpc}$
radii. Since the rotation is clockwise, a particle (or gas parcel) following the x1 orbit will have positive radial velocities in quadrants 1 and 3, and negative in quadrants 2 and 4. This pattern reverses for a particle following the x2 orbit. (Right): Integrated gas flux measured across
$1 \, \text{kpc}$
radii. Since the rotation is clockwise, a particle (or gas parcel) following the x1 orbit will have positive radial velocities in quadrants 1 and 3, and negative in quadrants 2 and 4. This pattern reverses for a particle following the x2 orbit. (Right): Integrated gas flux measured across $r = 0.35\text{kpc}$
(top) and
$r = 0.35\text{kpc}$
(top) and $1\text{kpc}$
(bottom), corresponding to the ring and bar regions, respectively, with positive flux (blue colours) corresponding to gas flowing towards the external region and negative flux (red) to gas flowing in towards the inner disc. The vertical lines show the four quadrants of the galactic plane (labelled on the top plot). The axes correspond to the azimuthal angle in the simulation reference frame (
$1\text{kpc}$
(bottom), corresponding to the ring and bar regions, respectively, with positive flux (blue colours) corresponding to gas flowing towards the external region and negative flux (red) to gas flowing in towards the inner disc. The vertical lines show the four quadrants of the galactic plane (labelled on the top plot). The axes correspond to the azimuthal angle in the simulation reference frame ( $\phi$
; corotating with the galactic bar) and the angle with respect to the galactic plane (
$\phi$
; corotating with the galactic bar) and the angle with respect to the galactic plane ( $\alpha$
).
$\alpha$
).
Gas flow during the formation stage across shells of given radius (columns) at two different times of the simulation (rows) corresponding to the formation stage of the ring. The vertical lines divide each panel in the four quadrants of the galactic plane (Fig. 10 left), with each quadrant labelled in the first panel. Positive flux (blue colours) corresponds to gas flowing out, towards the external regions of the galaxy, while negative flux (red) corresponds to gas flowing in, towards the inner region. The axes correspond to the azimuthal angle in the simulation reference frame ( $\phi$
; corotating with the galactic bar) and the angle with respect to the galactic plane (
$\phi$
; corotating with the galactic bar) and the angle with respect to the galactic plane ( $\alpha$
).
$\alpha$
).
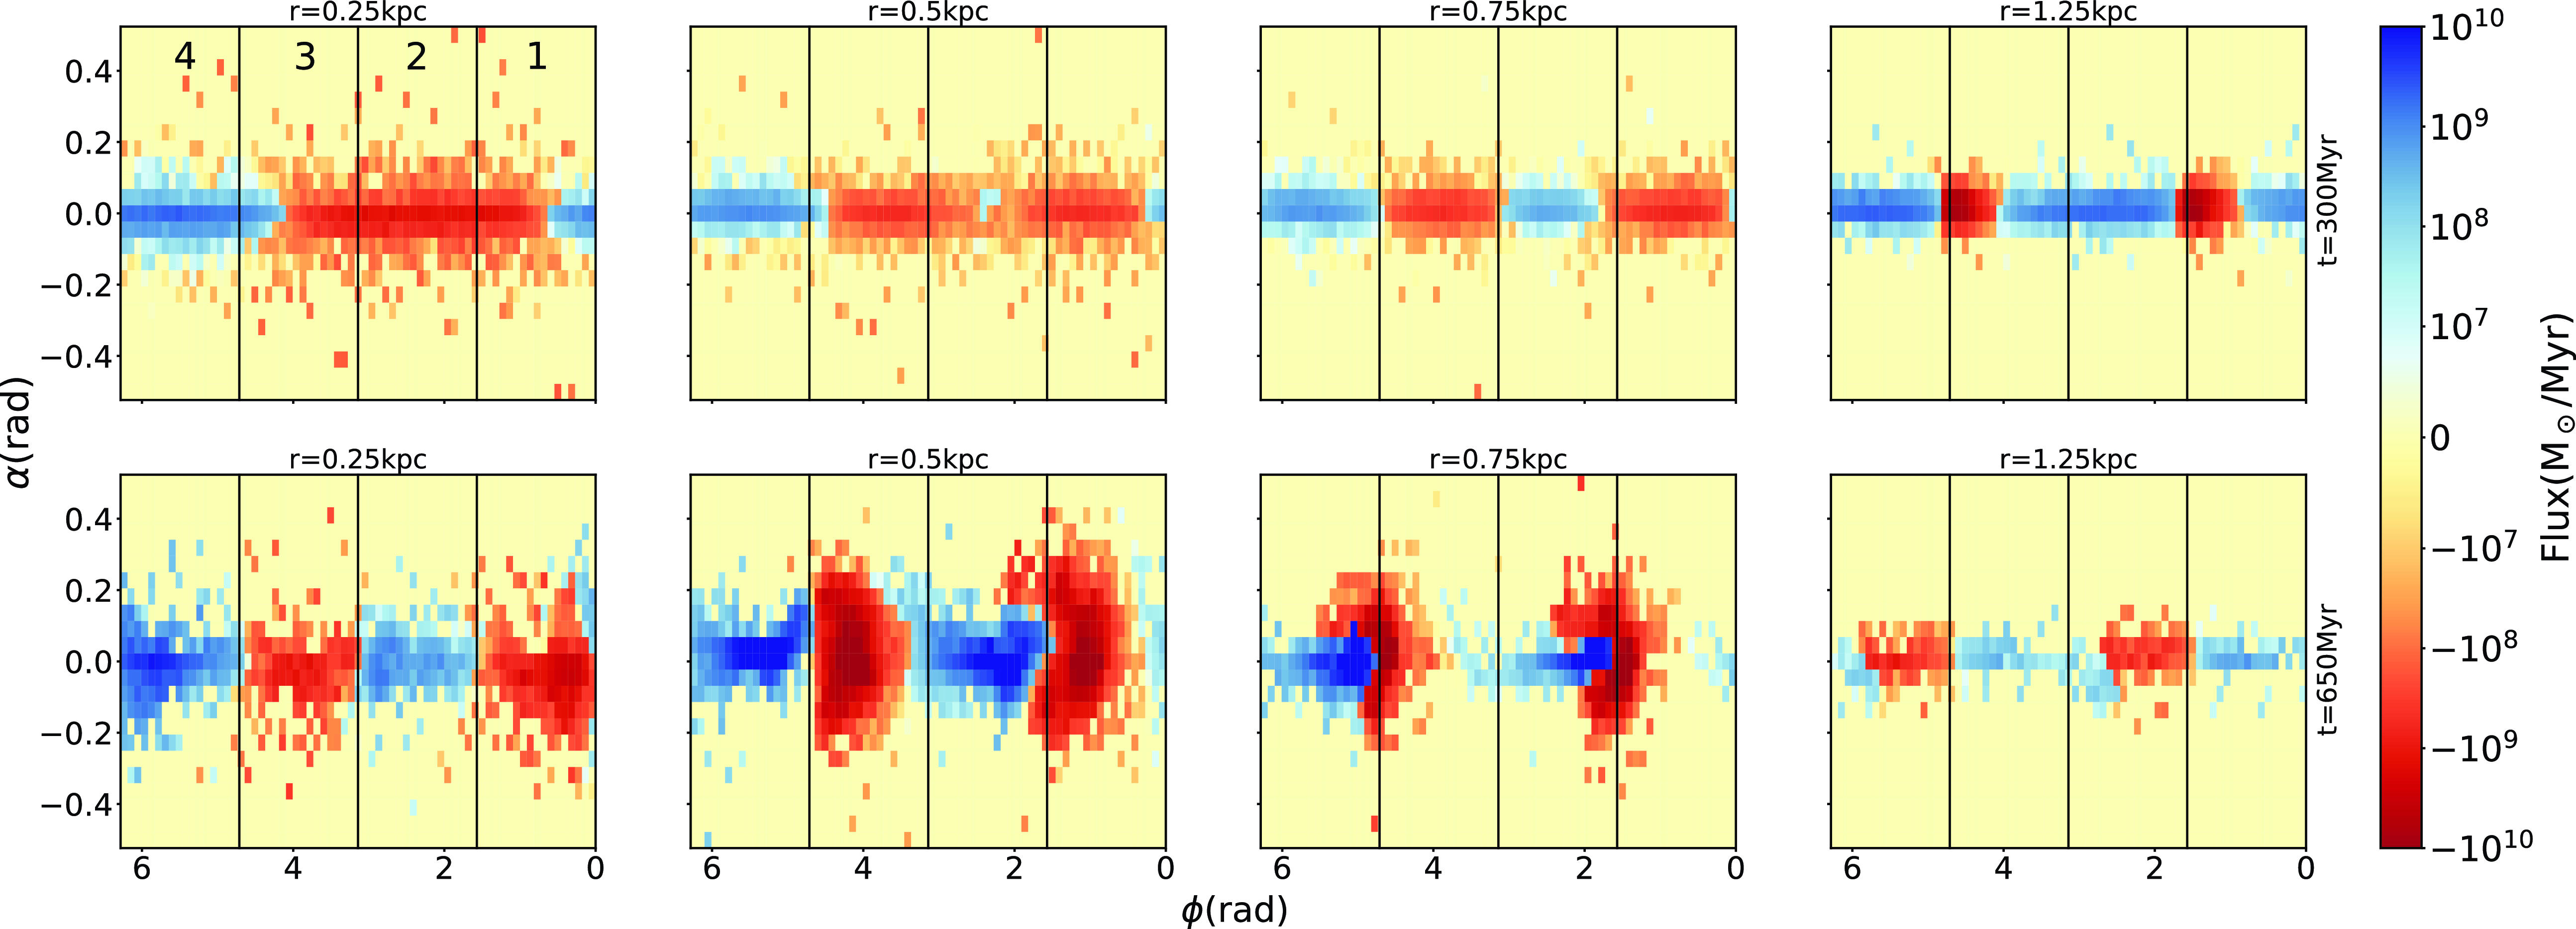
As it would be expected, this simple behaviour does not happen at earlier evolution times (see Section 3.1). Fig. 11 shows the integrated gas flux during the formation stage of the ring. At $t = 300 \, \text{Myr}$
(top panel), the flux at small radii is dominated by gas that flows inward after losing angular momentum in the spiral shocks visible in Fig. 3. On the other hand, at the end of the formation stage at
$t = 300 \, \text{Myr}$
(top panel), the flux at small radii is dominated by gas that flows inward after losing angular momentum in the spiral shocks visible in Fig. 3. On the other hand, at the end of the formation stage at $650\text{Myr}$
(bottom panel), the inward–outward alternating pattern of the gas flux associated with the x2 orbit is clearly visible, although the inflowing gas has a larger vertical extension than the outflowing gas. Since these extensions are symmetric with respect to the galactic plane, they do not correspond to vertical displacements of the gaseous ring. Instead, they appear to be breathing oscillation modes (Walters & Cox Reference Walters and Cox2001; Widrow & Bonner Reference Widrow and Bonner2015) or vertical motions associated with large scale shocks (Martos & Cox Reference Martos and Cox1998; Gómez & Cox Reference Gómez and Cox2004). These possibilities will be explored in a future contribution.
$650\text{Myr}$
(bottom panel), the inward–outward alternating pattern of the gas flux associated with the x2 orbit is clearly visible, although the inflowing gas has a larger vertical extension than the outflowing gas. Since these extensions are symmetric with respect to the galactic plane, they do not correspond to vertical displacements of the gaseous ring. Instead, they appear to be breathing oscillation modes (Walters & Cox Reference Walters and Cox2001; Widrow & Bonner Reference Widrow and Bonner2015) or vertical motions associated with large scale shocks (Martos & Cox Reference Martos and Cox1998; Gómez & Cox Reference Gómez and Cox2004). These possibilities will be explored in a future contribution.
5. Star formation rate
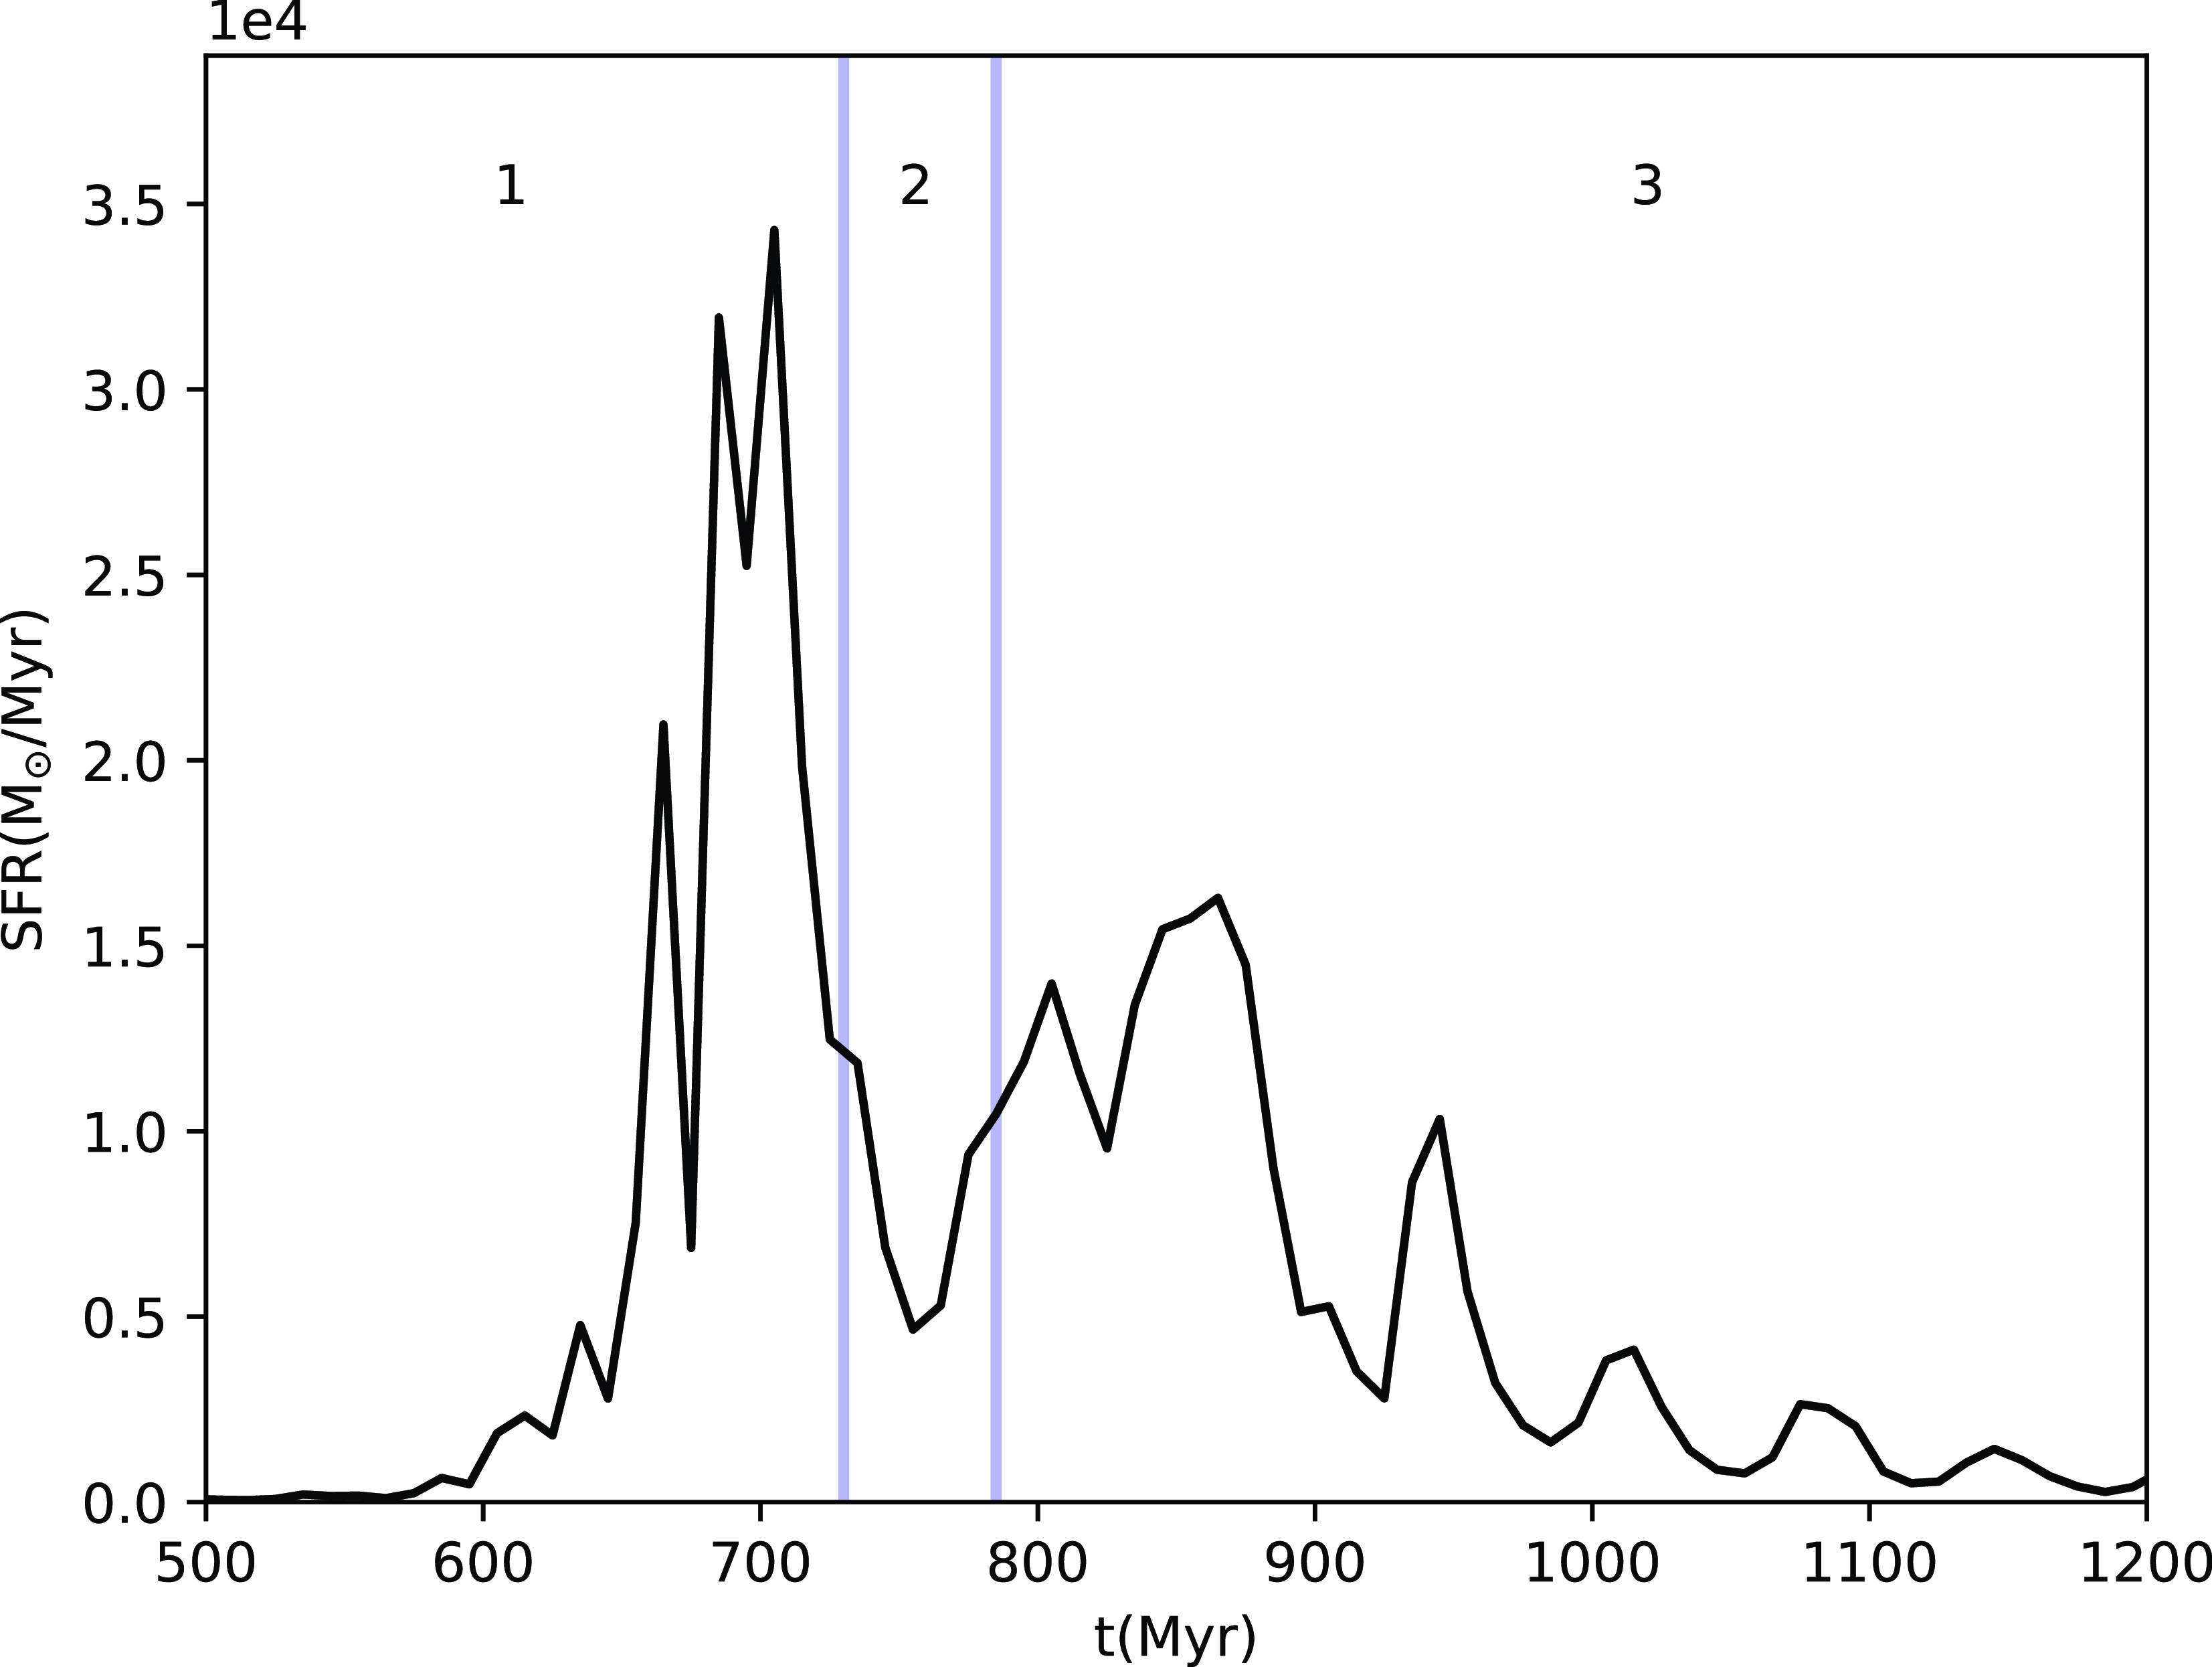
In Fig. 12, we show the SFRFootnote
d
as a function of time. We observe that most of the star formation activity takes place during the formation stage of the ring, between $t=585 \, \text{Myr}$
and
$t=585 \, \text{Myr}$
and $t=730\text{Gyr}$
. The SFR increases drastically around this stage, reaching a maximum of
$t=730\text{Gyr}$
. The SFR increases drastically around this stage, reaching a maximum of $\sim 3.5\times 10^{4} \, \text{M}_\odot/\text{Myr}$
at
$\sim 3.5\times 10^{4} \, \text{M}_\odot/\text{Myr}$
at $t\sim 700 \, \text{Myr}$
, in agreement with previous determinations of the SFR for the CMZ (Elia et al. Reference Elia2022; Yusef-Zadeh et al. Reference Yusef-Zadeh2009). It is noticeable that the SFR decreases during the instability stage, a period during which the ring undergoes substantial changes. This might be a consequence of a large amount of velocity shear at this time (Seigar Reference Seigar2005; Colling et al. Reference Colling, Hennebelle, Geen, Iffrig and Bournaud2018). During the quasi-stationary stage, the SFR initially increases again, reaching
$t\sim 700 \, \text{Myr}$
, in agreement with previous determinations of the SFR for the CMZ (Elia et al. Reference Elia2022; Yusef-Zadeh et al. Reference Yusef-Zadeh2009). It is noticeable that the SFR decreases during the instability stage, a period during which the ring undergoes substantial changes. This might be a consequence of a large amount of velocity shear at this time (Seigar Reference Seigar2005; Colling et al. Reference Colling, Hennebelle, Geen, Iffrig and Bournaud2018). During the quasi-stationary stage, the SFR initially increases again, reaching $\sim$ $1.5\times 10^{4} \, \text{M}_\odot/\text{Myr}$
at
$1.5\times 10^{4} \, \text{M}_\odot/\text{Myr}$
at $\sim$ $860\text{Myr}$
. After this time, it decreases until the end of the simulation, with periodic, smaller peaks. After
$860\text{Myr}$
. After this time, it decreases until the end of the simulation, with periodic, smaller peaks. After $\sim$ $1.5\text{Gyr}$
, the simulation shows almost null star formation since no gas able to flow into the ring region (see Section 4).
$1.5\text{Gyr}$
, the simulation shows almost null star formation since no gas able to flow into the ring region (see Section 4).
Star formation rate as a function of time. Vertical lines show the end of the ring formation stage (region 1), the ring instability (region 2), and the quasi-stationary stages (region 3).
Aggregated star formation sites (in arbitrary units) during the ring formation (655 through $730 \, \text{Myr}$
; left), instability (730–785 Myr; centre), and quasi-stationary stages (785–1 560 Myr; right). The greyscale shown is normalised by the time length of each stage. During the formation and quasi-stationary stages, most of the star formation is associated with the orbital apocentres, where gas density is expected to be highest.
$730 \, \text{Myr}$
; left), instability (730–785 Myr; centre), and quasi-stationary stages (785–1 560 Myr; right). The greyscale shown is normalised by the time length of each stage. During the formation and quasi-stationary stages, most of the star formation is associated with the orbital apocentres, where gas density is expected to be highest.
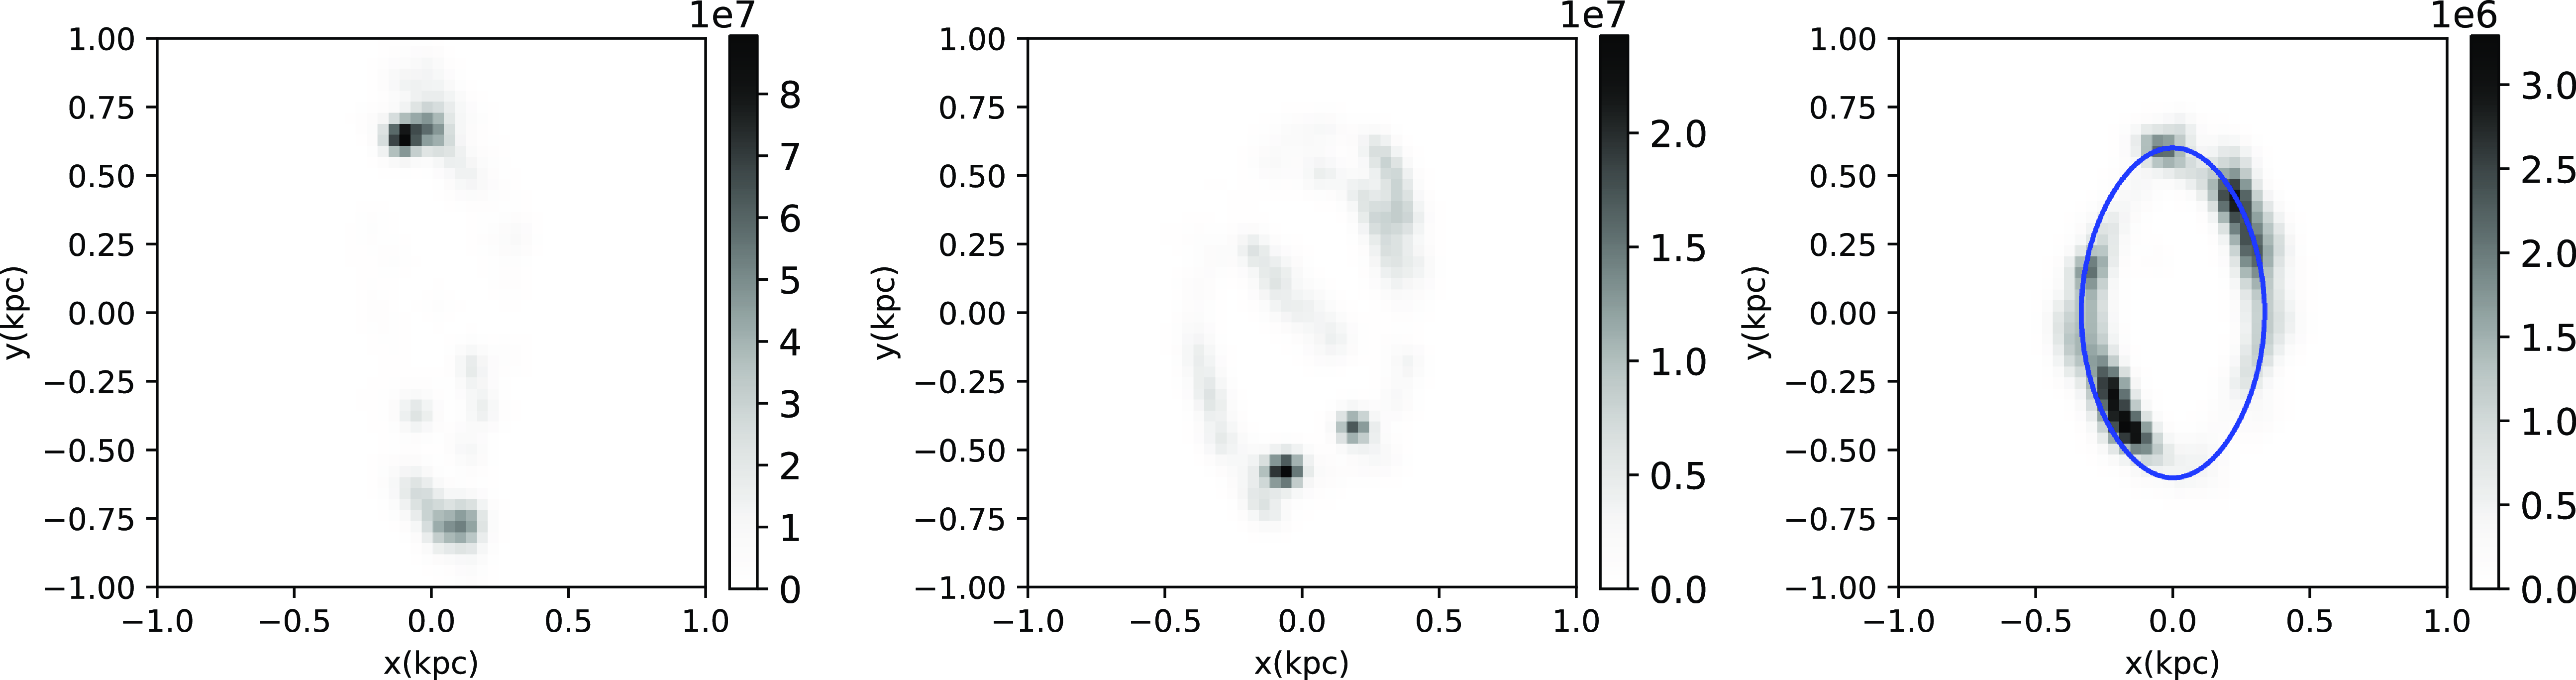
Fig. 13 shows the locations where star formation takes place, with each panel corresponding to the three identified stages of ring formation. During the formation stage (left panel), the ring is more eccentric than in the later stages, and most of the star formation occurs at the apocentres of the orbital distribution, where the dust lanes associated to the galactic bar connect to the ring. This is similar to the simulations reported by Seo & Kim (Reference Seo and Kim2013), which suggest that the star formation occurs mainly at the contact points between the dust lines and the x2 ring (at the apocentres) when the SFR is low, leading to an azimuthal age gradient of young star clusters. Also, Tress et al. (Reference Tress, Sormani, Glover, Klessen, Battersby, Clark, Perry Hatchfield and Smith2020) notice the existence of massive and compact molecular clouds at the apocentres, suggesting that the SFR is extremely high. During the instability stage (centre panel), the star formation occurs in a more disorganised fashion, as expected, although the SFR is lower than during the formation stage; as mentioned before, this could be a consequence of velocity shear. Finally, during the quasi-stationary stage (right panel), the ring structure follows a more discernible x2 periodic orbit, with most of the star formation occurring just after the apocentre passage. At this time, the dust lanes are very weak and the gas flow from the bar to the ring is low. So, the location of the star formation events must be linked to the gas orbital dynamics in the x2 configuration and not due to the gas inflow through the dust channels. In this scenario, star formation after the apocentres is not unexpected, since angular momentum conservation implies that the orbital velocity is lowest at the apocentre, and thus the gas density must increase. Although previous work has suggested that the star formation in the CMZ is triggered by tidal fields at the pericentre passage (Longmore et al. Reference Longmore2013; see also Kruijssen et al. Reference Kruijssen, Dale and Longmore2015), we do not observe that in our simulation. After the gas density is increased around the orbital apocentre, star formation is triggered and subsequent stages of cloud evolution occur further along the x2 orbit, following the conveyor-belt mechanism described by Longmore et al. (Reference Longmore, Beuther, Klessen, Dullemond and Henning2014).
6. Discussion and conclusions
We performed a hydrodynamic simulation of the gas flow in the inner regions of the galaxy while a bar potential is being imposed. The simulation develops a ring within $0.5\text{kpc}$
from the galactic centre, which we qualitatively associate with the CMZ. The ring development and evolution pass through three main phases, namely formation, instability, and quasi-stationary stages. The formation stage occurs while the bar mass is grown at the expense of the bulge mass. The instability stage occurs after the bar potential is steadied. Since the bar was grown during a period of almost
$0.5\text{kpc}$
from the galactic centre, which we qualitatively associate with the CMZ. The ring development and evolution pass through three main phases, namely formation, instability, and quasi-stationary stages. The formation stage occurs while the bar mass is grown at the expense of the bulge mass. The instability stage occurs after the bar potential is steadied. Since the bar was grown during a period of almost $700\text{Myr}$
, we would expect little or no transient structures associated with the bar imposition. Therefore, we do not expect the instability stage of the ring to be a consequence of the numerical setup. Instead, it appears to be a result of the gas being evacuated from the bar region and settling into a stationary orbit.
$700\text{Myr}$
, we would expect little or no transient structures associated with the bar imposition. Therefore, we do not expect the instability stage of the ring to be a consequence of the numerical setup. Instead, it appears to be a result of the gas being evacuated from the bar region and settling into a stationary orbit.
During the ring evolution, but more clearly in the quasi-stationary stage, the ring can be associated with the x2 periodic orbit family (see also Hatchfield et al. Reference Hatchfield, Sormani, Tress and Battersby2021). Since the gaseous orbits cannot cross themselves, gas parcels can follow periodic stellar orbits only in regions away from resonances (Gómez et al. Reference Gómez, Pichardo and Martos2013). The three stages of the ring occur in the region between the iILR and the oILR, and so the gas can follow a periodic orbit. Associating the CMZ with the ring in our simulation implies the need for the existence of the x2 orbital family, which in turn suggests the existence of a classical bulge in the galaxy within $\sim$
1–2 kpc in addition to the bar (Kunder et al. Reference Kunder2020; Queiroz et al. Reference Queiroz2021).
$\sim$
1–2 kpc in addition to the bar (Kunder et al. Reference Kunder2020; Queiroz et al. Reference Queiroz2021).
During both the instability and quasi-stationary stages, the ring has vertical excursions similar to the ones observed in the CMZ. These vertical oscillations appear to be irregular, and it is not obvious if they are associated with off-plane periodic orbital families or with normal oscillating frequencies of the gaseous disc in the central kpc of the galaxy. It is certainly an intriguing question that will be explored in a future contribution.
The $l-b$
and
$l-b$
and $l-V_{LSR}$
diagrams corresponding to our simulation show good qualitative agreements to observations. At
$l-V_{LSR}$
diagrams corresponding to our simulation show good qualitative agreements to observations. At $t=2 \, \text{Gyr}$
, the
$t=2 \, \text{Gyr}$
, the $l-b$
diagram shows an infinity shape that has been reported in previous works, while the
$l-b$
diagram shows an infinity shape that has been reported in previous works, while the $l-V_{LSR}$
diagram shows a dense region corresponding to our inner ring that presents an inclined oval-shaped structure. This morphology has also been reported in observations (Armillotta, Krumholz, & Di Teodoro Reference Armillotta, Krumholz and Di Teodoro2020; Sofue Reference Sofue2017).
$l-V_{LSR}$
diagram shows a dense region corresponding to our inner ring that presents an inclined oval-shaped structure. This morphology has also been reported in observations (Armillotta, Krumholz, & Di Teodoro Reference Armillotta, Krumholz and Di Teodoro2020; Sofue Reference Sofue2017).
Most of the star formation in the ring occurs during the formation stage, exactly at the apocentres of the x2 orbit, which correspond to the contact points between the dust channels and the ring structure. This case corresponds to the low gas flow rate case discussed in Seo & Kim (Reference Seo and Kim2013). Oddly, the SFR is lower during the instability stage, probably due to the large amount of shear present during this time period. Once the ring settles into the x2 orbit, that is, during the quasi-stationary stage, the SFR becomes episodic with decreasing amplitude peaks with an $\sim70 \, \text{Myr}$
periodicity. Within the ring, star formation occurs mainly after the gas passes its orbital apocentre, where the lower velocity implies higher densities triggering star formation at the first and third quadrants, in contrast with previous models that suggest that star formation should happen near the orbital pericentre (Longmore et al. Reference Longmore2013; Kruijssen et al. Reference Kruijssen, Dale and Longmore2015) or those suggesting that most of the star formation occurs at the apocentres (Seo & Kim Reference Seo and Kim2013; Tress et al. Reference Tress, Sormani, Glover, Klessen, Battersby, Clark, Perry Hatchfield and Smith2020). In our simulations, since the preferred sites of star formation occur after the apocentre, we associate it with the dynamics of the x2 orbital configuration and not with a high gas flow at the contact points of the dust lanes. Since the obtained preferred regions of star formation are downstream from the high-density regions at the apocentres, our simulation is consistent with the conveyor-belt scenario (Longmore et al. Reference Longmore, Beuther, Klessen, Dullemond and Henning2014) as applied to the CMZ.
$\sim70 \, \text{Myr}$
periodicity. Within the ring, star formation occurs mainly after the gas passes its orbital apocentre, where the lower velocity implies higher densities triggering star formation at the first and third quadrants, in contrast with previous models that suggest that star formation should happen near the orbital pericentre (Longmore et al. Reference Longmore2013; Kruijssen et al. Reference Kruijssen, Dale and Longmore2015) or those suggesting that most of the star formation occurs at the apocentres (Seo & Kim Reference Seo and Kim2013; Tress et al. Reference Tress, Sormani, Glover, Klessen, Battersby, Clark, Perry Hatchfield and Smith2020). In our simulations, since the preferred sites of star formation occur after the apocentre, we associate it with the dynamics of the x2 orbital configuration and not with a high gas flow at the contact points of the dust lanes. Since the obtained preferred regions of star formation are downstream from the high-density regions at the apocentres, our simulation is consistent with the conveyor-belt scenario (Longmore et al. Reference Longmore, Beuther, Klessen, Dullemond and Henning2014) as applied to the CMZ.
The details of the 3D distribution of the material in the CMZ are still controversial. Although, in general, it is accepted that the general morphology of the CMZ consists of a ring, finding the actual location of its giant molecular clouds that constitute it is quite challenging from the observational point of view and it is an active topic of study. Since galactic and extragalactic observations suggest that star formation occurs at preferential locations of nuclear rings (Ryder et al. Reference Ryder, Knapen and Takamiya2001; Allard et al. Reference Allard, Knapen, Peletier and Sarzi2006; Mazzuca et al. Reference Mazzuca, Knapen, Veilleux and Regan2008; Callanan et al. Reference Callanan2021), it would be useful to establish the positions of the molecular clouds that make up the CMZ to understand the associated star formation. From these clouds, SgrB2, and SgrC present the most active star formation (Armillotta, Krumholz, & Di Teodoro Reference Armillotta, Krumholz and Di Teodoro2020). From this group of molecular clouds, SgrB2 has the better constrained line-of-sight distance, locating it on the foreground of Sgr A* at a galactocentric distance of $R\simeq130\pm 60 \, \text{pc}$
(Reid et al. Reference Reid, Menten, Zheng, Brunthaler and Xu2009). On the other hand, the distance to SgrC has been poorly constrained (Chuard et al. Reference Chuard2018). The location of SgrB2 in the CMZ seems to be near the apocentre, which favours the hypothesis that star formation is higher in regions close to these points (Hatchfield et al. Reference Hatchfield, Sormani, Tress and Battersby2021; Henshaw et al. Reference Henshaw, Barnes, Battersby, Ginsburg, Sormani, Walker, Inutsuka, Aikawa, Muto, Tomida and Tamura2023). Other works placing the SgrB2 cloud near the apocentre include Sofue (Reference Sofue2017) and (Reference Sofue2022). It is noticeable that these authors place the SgrC cloud near opposite the SgrB2 cloud. In this contribution, we found that star formation is higher at the apocentres of the x2 orbit during the formation stage, and just after the apocentres during the quasi-stationary state. In the first case, the star formation occurs at the contact points between the dust lines and the ring, while in the second case, the star formation is purely linked to the morphology of the x2 orbits. In both cases, we found that star formation near these points, in agreement with observations that locate the most active star-forming cloud of the CMZ (SgrB2) in one of these regions. The observed distances of these molecular clouds quantitatively disagree with those encountered in the ring in our simulation. However, the locations of active star formation qualitatively agree with observations locating SgrB2 and SgrC in regions close to the apocentres of the observed CMZ.
$R\simeq130\pm 60 \, \text{pc}$
(Reid et al. Reference Reid, Menten, Zheng, Brunthaler and Xu2009). On the other hand, the distance to SgrC has been poorly constrained (Chuard et al. Reference Chuard2018). The location of SgrB2 in the CMZ seems to be near the apocentre, which favours the hypothesis that star formation is higher in regions close to these points (Hatchfield et al. Reference Hatchfield, Sormani, Tress and Battersby2021; Henshaw et al. Reference Henshaw, Barnes, Battersby, Ginsburg, Sormani, Walker, Inutsuka, Aikawa, Muto, Tomida and Tamura2023). Other works placing the SgrB2 cloud near the apocentre include Sofue (Reference Sofue2017) and (Reference Sofue2022). It is noticeable that these authors place the SgrC cloud near opposite the SgrB2 cloud. In this contribution, we found that star formation is higher at the apocentres of the x2 orbit during the formation stage, and just after the apocentres during the quasi-stationary state. In the first case, the star formation occurs at the contact points between the dust lines and the ring, while in the second case, the star formation is purely linked to the morphology of the x2 orbits. In both cases, we found that star formation near these points, in agreement with observations that locate the most active star-forming cloud of the CMZ (SgrB2) in one of these regions. The observed distances of these molecular clouds quantitatively disagree with those encountered in the ring in our simulation. However, the locations of active star formation qualitatively agree with observations locating SgrB2 and SgrC in regions close to the apocentres of the observed CMZ.
The link between the x2 orbital family and the gas dynamics (specifically, the sites of star formation) has not been explored in previous studies. Still, it is worth noticing that our models of the CMZ are very simplified and the exploration of the impact of additional physical ingredients, like magnetic fields and stellar feedback, will be required to properly understand the inner region of our galaxy.
Our simulation aimed to obtain a qualitative model of the physical processes impacting the star formation and dynamics in the CMZ. While the SFR in the simulation is in agreement with observations during the formation stage, the SFR during the quasi-stable stage drops significantly and does not align with observational data. On the other hand, the morphology of the CMZ in the $l-b$
and
$l-b$
and $V_{LSR}$
diagrams shows some consistency with observational findings reported in the literature. The apparent inconsistency between these two results does not change our conclusions, since the SFR is influenced by physical processes not included in our simulations (e.g. magnetic fields and stellar feedback). In this sense, the present study should be considered as a qualitative exploration of the large-scale behaviour of the gas associated with the CMZ. A detailed study of the star formation and gas dynamics in the central regions of the galaxy is still out of reach of current models since there are many unknowns and large observational uncertainties associated with this fascinating structure of the MW.
$V_{LSR}$
diagrams shows some consistency with observational findings reported in the literature. The apparent inconsistency between these two results does not change our conclusions, since the SFR is influenced by physical processes not included in our simulations (e.g. magnetic fields and stellar feedback). In this sense, the present study should be considered as a qualitative exploration of the large-scale behaviour of the gas associated with the CMZ. A detailed study of the star formation and gas dynamics in the central regions of the galaxy is still out of reach of current models since there are many unknowns and large observational uncertainties associated with this fascinating structure of the MW.
Acknowledgements
We thank C. Benitez for adapting the cooling function to the arepo code and an anonymous referee for comments that helped improve this manuscript. LCV acknowledges support from UNAM-DGAPA fellowship. GCG acknowledges support from UNAM-PAPIIT IN103822 grant. APV acknowledges support from UNAM-PAPIIT IA103224 grant.
The data underlying this article will be shared on reasonable request to the corresponding author.


 Open access