


“Election after election, persistent closure and consolidation of polling locations have repeatedly resulted in voters...waiting in unconscionably long lines to exercise their right to vote.”
– Plaintiffs in Anderson v. Raffensperger (2020)
After experiencing hours-long lines at overcrowded polling places during the June 2020 primary, five plaintiffs in Georgia sought injunctive relief in federal court to ensure that voters would not be subject to these same costs in the November general election. One plaintiff, Lucille Anderson, unsuccessfully visited her polling location three times and was ultimately deterred from making a fourth trip because she was “exhausted from a full day of work and waiting to vote in the Georgia heat.” Anderson, along with the other plaintiffs, attributed her effective disenfranchisement to the prohibitive costs imposed by the closure and consolidation of polling sites across Georgia.
Far from being an anomaly, this episode reflects a broader trend. In the 5 years following the Supreme Court’s decision to eliminate federal pre-clearance requirements under the Voting Rights Act in Shelby County v. Holder (2013), at least 1,688 polling sites were closed or consolidated in previously covered counties (Allison and Warren, Reference Allison and Warren2019). While many like Ms. Anderson view these closures as overt acts of voter suppression (Culliton-Gonzalez and Brenson, Reference Culliton-Gonzalez and Brenson2018, Hardy, Reference Hardy2020),Footnote 1 others claim that such changes impose little to no harm on voters. Representative Marjorie Taylor Greene (R-GA), for instance, asserted that “standing in line to vote is not voter suppression ... it’s just part of the voting process. Just like people stand in line to buy groceries at the grocery store.”Footnote 2
While adjudicating between these competing perspectives is increasingly salient, estimating the policy-relevant costs of closing and consolidating polling sites on voter turnout is econometrically difficult. First, election administrators can decide to close a site for various reasons. While some claim that these closures are politically motivated (Amos et al., Reference Amos, Smith and Claire2017, Lhamon, Reference Lhamon2018),Footnote 3 others (including administrators themselves) cite declining populations, growing preferences for alternative voting methods, budgetary constraints, school safety concerns, and decaying facilities as the primary motivations for these closures.Footnote 4 Yet the handful of studies that examine the impact of polling site closures on turnout do not account for the sort of selection issues that drive site closures in the first place (Haspel and Knotts, Reference Haspel and Knotts2005, Brady and McNulty, Reference Brady and McNulty2011)—many of which may lead to bias.
Second, the direct impact of polling place closures is often mediated by the actions of individuals and activists seeking to ameliorate the costs imposed on voters. Interest groups can mobilize voters through a variety of techniques (e.g., mailers, registration drives, and transportation resources), which have been shown in some cases to increase overall turnout (Gerber et al., Reference Gerber, Green and Larimer2008) and even offset the costs imposed by site closures (Stein, Reference Stein2015, Clinton et al., Reference Clinton, Eubank, Fresh and Shepherd2021, Zelin and Smith, Reference Zelin and Smith2023). Election administrators can likewise reduce the potentially negative effects of site closures on turnout by making voting more accessible in other ways, like expanding alternative voting options, widely disseminating information about precinct reassignments, and providing greater resources to existing locations. Thus, even a credibly identified total effect of precinct closures reflects both the direct cost to voters and the countervailing mobilization efforts.Footnote 5
More broadly, the literature on election administration has notably found little evidence that increasingly restrictive laws have lowered turnout (Grimmer et al., Reference Grimmer, Hersh, Meredith, Mummolo and Nall2018, Grimmer and Yoder, Reference Grimmer and Yoder2022, Komisarchik and White, Reference Komisarchik and White2021). This work, however, has largely struggled to disentangle the general equilibrium (i.e., total) effect of restrictive voting policies from the policy-relevant (i.e., direct) effect. Put explicitly, it would be wrong for judges, administrators, or voters to conclude from these studies that site closures or other restrictive voting laws fail to increase the burden on those seeking to exercise their right to vote.
Though interest groups and election administrators might, in theory, offset these costs—and such efforts have been shown to do so in certain contexts (Brady and McNulty, Reference Brady and McNulty2011, Clinton et al., Reference Clinton, Eubank, Fresh and Shepherd2021, Tomkins et al., Reference Tomkins, Yao, Gaebler, Konitzer, Rothschild, Meredith and Goel2023)—it is not certain that these efforts will be sufficiently present or powerful enough to always offset the potential harms of polling place closures and consolidations. Interest groups may not always be active in areas where closures occur or may not have the resources necessary to mobilize all affected residents. Moreover, following Shelby, states and localities are not required to notify their residents of polling site closures. Many do not provide any notification, and some closures occur with little media attention (Allison and Warren, Reference Allison and Warren2019, Lab, Reference Lab2020). In some cases, closures occurred a month or less prior to an election, leaving little time for offsetting measures.Footnote 6
Election officials, moreover, are not always able to provide proper resources to existing sites; states and localities vary in whether they actually offer alternative methods of voting when closures occur, with many providing none.Footnote 7 As such, understanding the effect of these closures when counter-mobilization efforts are minimal is a normatively preeminent question and important to fully understanding the potential consequences of polling site closures. Furthermore, if the harms imposed by consolidation can only be attenuated by costly counter-mobilizing efforts or policies, then consolidation is doubly inefficient—first, through the ill imposed on voters and second, through the costly effort required to countermand these harms.
To isolate an unbiased estimate of the average direct cost of polling site consolidations, we leverage unanticipated precinct closures following a tornado in Davidson County, Tennessee, occurring just hours before the polls were scheduled to open for the March 2020 primary election. City officials were forced to unexpectedly close polling locations in areas impacted by the tornado, consolidating 21 precincts into 6 “Super Sites” across Nashville. Notably, the decision to close and combine these sites was unanticipated and occurred immediately before any in-person votes were cast. Thus, we can divorce the costs of polling site consolidations from the possible mitigating effects produced by the counter-mobilization efforts of parties, groups, and voters themselves. Importantly, this case allows us to examine the direct effects of polling closures on turnout when countervailing efforts are minimal, thus representing areas that do not have a strong interest group presence or where election administrators have not adequately compensated for these closures by expanding voting access elsewhere.
Of course, we are not the first to leverage exogenous weather events to better understand voter turnout. Some studies have investigated the impact of election day rain- or snowfall, finding small, null, or mixed effects on turnout (Fraga and Hersh, Reference Fraga and Hersh2007, Gomez et al., Reference Gomez, Hansford and Krause2007, Sinclair et al., Reference Betsy, Hall and Alvarez2011, Horiuchi and Kang, Reference Horiuchi and Kang2017, Lasala-Blanco et al., Reference Narayani, Shapiro and Rivera-Burgos2017). These sorts of perturbations, however, are likely insufficiently severe to isolate the effect we are interested in characterizing. Indeed, they usually do not implore election administrators to close or consolidate polling sites. Others have studied larger-scale natural disasters, like Hurricanes Katrina, Sandy, and Michael, which forced polling sites. Though these events did produce modest declines in turnout, they usually occurred days, weeks, and sometimes months prior to an election—leaving plenty of time for countervailing efforts. Indeed, scholars note that efforts by election officials to make voting more accessible (e.g., increasing access to early voting, mail-in ballots, and voting centers) and by interest groups to mobilize voters (e.g., providing access to transportation, absentee ballots, and information on new voting locations) in response to these weather events counteracted some of their negative effects (Sinclair et al., Reference Betsy, Hall and Alvarez2011, Stein, Reference Stein2015, Zelin and Smith, Reference Zelin and Smith2023).Footnote 8 As is the case for purposeful consolidation of polling places, however, election officials and interest groups may not always be capable of reducing the costs of voting caused by the closing and consolidation of polling places due to extreme weather events. Thus, examining a large-scale event that occurred the same day as an election can help us understand what the potentially worst-case costs are of this sort of closure.
Using individual-level turnout data, we find that closing and consolidating polling stations did indeed impose a substantial cost on the choice to vote. Our estimates indicate that, on average, moving polling sites decreased in-person turnout by 5.65–6.9 percentage points (pp). We decompose this effect into its fixed component (i.e., the mere act of changing polling locations) and its variable component (i.e., the distance to a voter’s new polling location). We show that nearly all of our estimated “reassignment” effect is driven by changes in the travel distance to an individual’s new polling location. This finding suggests that voters are most impacted by the additional distance to a new polling site rather than the informational or habit-disrupting fixed costs of simply changing locations.Footnote 9
Furthermore, we separately identify the impact of voting in a consolidated polling place from that of moving to a consolidated station. On average, the effect of voting in a consolidated station is statistically indistinguishable from zero. However, we find a negative association between the size of a consolidated precinct and the likelihood of turnout, such that when the number of assigned residents in an individual’s new precinct exceeds more than 100% of her previously assigned precinct, the effect of voting in a consolidated precinct becomes negative. This result suggests that increased wait times and overcrowding—at least beyond a certain threshold—are costly to voters. Finally, consistent with existing findings (Berinsky, Reference Berinsky2005), we find that the negative effect of being reassigned is largest in magnitude for individuals who already have a higher propensity to vote.
Broadly, empirical scholarship is not uniform in describing how, in practice, turnout costs arise.Footnote 10 Some view information and decision-making costs as the principal impediment to voting ((Downs, Reference Downs1957, ch. 11); (Wolfinger and Rosenstone, Reference Wolfinger and Rosenstone1980)). Here, voters pay to learn about candidates, policies, and platforms before they vote. Aldrich Reference Aldrich1993 notes, however, that there is little evidence that these informational costs appreciably impact voters. Others find that the time and effort devoted to casting a ballot are key. Here, the costs associated with barriers like registering to vote (Corvalan and Cox, Reference Corvalan and Cox2018), finding one’s polling place (Brady and McNulty, Reference Brady and McNulty2011), travel distance (Gimpel and Schuknecht, Reference Gimpel and Schuknecht2003, Haspel and Knotts, Reference Haspel and Knotts2005, McNulty et al., Reference McNulty, Dowling and Ariotti2009), and waiting in line (Cottrell et al., Reference David, Herron and Smith2021, Pettigrew, Reference Pettigrew2021) are negatively associated with individuals’ propensity to turn out.Footnote 11
Our findings speak most directly to the set of papers that estimate the turnout costs associated with precinct consolidation (Haspel and Knotts, Reference Haspel and Knotts2005, McNulty et al., Reference McNulty, Dowling and Ariotti2009, Brady and McNulty, Reference Brady and McNulty2011, Amos et al., Reference Amos, Smith and Claire2017). In general, these studies treat pre-planned changes in precinct boundaries and their composition as exogenous. Even if these previous estimates are identified, it is unclear whether they should inform inferences about changes in the cost of voting imposed by precinct consolidations since they capture the indirect effects of countervailing mobilization. Indeed, there is evidence that the effects of altering polling locations are substantially diminished when individuals or groups disseminate information about precinct changes or promote early voting as an alternative (Haspel and Knotts, Reference Haspel and Knotts2005, Brady and McNulty, Reference Brady and McNulty2011, Clinton et al., Reference Clinton, Eubank, Fresh and Shepherd2021).
To summarize, by leveraging an arbitrary and unforeseen reprecincting event, our paper advances this literature on two fronts. First, we identify an unbiased estimate of the causal impact of consolidation, providing strong support for the parallel trends assumption necessary to credibly identify our model parameters. Second, because this shock occurred at the start of in-person voting, our estimates are unlikely to capture the weeks- or months-long counter-mobilization efforts that may mitigate the direct cost to voters. We thereby provide an estimate of the direct impact that consolidation imposes on voter turnout, which has implications for understanding the consequences of these policy choices and the importance for administrators to implement the appropriate countervailing measures when closures do occur—whether intentionally or following unforeseen events. We further discuss these implications in the conclusion.
1. Data and identification
At 12:32 a.m. on March 3, 2020—just under seven hours before primary election voting was scheduled to begin—a category EF3Footnote 12 tornado touched down in Davidson County, Tennessee, cutting a 20-mile path across the city of Nashville in just over an hour. The tornado watch was issued for Middle Tennessee at 11:20 p.m. the night before, leaving individuals and public officials just over an hour to prepare.Footnote 13 The storm caused considerable property damage, injured 170 people, and led to 2 deaths. Additionally, 250 electrical poles were downed, leaving 48,000 residents without power and causing the closure of Nashville public schools and several governmental offices.Footnote 14 The bottom panel of Figure 1 plots this damage. The solid black denotes property damage caused by the strike and follows the East–West path of the tornado. The open blue circles represent addresses that lost power.Footnote 15
Spatial distribution of polling places and tornado damage.

In the storm’s aftermath, election officials closed 21 polling locationsFootnote 16—about 14% of those in Davidson CountyFootnote 17—directly and indirectly due to power outages. About 74,000 registered voters (roughly 20% of those registered in Davidson County) were reassigned to 1 of 6 consolidated stations. Our identification strategy leverages variation in the number and location of voters’ assigned polling places induced by the tornado, allowing us to isolate various kinds of associated costs.
First, the tornado could have created additional reassignment costs for those who were forced to find new polling locations. Changes in polling sites were communicated just before polls opened via election officials’ websites and local news media. Many would-be voters did not receive this information, much of which was initially misreported.Footnote 18 Indeed, numerous residents described going to the wrong polling location or being directed to multiple places.Footnote 19 Furthermore, because polling places were originally assigned by neighborhood, individuals who correctly located their reassigned site were faced with the additional burden of traveling further, on average, than they would have under their usual assignment.
Second, even for some people who were not forced to relocate, the reassignment of other precincts into their own assigned location may have created consolidated costs associated with increased wait times and overcrowding. On the day of the tornado, election officials questioned the capacity of the consolidated “super sites” to hold multiple precincts, noting “what we’re up against is how big is the room, can we even get that many in the room?”Footnote 20 Lengthy lines were further exacerbated by an insufficient number of voting machines and election workers. Consequently, many residents reported hours-long waits, with one observer recalling that “some who got off the elevator turned around and left as soon as they saw the long line.”Footnote 21
Election administrators made other same-day policy changes designed to offset these costs. They established two “mega” sites, which are locations where any registered voter could go to vote that day—regardless of their originally assigned or reassigned precinct. One site was located in the Davidson County Election Commission’s main offices near the Nashville airport and the other was at their satellite location downtown. In contrast, only assigned voters could vote in one of the six consolidated “super” site locations. Furthermore, these super sites were given double the number of voting machines. While all polling sites opened an hour later than scheduled, regular sites were open an additional hour; and both super and mega sites were open an extra three hours at the end of the day. These additional administrative changes would bias against us finding a negative effect of the polling closures and consolidations on turnout. We argue that the other associated costs described above were still great enough to negatively impact voter turnout. In the remainder of this section, we describe the data and our identification strategy for isolating the direct effects of these costs on voter turnout.
1.1. Data
Our main source of data is the Tennessee voter registration file, provided by the Davidson County Election Commission in June of 2020. These data describe individuals’ turnout history and method of voting. We marry these measures with data derived from official Davidson County communications, which described individuals’ originally assigned polling place and their reassigned one in the 2020 primary. From this information, we create measures that capture fixed and variable components of both reassignment and consolidation costs. We first obtain discrete indicators for whether a voter was forced to travel to a new polling site and if she had to cast her vote in a consolidated location. The former incurred reassignment costs and the latter incurred consolidation costs.
We plot the spatial distribution of these three types in Figure 1. Voters living in the shaded gray areas were reassigned and forced to vote in a new, consolidated polling place. Those living in the hashed areas reflect those voters for whom polling stations did not change but whose location transformed into a consolidated station (i.e., a station where other precincts were reassigned to vote). Voters in neither the gray nor the hashed areas were unaffected by the morning-of-election consolidation we exploit. In the top panel of this figure, the green triangles give the location of each (preassigned) polling place.
Altogether, this figure shows that the voters who moved to a new location were largely concentrated around areas that were affected by the tornado. And even those who were not directly in the tornado’s path incurred costs if their polling station transformed into a consolidated site. Furthermore, these data allow us to construct a continuous measure describing the travel distance between an individual’s home and her polling site, as well as a continuous measure describing the number of people assigned to each individual’s polling site (variable consolidation costs). Summary statistics are provided in Table A1 of the appendix.
To avoid conflating the effect of physical damage with the effects of precinct consolidations, we construct “controls” to account for individuals’ direct exposure to the tornado. Using addresses known to have experienced property damage caused by the tornado from the Nashville Electric Service (NES), we create an indicator of whether a person lives within a 500-m radius of a damaged property. Similarly, using those addresses that experienced power outages on the day of the tornado, we construct an exposure variable that takes on the value of one if a voter lives within a 500-m radius of a location that lost power.Footnote 22 Polling places were largely closed because of their own power outages or because of damage related to nearby outages (e.g., downed power lines or traffic lights that obstructed roads). We expect that other possible damage caused by the tornado, like fallen trees and severe property damage, would be highly correlated with the location of the power outages that our controls capture.
1.2. Identification
To describe our identification strategy, consider the “calculus of voting” model of Riker and Ordeshook Reference Riker and Ordeshook(1968). Here, individual i votes in election e if:
 \begin{equation}
p_{ie} B_{ie} +d_{ie} \gt c_{ie},
\end{equation}
\begin{equation}
p_{ie} B_{ie} +d_{ie} \gt c_{ie},
\end{equation}where pie is the probability that the voter is pivotal, Bie is the instrumental utility she obtains from casting a pivotal vote, die is the expressive benefit she obtains from voting, and cie is the cost of voting. We want to estimate the linear approximation of this:
 \begin{equation}
y_{ie} = c_e + c_i + T'_{ie}\pi_{ie} +p_{ie}B_{ie} + d_{ie},
\end{equation}
\begin{equation}
y_{ie} = c_e + c_i + T'_{ie}\pi_{ie} +p_{ie}B_{ie} + d_{ie},
\end{equation} where yie is an indicator taking on a value of 1 if voter i turns out in election e and 0 otherwise. The observed costs of voting are modeled by two parameters: a time invariant individual-specific net cost (benefit), ci, which captures all of the (unchanging) voter-specific features that may impact the choice to vote (e.g., voters’ race, sex, or religion), and an election-specific cost (benefits), ce, i.e., those costs common to all voters that may make some elections more salient than others. Here, die represents the unobserved net costs (benefits) of voting. As in Equation 1,  $p_{ie}B_{ie}$ reflects voters’ instrumental preferences (e.g., how much they care about the election’s outcomes and their subjective probability of being pivotal).
We are interested in πie, the vector of costs associated with the consolidation and closure of polling stations, which is denoted by Tie, a vector of indicators describing whether a voter was assigned to a new polling station and if they were assigned to vote in a consolidated polling place. Since we have two periods, 0 and 1, and each element of Tie is only activated in period 1, we can identify  $\pi_e = \mathbb{E}(\pi_{ie})$ (the effect averaging over individuals) in a difference-in-differences framework under the assumption, $\mathbb{E}( p_{i1}B_{i1} + d_{i1} - p_{i1}B_{i0} - d_{i0} | T_{ie} = t ) = 0$. That is, we must assume that the trend in the unobserved component of voters’ utilities is, on average, equal across each of the three groups in our data.
1.2.1. The baseline election and controlling for instrumental preferences
Our identification strategy relies upon a comparison of the change in turnout across a pair of elections. The closure and consolidation interventions we observe are only at the March 2, 2020, primary election; however, there is no clear baseline election in this instance, since Tennessee’s open primary system allows all registered voters—across parties—to cast their ballot in the primary of their choosing. Indeed, the publicly available data upon which we rely does not provide information describing the party membership of voters. Nevertheless, even though the Republican presidential primary was uncontested, turnout was 36% among Davidson County voters who had previously (at any point between 2014 and 2018) voted in a Republican primary.Footnote 23
In principle, so long as the parallel trends assumption holds, our cost parameters can be identified regardless of the choice of baseline election. Because it gives us the largest number of registered voters across both pre- and post-treatment periods, we treat the general election of November 2018 as our baseline.Footnote 24 We use the August 2018 and March 2016 primaries as alternative baseline elections, which do not substantively alter our results. Our findings are also robust when sub-setting our data to include only voters who prior to our baseline election had voted in a Democratic primary.Footnote 25
Still, we might worry that by comparing changes across a primary election where one party’s election is uncontested to a general election may lead to a violation of the parallel trends assumption. This possibility would be particularly problematic if voters in our treated precincts differ in their preferences for candidates or by the way they understand their probability of being pivotal. We can control for potential differences in voters’ instrumental preferences, ameliorating concerns that differences in the menu of candidates across elections may bias our results, by treating the following as our baseline estimating equation:
 \begin{equation}
y^p_{ie} = c_i^p + c_e^p + T'_{ie} \pi_{ie} + \alpha y^a_{ie} + \epsilon_{ie}^p,
\end{equation}
\begin{equation}
y^p_{ie} = c_i^p + c_e^p + T'_{ie} \pi_{ie} + \alpha y^a_{ie} + \epsilon_{ie}^p,
\end{equation} where the superscript denotes the method of voting (i.e., p represents in-person voting and a absentee/early voting).Footnote 26 Estimating this conditional expectation,  $\mathbb{E}(y^p_{ie} |y^a_{ie}, T_{ie})$, via OLS is identical to estimating the average impact of Tie on in-person turnout, conditional on voters’ (unobserved) instrumental utilities and the unobserved shock to the costs and benefits of absentee voting.Footnote 27 This follows from the fact that the instrumental component of utility, $p_{ie}B_{ie}$, is constant across methods of voting.Footnote 28 As such, estimating Equation 3 allows us to identify the impact of precinct consolidation on turnout under considerably weaker identification assumptions. We now only require that $\mathbb{E}( d^p_{i1} - d^p_{i0} | T_{ie} = t ) = 0$, i.e., a parallel trends assumption on the idiosyncratic in-person (net) costs of voting, because we have controlled for voters’ (unobserved) instrumental preferences. In other words, we have accounted for partisan (or other) preference-related differences that might otherwise confound our results.
1.2.2. Two effects of the tornado shock
The tornado shock created three groups that allow us to separately identify the reassignment and consolidation costs imposed on registered voters by polling station consolidation. They are:
(1) The Reassigned: Individuals whose voting station changed. They faced the costs associated with finding and traveling to a new polling station. They also bore the costs of voting in a consolidated voting station (e.g., long wait times and overcrowding), where voters from multiple locations were now required to vote in a single station.
(2) Consolidated Poll Site: Individuals whose voting station did not change, but their station transformed into a consolidated site where additional precincts were assigned to their locations. These individuals only faced the costs of voting in a consolidated polling site.
(3) Control: Individuals whose voting station did not change and whose station was not transformed into a consolidated site. They did not face any additional costs for voting.
Given these three groups, we can write our baseline estimating equation asFootnote 29:
 \begin{equation}
\begin{aligned}
y^p_{ie} = c^p_i + c^p_e &+ \pi_1 ReassignedPoll_{ie}\\
&+ \pi_2Consolidated Poll_{ie} + \alpha y^a_{ie} + \epsilon^p_{ie},
\end{aligned}
\end{equation}
\begin{equation}
\begin{aligned}
y^p_{ie} = c^p_i + c^p_e &+ \pi_1 ReassignedPoll_{ie}\\
&+ \pi_2Consolidated Poll_{ie} + \alpha y^a_{ie} + \epsilon^p_{ie},
\end{aligned}
\end{equation}where ReassignedPollie is an indicator taking on a value of 1 if an individual lived in a polling station that was reassigned because of the tornado and zero otherwise. ConsolidatedPollie is an indicator taking on a value of 1 if an individual was assigned to a consolidated polling station and zero otherwise. Thus, for “the reassigned,” both ReassignedPollie and ConsolidatedPollie equal one when e = 1 and zero when e = 0. For those who did not move stations but were assigned to consolidated polling sites, ConsolidatedPollie equals one when e = 1, zero when e = 0, and ReassignedPollie equal zero across elections. For “control” voters, both ReassignedPollie and ConsolidatedPollie always equal zero.
Furthermore, we can decompose these effects into their fixed and variable components. First, we proxy for the expected variable costs of moving to a new polling station by including as a regressor the difference between the realized and expected driving distance between an individual’s address and polling place. We operationalize this as the difference in log distance between an individual’s address and their day-of-election polling site and the log distance between their address and their pre-assigned polling place.Footnote 30 For those who were not reassigned, this distance is constant and zero. But for the reassigned it is non-zero since their realized voting location and assigned voting locations differ. Second, we account for the expected variable cost of voting in a consolidated station by taking the log difference between the size (the number of people assigned) of the originally assigned polling station and the size of the newly assigned station in the 2020 primary. Again, for those that did not vote in a consolidated precinct, the difference between the realized and expected size of the polling station is constant and zero.Footnote 31 The estimating equation becomes:
 \begin{equation}
\begin{aligned}
y^p_{ie} = c^p_i + c^p_e &+ \pi_1^f ReassignedPoll_{ie} + \pi_1^vDistancetoPoll_{ie} \\
& + \pi_2^f Consolidated Poll_{ie} + \pi_2^v PrecinctSize_{ie} + \alpha y^a_{ie}+ \epsilon^p_{ie}.
\end{aligned}
\end{equation}
\begin{equation}
\begin{aligned}
y^p_{ie} = c^p_i + c^p_e &+ \pi_1^f ReassignedPoll_{ie} + \pi_1^vDistancetoPoll_{ie} \\
& + \pi_2^f Consolidated Poll_{ie} + \pi_2^v PrecinctSize_{ie} + \alpha y^a_{ie}+ \epsilon^p_{ie}.
\end{aligned}
\end{equation} Here, one interpretation of the reassignment fixed cost parameter,  $\pi_1^f$, is that it reflects the average common cost of acquiring information about voters’ newly assigned polling locations. That is, it can be thought of as reflecting the (distance-invariant) shared cost all those who were reassigned face when assigned to a new polling place. In contrast, the reassignment variable cost parameter, $\pi_1^v$, reflects the costs that covary with changes in travel distance to polling sites. Similarly, the fixed consolidation parameter, $\pi_2^f$, reflects all of the average costs induced by simply voting in any consolidated precinct, whereas the variable consolidation cost parameter, $\pi_2^v$, captures the costs associated with each additional person assigned to a newly consolidated site.Footnote 32
2. Results
Our baseline findings are presented in Table 1.Footnote 33 The first column shows the results without controls. The point estimates indicate that moving to a new polling place reduced in-person turnout by 6.9 pp. The effect of voting at a consolidated polling site is statistically indistinguishable from zero, though the point estimate indicates a 2.6 pp reduction in turnout. In column 2, we control for property damage and power outages. The inclusion of these controls reduces the point estimates on our variables of interest, with the reassignment effect attenuated to −5.65 pp and the consolidated effect remaining statistically indistinguishable from zero at −2.0 pp.
Difference-in-differences estimates of the cost of voting

Note: This table gives the difference-in-differences estimates of costs of voting in Davidson County, TN. The unit of observation is the voter-election. The outcome in the first three columns is an indicator taking on a value of 1 if the respondent voted in person and zero otherwise. The second three columns are an indicator taking on a value of 1 if the respondent voted via absentee ballot or early and zero otherwise. The baseline election is the general election of November 2018 and the treated election is the primary election of March 2020. Analysis is conducted on the set of voters who were registered to vote in both the November 2018 general election and the March 2020 primary. Reassigned is an indicator taking on a value of 1 if a voter’s polling station was moved due to the tornado of March 3, 2020, and zero otherwise. Consolidated Poll is an indicator taking on a value of 1 if the voter voted in a consolidated polling station. Distance to Poll is the change in distance between the individual’s address and the polling site they were originally assigned and the distance between their address and the polling station they were moved to because of the tornado. Precinct size is the difference between the number of voters assigned to each voters’ polling station and the realized number that were assigned to the precinct where they actually voted in the 2020 primary. Damage Controls include a binary indicator taking on a value of 1 if a voter’s home was damaged by the tornado and zero otherwise, as well as a binary indicator taking on a value of 1 if there was a power outage within 500 m of an individual’s home and zero otherwise. Columns 4 and 5 condition on whether the voter cast an early or absentee ballot prior to the primary election of March 3, 2020. The outcome is in-person voting (columns 1–4) and early/absentee voting (columns 6–8). All models account for voter and election fixed effects. 95% confidence intervals in brackets, standard errors clustered by assigned polling station in parentheses.
In the third column, we decompose the reassignment and consolidation effects into their fixed and variable components. Here, our parameter estimates indicate that the reassignment effect is mostly driven by variable, not fixed, costs. That is, we find little evidence that the costs of discovering a polling place have been reassigned and locating to its new site are motivating the reassignment effect. Instead, this effect is entirely driven by changes in expected travel costs. Here, the coefficient on the variable (distance) component is negative and statistically significant at conventional levels and indicates a 100% increase in travel distance causes a 2.55 pp reduction in in-person turnout.
Similarly, we find that the variable cost associated with voting in a consolidated precinct (i.e., the change in the number of people assigned to a voter’s precinct) is negative, while the fixed component of voting in a consolidated precinct is positive but statistically indistinguishable from zero. The coefficient on the variable cost of consolidation (the change in precinct size) indicates that a 100% increase in polling-location size causes a 4.7 pp reduction in turnout.
In columns 4 and 5, we condition on voters’ early/absentee vote choice, controlling for changes in the instrumental component of voters’ utilities ( $p_{ie}B_{ie}$). Column 4 shows the total reassignment and overflow precinct effects are slightly attenuated, with the “reassignment” effect now indicating a reduction in turnout of 5.71 pp and the consolidated precinct effect still indistinguishable from zero but slightly larger than in the previous specification at -1.41 pp (column 4). Column 5 decomposes these effects into their fixed and variable components, revealing results similar to those previously reported.
Again, our parameter estimates indicate that the “reassignment” effect is being driven by expected changes in travel distance. The total reassignment effect generated from the parameter estimates in column 5 is plotted in the right-hand panel of Figure 2. Across the range of observed values, the effect of an increased expected distance is negative. A person whose new polling place was 100% further than her initially assigned site is, on average, predicted to turn out 5.1 pp less frequently than someone whose polling place did not change. A 200% increase is predicted to reduce turnout by 8.1 pp and at the 99th percentile change—about a 400% increase in expected distance—our estimates indicate a total effect of being reassigned equivalent to a 13.8 pp reduction in turnout relative to those who were not reassigned.
Effects of Size and Distance.

The total effect of voting in a consolidated precinct (as derived from column 5) is plotted in the left-hand panel of Figure 2. When precinct size increases by roughly more than 50%, this effect implies a 0.8 pp reduction in turnout and is statistically insignificant. However, the total effect at an increase of 100% implies a reduction in turnout of just under 2.8 pp relative to those who did not vote in a consolidated site. At the largest increase in precinct size, about 340%, turnout is reduced by 14.1 pp.
In sum, our results indicate that, on average, forcing potential voters to move to a new polling station decreases their turnout by 5.65–6.9 pp. Moreover, this effect is largely driven by changes in travel distance rather than the fixed costs of voting at a new polling site. By contrast, the effect of voting in a consolidated precinct is statistically indistinguishable from zero, though the point estimate is negative. Yet our results indicate that this null effect is masking considerable heterogeneity driven by the size of reassigned precincts. When a voter’s reassigned precinct is not too large relative to her previous polling site, she is no more or less likely to turn out than voters who were not assigned to a consolidated polling place. However, when this difference reaches a certain threshold (about a 100% change), she is considerably less likely to vote.
2.1. Evaluating our identifying assumptions
A key assumption underlying our results is that exposure to the tornado had no impact on the choice to vote early or via absentee ballot. Though individuals facing pre-planned changes to polling sites might be able to offset the additional costs by voting early or absentee (Brady and McNulty, Reference Brady and McNulty2011, Clinton et al., Reference Clinton, Eubank, Fresh and Shepherd2021, Tomkins et al., Reference Tomkins, Yao, Gaebler, Konitzer, Rothschild, Meredith and Goel2023), the fact that the Davidson County tornado arbitrarily targeted potential voters and hit on the morning of Super Tuesday did not allow these residents any time to seek these alternative means of voting.Footnote 34 Even so, there still could be some underlying and unobservable factors associated with districts affected by the tornado that influenced individuals’ choice to vote early.Footnote 35 We gauge whether such a violation of our identifying assumptions is plausible in columns 6–8 of Table 1 by estimating, via difference-in-differences, the “effect” of the tornado on the probability a voter cast her ballot early or via absentee ballot. In each specification, we find no evidence of such an effect—as expected. We obtain very small parameter estimates, all of which are indistinguishable from zero.
If the tornado had no effect on absentee or early voting, we can identify our baseline effect under the assumption of parallel trends in the net cost of in-person voting alone, controlling for voters’ instrumental preferences. In Figure 3, we plot the in-person turnout rate for our baseline population of registered voters across the eight preceding federal primary and general elections. Here, the trend (and levels) across individuals who moved precincts, who just voted in a consolidated precinct, and who were not impacted by consolidation appear near identical.
Trends in in-person turnout.

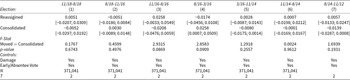
To systematically evaluate the plausibility of this assumption in Table 2, we estimate our full model (column 4 in Table 1) on the seven pairs of preceding elections. Two sets of null findings are important to support our assumption of parallel trends. First, we require that both the reassignment effect and the consolidation effect be indistinguishable from the control group. Second, these two effects should be indistinguishable from each other. Assuredly, we estimate near-zero and statistically insignificant reassignment and consolidation effects in all but one election. That is, for the 14 estimated coefficients, only one is indistinguishable from zero—which we would expect by chance. Moreover, the F-test on the equality of these parameters fails to reject the null hypothesis that they are equal across each specification. Overall, we find strong support for the two conditions required for our parallel trends assumption to hold.
Evaluation of the parallel trends assumption

Note: This table gives the placebo difference-in-differences estimates of costs of voting in Davidson County, TN, for all federal primary and general elections from 11/12 to 11/18. The unit of observation is the voter-election. The outcome in an indicator taking on a value of 1 if the respondent voted in person and zero otherwise. The “treated” and baseline elections are given in the column names. Analysis is conducted on the set of voters who were registered to vote in both the November 2018 general election and the March 2020 primary. Reassigned is an indicator taking on a value of 1 if a voter’s polling station was moved due to the tornado of March 3, 2020, and zero otherwise. Consolidated is an indicator taking on a value of 1 if the voter voted in a consolidated polling station. Damage Controls include a binary indicator taking on a value of 1 if a voter’s home was within 500 m of a structure damaged by the tornado and zero otherwise, as well as a binary indicator taking on a value of 1 if there was a power outage within 500 m of an individual’s home, and zero otherwise. The outcome is in-person voting. All models account for voter and election fixed effects. 95% confidence intervals in brackets, standard errors clustered by assigned polling station in parentheses.
3. Heterogeneous effects
In this section, we investigate heterogeneity in our baseline estimates. To start, we show that these effects—particularly the reassignment effects—are concentrated in the group of high propensity voters, e.g., the set of voters who turned out at high rates in previous elections. We focus on heterogeneity with respect to past turnout (regardless of voting method) in the set of elections between the presidential election of 2012 and the congressional primary election of 2018 (the set of elections in Table 2). We then further explore how these heterogeneous effects vary with respect to past turnout in general and primary elections, respectively.
Results from this exercise are given in Table 3. In the first column, we examine the baseline reassignment and consolidation effects—allowing them to vary with the total number of votes cast in all contests prior to our baseline congressional election of 11/18 and after (including) the presidential election of 11/12. Here, the coefficient on the interaction term for the reassignment effect is negative and statistically significant. This result indicates that the effect of being reassigned to a new polling place decreases by 2.18 pp with every previous election a voter participated in. In contrast, the interaction of past turnout and the consolidation indicator is considerably smaller, indicating a 0.29 pp reduction in in-person turnout, and is indistinguishable from zero.
Heterogeneity by past turnout (11/12–8/18)

Note: This table gives the difference-in-differences estimates of costs of voting in Davidson County, TN. The unit of observation is the voter-election. The outcome in the first three columns is an indicator taking on a value of 1 if the respondent voted in person and zero otherwise. The second three columns are an indicator taking on a value of 1 if the respondent voted via absentee ballot or early and zero otherwise. The baseline election is the general election of November 2018 and the treated election is the primary election of March 2020. Analysis is conducted on the set of voters who were registered to vote in both the November 2018 general election and the March 2020 primary. Analysis is conducted on the set of voters who were registered to vote in both the November 2018 general election and the March 2020 primary. Reassigned is an indicator taking on a value of 1 if a voter’s polling station was moved due to the tornado of March 3, 2020, and zero otherwise. Consolidated is an indicator taking on a value of 1 if the voter voted in a consolidated polling station. We allow this to vary by past turnout in all general and primary elections between 11/12 and 3/20. Past Turnout describes the number of all elections in this period that a voter turned out in, General Turnout describes the number of general elections in this period a voter turned out in, Primary Turnout describes the number of primary elections in this period a voter turned out in, Dem/Rep Primary Turnout describes the number of party-specific primary elections a voter turned out in. Damage Controls include a binary indicator taking on a value of 1 if a voter’s home was within 500 m of a structure damaged by the tornado and zero otherwise, as well as a binary indicator taking on a value of 1 if there was a power outage within 500 m of an individual’s home and zero otherwise. All models include past turnout-specific time trends.
The outcome is in-person voting. All models account for voter and election fixed effects. 95% confidence intervals in brackets, standard errors clustered by assigned polling station in parentheses.
We reproduce this exercise in the next three columns. In column 2, we focus on past turnout in the three general elections in the pre-baseline period we examine. In column 3, we do the same but instead with turnout in the four primary elections in the same period. We then decompose primary voting by party—Democratic and Republican—primaries in column 4. Across each specification, the same qualitative result holds; the magnitude of the reassignment effect varies negatively with past participation. Further, an F-test on the equality of Democratic and Republican primary turnout interactions does not allow us to reject the null hypothesis that the interaction effects of partisan primary participation are equal across parties.
The total reassignment effects across the range of past turnout behavior are plotted in Figure 4. The effect from column 1 is plotted in the left panel, varying with total past (primary and general) turnout. Those who were registered but had not voted in our pre-baseline period were, essentially, unimpacted. However, the median registered voter, who over this period had previously voted twice, was 4.98 pp less likely to vote when forced to travel to a new polling place. At the extreme, the most participatory voters—those who turned out in all seven of our pre-baseline elections—were 15.9 pp less likely to vote in person. These total effects are similar when we examine the interaction of polling place reassignment with past general election (middle panel) and primary election (right panel) turnout, respectively.
The total reassignment effect as it varies with past turnout.

3.1. Demographics and Heterogeneity
In supplemental appendix Table A12, we present results that explore heterogeneity in our baseline effects with the limited demographic covariates available to us from the voter registration file. We have direct measures of gender and age. Here, we find no evidence of any sort of heterogeneity by gender. In line with our previous results, however, we do uncover substantial heterogeneity by age. Older voters—a high propensity group of voters—are considerably less likely to vote than young voters when forced to vote in a new polling place. When reassigned polling places, an additional year of age decreases the effect of reassignment, reducing voting in-person by 0.20 pp.
Race is self-reported in the voter file for 48% of respondents. Using census tracts and names, we impute the race of the remaining respondents via the method of Imai and Khanna Reference Imai and Khanna(2016). Similarly, we construct a census-tract level estimate of income (adjusted for age group and race). With the caveat that both of the race and tract-level measures of income are plagued by various forms of measurement error, we find little evidence of heterogeneity in our baseline effects across race and income.
4. Discussion and conclusion
Policy choices that impact the number and location of polling locations are increasingly salient. This is particularly true since, in the post-Shelby era, previously constrained election administrators are no longer required to justify or obtain federal approval to close voting sites. While site closures can substantially lengthen travel distances and increase wait times (Allison and Warren, Reference Allison and Warren2019, Lab, Reference Lab2020, Klain et al., Reference Klain, Morris, Feldman and Ayala2020), characterizing the cost to voters of the choice to close and consolidate voting locations is difficult, since generally, these policy choices produce other effects that are difficult to isolate.
Indeed, many of these closures have often occurred in conjunction with other changes to election administration that might also lower turnout, like voter ID laws and purges(Allison and Warren, Reference Allison and Warren2019).Footnote 36 Conversely, the availability of alternative means of voting (e.g., voting centers, mail-in ballots) and other counter-mobilizing efforts by political actors can increase turnout, sometimes even offsetting the negative effects of site closures (Stein, Reference Stein2015, Clinton et al., Reference Clinton, Eubank, Fresh and Shepherd2021, Zelin and Smith, Reference Zelin and Smith2023) and other restrictive electoral laws (Hopkins et al., Reference Hopkins, Meredith, Morse, Smith and Yoder2017, Cantoni and Pons, Reference Cantoni and Pons2019).Footnote 37
Importantly, not all states or localities impose measures to counteract the potentially negative effects of polling closures on voter turnout. Following the Shelby ruling, administrators are no longer required to notify voters of planned closures (Allison and Warren, Reference Allison and Warren2019, Lab, Reference Lab2020). Though many of these closures were widely covered in the media ahead of time (e.g., Texas, Arizona, and Georgia), others—like those in Alaska, Alabama, Louisiana, Mississippi, and North Carolina—occurred “without clear notice or justification” and closures, on the whole, mostly went “unnoticed, unreported, and unchallenged”(Allison and Warren, Reference Allison and Warren2019).
Election administrations in some areas compensated for site closures by expanding mail-in voting options and adopting universal voting centers. According to one report, however, several states reduced their voting location sites without making any of these or other changes to offset the increased costs.Footnote 38 Even areas that have expanded mail-in options in light of site closures may still not be reducing the costs of voting for all individuals, like some native populations in Alaska and Arizona who prefer in-person voting.Footnote 39 Others fail to provide consolidated sites with additional resources—more poll workers, ballots, and voting machines—or with adequate language options for mail-in ballots (Allison and Warren, Reference Allison and Warren2019, Lab, Reference Lab2020).Footnote 40
Overall, there is substantial variation in the degree to which states, localities, and interest groups offset polling closures through mobilization efforts and by providing alternative voting options. To fully understand the importance of these decisions, we must isolate the direct effect of polling-place consolidation. Standard approaches to identifying the turnout effect of these closures or other restrictive voting laws typically cannot separate the direct costs to individuals from the indirect effect of policies and strategies intended to mitigate these costs. Accordingly, we use an exogenously timed shock to polling site consolidation (i.e., the Election Day tornado in Davidson County, Tennessee) and consider the scenario where counter-mobilization is limited. Thus, our case represents a more general scenario where election officials close precincts but little is done to counteract these closures—either because of low interest group presence, scarce resources or information, or lack of alternative voting options.
Furthermore, our results have implications for election officials who must respond to changes following natural disasters or other public emergencies. Though widely disseminating information about site closures and reassignments is certainly important, our results indicate that officials should devote particular attention to decreasing the distance individuals must travel and the time they must spend waiting in line to vote. Moreover, expanding early voting and mail-in voting options may not be sufficient, especially in situations where emergencies have occurred right before the election and those planning to vote in person do not have enough time or desire to switch methods. In these scenarios, election administrators may aim to open more universal vote centers with extended hours. They could also facilitate transportation for displaced voters, as some interest groups did in the wake of Hurricane Katrina (Sinclair et al., Reference Betsy, Hall and Alvarez2011). Finally, administrators should ensure that voting locations are properly resourced with voting machines, ballots, and poll workers. Staff shortages, in particular, have increasingly become a problem; but they might be addressed through increased recruitment and training efforts or by offering higher pay and other incentives (Lab, Reference Lab2020).
How generalizable are these findings outside of the single primary election in Davidson County, Tennessee, that we examine? First, we might expect to find even greater effects if this disaster occurred during the general election. General election voters represent a wider pool of the population and are usually less informed, motivated, and resourced—all of which might magnify some of the costs to finding, traveling, and waiting in line at a new location. Alternatively, general elections tend to be higher in salience and, thus, individuals could place a higher intrinsic value to voting, which might actually decrease the impact of these other costs (Sinclair et al., Reference Betsy, Hall and Alvarez2011). Second, we might expect to find similar results for natural disasters that have caused sufficient damage to result in polling site closures (e.g., building destruction, power outages) rather than for more minor events that do not impose high enough costs to change the calculus of voting. Indeed, there is evidence of such effects in the case of hurricanes (Sinclair et al., Reference Betsy, Hall and Alvarez2011, Stein, Reference Stein2015, Zelin and Smith, Reference Zelin and Smith2023). However, these studies do not isolate the specific costs (or counter-mobilizing efforts) that drive their estimated effects, making extrapolation difficult. Third, these results could vary based on the timing of the emergency or disaster relative to the election. In our case, the tornado occurred on the morning of the election, leaving little time for administrators, interest groups, or citizens to make adjustments to mitigate those costs. Nevertheless, the costs we characterize might be offset if more time were available.
Finally, we might question the generalizability of our results outside of the context of natural disasters and other emergencies. Certainly, election administrators close polling sites for numerous reasons—including budgetary constraints, demographic changes, and demand from voters—all of which may have consequences for turnout. This study shows that those consequences are likely to be largest when administrators impose closures proximate to elections, fail to provide sufficient resources in the remaining in-person sites, and/or do not allow for alternative means of voting.
Supplementary material
The supplementary material for this article can be found at https://doi.org/10.1017/psrm.2025.10034. To obtain replication material for this article, https://doi.org/10.7910/DVN/MCM0AX_.




 Open access

