





I. INTRODUCTION
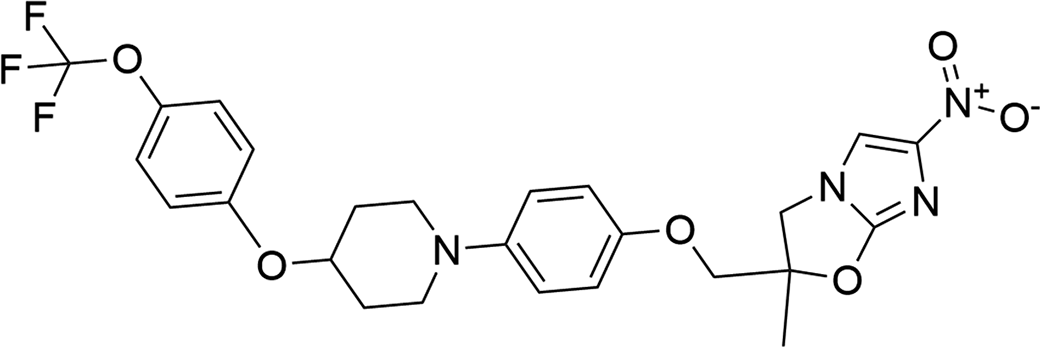
Delamanid (marketed under the trade name Deltyba) is administered to treat tuberculosis and is used in combination therapy as a first line of defense against multidrug resistance. Delamanid works by being activated by a bacterial enzyme in the nitroreductase class, with the intermediate molecule being involved in blocking the production of mycolic acids, which help bacteria avoid the immune system and antibiotic treatment (Gler et al., Reference Gler, Skripconoka, Sanchez-Garavito, Xiao, Cabrera-Rivero, Vargas-Vasquez and Gao2012; Xavier and Lakshmanan, Reference Xavier and Lakshmanan2014; Zhao et al., Reference Zhao, Siddiqui, Shang, Bian, Bagchi, He and Wang2015). Delamanid is European Medicines Agency (EMA)-approved, and although not extensively FDA-approved, it is allowed for use in multidrug-resistant cases (Lardizabal et al., Reference Lardizabal, Khan, Bamrah and Goswami2017; Mudde et al., Reference Mudde, Upton, Lenaerts, Bax and De Steenwinkel2022). This drug shows promising results from the limited currently published international studies, acting more rapidly and having greater potency against tuberculosis than some other treatment options (Xavier and Lakshmanan, Reference Xavier and Lakshmanan2014; Pontali et al., Reference Pontali, Centis, D’Ambrosio, Toscanini and Migliori2019). The systematic name (CAS Registry No. 681492-22-8) is (2R)-2-methyl-6-nitro-2-[[4-[4-[4-(trifluoromethoxy)phenoxy]piperidin-1-yl]phenoxy]methyl]-3H-imidazo[2,1-b][1,3]oxazole. A two-dimensional molecular diagram of delamanid is shown in Figure 1.
The two-dimensional structure of delamanid.

Commercial Deltyba is formulated as an amorphous solid dispersion with poly(hydroxypropyl methylcellulose phthalate) (Duong et al., Reference Duong, Nguyen and Taylor2022). In an attempt to increase the solubility of delamanid, Duong et al. prepared several sulfonate salts and also reported a powder diffraction pattern of crystalline delamanid. The EMA (2013) indicates that the enantiomeric purity of delamanid is routinely controlled by chiral high performance liquid chromatography (HPLC) and that no polymorphs or solvates have been found.
This work was carried out as part of a project (Kaduk et al., Reference Kaduk, Crowder, Zhong, Fawcett and Suchomel2014) to determine the crystal structures of large-volume commercial pharmaceuticals and include high-quality powder diffraction data for them in the Powder Diffraction File™ (Kabekkodu et al., Reference Kabekkodu, Dosen and Blanton2024).
II. EXPERIMENTAL
Delamanid was a commercial reagent, purchased from Achemblock (Batch #18775) and was used as received. The light beige powder was packed into a 1.5-mm-diameter Kapton capillary and rotated during the measurement at ~50 Hz. The powder pattern was measured at 295 K at beamline 11-BM (Antao et al., Reference Antao, Hassan, Wang, Lee and Toby2008; Lee et al., Reference Lee, Shu, Ramanathan, Preissner, Wang, Beno and Von Dreele2008; Wang et al., Reference Wang, Toby, Lee, Ribaud, Antao, Kurtz, Ramanathan, Von Dreele and Beno2008) of the Advanced Photon Source at Argonne National Laboratory using a wavelength of 0.458133(2) Å from 0.5 to 50° 2θ with a step size of 0.001° and a counting time of 0.1 seconds per step. The high-resolution powder diffraction data were collected using 12 silicon crystal analyzers that allow for high angular resolution, high precision, and accurate peak positions. A mixture of silicon (NIST SRM 640c) and alumina (NIST SRM 676a) standards (ratio Al2O3:Si = 2:1 by weight) was used to calibrate the instrument and refine the monochromatic wavelength used in the experiment.
The pattern was indexed using DICVOL14 (Louër and Boultif, Reference Louër and Boultif2014) on a primitive orthorhombic unit cell having a = 67.50965, b = 10.35692, c = 6.43550 Å, and V = 4,499.65 Å3. The unit cell volume is consistent with Z = 8. A reduced cell search of the Cambridge Structural Database (Groom et al., Reference Groom, Bruno, Lightfoot and Ward2016) yielded three hits, but no delamanid derivatives.
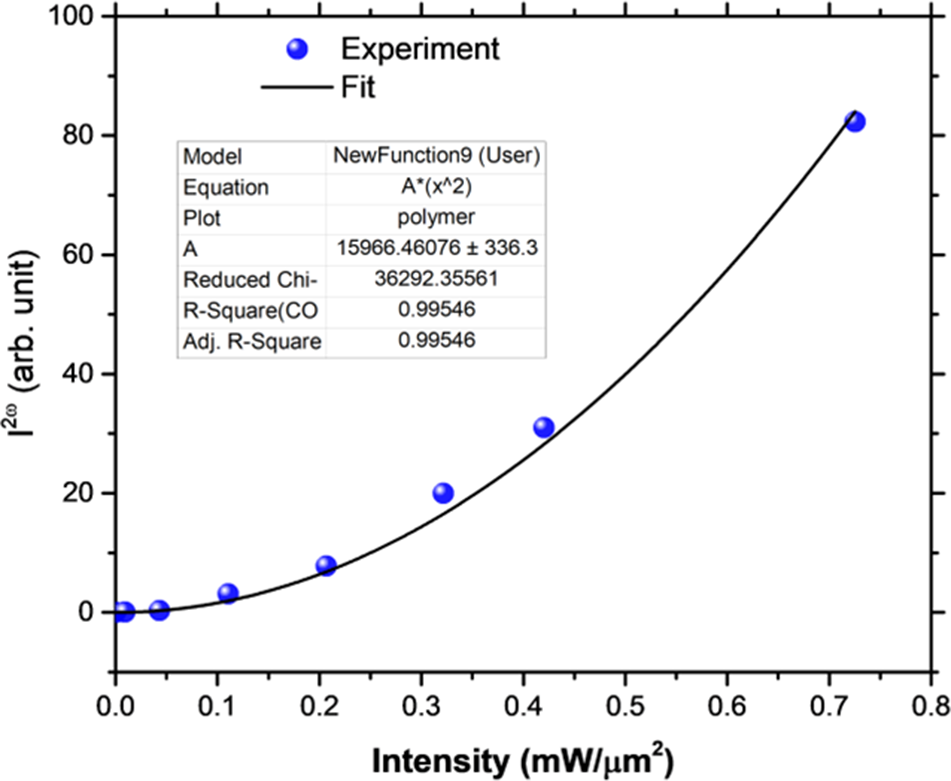
Establishing the space group was difficult. Several space group interpretation routines suggested the extinction symbol Pb_b, especially preferring Pbnb (Z’ = 1). The glide planes are inconsistent with pure R-delamanid. The highest-ranked proper space group was P212121, which would require Z’ = 2. The structure was thus solved and refined in both Pbnb and P212121. The centrosymmetric space group (Pbnb) yielded R wp ∼ 20.4%, while the non-centrosymmetric space group (P212121) yielded R wp ∼ 17.8% (with about twice as many parameters). To confirm the absence of a center of symmetry, a second harmonic test was carried out (Figure 2). The SHG is a quadratic function of the laser power level, so the sample is non-centrosymmetric, and thus the suggested space group was P212121.
Second harmonic generation test results for delamanid, confirming the absence of a center of symmetry.

The delamanid molecular structure was downloaded from PubChem (Kim et al., Reference Kim, Chen, Cheng, Gindulyte, He, He and Li2023) as Conformer3D_CID_6480466.sdf. It was converted to a *.mol2 file using Mercury (Macrae et al., Reference Macrae, Sovago, Cottrell, Galek, McCabe, Pidcock and Platings2020). The crystal structure was solved using Monte Carlo-simulated annealing techniques as implemented in EXPO2014 (Altomare et al., Reference Altomare, Cuocci, Giacovazzo, Moliterni, Rizzi, Corriero and Falcicchio2013), using two R-delamanid molecules as fragments, with a bump penalty and [100] preferred orientation.
Rietveld refinement (starting from the VASP-optimized structure) was carried out with GSAS-II (Toby and Von Dreele, Reference Toby and Von Dreele2013). Only the 0.7–22.0° portion of the pattern was included in the refinements (d min = 1.200 Å). All non-H-bond distances and angles were subjected to restraints, based on a Mercury/Mogul Geometry Check (Bruno et al., Reference Bruno, Cole, Kessler, Luo, Motherwell, Purkis and Smith2004; Sykes et al., Reference Sykes, McCabe, Allen, Battle, Bruno and Wood2011). The Mogul average and standard deviation for each quantity were used as the restraint parameters. The phenyl rings and the fused ring systems were restrained to be planar. The restraints contributed 15.1% to the final χ 2. The hydrogen atoms were included in calculated positions, which were recalculated during the refinement using Materials Studio (Dassault Systèmes, 2023). The U iso of the heavy atoms were grouped by chemical similarity. The U iso for the H atoms were fixed at 1.3× the U iso of the heavy atoms to which they are attached. The peak profiles were described using the generalized microstrain model (Stephens, Reference Stephens1999). The background was modeled using a six-term shifted Chebyshev polynomial, with a peak at 5.88° to model the scattering from the Kapton capillary and any amorphous component of the sample.
The final refinement (begun from the VASP-optimized structure described below) of 258 variables using 31,334 observations and 214 restraints yielded the residuals R wp = 0.1673 and GOF = 3.14. The largest peak (1.59 Å from C58) and hole (1.92 Å from F3) in the difference Fourier map were 0.59(13) and − 0.54(13) eÅ−3, respectively. The final Rietveld plot is shown in Figure 3. The largest features in the normalized error plot are in the intensities and shapes of low-angle peaks and an incomplete description of the background. A trace impurity may also be present.
The Rietveld plot for delamanid. The blue crosses represent the observed data points, and the green line represents the calculated pattern. The cyan curve indicates the normalized error plot, and the red line indicates the background curve. The row of blue tick marks indicates the calculated delamanid reflection positions. The vertical scale has been multiplied by a factor of 20× for 2θ > 9.0̊.

The crystal structure of delamanid was optimized (fixed experimental unit cell) with density functional theory techniques using VASP (Kresse and Furthmüller, Reference Kresse and Furthmüller1996) through the MedeA graphical interface (Materials Design, 2024). The calculation was carried out on 32 cores of a 144-core (768-GB memory) HPE Superdome Flex 280 Linux server at North Central College. The calculation used the GGA-PBE functional, a plane wave cutoff energy of 400.0 eV, and a k-point spacing of 0.2 Å−1, leading to a 1 × 3 × 6 mesh, and took ~34.5 days. Single-point density functional calculations (fixed experimental cell) and population analysis were carried out using CRYSTAL23 (Erba et al., Reference Erba, Desmarais, Casassa, Civalleri, Donà, Bush and Searle2023). The basis sets for the H, C, N, and O atoms in the calculation were those of Gatti et al. (Reference Gatti, Saunders and Roetti1994), and that for F was that of Peintinger et al. (Reference Peintinger, Vilela Oliveira and Bredow2013). The calculations were run on a 3.5-GHz PC using eight k-points and the B3LYP functional, and took ∼12.8 hours.
III. RESULTS AND DISCUSSION
The powder pattern of this study is similar enough to that reported by Duong et al. (Reference Duong, Nguyen and Taylor2022) to suggest that they represent the same material (Figure 4), and thus our sample is representative of crystalline delamanid. A trace of a crystalline impurity may be present.
Comparison of the synchrotron pattern of delamanid (black) to that reported by Duong et al. (Reference Duong, Nguyen and Taylor2022) (green). The literature pattern (measured using Cu Kα radiation) was digitized using UN-SCAN-IT (Silk Scientific, 2013) and converted to the synchrotron wavelength of 0.458133(2) Å using JADE Pro (MDI, 2024). Image generated using JADE Pro (MDI, 2024).

The root-mean-square (rms) Cartesian displacement of the non-H atoms in the Rietveld-refined and VASP-optimized structure of molecule 1(the lower atom numbers; Figure 5) is 0.833 Å, and the rms displacement for molecule 2 is 0.692 Å (Figure 6). These values are outside the normal range for correct structures (van de Streek and Neumann, Reference van de Streek and Neumann2014). The large number of variables, the relatively limited data range, and the pseudosymmetry conspire to make this a very difficult problem. The asymmetric unit is illustrated in Figure 7. Some of the U iso refined to large values, suggesting the additional possibility of disorder. Since an ordered model is necessary for the density functional theory (DFT) optimization, we did not attempt to model disorder. The structure should be considered a proposed one, and we offer it in the hope that an improved model can be found. In the refined structure, there is a short intramolecular contact involving F41 of a trifluoromethyl group and the adjacent phenyl ring. This contact is relieved in the VASP-optimized structure. The remaining discussion will emphasize the VASP-optimized structure.
Comparison of the Rietveld-refined (red) and VASP-optimized (blue) structures of delamanid molecule 1. The root-mean-square Cartesian displacement is 0.833 Å. Image generated using Mercury (Macrae et al., Reference Macrae, Sovago, Cottrell, Galek, McCabe, Pidcock and Platings2020).

Comparison of the Rietveld-refined (red) and VASP-optimized (blue) structures of delamanid molecule 2. The root-mean-square Cartesian displacement is 0.692 Å. Image generated using Mercury (Macrae et al., Reference Macrae, Sovago, Cottrell, Galek, McCabe, Pidcock and Platings2020).

The asymmetric unit of delamanid, with the atom numbering. The atoms are represented by 50% probability spheroids. Image generated using Mercury (Macrae et al., Reference Macrae, Sovago, Cottrell, Galek, McCabe, Pidcock and Platings2020).

Most of the bond distances and bond angles fall within the normal ranges indicated by a Mercury Mogul Geometry check (Macrae et al., Reference Macrae, Sovago, Cottrell, Galek, McCabe, Pidcock and Platings2020). The C4–N24–C12 (140.6°; average = 135.6(12)°; Z-score = 4.1), C58–N49–C63 (141.1°; average = 135.6(12)°; Z-score = 4.5), and C65–C61–N48 (116.4°; average = 121.4(14)°; Z-score = 3.6) are flagged as unusual. The standard uncertainties on the averages are small, inflating the Z-scores. Torsion angles involving rotation about the O5–C32, O6–C28, O9–C37, C23–N10, O44–C59, O44–C66, O47–C75, C61–N48, and C59–C52 bonds are flagged as unusual. These lie on tails or in valleys of broad distributions, so the torsion angles are unusual but not unprecedented. The conformations of the molecules, especially around the ether oxygen atoms, are unusual.
There are two independent delamanid molecules, with different conformations (Figure 8). The rms Cartesian displacement is 1.085 Å. Quantum chemical geometry optimizations of the isolated molecules (DFT/B3LYP/6-31G*/water) using Spartan ’24 (Wavefunction, 2023) indicated that they are essentially identical in energy (ΔE = 0.009 kcal/mol). The global minimum-energy conformation is more similar to molecule 2 (rms displacement = 1.19 Å) but is only 0.1 kcal/mol lower in energy. The delamanid molecule is apparently very flexible, and intermolecular interactions determine the observed solid-state conformations.
Comparison of DFT-optimized delamanid molecule 1 (green) and molecule 2 (orange). The root-mean-square Cartesian displacement is 1.085 Å.

The crystal structure (Figure 9) consists of layers of delamanid molecules perpendicular to the a-axis. The imidazooxazole ring systems stack along the b-axis; the mean planes of the ring systems are approximately (1, 1, 0) and (−1, 1, 0). The trifluoromethyl groups make up the boundaries of the corrugated layers. The Mercury Aromatics Analyser indicates one moderate interaction with a distance of 4.50 Å, between the central phenyl ring of molecule 1 and the end ring of molecule 2, along with several weak interactions, with distances >5.79 Å. The shortest distances between the centroids of the imidazooxazole ring systems are 4.76 and 4.84 Å.
The crystal structure of delamanid, viewed down the c-axis. Image generated using Diamond (Crystal Impact, 2023).

Analysis of the contributions to the total crystal energy of the structure using the Forcite module of Materials Studio (Dassault Systèmes, 2023) indicated that angle and torsion distortion terms dominate the intramolecular energy. The intermolecular energy is dominated by electrostatic attractions, which in this force-field-based analysis include hydrogen bonds. The hydrogen bonds are better discussed using the results of the DFT calculation.
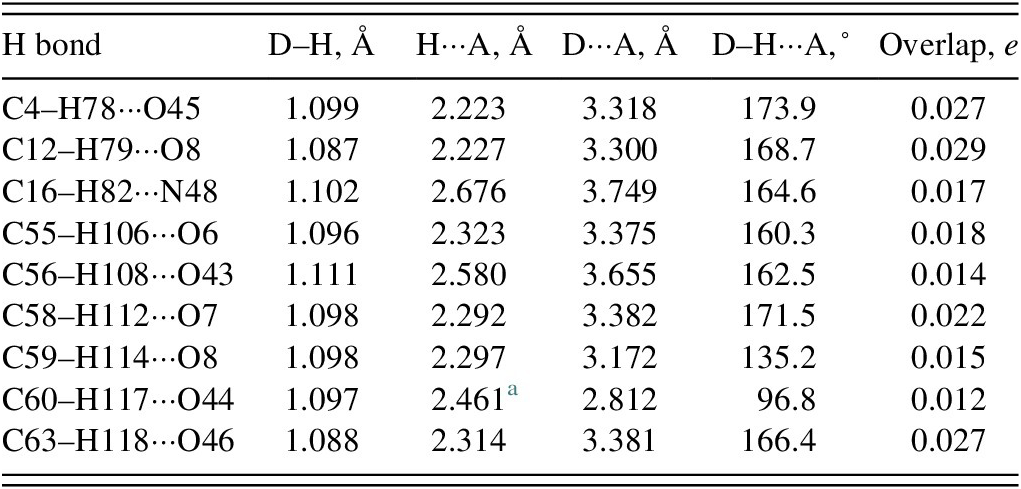
There are no classical hydrogen bonds in the crystal structure (Table I). Eight C–H···O and one C–H···N hydrogen bonds contribute to the lattice energy. Molecule 2 acts as a donor in more hydrogen bonds than molecule 1.
Hydrogen bonds (CRYSTAL23) in delamanid

a Intramolecular.
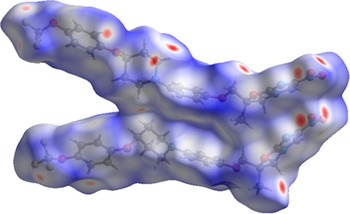
The volume enclosed by the Hirshfeld surface of delamanid (Figure 10; Hirshfeld, Reference Hirshfeld1977; Spackman et al., Reference Spackman, Turner, McKinnon, Wolff, Grimwood, Jayatilaka and Spackman2021) is 1,210.52 Å3, 98.85% of the unit cell volume. The packing density is thus fairly typical. The volume/non-hydrogen atom is smaller than normal at 16.1 Å3.
The Hirshfeld surface of delamanid. Intermolecular contacts longer than the sums of the van der Waals radii are colored blue, and contacts shorter than the sums of the radii are colored red. Contacts equal to the sums of radii are white. Image generated using CrystalExplorer (Spackman et al., Reference Spackman, Turner, McKinnon, Wolff, Grimwood, Jayatilaka and Spackman2021).

The Bravais–Friedel–Donnay–Harker (Bravais, Reference Bravais1866; Friedel, Reference Friedel1907; Donnay and Harker, Reference Donnay and Harker1937) algorithm suggests that we might expect platy morphology for delamanid (Figure 11), with {100} as the major faces, as expected from the extreme anisotropy of the lattice parameters. A sixth-order spherical harmonic model was included in the refinement. The texture index was 1.113(6), indicating that the preferred orientation was significant in this rotated capillary specimen.
The predicted platy Bravais–Friedel–Donnay–Harker morphology of delamanid. Image generated using Mercury (Macrae et al., Reference Macrae, Sovago, Cottrell, Galek, McCabe, Pidcock and Platings2020).

DEPOSITED DATA
The powder pattern of delamanid from a Le Bail fit of this synchrotron dataset has been submitted to the International Centre for Diffraction Data (ICDD) for inclusion in the Powder Diffraction File. The Crystallographic Information Framework (CIF) files containing the results of the Rietveld refinement (including the raw data) and the DFT geometry optimization were deposited with the ICDD. The data can be requested at pdj@icdd.com.
ACKNOWLEDGMENTS
We thank Saul Lapidus for his assistance in the data collection, and Christos Malliakas of Northwestern University and Jadupati Nag and Venkatraman Gopalan of The Pennsylvania State University for the measurement of the second-harmonic generation.
FUNDING STATEMENT
The use of the Advanced Photon Source at Argonne National Laboratory was supported by the U.S. Department of Energy, Office of Science, Office of Basic Energy Sciences, under Contract No. DE-AC02-06CH11357. This work was partially supported by the International Centre for Diffraction Data.
CONFLICTS OF INTEREST
The authors have no conflicts of interest to declare.




 Open access

