

1. Introduction
Motivation and context. We address the following fundamental question: given information on individual policyholder characteristics, how can we calculate insurance prices that do not discriminate with respect to protected characteristics, such as gender? This is a pertinent question in the context of anti-discrimination legislation; for instance, current EU law requires gender neutral insurance pricing, see European Council (2004). This question has become even more pronounced with the emergence of big data and associated developments in complex algorithmic models, since such models may be able to infer discriminatory characteristics from other policyholder features. For an overview on antidiscrimination laws, we refer to Avraham et al. (Reference Avraham, Logue and Schwarcz2014) and Prince and Schwarcz (Reference Prince and Schwarcz2019).
We aim at developing pricing formulas that are devoid of discrimination, while the insurer is still able to differentiate between policyholders with respect to nonprotected characteristics. Here, by “discrimination” we mean the provision of insurance prices that differentiate between policyholders on the basis of (legally) prohibited characteristics. For this, we assume that an insurer has access to policyholders’ data that can be split into discriminatory (e.g., gender, ethnicity) and nondiscriminatory characteristics (e.g., age, smoking habits). When we refer to discriminatory characteristics, we are relying on legal and regulatory requirements, such as those in the EU, which prohibit insurers from using certain characteristics within their pricing framework. In such a legal context, the use of protected characteristics amounts to illegal discrimination, thus creating an imperative for insurance pricing models to avoid using them. For example, within the EU, the council directive (European Council, 2004) provides definitions of direct and indirect discrimination, motivating our technical arguments.
Direct discrimination can be easily understood and identified as the use of prohibited characteristics as rating factors. Indirect discrimination presents more of a challenge, because it can be thought of as the confluence of two distinct effects: (a) the implicit ability to infer protected characteristics from other (legitimately used) policyholder features and (b) a systematic disadvantage resulting for a group that is protected by a nondiscrimination provision (Tobler, Reference Tobler2008). These two concepts are interrelated but distinct, the former, also referred to as proxy discrimination, arises from correlation between protected and unprotected characteristics; the latter, disparate impact, from correlations between protected characteristics and actual insurance prices – we refer to Frees and Huang (Reference Frees and Huang2021) for a detailed discussion from an actuarial perspective. The pricing adjustment we propose explicitly addresses (a) however such an adjustment may be legally unnecessary if (b) is not additionally present. Both these effects disappear when discriminatory characteristics are statistically independent of nondiscriminatory ones, though this observation does not imply that (a) and (b) are mathematically or conceptually equivalent.
The development of ideas in this paper is drawn from an actuarial rather than a legal perspective. We do not make any claim about their correspondence to legal definitions of discrimination in particular jurisdictions and do not argue that the pricing adjustment as proposed in this paper should be applied in all circumstances. Our focus is to provide an explicit mathematical method to remove indirect discrimination – if it happens to exist – from insurance pricing models. We begin our arguments on the assumption that certain characteristics have been prohibited and consider how pricing models can be adapted correspondingly. We say that
-
• A pricing model avoids direct discrimination, if none of the discriminatory features (characteristics) is used as a rating factor.
-
• A pricing model avoids indirect discrimination, if it avoids direct discrimination and, furthermore, the nondiscriminatory features are used in a way that does not allow implicit inference of discriminatory features from them.
To help clarify these concepts, we consider examples of directly and (potentially) indirectly discriminatory rating factors. In many jurisdictions, it is illegal to include the race/ethnicity of a policyholder within a pricing model, meaning that direct discrimination on the basis of race is illegal, even if race was (hypothetically) a good predictor of propensity to claim. There are other rating factors that are highly correlated with race, but which do not have much direct impact on the propensity to claim. For example, a policyholder’s native language is highly correlated with race in parts of the world where certain languages are spoken only by members of a particular race, and including this rating factor within a pricing model will do little but act as a proxy for race. Hence, including this rating factor may lead to what we term indirect discrimination in this work.
Then, there are rating factors that may be both directly predictive of insurance claims as well as act as proxies for discriminatory characteristics. For example, using the presence of diabetes as a rating factor will be directly predictive of health insurance costs, but since certain racial or ethnic groups may be predisposed to develop diabetes, including diabetes as a rating factor may lead to this rating factor acting as a proxy for race, potentially leading to indirect discrimination. Our aim in this paper is to develop a method that is capable of removing both direct and indirect discrimination from pricing models, where these may exist, while maintaining the predictive nature of variables that do not directly discriminate against protected characteristics. Thus, we emphasize that by avoiding indirect discrimination we do not mean to suggest removing all variables that may allow implicit inference of discriminatory features from the model (e.g., diabetes), but instead to ensure that these variables, while still remaining within the predictive model, do not act as proxies for discriminatory characteristics.
Finally, we stress that when we talk about “inferring discriminatory features,” we do not mean that an insurer necessarily has access to such data. Rather, such inference, as we will show in the sequel, takes place implicitly, via correlation between discriminatory and other features.
We illustrate indirect discrimination in the following example and will come back to this example in Section 2.2, below.
Example 1. Assume that we have observed a health insurance product and obtained the following claim counts $(n_{i,j})_{i,j = 0,1}$
and claim exposures
$(n_{i,j})_{i,j = 0,1}$
and claim exposures $(e_{i,j})_{i,j = 0,1}$
:
$(e_{i,j})_{i,j = 0,1}$
:

where $i = 1$
corresponds to “smoker” and
$i = 1$
corresponds to “smoker” and $j = 1$
corresponds to “woman”. Based on the above contingency tables, we estimate the claim frequencies
$j = 1$
corresponds to “woman”. Based on the above contingency tables, we estimate the claim frequencies $\lambda_{i,j}$
by the empirical frequency
$\lambda_{i,j}$
by the empirical frequency $\widehat\lambda_{i,j} = n_{i,j}/e_{i,j}$
. Assume now that gender is considered a discriminatory characteristic. In order to avoid direct discrimination, its explicit influence on the calculated insurance price needs to be removed. The standard way of doing this is to consider the aggregated estimators (row sums)
$\widehat\lambda_{i,j} = n_{i,j}/e_{i,j}$
. Assume now that gender is considered a discriminatory characteristic. In order to avoid direct discrimination, its explicit influence on the calculated insurance price needs to be removed. The standard way of doing this is to consider the aggregated estimators (row sums) $\widehat\lambda_{i, \bullet} = n_{i,\bullet} / e_{i,\bullet}=(n_{i,0}+n_{i,1})/(e_{i,0}+e_{i,1})$
. This approach produces, for example, for smokers,
$\widehat\lambda_{i, \bullet} = n_{i,\bullet} / e_{i,\bullet}=(n_{i,0}+n_{i,1})/(e_{i,0}+e_{i,1})$
. This approach produces, for example, for smokers,
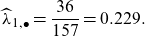 \[ \widehat\lambda_{1,\bullet} = \frac{36}{157} = 0.229.\]
The estimate $\widehat\lambda_{1,\bullet}$
(and a premium for smokers based on it), thus, can be calculated by completely ignoring policyholders’ gender information. But one can note that an alternative representation of
$\widehat\lambda_{1,\bullet}$
(and a premium for smokers based on it), thus, can be calculated by completely ignoring policyholders’ gender information. But one can note that an alternative representation of $\widehat\lambda_{1,\bullet}$
is
$\widehat\lambda_{1,\bullet}$
is
 \begin{align*}\widehat\lambda_{1,\bullet} &=\widehat \lambda_{1, 1}\frac{e_{1,1}}{e_{1,1}+e_{1,0}} + \widehat \lambda_{1, 0}\frac{e_{1,0}}{e_{1,1}+e_{1,0}}\\[6pt]
&= \widehat \lambda_{1, 1}\widehat{\mathbb{P}}(\mathrm{woman} \mid \mathrm{smoker}) + \widehat \lambda_{1, 0}\widehat{\mathbb{P}}(\mathrm{man} \mid \mathrm{smoker}),\end{align*}
\begin{align*}\widehat\lambda_{1,\bullet} &=\widehat \lambda_{1, 1}\frac{e_{1,1}}{e_{1,1}+e_{1,0}} + \widehat \lambda_{1, 0}\frac{e_{1,0}}{e_{1,1}+e_{1,0}}\\[6pt]
&= \widehat \lambda_{1, 1}\widehat{\mathbb{P}}(\mathrm{woman} \mid \mathrm{smoker}) + \widehat \lambda_{1, 0}\widehat{\mathbb{P}}(\mathrm{man} \mid \mathrm{smoker}),\end{align*}
where $\widehat{\mathbb{P}}$
refers to the empirical distribution obtained from the data. Hence, the estimate
$\widehat{\mathbb{P}}$
refers to the empirical distribution obtained from the data. Hence, the estimate $\widehat\lambda_{1,\bullet}$
not only contains information about the influence of smoking on producing a claim, but via the conditional probabilities
$\widehat\lambda_{1,\bullet}$
not only contains information about the influence of smoking on producing a claim, but via the conditional probabilities $\widehat{\mathbb{P}}(\mathrm{gender} \mid \mathrm{smoking\ habits})$
also about the propensity of smokers to be female or male. In our case, because smoking habits substantially differ between genders (a smoker is a woman with probability
$\widehat{\mathbb{P}}(\mathrm{gender} \mid \mathrm{smoking\ habits})$
also about the propensity of smokers to be female or male. In our case, because smoking habits substantially differ between genders (a smoker is a woman with probability $133/157=85\%$
, whereas a non-smoker is a woman with probability
$133/157=85\%$
, whereas a non-smoker is a woman with probability $131/432=30\%$
). It is indeed the case that the above approach exploits the correlation between gender and smoking habits, which may give rise to indirect discrimination against females in the case that claims frequencies for females are higher than males, as they indeed are here; we come back to this in Example 8, below.
$131/432=30\%$
). It is indeed the case that the above approach exploits the correlation between gender and smoking habits, which may give rise to indirect discrimination against females in the case that claims frequencies for females are higher than males, as they indeed are here; we come back to this in Example 8, below.
The numbers used in Example 1 are purely illustrative, though we note that the proportion of female smokers has been greater compared to the male population in for example, Sweden during the 2000s. A further discussion of implications of alternative statistical assumptions behind this example is given in Section 2.1, Remark 9. The example illustrates that avoiding direct discrimination does not necessarily entail also avoiding indirect discrimination. Consequently, just ignoring discriminatory features in the calculation of insurance prices does not generally yield discrimination-free prices. Hence, unawareness (or willful ignorance) of discriminatory features is not a solution to the problem of calculating discrimination-free insurance prices.
Finally, we are not arguing in this paper whether certain characteristics ought to be prohibited from a legal or ethical perspective. Indeed, there are varying views on this around the world; for example, gender is a permitted characteristic in insurance pricing in many jurisdictions outside of the EU. Also, there are circumstances, where apparently discriminatory characteristics may be used for pricing, if there is a “legitimate aim”; in the context of EU law see for example, Article 2(b) in European Council (2004). Furthermore, we do not aim to address insurance market and economic implications that may result from legally prohibiting the use of certain characteristics in insurance pricing. An example of such issues is potential “reverse discrimination,” meaning that pricing without using all policyholder characteristics may imply (unwanted) cross-subsidies between groups of policyholders, with this in turn leading to adverse selection and other undesirable side effects. Moreover, excluding some rating factors from statistical models typically leads to a decrease of predictive performance.
Our contributions. First, we embed the ideas of direct and indirect discrimination into a mathematical context. The ideas and principles we develop are relevant to all situations where predictors are calculated on the basis of conditional expected values and, hence, they are applicable in all fields where discrimination is an important issue, for example, also in customer credit rating. Second, we give a rigorous probabilistic account of discrimination-free prices and their existence. We propose a simple pricing formula that avoids both potential direct and indirect discrimination. This adjustment will always remove the potential for indirect discrimination from prices, regardless of whether such indirect discrimination is present or not. Furthermore, while the formula only uses nondiscriminatory features as rating factors, it introduces an adjustment, which requires knowledge of policyholders’ discriminatory features. Third, we justify discrimination-free prices using tools from causal inference. Fourth, we identify bias in aggregate portfolio prices as an unintended consequence of discrimination-free prices. While prices that can be written as conditional expectations under the physical probability measure naturally lead to an unbiased pricing system on a portfolio level, discrimination-free prices do not generally have this property. Therefore, we propose methods for bias correction. The bias corrections rely on the overall portfolio risk being assessed using all available characteristics, since it is only the step of allocating the overall price to individual contracts that potential discrimination can occur. Fifth, we illustrate how discrimination-free prices can be calculated in practice, using either machine learning algorithms or standard statistical methods like generalized linear models (GLMs).
Literature review. Although an issue of key relevance for insurance pricing, until recently relatively little attention has been paid to the issue of discrimination-free pricing within the actuarial literature. In a discussion of the implications of EU gender legislation, Guillén (Reference Guillén2012) suggests that covariates highly correlated with gender can be used as proxies by insurance companies, which from our perspective may result in indirect discrimination. Focusing on the case of mortality pricing, Chen and Vigna (Reference Chen and Vigna2017) criticize the industry practice of deriving unisex life tables by mixing the life tables for each gender on the grounds that this does not respect the principles of actuarial fairness, which is to say that the total unisex premiums charged for the portfolio are not equal to the total premiums charged using gender-specific life tables. They provide alternative approaches without this shortcoming; note that our proposed discrimination-free prices reproduce the pricing formulas of Chen and Vigna (Reference Chen and Vigna2017). The implications of unisex pricing on insurer capital requirements in the context of Solvency II are examined in Chen et al. (Reference Chen, Guillén and Vigna2018), and an ALM approach to unisex pricing is taken in Burszas et al. (Reference Bruszas, Kaschützke, Maurer and Siegelin2018), where also the concept of “gender mix risk” is discussed. Market implications of unisex tariffs are discussed in Sass and Seifried (Reference Sass and Seifried2014), see also De Jong and Ferris (Reference De Jong and Ferris2006) for a discussion of adverse selection stemming from restrictions on risk classification. A recent wide-ranging discussion of several issues connected with the topic of discrimination in insurance is found in Frees and Huang (Reference Frees and Huang2021), who also address the issue of indirect discrimination.
The issue of indirect discrimination occurring by ignoring discriminatory covariates has been discussed in Pope and Sydnor (Reference Pope and Sydnor2011) and Kusner et al. (Reference Kusner, Loftus, Russell and Silva2017). The procedure for discrimination-free pricing provided in Pope and Sydnor (Reference Pope and Sydnor2011) is essentially the same as in our proposal; this pricing rule is applied in the context of auto insurance pricing by Aseervatham et al. (Reference Aseervatham, Lex and Spindler2016). However, these authors do not provide a probabilistic justification for the prices used nor do they address the critical issue of a potential bias at portfolio level (and associated corrections).
We are aware of relatively few examples of causal inference applied within an insurance context. For renewals of insurance policies, some insurers seek to estimate policyholder demand elasticity by randomly varying renewal prices for a subset of policyholders (i.e., a form of randomized controlled trial is conducted) and estimating the impact on the probability of renewal. Once the demand elasticities have been estimated, a profit maximizing pricing policy can be established in a practice referred to as price optimization, see for example, Krikler et al. (Reference Krikler, Dolberger and Eckel2004). Within that context, Guelman and Guillén (Reference Guelman and Guillén2014) apply methods from causal inference to estimate demand elasticity functions from observational data collected by an insurer.
We emphasize that the issues discussed in this paper apply to many other industries; we refer to, for example, Fuster et al. (Reference Fuster, Goldsmith-Pinkham, Ramadorai and Walther2018) where a credit rating application is considered. Their study focuses on evaluating the differential impact of prediction technologies on ethnic groups, rather than on a mathematical definition of discrimination.
Organization of the paper. In Section 2, we discuss different kinds of insurance prices, comprising the best-estimate price, which considers all available information, the unawareness price, which avoids direct discrimination, and the discrimination-free price, which avoids both direct and indirect discrimination, whenever the latter exists. In particular, Subsection 2.3 gives mathematical descriptions of direct and indirect discrimination, which are based on a change of probability measure. Special cases of discrimination-free prices can be interpreted in terms of causal inference; this is discussed in Section 3. The bias that discrimination-free prices can induce at portfolio level is discussed in Section 4, along with proposals for bias mitigation. In Section 5, we describe the calculation of discrimination-free prices based on models estimated from data. This is explored in more detail in Section 6, where a numerical example is given, based on a synthetic health insurance portfolio. Concluding remarks are collected in Section 7.
2. Discrimination-free pricing
2.1. Definition of discrimination-free prices
We denote by $(\Omega, {\mathcal{F}}, {\mathbb{P}})$
the underlying probability space with physical probability measure
$(\Omega, {\mathcal{F}}, {\mathbb{P}})$
the underlying probability space with physical probability measure ${\mathbb{P}}$
. For a given portfolio of insurance policies, let
${\mathbb{P}}$
. For a given portfolio of insurance policies, let $\textbf{D}$
denote the vector of discriminatory covariates (characteristics, features, explanatory variables) of a policyholder, and let
$\textbf{D}$
denote the vector of discriminatory covariates (characteristics, features, explanatory variables) of a policyholder, and let $\textbf{X}$
denote the vector of nondiscriminatory covariates. This split into
$\textbf{X}$
denote the vector of nondiscriminatory covariates. This split into $\textbf{X}$
and
$\textbf{X}$
and $\textbf{D}$
is exogenous, provided by, for example, a legislator. Further, we assume that
$\textbf{D}$
is exogenous, provided by, for example, a legislator. Further, we assume that $\textbf{X}$
and
$\textbf{X}$
and $\textbf{D}$
are random vectors on
$\textbf{D}$
are random vectors on $(\Omega, {\mathcal{F}}, {\mathbb{P}})$
; the randomness of these covariate vectors represents variations between policyholders. A realization of
$(\Omega, {\mathcal{F}}, {\mathbb{P}})$
; the randomness of these covariate vectors represents variations between policyholders. A realization of $(\textbf{X},\textbf{D})$
corresponds to choosing an insurance policy at random from the portfolio; a policyholder profile with specific characteristics is obtained by conditioning on
$(\textbf{X},\textbf{D})$
corresponds to choosing an insurance policy at random from the portfolio; a policyholder profile with specific characteristics is obtained by conditioning on $\textbf{X}=\textbf{x}, \textbf{D}=\textbf{d}$
. For simplicity, we denote the marginal and conditional distributions of covariates under
$\textbf{X}=\textbf{x}, \textbf{D}=\textbf{d}$
. For simplicity, we denote the marginal and conditional distributions of covariates under ${\mathbb{P}}$
by
${\mathbb{P}}$
by $\textbf{X}\sim {\mathbb{P}}(\textbf{x}), \textbf{D}\sim {\mathbb{P}}(\textbf{d})$
and
$\textbf{X}\sim {\mathbb{P}}(\textbf{x}), \textbf{D}\sim {\mathbb{P}}(\textbf{d})$
and $(\textbf{D}\mid\textbf{X}=\textbf{x})\sim {\mathbb{P}}(\textbf{d}\mid\textbf{x})$
, respectively, thus, we use the same letter
$(\textbf{D}\mid\textbf{X}=\textbf{x})\sim {\mathbb{P}}(\textbf{d}\mid\textbf{x})$
, respectively, thus, we use the same letter ${\mathbb{P}}$
for the (conditional) distribution functions of
${\mathbb{P}}$
for the (conditional) distribution functions of $\textbf{X}$
and
$\textbf{X}$
and $\textbf{D}$
.
$\textbf{D}$
.
A policyholder claim is denoted by the random variable Y. The claim Y typically depends on (but is not fully determined by) both the discriminatory covariates $\textbf{D}$
and the nondiscriminatory ones
$\textbf{D}$
and the nondiscriminatory ones $\textbf{X}$
. Our aim is to price such a claim Y, with the resulting price being free from direct as well as indirect discrimination (where this exists), according to the arguments of Section 1. A technical description of these concepts will be given in Section 2.3, below.
$\textbf{X}$
. Our aim is to price such a claim Y, with the resulting price being free from direct as well as indirect discrimination (where this exists), according to the arguments of Section 1. A technical description of these concepts will be given in Section 2.3, below.
In the sequel, it will be useful to assume $Y,\textbf{X}, \textbf{D} \in {\mathcal{L}}^2(\Omega, {\mathcal{F}}, {\mathbb{P}})$
. This assumption is not crucial for defining discrimination-free prices, but it will allow us to give more intuitive interpretations in terms of orthogonal projections and minimal distances. Our notion of price will be based on conditional expectations of Y, when conditioning on different subsets of covariates. We first introduce a number of different prices that are important for the subsequent discussions and derivations.
$Y,\textbf{X}, \textbf{D} \in {\mathcal{L}}^2(\Omega, {\mathcal{F}}, {\mathbb{P}})$
. This assumption is not crucial for defining discrimination-free prices, but it will allow us to give more intuitive interpretations in terms of orthogonal projections and minimal distances. Our notion of price will be based on conditional expectations of Y, when conditioning on different subsets of covariates. We first introduce a number of different prices that are important for the subsequent discussions and derivations.
Definition 2 (best-estimate price). The best-estimate price for Y w.r.t. $(\textbf{X}, \textbf{D})$
is defined by
$(\textbf{X}, \textbf{D})$
is defined by
 \[\mu(\textbf{X}, \textbf{D}) \,:\!=\, {\mathbb{E}}[Y \mid \textbf{X}, \textbf{D}].\]
Remark 3.
-
(a) We call the price $\mu(\textbf{X}, \textbf{D})$
“best-estimate” because it minimizes the
${\mathcal{L}}^2$
-distance of all
$(\textbf{X}, \textbf{D})$
-measurable prices to Y, that is,
$\mu(\textbf{X}, \textbf{D})$
is the orthogonal projection of Y onto the sub-space generated by
$(\textbf{X}, \textbf{D})$
.
$\mu(\textbf{X}, \textbf{D})$
“best-estimate” because it minimizes the
${\mathcal{L}}^2$
-distance of all
$(\textbf{X}, \textbf{D})$
-measurable prices to Y, that is,
$\mu(\textbf{X}, \textbf{D})$
is the orthogonal projection of Y onto the sub-space generated by
$(\textbf{X}, \textbf{D})$
. -
(b) In general, the best-estimate price is not discrimination-free, unless we are in the special case of
$\mu(\textbf{X}, \textbf{D})=\mu(\textbf{X})$
, implied by
$\textbf{X}$
being independent of
$\textbf{D}$
. -
(c) The best-estimate price is unbiased w.r.t. Y, that is,
we use the tower property of conditional expectations, see Williams [26, Sec. 9.7]. Unbiasedness is important because it indicates that best-estimate prices achieve on average the correct price level for the portfolio.
\begin{equation*} \mu \,:\!=\, {\mathbb{E}}[Y] = {\mathbb{E}} \left[\mu(\textbf{X}, \textbf{D}) \right]; \end{equation*}


An initial attempt at achieving discrimination-free prices arises through simply ignoring discriminatory covariates $\textbf{D}$
.
$\textbf{D}$
.
Definition 4 (unawareness price). The unawareness price for Y w.r.t. $\textbf{X}$
is defined by
$\textbf{X}$
is defined by
 \begin{equation}\mu(\textbf{X}) \,:\!=\, {\mathbb{E}}[Y \mid \textbf{X}].\end{equation}
Remark 5.
-
(a) As the price
$\mu(\textbf{X})$
does not depend explicitly on
$\textbf{D}$
, it avoids direct discrimination. However, the unawareness price may produce indirect discrimination, as was discussed in Section 1; see also Kusner et al. (Reference Kusner, Loftus, Russell and Silva2017). Specifically, we can write the unawareness price as
(2.2)The potential for discrimination arises because the conditional probability
\begin{equation} \mu(\textbf{X}) =\int_\textbf{d} \mu(\textbf{X}, \textbf{d}) \ \, {\rm d}{\mathbb{P}}(\textbf{d} \mid \textbf{X}). \end{equation}
${\mathbb{P}}(\textbf{d} \mid \textbf{X})$
enables inference of discriminatory covariates
$\textbf{D}$
from nondiscriminatory ones
$\textbf{X}$
. We stress that discrimination here is indirect: while
$\textbf{D}$
is not directly used in the pricing formula, it is potentially “proxied” by
$\textbf{X}$
, if statistical dependence between
$\textbf{D}$
and
$\textbf{X}$
exists. This is precisely the situation discussed in Section 1. Indirect discrimination is avoided in the special case when
$\textbf{D}$
and
$\textbf{X}$
are independent, since then it holds that
${\rm d}{\mathbb{P}}(\textbf{d} \mid \textbf{X}) = {\rm d} {\mathbb{P}}(\textbf{d})$
.
-
(b) The price
$\mu(\textbf{X})$
minimizes the
${\mathcal{L}}^2$
-distance to Y based solely on
$\textbf{X}$
, that is, it is the best price w.r.t. information
$\textbf{X}$
. At the same time, the price
$\mu(\textbf{X})$
also minimizes the
${\mathcal{L}}^2$
-distance to
$\mu(\textbf{X}, \textbf{D})$
, by a simple application of the Pythagorean theorem. Note that
which intuitively should decrease with increasing dependence between
\[ || \mu(\textbf{X}) - \mu(\textbf{X}, \textbf{D}) ||_2^2= {\mathbb{E}}[{\operatorname{Var}}(\mu(\textbf{X}, \textbf{D}) \mid \textbf{X})],\]
$\textbf{X}$
and
$\textbf{D}$
. Hence, the quality in the approximation of
$\mu(\textbf{X},\textbf{D})$
using
$\mu(\textbf{X})$
should be good if
$\textbf{D}$
essentially is a deterministic function of
$\textbf{X}$
, that is, if the nondiscriminatory covariates
$\textbf{X}$
allow us to almost perfectly infer the discriminatory covariates
$\textbf{D}$
.
-
(c) The unawareness price is unbiased, since
\begin{equation*} \mu = {\mathbb{E}}[Y] = {\mathbb{E}} \left[\mu(\textbf{X}) \right]. \end{equation*}


We now propose a price that is free of both direct and indirect discrimination.
Definition 6 (discrimination-free price). A discrimination-free price for Y w.r.t. $\textbf{X}$
is defined by
$\textbf{X}$
is defined by
 \begin{align}h^*(\textbf{X}) \,:\!=\, \int_\textbf{d} \mu (\textbf{X}, \textbf{d})\ \, {\rm d}{\mathbb{P}}^*(\textbf{d}),\end{align}
where the distribution ${\mathbb{P}}^*(\textbf{d})$
is defined on the same range as the marginal distribution of the discriminatory variables
${\mathbb{P}}^*(\textbf{d})$
is defined on the same range as the marginal distribution of the discriminatory variables $\textbf{D}\sim {\mathbb{P}}(\textbf{d})$
.
$\textbf{D}\sim {\mathbb{P}}(\textbf{d})$
.
Remark 7.
-
(a) The discrimination-free price (2.3) is obtained by averaging best-estimate prices over discriminatory covariates, using a (potentially arbitrary) marginal distribution
${\mathbb{P}}^*(\textbf{d})$
. The crucial step here is the imposed marginalization w.r.t.
$\textbf{D}$
, rather than the specific choice of
${\mathbb{P}}^*(\textbf{d})$
(which can be
${\mathbb{P}}^*(\textbf{d}) = {\mathbb{P}}(\textbf{d}$
)). Given that the price
$h^*(\textbf{X})$
does not explicitly depend on
$\textbf{D}$
, it is obviously free from direct discrimination. We argue that the averaging construction proposed in (2.3) also removes all potential indirect discrimination. While (2.3) appears similar to (2.2), there is a key difference: discrimination-free prices do not in any way depend on the conditional distribution
${\mathbb{P}}(\textbf{d} \mid\textbf{X})$
– hence they do not use any inference of discriminatory covariates from nondiscriminatory ones. This will be further discussed in Section 2.3 and verified in the case study of Section 6. In the special case of
$\textbf{X}$
and
$\textbf{D}$
being independent and
${\mathbb{P}}^*(\textbf{d})={\mathbb{P}}(\textbf{d})$
, it follows that
$h^*(\textbf{X}) = \mu(\textbf{X})$
. -
(b) Definition 6 is designed to remove the possible explanatory power that
$\textbf{X}$
may have for
$\textbf{D}$
; it does not assume independence between
$\textbf{X}$
and
$\textbf{D}$
in the given portfolio. This point will be made more precise in Section 2.3, and in Section 2.4 we discuss existence of discrimination-free prices as well as alternative interpretations of
$h^*(\textbf{X})$
. -
(c) Definition 6 can also be motivated by arguments from causal inference. Specifically, formulas like (2.3) are used to quantify the direct causal effect of
$\textbf{X}$
on Y; we discuss this in more detail in Section 3, below. We stress that although causal inference can in many situations serve as an alternative motivation of discrimination-free prices, the reasoning behind our Definition 6 does not rely on any causal assumptions. Further discussions of this are provided in Section 3. Furthermore, formula (2.3) using the special choice
${\mathbb{P}}^*(\textbf{d})={\mathbb{P}}(\textbf{d})$
corresponds precisely to the partial dependence plot (PDP) introduced by Friedman (Reference Friedman2001), see also Zhao and Hastie (Reference Zhao and Hastie2021). -
(d) Prices obtained using (2.3) will in general not be unbiased, since
(2.4)even for the special choice
\begin{equation} \mu={\mathbb{E}}[Y] \neq {\mathbb{E}}[h^*(\textbf{X})] = \int_{\textbf{x},\textbf{d}} \mu(\textbf{x}, \textbf{d}) {\rm d}{\mathbb{P}}^*(\textbf{d}){\rm d}{\mathbb{P}}(\textbf{x}),\end{equation}
${\mathbb{P}}^*(\textbf{d}) = {\mathbb{P}}(\textbf{d})$
. This observation motivates portfolio level price adjustments, which will be discussed in Section 4. We note that, in actuarial practice, such a bias is not necessarily a problem, as insurers are primarily interested in the relativities between different policyholders, which can be used to differentiate a baseline premium of the overall portfolio costs to individual policyholders. Still, a poor allocation principle may result in adverse selection.
-
(e) Note that, given the potential arbitrariness of
${\mathbb{P}}^*$
, calculation of discrimination-free prices only requires knowledge of the mapping
$(\textbf{x},\textbf{d})\mapsto\mu(\textbf{x},\textbf{d})$
, where
$\mu(\textbf{x},\textbf{d})$
may be an (algorithmically derived implicit) regression function. Nevertheless, as pointed out in the previous remark, if one aims to correct a potential bias of
$h^*(\textbf{X})$
, it is necessary to perform modeling and model calibration under the “real-world” probability measure
${\mathbb{P}}$
. -
(f) Given the construction (2.3),
${\mathbb{P}}^*(\textbf{d})$
may be inferred from comparing best-estimate prices
$\mu(\textbf{X},\textbf{D})$
and observed discrimination-free prices
$h^*(\textbf{X})$
.


2.2. Choice of weighting distributions for discriminatory covariates
From Definition 6, it follows that the distribution ${\mathbb{P}}^*(\textbf{d})$
can be chosen rather freely. A simple choice is
${\mathbb{P}}^*(\textbf{d})$
can be chosen rather freely. A simple choice is ${\mathbb{P}}^*(\textbf{d})={\mathbb{P}}(\textbf{d})$
, that is, average in (2.3) w.r.t. the marginal distribution of the discriminatory characteristics in the portfolio. This choice is supported by causal inference arguments in Section 3. We denote this special case by
${\mathbb{P}}^*(\textbf{d})={\mathbb{P}}(\textbf{d})$
, that is, average in (2.3) w.r.t. the marginal distribution of the discriminatory characteristics in the portfolio. This choice is supported by causal inference arguments in Section 3. We denote this special case by
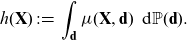 \begin{align}h(\textbf{X}) \,:\!=\, \int_\textbf{d} \mu(\textbf{X}, \textbf{d})\, \ {\rm d}{\mathbb{P}}(\textbf{d}).\end{align}
We illustrate how $h(\textbf{X})$
is evaluated in the context of Example 1.
$h(\textbf{X})$
is evaluated in the context of Example 1.
Example 8. In Example 1, we argued that aggregated estimators (row sums) $\widehat\lambda_{i,\bullet}$
are discriminatory because gender can be inferred from smoking habits. The price
$\widehat\lambda_{i,\bullet}$
are discriminatory because gender can be inferred from smoking habits. The price $h(\textbf{X})$
removes this effect by replacing the conditional probability
$h(\textbf{X})$
removes this effect by replacing the conditional probability ${\mathbb{P}}(\mathrm{gender} \mid \mathrm{smoking\ habits})$
by
${\mathbb{P}}(\mathrm{gender} \mid \mathrm{smoking\ habits})$
by ${\mathbb{P}}(\mathrm{gender})$
. This implies that the frequency estimate for smokers
${\mathbb{P}}(\mathrm{gender})$
. This implies that the frequency estimate for smokers $\widehat\lambda_{1, \bullet}$
is replaced by
$\widehat\lambda_{1, \bullet}$
is replaced by
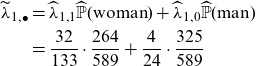 \begin{align}\nonumber \widetilde\lambda_{1, \bullet} &= \widehat \lambda_{1,1}\widehat{{\mathbb{P}}}(\mathrm{woman})+\widehat \lambda_{1,0}\widehat{{\mathbb{P}}}(\mathrm{man})\\ &= \frac{32}{133}\cdot \frac{264}{589}+ \frac{4}{24}\cdot \frac{325}{589}\end{align}
 \begin{align} &= 0.200 < 0.229=\widehat\lambda_{1, \bullet}. \nonumber \end{align}
Similarly, for non-smokers
 \begin{align} \widetilde\lambda_{0, \bullet} &= \widehat \lambda_{0,1}\widehat{{\mathbb{P}}}(\mathrm{woman})+\widehat \lambda_{0,0}\widehat{{\mathbb{P}}}(\mathrm{man})=0.184.\end{align}
We demonstrate the potential portfolio bias that discrimination-free prices induce. The total cost of the portfolio, under best-estimate prices, is equal to the observed total claim of 112. For discrimination-free prices, the total cost is given by
 \begin{align*} \widetilde\lambda_{1, \bullet} (e_{1,1}+e_{1,0}) + \widetilde\lambda_{0, \bullet} (e_{0,1}+e_{0,0})=110.77
< 112. \end{align*}
\begin{align*} \widetilde\lambda_{1, \bullet} (e_{1,1}+e_{1,0}) + \widetilde\lambda_{0, \bullet} (e_{0,1}+e_{0,0})=110.77
< 112. \end{align*}
This indicates that the discrimination-free price $h(\textbf{X})$
leads to an under-pricing of the overall portfolio in the present situation.
$h(\textbf{X})$
leads to an under-pricing of the overall portfolio in the present situation.
Recall that there is some flexibility in the selection of ${\mathbb{P}}^*(\textbf{d})$
. In this simple example, with
${\mathbb{P}}^*(\textbf{d})$
. In this simple example, with $\textbf{D}$
being a binary classification variable, we can directly choose
$\textbf{D}$
being a binary classification variable, we can directly choose ${\mathbb{P}}^*(\mathrm{woman})$
and
${\mathbb{P}}^*(\mathrm{woman})$
and ${\mathbb{P}}^*(\mathrm{man})$
in a way that eliminates the portfolio bias. Specifically, we set
${\mathbb{P}}^*(\mathrm{man})$
in a way that eliminates the portfolio bias. Specifically, we set
 \begin{align*} \widetilde\lambda^*_{i, \bullet} &= \widehat \lambda_{i,1}{{\mathbb{P}}^*}(\mathrm{woman})+\widehat \lambda_{i,0}{{\mathbb{P}}^*}(\mathrm{man}),\quad \text{ for $i=0,1$,}\end{align*}
and require for the resulting overall portfolio price that it holds
 \begin{align*} \widetilde\lambda^*_{1, \bullet} (e_{1,1}+e_{1,0}) + \widetilde\lambda^*_{0, \bullet} (e_{0,1}+e_{0,0})=112. \end{align*}
The resulting choice is ${\mathbb{P}}^*(\mathrm{woman})=48.3\%>44.8\%={\mathbb{P}}(\mathrm{woman})$
.
${\mathbb{P}}^*(\mathrm{woman})=48.3\%>44.8\%={\mathbb{P}}(\mathrm{woman})$
.
Finally, we note that in this example, switching to discrimination-free prices leads to a reduction in the share of the portfolio costs covered by women. Women cause $60/112=53.6\%$
of the total costs which is exactly the share of the total costs that women have to pay under best-estimate pricing (assuming that the prices coincide with the claims caused). If we use the unawareness price by simply dropping the gender variable, women cover
$60/112=53.6\%$
of the total costs which is exactly the share of the total costs that women have to pay under best-estimate pricing (assuming that the prices coincide with the claims caused). If we use the unawareness price by simply dropping the gender variable, women cover $47.8\%$
of the total costs. If we charge the discrimination-free price (2.6)-(2.7), women cover
$47.8\%$
of the total costs. If we charge the discrimination-free price (2.6)-(2.7), women cover $45.7\%$
of all costs, thus, less than under the unawareness price. This exactly reflects the potential for indirect discrimination in the unawareness price: women have on average higher costs than men, and the allocation of these excess costs is bigger to the sub-population where women are more prevalent compared to the population distribution
$45.7\%$
of all costs, thus, less than under the unawareness price. This exactly reflects the potential for indirect discrimination in the unawareness price: women have on average higher costs than men, and the allocation of these excess costs is bigger to the sub-population where women are more prevalent compared to the population distribution ${\mathbb{P}}(\textbf{d})$
, that is, we learn
${\mathbb{P}}(\textbf{d})$
, that is, we learn $\textbf{D}$
from
$\textbf{D}$
from $\textbf{X}$
through the portfolio distribution.
$\textbf{X}$
through the portfolio distribution.
Remark 9. While in Examples 1 and 8, the potential indirect discrimination was against women, one can easily swap the “woman” and “man” labels, so that such indirect discrimination is against males. This indicates that the notion of discrimination used here (as well as the proposed pricing adjustment) does not reflect (or indeed seek to correct for) historical or current injustices. A more subtle impact arises if, ceteris paribus, the frequency of smokers in the female population was actually lower than that for males. In such a case, unawareness prices would actually understate the impact of smoking, as this would be “masked” by males’ otherwise lower propensity to claim; on the contrary, discrimination-free prices would become more sensitive with respect to the specific risk posed by smoking. This idea is further developed in the detailed numerical example presented later in the paper; see last paragraph of Section 6.1 and Figure 3.
Furthermore, it is useful to consider the extrema of discrimination-free prices. Consider the following prices:
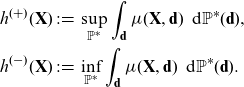 \begin{align*} h^{(+)}(\textbf{X}) &\,:\!=\, \sup_{{\mathbb{P}}^*}\int_\textbf{d} \mu (\textbf{X}, \textbf{d})\, \ {\rm d}{\mathbb{P}}^*(\textbf{d}),\\
h^{(-)}(\textbf{X}) &\,:\!=\, \inf_{{\mathbb{P}}^*}\int_\textbf{d} \mu (\textbf{X}, \textbf{d})\ \, {\rm d}{\mathbb{P}}^*(\textbf{d}).\end{align*}
\begin{align*} h^{(+)}(\textbf{X}) &\,:\!=\, \sup_{{\mathbb{P}}^*}\int_\textbf{d} \mu (\textbf{X}, \textbf{d})\, \ {\rm d}{\mathbb{P}}^*(\textbf{d}),\\
h^{(-)}(\textbf{X}) &\,:\!=\, \inf_{{\mathbb{P}}^*}\int_\textbf{d} \mu (\textbf{X}, \textbf{d})\ \, {\rm d}{\mathbb{P}}^*(\textbf{d}).\end{align*}
Here, $h^{(+)}(\textbf{X})$
and
$h^{(+)}(\textbf{X})$
and $h^{(-)}(\textbf{X})$
correspond to the essential supremum and infimum over
$h^{(-)}(\textbf{X})$
correspond to the essential supremum and infimum over $\textbf{d}$
in the range of
$\textbf{d}$
in the range of $\textbf{D}$
, respectively. Thus, for nondiscriminatory covariates
$\textbf{D}$
, respectively. Thus, for nondiscriminatory covariates $\textbf{X}=\textbf{x}$
, this immediately gives us
$\textbf{X}=\textbf{x}$
, this immediately gives us
 \[h^{(-)}(\textbf{x}) \le h^*(\textbf{x}), h(\textbf{x}) , \mu(\textbf{x}) \le h^{(+)}(\textbf{x}).\]
Moreover, for the bias property we get the following relationship
 \[\int_\textbf{x} h^{(-)}(\textbf{x}) {\rm d}{\mathbb{P}}(\textbf{x}) \le {\mathbb{E}}[h^*(\textbf{X})], \mu \le \int_\textbf{x} h^{(+)}(\textbf{x}) {\rm d}{\mathbb{P}}(\textbf{x}).\]
By definition $h^{(+)}(\textbf{x})$
corresponds to the “worst” (or most “prudent”) price and has been discussed in the context of unisex pricing in Chen and Vigna (Reference Chen and Vigna2017).
$h^{(+)}(\textbf{x})$
corresponds to the “worst” (or most “prudent”) price and has been discussed in the context of unisex pricing in Chen and Vigna (Reference Chen and Vigna2017).
As seen in Example 8, the discrimination-free price (2.3) is generally biased. An alternative possibility for the choice of ${\mathbb{P}}^*(\textbf{d})$
is to additionally require unbiasedness in (2.4). In the simple case of a binary discriminatory covariate like gender in Example 8, this reduced to choosing a suitable
${\mathbb{P}}^*(\textbf{d})$
is to additionally require unbiasedness in (2.4). In the simple case of a binary discriminatory covariate like gender in Example 8, this reduced to choosing a suitable ${\mathbb{P}}^*(\mathrm{woman})$
. A more general construction of unbiased prices via choices of
${\mathbb{P}}^*(\mathrm{woman})$
. A more general construction of unbiased prices via choices of ${\mathbb{P}}^*(\textbf{d})$
is presented in Section 4.
${\mathbb{P}}^*(\textbf{d})$
is presented in Section 4.
A special case corresponds to an additive best-estimate price, in the sense that $\mu(\textbf{X},\textbf{D})=\mu_1(\textbf{X})+\mu_2(\textbf{D})$
. Then, the simple choice
$\mu(\textbf{X},\textbf{D})=\mu_1(\textbf{X})+\mu_2(\textbf{D})$
. Then, the simple choice ${\mathbb{P}}^*(\textbf{d})={\mathbb{P}}(\textbf{d})$
is appealing, as it provides an unbiased price. Note that
${\mathbb{P}}^*(\textbf{d})={\mathbb{P}}(\textbf{d})$
is appealing, as it provides an unbiased price. Note that
 \begin{equation*} h(\textbf{X}) = \int_\textbf{d} \mu_1(\textbf{X})\ {\rm d}{\mathbb{P}}(\textbf{d})+\int_\textbf{d} \mu_2(\textbf{d})\ {\rm d}{\mathbb{P}}(\textbf{d}) =\mu_1(\textbf{X})+{\mathbb{E}}[\mu_2(\textbf{D})],\end{equation*}
which implies
 \begin{equation*} {\mathbb{E}}[h(\textbf{X})]={\mathbb{E}}[\mu_1(\textbf{X})]+{\mathbb{E}}[\mu_2(\textbf{D})] ={\mathbb{E}}[\mu(\textbf{X},\textbf{D})]=\mu.\end{equation*}
2.3. Revisiting direct and indirect discrimination
In this section, following the development of our ideas so far, we provide more technical definitions of prices that avoid direct and indirect discrimination, where the latter may exist.
Choose an arbitrary probability measure ${\mathbb{P}}^*$
on the measurable space
${\mathbb{P}}^*$
on the measurable space $(\Omega, {\mathcal{F}})$
such that
$(\Omega, {\mathcal{F}})$
such that $Y \in {\mathcal{L}}^1(\Omega, {\mathcal{F}}, {\mathbb{P}}^*)$
. Choose a (sub-)vector
$Y \in {\mathcal{L}}^1(\Omega, {\mathcal{F}}, {\mathbb{P}}^*)$
. Choose a (sub-)vector ${\textbf{Z}}$
of the covariates
${\textbf{Z}}$
of the covariates $(\textbf{X},\textbf{D})$
and define the
$(\textbf{X},\textbf{D})$
and define the $({\mathbb{P}}^*,{\textbf{Z}})$
-conditional-expectation price by
$({\mathbb{P}}^*,{\textbf{Z}})$
-conditional-expectation price by
 \begin{equation*} \mu^\ast({\textbf{Z}}) \,:\!=\, {\mathbb{E}}^* [Y \mid {\textbf{Z}}], \end{equation*}
where ${\mathbb{E}}^*$
denotes the expectation under
${\mathbb{E}}^*$
denotes the expectation under ${\mathbb{P}}^*$
.
${\mathbb{P}}^*$
.
Definition 10. A price avoids direct discrimination, if it can be written as
 \[\mu^*({\textbf{Z}})={\mathbb{E}}^{*}[Y\mid {\textbf{Z}}],\]
where ${\textbf{Z}}$
is
${\textbf{Z}}$
is $\sigma(\textbf{X})$
-measurable, and where the expectation is taken w.r.t. a probability measure
$\sigma(\textbf{X})$
-measurable, and where the expectation is taken w.r.t. a probability measure ${\mathbb{P}}^*$
on
${\mathbb{P}}^*$
on $(\Omega, {\mathcal{F}})$
such that
$(\Omega, {\mathcal{F}})$
such that $Y \in {\mathcal{L}}^1(\Omega, {\mathcal{F}}, {\mathbb{P}}^*)$
.
$Y \in {\mathcal{L}}^1(\Omega, {\mathcal{F}}, {\mathbb{P}}^*)$
.
Remark 11.
-
(a) Definition 10 says that a price avoids direct discrimination if it can be written as a measurable function of the nondiscriminatory covariates
$\textbf{X}$
. For
${\textbf{Z}}=\textbf{X}$
we receive maximal use of nondiscriminatory information (relative to
${\mathbb{P}}^*$
), therefore, we typically work with
${\textbf{Z}}=\textbf{X}$
. -
(b) The choice
${\mathbb{P}}^*={\mathbb{P}}$
(and
${\textbf{Z}}=\textbf{X}$
) provides the unawareness price
$\mu(\textbf{X})$
of Definition 4 which, thus, avoids direct discrimination. -
(c) Importantly, under the choice
${\mathbb{P}}^*={\mathbb{P}}$
, the unawareness price
$\mu(\textbf{X})$
can be calculated without explicit knowledge of
$\mu(\textbf{X},\textbf{D})$
– hence it does not require collection of discriminatory policyholder information. This also applies if we need to estimate
$\mu(\textbf{X})$
from data, see (5.3) below.


Now, indirect discrimination can be defined.
Definition 12. A price $\mu^*({\textbf{Z}})$
that avoids direct discrimination is said to avoid indirect discrimination if
$\mu^*({\textbf{Z}})$
that avoids direct discrimination is said to avoid indirect discrimination if ${\textbf{Z}}$
and
${\textbf{Z}}$
and $\textbf{D}$
are independent under
$\textbf{D}$
are independent under ${\mathbb{P}}^*$
.
${\mathbb{P}}^*$
.
Independence under ${\mathbb{P}}^*$
effects the decoupling of discriminatory covariates from nondiscriminatory ones, for specific policyholders. Thus, according to Definition 12, a price that avoids indirect discrimination satisfies
${\mathbb{P}}^*$
effects the decoupling of discriminatory covariates from nondiscriminatory ones, for specific policyholders. Thus, according to Definition 12, a price that avoids indirect discrimination satisfies
 \begin{equation}\mu^*({\textbf{Z}})= \int_\textbf{d} \mu^*({\textbf{Z}}, \textbf{d})\ \, {\rm d}{\mathbb{P}}^*(\textbf{d} \mid {\textbf{Z}}) = \int_\textbf{d} \mu^*({\textbf{Z}}, \textbf{d})\ \, {\rm d}{\mathbb{P}}^*(\textbf{d} ),\end{equation}
where $\mu^\ast({\textbf{Z}},\textbf{d}) = {\mathbb{E}}^* [Y \mid {\textbf{Z}},\textbf{D}=\textbf{d}]$
.
$\mu^\ast({\textbf{Z}},\textbf{d}) = {\mathbb{E}}^* [Y \mid {\textbf{Z}},\textbf{D}=\textbf{d}]$
.
Remark 13.
-
(a) From Definition 12, it is clear that avoiding indirect discrimination requires avoiding direct discrimination. As indirect discrimination relates to covariates in
$\textbf{X}$
acting as proxies for (elements of)
$\textbf{D}$
, it is not meaningful to talk about indirect discrimination, when
$\textbf{D}$
is used directly in pricing. -
(b) The independence in Definition 12 is an artifice of the introduced probability measure
${\mathbb{P}}^*$
under which insurance is priced and does not generally reflect the actual observed dependence between
$\textbf{X}$
and
$\textbf{D}$
. -
(c) For
${\textbf{Z}}=\textbf{X}$
, the calculation that avoids indirect discrimination is based on the knowledge of
$\mu^*(\textbf{X},\textbf{D})$
, see (2.8) – hence it requires collection of discriminatory policyholder information. In fact, one of the most critical problems in practice is that discriminatory information is often incomplete, for example, about ethnicity, which may result in indirect discrimination. -
(d) In statistical applications we usually use the conditional probability
${\mathbb{P}}(y\mid \textbf{X},\textbf{D})$
to model a claim Y, given the covariates
$(\textbf{X},\textbf{D})$
. The reason for this choice is that Y, given
$(\textbf{X},\textbf{D})$
, is observed under the real world measure
${\mathbb{P}}$
, which allows for direct estimation of the regression function, see Section 5 below,
We could choose the measure
\begin{equation*} (\textbf{x},\textbf{d}) \mapsto \mu(\textbf{x},\textbf{d}).\end{equation*}
${\mathbb{P}}^*$
in a way that preserves the (causal) structure of how the covariates impact the response, that is, let
${\mathbb{P}}^*(y\mid \textbf{x},\textbf{d})={\mathbb{P}}(y\mid \textbf{x},\textbf{d})$
. This then motivates the choice
for
\[{\rm d}{\mathbb{P}}^*(y,\textbf{x},\textbf{d})={\rm d}{\mathbb{P}}(y\mid \textbf{x},\textbf{d})\, {\rm d}{\mathbb{P}}^*(\textbf{x})\ \, {\rm d}{\mathbb{P}}^*(\textbf{d}),\]
${\textbf{Z}}=\textbf{X}$
in Definition 12. In view of (2.8), this results in the discrimination-free price
Thus, the discrimination-free price of Definition 6 does neither allow for potential direct nor for indirect discrimination.
\begin{equation*} \mu^*(\textbf{X})= \int_\textbf{d} \mu(\textbf{X}, \textbf{d})\, \ {\rm d}{\mathbb{P}}^*(\textbf{d} \mid \textbf{X}) = \int_\textbf{d} \mu(\textbf{X}, \textbf{d})\, \ {\rm d}{\mathbb{P}}^*(\textbf{d} )=h^*(\textbf{X}).\end{equation*}
-
(e) Linking to Remark 7(e), in practice, we need to know (calibrate under) the real world measure
${\mathbb{P}}$
in order to study unbiasedness w.r.t.
$\mu={\mathbb{E}}[Y]$
. Since the actual portfolio that we hold is described by
${\textbf{Z}}\sim{\mathbb{P}}({\textbf{z}})$
, we need to average discrimination-free prices
$\mu^*({\textbf{Z}})$
w.r.t. the same population
${\mathbb{P}}({\textbf{z}})$
to see whether we receive unbiasedness of discrimination-free prices on the actual portfolio.


2.4. Existence of discrimination-free prices
We have not yet discussed existence of discrimination-free prices according to Definition 6 and the possibility of avoiding indirect discrimination according to Definition 12. This is done in the present section.
We emphasize that properties of available data (and the related statistical models) play a crucial role in our considerations:
-
• Indirect discrimination may be the result of incomplete discriminatory information, see Remark 13(c).
-
• Indirect discrimination may be the result of nonexistent or insufficient information of certain parts of the population.
In this section, we discuss the second item that can enter in different ways. A first one is that not all parts of the population are equally well represented in the development of the statistical model. For instance, there is research in image recognition to discover malignant melanoma (skin cancer). If this research is mainly based on images of people with light complexion, the corresponding model will likely fail to discover malignant melanoma for people with dark complexion. This is a form of discrimination resulting from insufficient data of certain parts of the population. In our situation, this may result in poor best-estimate prices $\mu(\textbf{X}, \textbf{D})$
for certain covariate combinations. Note that the quality of the estimation of best-estimate prices directly impacts discrimination-free prices.
$\mu(\textbf{X}, \textbf{D})$
for certain covariate combinations. Note that the quality of the estimation of best-estimate prices directly impacts discrimination-free prices.
In the current section, we rather focus on nonexistent data of certain parts of the population. The meaning and implications of nonexistent data are going to be discussed in more detail. We start with an example. Assume that the discriminatory covariates $\textbf{D}$
correspond to gender and the nondiscriminatory ones
$\textbf{D}$
correspond to gender and the nondiscriminatory ones $\textbf{X}$
to education. Education could be in the ordinal form “secondary school degree,” “high school degree” or “university degree,” but information about education could also be received in the following categorical form “Catholic college degree,” “public college degree” or “girls college degree.” Per definition the last label “girls college degree” contains as only gender “female”. This implies that
$\textbf{X}$
to education. Education could be in the ordinal form “secondary school degree,” “high school degree” or “university degree,” but information about education could also be received in the following categorical form “Catholic college degree,” “public college degree” or “girls college degree.” Per definition the last label “girls college degree” contains as only gender “female”. This implies that
 \[{\mathbb{P}}(\textbf{X}=\mathrm{girls\ college\ degree}, \textbf{D}=\mathrm{man})=0,\]
thus, the event $A=\{\textbf{X}=\mathrm{girls\ college\ degree}, \textbf{D}=\mathrm{man}\} \in {\mathcal{F}}$
is a null set w.r.t.
$A=\{\textbf{X}=\mathrm{girls\ college\ degree}, \textbf{D}=\mathrm{man}\} \in {\mathcal{F}}$
is a null set w.r.t. ${\mathbb{P}}$
. In many cases, we do not model responses Y on null sets. Therefore, neither Y on A may be specified in our model nor the conditional expectation
${\mathbb{P}}$
. In many cases, we do not model responses Y on null sets. Therefore, neither Y on A may be specified in our model nor the conditional expectation $\mu(\mathrm{girls\ college\ degree}, \mathrm{man})={\mathbb{E}}[Y\mid A]$
may be determined. But this implies that we cannot evaluate the discrimination-free price
$\mu(\mathrm{girls\ college\ degree}, \mathrm{man})={\mathbb{E}}[Y\mid A]$
may be determined. But this implies that we cannot evaluate the discrimination-free price
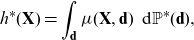 \begin{equation*}h^*(\textbf{X}) = \int_\textbf{d} \mu (\textbf{X}, \textbf{d})\, \ {\rm d}{\mathbb{P}}^*(\textbf{d}),\end{equation*}
if ${\mathbb{P}}^*(\textbf{d})$
has positive probability mass on both genders. In the current situation, the problem may be solved by setting
${\mathbb{P}}^*(\textbf{d})$
has positive probability mass on both genders. In the current situation, the problem may be solved by setting ${\mathbb{P}}^*(\textbf{D}=\mathrm{woman})=1$
which gives the discrimination-free price
${\mathbb{P}}^*(\textbf{D}=\mathrm{woman})=1$
which gives the discrimination-free price $h^*(\textbf{X}) = \mu (\textbf{X}, \mathrm{woman})$
.
$h^*(\textbf{X}) = \mu (\textbf{X}, \mathrm{woman})$
.
If the education information $\textbf{X}$
has an additional level “boys college degree”, the above solution will not work because we have a second
$\textbf{X}$
has an additional level “boys college degree”, the above solution will not work because we have a second ${\mathbb{P}}$
-null set
${\mathbb{P}}$
-null set $B=\{\textbf{X}=\mathrm{boys\ college\ degree}, \textbf{D}=\mathrm{woman}\} \in {\mathcal{F}}$
which makes it impossible to choose a distribution
$B=\{\textbf{X}=\mathrm{boys\ college\ degree}, \textbf{D}=\mathrm{woman}\} \in {\mathcal{F}}$
which makes it impossible to choose a distribution ${\mathbb{P}}^*(\textbf{d})$
such that the discrimination-free price
${\mathbb{P}}^*(\textbf{d})$
such that the discrimination-free price $h^*(\textbf{X})$
is well-defined.
$h^*(\textbf{X})$
is well-defined.
The simple solution to this problem is to drop the education information, that is, choose a smaller covariate set. This is equivalent to choosing a true subset ${\textbf{Z}}$
of
${\textbf{Z}}$
of $\textbf{X}$
in Definition 12. In practice, we often try to inter- or extrapolate the model assumptions for Y. This is reasonable if unavailable information corresponds to numerical variables (and responses have some smoothness in these covariates). In certain cases, it may also be justified for categorical variables by, for example, postulating a multiplicative influence structure of covariates, say, women are
$\textbf{X}$
in Definition 12. In practice, we often try to inter- or extrapolate the model assumptions for Y. This is reasonable if unavailable information corresponds to numerical variables (and responses have some smoothness in these covariates). In certain cases, it may also be justified for categorical variables by, for example, postulating a multiplicative influence structure of covariates, say, women are $x\%$
better than men regardless of the attended college. This is similar to a GLM approach where gender may be reflected by a single parameter on the canonical scale. In our situation such an assumption can be made, but it cannot be verified because of a missing control group.
$x\%$
better than men regardless of the attended college. This is similar to a GLM approach where gender may be reflected by a single parameter on the canonical scale. In our situation such an assumption can be made, but it cannot be verified because of a missing control group.
Proposition 14. Assume there exists a product measure ${\mathbb{P}}^*(\textbf{x}){\mathbb{P}}^*(\textbf{d})$
on
${\mathbb{P}}^*(\textbf{x}){\mathbb{P}}^*(\textbf{d})$
on $(\Omega, {\mathcal{F}})$
which is absolutely continuous w.r.t. the probability measure
$(\Omega, {\mathcal{F}})$
which is absolutely continuous w.r.t. the probability measure ${\mathbb{P}}(\textbf{x},\textbf{d})$
of the covariates
${\mathbb{P}}(\textbf{x},\textbf{d})$
of the covariates $(\textbf{X},\textbf{D})$
. Then, there exists a price
$(\textbf{X},\textbf{D})$
. Then, there exists a price $\mu^*(\textbf{X})$
that avoids indirect discrimination.
$\mu^*(\textbf{X})$
that avoids indirect discrimination.
Proof. Absolute continuity implies that every ${\mathbb{P}}(\textbf{x},\textbf{d})$
-null set is also a
${\mathbb{P}}(\textbf{x},\textbf{d})$
-null set is also a ${\mathbb{P}}^*(\textbf{x}){\mathbb{P}}^*(\textbf{d})$
-null set. Therefore,
${\mathbb{P}}^*(\textbf{x}){\mathbb{P}}^*(\textbf{d})$
-null set. Therefore, $\mu(\textbf{X}, \textbf{D})$
is well-defined on all sets where
$\mu(\textbf{X}, \textbf{D})$
is well-defined on all sets where $(\textbf{X},\textbf{D})$
has positive
$(\textbf{X},\textbf{D})$
has positive ${\mathbb{P}}^*(\textbf{x}){\mathbb{P}}^*(\textbf{d})$
-probability mass. Since the latter is a product measure, we can calculate the discrimination-free price
${\mathbb{P}}^*(\textbf{x}){\mathbb{P}}^*(\textbf{d})$
-probability mass. Since the latter is a product measure, we can calculate the discrimination-free price $h^*(\textbf{X})$
by integrating
$h^*(\textbf{X})$
by integrating $\mu(\textbf{X}, \textbf{d})$
over
$\mu(\textbf{X}, \textbf{d})$
over ${\rm d}{\mathbb{P}}^*(\textbf{d} \mid \textbf{X})= {\rm d}{\mathbb{P}}^*(\textbf{d})$
, see also (2.8). This completes the proof.
${\rm d}{\mathbb{P}}^*(\textbf{d} \mid \textbf{X})= {\rm d}{\mathbb{P}}^*(\textbf{d})$
, see also (2.8). This completes the proof.
3. Causal inference and discrimination
The purpose of this section is to discuss the discrimination-free prices of Definition 6 in a causal inference setting. Discrimination-free prices given by Definition 6 hold without recourse to any causal relationships between variables. Nonetheless, there is a nice motivation of discrimination-free pricing in a causal inference context which provides additional insight. We give these arguments in a pedagogical and somewhat informal way; for a rigorous treatment we refer to Hernán and Robins (Reference Hernán and Robins2020), Pearl (Reference Pearl2009) and Pearl et al. (Reference Pearl, Glymour and Jewell2016), Ch.3.1).
The starting point of causal inference is a hypothesis of variable relationships, which may be described in terms of a directed graph $\mathfrak{G}$
. The graph
$\mathfrak{G}$
. The graph $\mathfrak{G}$
consists of a set of nodes corresponding to the different variables and directed edges – “arrows” – indicating directions of potential influence between the variables. This informal definition is most easily understood by an example such as the one given in Figure 1 (left), involving the variables
$\mathfrak{G}$
consists of a set of nodes corresponding to the different variables and directed edges – “arrows” – indicating directions of potential influence between the variables. This informal definition is most easily understood by an example such as the one given in Figure 1 (left), involving the variables $(Y,\textbf{X},\textbf{D})$
introduced above in the context of insurance pricing. The graph
$(Y,\textbf{X},\textbf{D})$
introduced above in the context of insurance pricing. The graph $\mathfrak{G}$
in Figure 1 (left) is an example of a directed acyclic graph (DAG), meaning that the graph does not contain any loops (for a precise definition, see [21, Chapter 1.4]). Figure 1 (left) corresponds to a situation where the discriminatory characteristics
$\mathfrak{G}$
in Figure 1 (left) is an example of a directed acyclic graph (DAG), meaning that the graph does not contain any loops (for a precise definition, see [21, Chapter 1.4]). Figure 1 (left) corresponds to a situation where the discriminatory characteristics $\textbf{D}$
may influence Y both directly, but also indirectly via
$\textbf{D}$
may influence Y both directly, but also indirectly via $\textbf{X}$
.
$\textbf{X}$
.
(left) Causal diagram described by $\mathfrak{G}$
; (right) causal diagram altered according to the intervention
$\mathfrak{G}$
; (right) causal diagram altered according to the intervention $\textbf{X} = \textbf{x}$
.
$\textbf{X} = \textbf{x}$
.
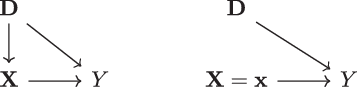
Figure 1 (left) already captures a large number of realistic insurance pricing situations. For instance, in view of Example 1, we may identify smoking habits by $\textbf{X}$
and the gender by the discriminatory factors
$\textbf{X}$
and the gender by the discriminatory factors $\textbf{D}$
. Differences in smoking habits between men and women can be expressed by a directed edge
$\textbf{D}$
. Differences in smoking habits between men and women can be expressed by a directed edge $\textbf{D} \rightarrow \textbf{X}$
, while intrinsic differences between men and women when it comes to health outcomes are described by
$\textbf{D} \rightarrow \textbf{X}$
, while intrinsic differences between men and women when it comes to health outcomes are described by $\textbf{D} \rightarrow Y$
. Moreover, smoking in itself may cause health problems,
$\textbf{D} \rightarrow Y$
. Moreover, smoking in itself may cause health problems, $\textbf{X} \rightarrow Y$
, this is exactly expressed by the directed edges in Figure 1 (left).
$\textbf{X} \rightarrow Y$
, this is exactly expressed by the directed edges in Figure 1 (left).
Since the directed edges in the DAG $\mathfrak{G}$
do not act fully deterministically, we endow
$\mathfrak{G}$
do not act fully deterministically, we endow $\mathfrak{G}$
with a probability measure
$\mathfrak{G}$
with a probability measure ${\mathbb{P}}$
that describes the randomness involved. Here, we consider a Markovian measure, which, colloquially speaking, means that all nodes in Figure 1 (left) are complemented with independent noisy background variables (Pearl et al., Reference Pearl, Glymour and Jewell2016, Chapter 3.2.1). In such a Markovian setting, let, for a general DAG
${\mathbb{P}}$
that describes the randomness involved. Here, we consider a Markovian measure, which, colloquially speaking, means that all nodes in Figure 1 (left) are complemented with independent noisy background variables (Pearl et al., Reference Pearl, Glymour and Jewell2016, Chapter 3.2.1). In such a Markovian setting, let, for a general DAG $\mathfrak{G}$
,
$\mathfrak{G}$
, ${\textbf{Z}} = (Z_1, \ldots, Z_p)$
be the vector containing all variables (e.g.,
${\textbf{Z}} = (Z_1, \ldots, Z_p)$
be the vector containing all variables (e.g., ${\textbf{Z}}=(Y,\textbf{X},\textbf{D})$
) and let
${\textbf{Z}}=(Y,\textbf{X},\textbf{D})$
) and let $\textbf V_i$
denote the set of “parent” variables of
$\textbf V_i$
denote the set of “parent” variables of $Z_i$
(that have a directed edge attached pointing directly to
$Z_i$
(that have a directed edge attached pointing directly to $Z_i$
). Furthermore, in this section, we denote by
$Z_i$
). Furthermore, in this section, we denote by $\mathbb{p}({\textbf{z}})$
the probability density or mass function of
$\mathbb{p}({\textbf{z}})$
the probability density or mass function of ${\textbf{Z}}$
. Then, on the Markovian DAG, it holds that (see e.g., Theorem 1 in Pearl (Reference Pearl2009))
${\textbf{Z}}$
. Then, on the Markovian DAG, it holds that (see e.g., Theorem 1 in Pearl (Reference Pearl2009))
 \begin{align} {\mathbb {p}}(z_1, \ldots, z_p) = \prod_i {\mathbb {p}}(z_i \mid \textbf v_i).\end{align}
In the simple example of Figure 1 (left), identity (3.1) leads to decomposition
 \[{\mathbb {p}}(y,\textbf{x},\textbf{d})={\mathbb {p}}(y\mid \textbf{x},\textbf{d}) {\mathbb {p}}(\textbf{x}\mid\textbf{d})\ \, {\mathbb {p}}(\textbf{d}),\]
which, of course, is nothing but Bayes’ rule.
With this modeling setup in place, one way to approach nondiscriminatory pricing is to ask the following:
-
Given that a policyholder has the set of characteristics
$\textbf{X}=\textbf{x}$
, what is the expected value of Y, after removing all causal, direct or indirect, effects of discriminatory covariates
$\textbf{D}$
?


In the context of causal inference, to answer such a question, we need to carry out a so-called intervention $\textbf{X}=\textbf{x}$
. An intervention amounts to “fixing”
$\textbf{X}=\textbf{x}$
. An intervention amounts to “fixing” $\textbf{X}$
to the particular value
$\textbf{X}$
to the particular value $\textbf{x}$
, which leads to impacts of
$\textbf{x}$
, which leads to impacts of $\textbf{X}$
on Y only via directed edges starting in
$\textbf{X}$
on Y only via directed edges starting in $\textbf{X}$
, and by removing all possible impacts on
$\textbf{X}$
, and by removing all possible impacts on $\textbf{X}$
from other variables. That is, the intervention will be executed without any influence from states of the other variables. This operation is illustrated on the right-hand side of Figure 1, where we remove all directed edges to
$\textbf{X}$
from other variables. That is, the intervention will be executed without any influence from states of the other variables. This operation is illustrated on the right-hand side of Figure 1, where we remove all directed edges to $\textbf{X}$
and set the value of
$\textbf{X}$
and set the value of $\textbf{X}$
to
$\textbf{X}$
to $\textbf{x}$
. Removing any potential edge from
$\textbf{x}$
. Removing any potential edge from $\textbf{D}$
to
$\textbf{D}$
to $\textbf{X}$
allows us to consider only the (direct) causal effect of setting
$\textbf{X}$
allows us to consider only the (direct) causal effect of setting $\textbf{X}=\textbf{x}$
on Y. This operation is intrinsically different to conditioning. When conditioning on
$\textbf{X}=\textbf{x}$
on Y. This operation is intrinsically different to conditioning. When conditioning on $\textbf{X}=\textbf{x}$
, the distribution of
$\textbf{X}=\textbf{x}$
, the distribution of $\textbf{D}$
is generally affected; but in the modified graph on the right-hand side of Figure 1, changes in
$\textbf{D}$
is generally affected; but in the modified graph on the right-hand side of Figure 1, changes in $\textbf{x}$
do not influence
$\textbf{x}$
do not influence $\textbf{D}$
and vice versa. This is precisely the desired effect of removing the implicit inference of discriminatory covariates from nondiscriminatory ones, in correspondence to Remark 13(b). The above intervention of removing all directed edges to
$\textbf{D}$
and vice versa. This is precisely the desired effect of removing the implicit inference of discriminatory covariates from nondiscriminatory ones, in correspondence to Remark 13(b). The above intervention of removing all directed edges to $\textbf{X}$
and of fixing
$\textbf{X}$
and of fixing $\textbf{X}=\textbf{x}$
is denoted by the so-called do-operator “
$\textbf{X}=\textbf{x}$
is denoted by the so-called do-operator “ $\mathrm{do}(\textbf{X}=\textbf{x})$
” in causal inference (Pearl et al., Reference Pearl, Glymour and Jewell2016, Chapter 3.2.1).
$\mathrm{do}(\textbf{X}=\textbf{x})$
” in causal inference (Pearl et al., Reference Pearl, Glymour and Jewell2016, Chapter 3.2.1).
In order to formalize the intervention $\operatorname{do}(\textbf{X} = \textbf{x})$
, let
$\operatorname{do}(\textbf{X} = \textbf{x})$
, let $\mathfrak{G}^*$
denote the modified DAG where all edges pointing to
$\mathfrak{G}^*$
denote the modified DAG where all edges pointing to $\textbf{X}$
have been removed, for example, as on the right-hand side of Figure 1. Next, we need to specify the probability measure operating on the graph
$\textbf{X}$
have been removed, for example, as on the right-hand side of Figure 1. Next, we need to specify the probability measure operating on the graph $\mathfrak{G}^*$
, which will not be the conditional measure
$\mathfrak{G}^*$
, which will not be the conditional measure ${\mathbb{P}}({\textbf{z}}\mid\textbf{x})$
. To that effect, let
${\mathbb{P}}({\textbf{z}}\mid\textbf{x})$
. To that effect, let $\mathcal{X}$
denote the indices in
$\mathcal{X}$
denote the indices in ${\textbf{Z}}$
corresponding to
${\textbf{Z}}$
corresponding to $\textbf{X}$
in a Markov DAG
$\textbf{X}$
in a Markov DAG $\mathfrak{G}$
, and let
$\mathfrak{G}$
, and let ${\textbf{Z}}^*$
be the vector consisting of all
${\textbf{Z}}^*$
be the vector consisting of all $Z_i, i \not\in \mathcal{X}$
. Then, on
$Z_i, i \not\in \mathcal{X}$
. Then, on $\mathfrak{G}^*$
, using (3.1),
$\mathfrak{G}^*$
, using (3.1), ${\mathbb {p}}_{\mathfrak{G}^*}$
must satisfy:
${\mathbb {p}}_{\mathfrak{G}^*}$
must satisfy:
 \begin{align} {\mathbb {p}}_{\mathfrak{G}^*}({\textbf{z}}^*, \textbf{x}) = {\mathbb {p}}_{\mathfrak{G}^*}( \textbf{x})\prod_{i \not\in \mathcal{X}} {\mathbb {p}}_{\mathfrak{G}^*}(z_i \mid \textbf v_i),\end{align}
since, on $\mathfrak{G}^*$
, the influence from parents of
$\mathfrak{G}^*$
, the influence from parents of $\textbf{X}$
has been removed. In particular, it follows that
$\textbf{X}$
has been removed. In particular, it follows that
 \[ {\mathbb {p}}_{\mathfrak{G}^*}({\textbf{z}}^* \mid \textbf{x}) = \prod_{i \not\in \mathcal{X}} {\mathbb {p}}_{\mathfrak{G}^*}(z_i \mid \textbf v_i).\]
Furthermore, since $\mathfrak{G}^*$
is a modified version of
$\mathfrak{G}^*$
is a modified version of $\mathfrak{G}$
where only those edges pointing to
$\mathfrak{G}$
where only those edges pointing to $\textbf{X}$
have been removed, it holds that
$\textbf{X}$
have been removed, it holds that ${\mathbb {p}}_{\mathfrak{G}^*}(z_i \mid \textbf v_i) = {\mathbb {p}} (z_i \mid \textbf v_i), i \notin \mathcal{X}$
, that is, the remaining causal relations have not been modified. Putting everything together, we arrive at the following definition of
${\mathbb {p}}_{\mathfrak{G}^*}(z_i \mid \textbf v_i) = {\mathbb {p}} (z_i \mid \textbf v_i), i \notin \mathcal{X}$
, that is, the remaining causal relations have not been modified. Putting everything together, we arrive at the following definition of $\operatorname{do}(\textbf{X} = \textbf{x})$
:
$\operatorname{do}(\textbf{X} = \textbf{x})$
:
 \begin{align} {\mathbb {p}}({\textbf{z}}^* \mid \operatorname{do}(\textbf{X} = \textbf{x})) \,:\!=\, {\mathbb {p}}_{\mathfrak{G}^*}({\textbf{z}}^* \mid \textbf{x}) = \prod_{i \not\in \mathcal{X}} {\mathbb {p}}(z_i \mid \textbf v_i),\end{align}
which is known as the truncated factorization formula, see for example, Corollary 1 in Pearl (Reference Pearl2009).
Returning to our example, set ${\textbf{Z}}^*=(Y,\textbf{D})$
. From (3.3) it directly follows that (since, in the modified graph
${\textbf{Z}}^*=(Y,\textbf{D})$
. From (3.3) it directly follows that (since, in the modified graph $\mathfrak{G}^*$
,
$\mathfrak{G}^*$
, $\textbf{D}$
has no parents)
$\textbf{D}$
has no parents)
 \[ {\mathbb {p}}(y, \textbf{d} \mid \operatorname{do}(\textbf{X} = \textbf{x})) = {\mathbb {p}}(y \mid \textbf{d}, \textbf{x})\, \ {\mathbb {p}}(\textbf{d}).\]
After marginalizing over $\textbf{d}$
, we then obtain the distribution of Y following the intervention
$\textbf{d}$
, we then obtain the distribution of Y following the intervention $\operatorname{do}(\textbf{X}=\textbf{x})$
:
$\operatorname{do}(\textbf{X}=\textbf{x})$
:
 \begin{equation} {\mathbb{P}}(y\mid \mathrm{do}(\textbf{X}=\textbf{x})) = \int_{\textbf{d}} {\mathbb{P}}(y\mid \textbf{x}, \textbf{d})\, \ {\rm d}{\mathbb{P}}(\textbf{d}).\end{equation}
Finally, one can define a price that only takes into account the causal effect of $\textbf{X}$
on Y by considering
$\textbf{X}$
on Y by considering $ {\mathbb{E}}[Y\mid \mathrm{do}(\textbf{X}=\textbf{x})],$
where the expectation is calculated with respect to
$ {\mathbb{E}}[Y\mid \mathrm{do}(\textbf{X}=\textbf{x})],$
where the expectation is calculated with respect to ${\mathbb{P}}(y\mid \mathrm{do}(\textbf{X}=\textbf{x}))$
. The next result is a direct consequence.
${\mathbb{P}}(y\mid \mathrm{do}(\textbf{X}=\textbf{x}))$
. The next result is a direct consequence.
Proposition 15. Consider the Markovian DAG $(\mathfrak{G}, {\mathbb{P}})$
defined by the left-hand side of Figure 1. It then holds that
$(\mathfrak{G}, {\mathbb{P}})$
defined by the left-hand side of Figure 1. It then holds that
 \[ {\mathbb{E}}[Y\mid \mathrm{do}(\textbf{X}=\textbf{x})] =\int_\textbf{d} \mu(\textbf{x}, \textbf{d})\, \ {\rm d}{\mathbb{P}}(\textbf{d})= h(\textbf{x}), \]
where $ h(\textbf{x})$
was defined by (2.5).
$ h(\textbf{x})$
was defined by (2.5).
Remark 16.
-
(a) Proposition 15 justifies the discrimination-free price
$h(\textbf{X})$
of Equation (2.5) under specific Markovian DAG assumptions, motivating the choice
${\mathbb{P}}^*(\textbf{d})={\mathbb{P}}(\textbf{d})$
in Definition 6. While we find the assumptions underlying Proposition 15 reasonable in an insurance context, violating those assumptions will undermine the causal interpretation of discrimination-free prices. Nonetheless, these assumptions are not needed in order for
$h(\textbf{X})$
to produce discrimination-free prices, in the spirit of Section 2.3, which “breaks” the statistical dependence between
$\textbf{X}$
and
$\textbf{D}$
. However, it is interesting to see that our discrimination-free pricing framework exactly corresponds to the do-operator “
$\mathrm{do}(\textbf{X}=\textbf{x})$
” in the causal inference setting of Figure 1. -
(b) It is possible to extend the covariate relations described by Figure 1 to more general situations, for instance, by including unmeasured characteristics (latent variable)
${\textbf{U}}$
. For ways to deal with these more general situations, we refer to Pearl et al. (Reference Pearl, Glymour and Jewell2016) and Lauritzen (Reference Lauritzen1996, Chapter 3.2.2).


4. Attribution of total portfolio premium to individual policies
The difficulty that we still have to deal with is that, in general, a discrimination-free price has a bias, see (2.4) and Example 8. This bias needs to be corrected because otherwise the premium for the entire portfolio may not be at the appropriate level. There is no canonical way of correcting for this potential bias; moreover, the requirement that the bias correction should be discrimination-free excludes complex cost allocation mechanisms.
The portfolio bias of the ${\mathbb{P}}^*$
-discrimination-free price is defined by
${\mathbb{P}}^*$
-discrimination-free price is defined by
 \[ B^*\,:\!=\, \mu- {\mathbb{E}}[h^*(\textbf{X})]={\mathbb{E}}[Y] - \int_{\textbf{x},\textbf{d}} \mu(\textbf{x}, \textbf{d})\, \ {\rm d}{\mathbb{P}}^*(\textbf{d})\, \ {\rm d}{\mathbb{P}}(\textbf{x}).\]
Simple bias corrections arise from taking rather different positions. An egalitarian position is taken by distributing the portfolio bias $B^*$
uniformly across the entire portfolio, regardless of any nondiscriminatory covariates
$B^*$
uniformly across the entire portfolio, regardless of any nondiscriminatory covariates $\textbf{X}$
. This motivates the uniformly adjusted
$\textbf{X}$
. This motivates the uniformly adjusted ${\mathbb{P}}^*$
-discrimination-free price defined by
${\mathbb{P}}^*$
-discrimination-free price defined by
 \begin{equation}\pi^{*,u}(\textbf{X}) \,:\!=\, h^*(\textbf{X}) + B^*.\end{equation}
Moreover, if we do not consider any covariates (neither discriminatory nor nondiscriminatory ones), we are back in the situation of a homogeneous situation where we charge the same (constant) premium $\mu$
to every policyholder. A drawback of the uniformly adjusted price (4.1) is that it may result in negative prices for certain covariate values
$\mu$
to every policyholder. A drawback of the uniformly adjusted price (4.1) is that it may result in negative prices for certain covariate values $\textbf{X}$
.
$\textbf{X}$
.
A different position is to allocate the bias $B^*$
by differentiating w.r.t.
$B^*$
by differentiating w.r.t. $\textbf{X}$
in a still discrimination-free fashion (avoiding any inference of
$\textbf{X}$
in a still discrimination-free fashion (avoiding any inference of $\textbf{D}$
from
$\textbf{D}$
from $\textbf{X}$
). A natural way is to allocate the total premium proportionally to
$\textbf{X}$
). A natural way is to allocate the total premium proportionally to $h^*(\textbf{X})$
, resulting in the proportionally adjusted
$h^*(\textbf{X})$
, resulting in the proportionally adjusted ${\mathbb{P}}^*$
-discrimination-free price
${\mathbb{P}}^*$
-discrimination-free price
 \begin{equation}\pi^{*,p}(\textbf{X}) \,:\!=\, h^*(\textbf{X}) \frac{\mu}{\mu-B^*}.\end{equation}
In the remainder of this section, we discuss a more sophisticated approach that chooses the distribution ${\mathbb{P}}^*(\textbf{d})$
specifically such that the discrimination-free price
${\mathbb{P}}^*(\textbf{d})$
specifically such that the discrimination-free price $h^*(\textbf{X})$
is unbiased, that is,
$h^*(\textbf{X})$
is unbiased, that is, $B^*=0$
. A simple illustration was given in Example 8. In general, there will be many such distributions that may satisfy this condition, and an additional criterion for choosing
$B^*=0$
. A simple illustration was given in Example 8. In general, there will be many such distributions that may satisfy this condition, and an additional criterion for choosing ${\mathbb{P}}^*(\textbf{d})$
is needed.
${\mathbb{P}}^*(\textbf{d})$
is needed.
A standard criterion is to chose the measure ${\mathbb{P}}^*$
, such that the distribution
${\mathbb{P}}^*$
, such that the distribution ${\mathbb{P}}^*(\textbf{d})$
is as close as possible to the physical distribution
${\mathbb{P}}^*(\textbf{d})$
is as close as possible to the physical distribution ${\mathbb{P}}(\textbf{d})$
, subject to the resulting discrimination-free price
${\mathbb{P}}(\textbf{d})$
, subject to the resulting discrimination-free price $h^*(\textbf{X})$
being unbiased. To proceed, first note that, given independence of
$h^*(\textbf{X})$
being unbiased. To proceed, first note that, given independence of $(\textbf{X},\textbf{D})$
under
$(\textbf{X},\textbf{D})$
under ${\mathbb{P}}^*$
, it holds that
${\mathbb{P}}^*$
, it holds that
 \[{\mathbb{E}}[h^*(\textbf{X})]={\mathbb{E}}^*[\zeta(\textbf{D})],\]
where $ \zeta(\textbf t) = {\mathbb{E}}[\mu(\textbf{X},\textbf t)].$
When the relative entropy (Kullback–Leibler divergence) is chosen to quantify distance between distributions, we work out
$ \zeta(\textbf t) = {\mathbb{E}}[\mu(\textbf{X},\textbf t)].$
When the relative entropy (Kullback–Leibler divergence) is chosen to quantify distance between distributions, we work out ${\mathbb{P}}^*(\textbf{d})$
as the solution to the following problem:
${\mathbb{P}}^*(\textbf{d})$
as the solution to the following problem:
 \begin{equation} \min_{\mathbb Q(\textbf{d})} {\mathbb{E}}\left[\frac{\rm d\mathbb Q(\textbf{d})}{\rm d{\mathbb{P}}(\textbf{d})}\log\left(\frac{\rm d\mathbb Q(\textbf{d})}{\rm d{\mathbb{P}}(\textbf{d})}\right)\right],\quad \text{such that}\quad {\mathbb{E}}^*[\zeta(\textbf{D})]=\mu.\end{equation}
Following standard results (see Breuer and Csiszár, Reference Breuer and Csiszár2013; Csiszár, Reference Csiszár1975) for precise statement and conditions), the solution takes the form:
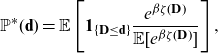 \begin{align*} {\mathbb{P}}^*(\textbf{d})&= {\mathbb{E}}\left[\textbf 1_{\{\textbf{D} \leq \textbf{d}\}} \frac{e^{\beta\zeta(\textbf{D})}}{{\mathbb{E}}[e^{\beta\zeta(\textbf{D})}]}\right],\end{align*}
where the parameter $\beta$
is suitably chosen such that the constraint
$\beta$
is suitably chosen such that the constraint ${\mathbb{E}}^*[\zeta(\textbf{D})]=\mu$
is fulfilled. Note that, in view of Section 2.4, we need to assume existence of distributions
${\mathbb{E}}^*[\zeta(\textbf{D})]=\mu$
is fulfilled. Note that, in view of Section 2.4, we need to assume existence of distributions ${\mathbb{P}}^*(\textbf{d})$
that fulfill the constraint in (4.3).
${\mathbb{P}}^*(\textbf{d})$
that fulfill the constraint in (4.3).
Hence, the premium for a policyholder with nondiscriminatory covariates $\textbf{X}=\textbf{x}$
is defined by
$\textbf{X}=\textbf{x}$
is defined by
 \begin{equation}\pi^{*,KL}(\textbf{x})\,:\!=\,h^*(\textbf{x}) = {\mathbb{E}}\left[\mu(\textbf{x},\textbf{D})\frac{e^{\beta\zeta(\textbf{D})}}{{\mathbb{E}}[e^{\beta\zeta(\textbf{D})}]} \right].\end{equation}
To ease the interpretation of this formula, let $\textbf{D}=D$
be one-dimensional and
$\textbf{D}=D$
be one-dimensional and $\mu(\textbf{x},d) \ge 0$
be increasing in d. Then, for
$\mu(\textbf{x},d) \ge 0$
be increasing in d. Then, for $\beta>0$
, we have
$\beta>0$
, we have
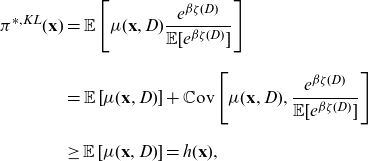 \begin{align*}\pi^{*,KL}(\textbf{x})&={\mathbb{E}}\left[\mu(\textbf{x},D) \frac{e^{\beta\zeta(D)}}{{\mathbb{E}}[e^{\beta\zeta(D)}]} \right]\\[8pt]
&={\mathbb{E}}\left[\mu(\textbf{x},D) \right]+\mathbb C\mathrm{ov}\left[\mu(\textbf{x},D),\frac{e^{\beta\zeta(D)}}{{\mathbb{E}}[e^{\beta\zeta(D)}]} \right]\\[8pt]
&\geq {\mathbb{E}}\left[\mu(\textbf{x},D) \right]=h(\textbf{x}),\end{align*}
\begin{align*}\pi^{*,KL}(\textbf{x})&={\mathbb{E}}\left[\mu(\textbf{x},D) \frac{e^{\beta\zeta(D)}}{{\mathbb{E}}[e^{\beta\zeta(D)}]} \right]\\[8pt]
&={\mathbb{E}}\left[\mu(\textbf{x},D) \right]+\mathbb C\mathrm{ov}\left[\mu(\textbf{x},D),\frac{e^{\beta\zeta(D)}}{{\mathbb{E}}[e^{\beta\zeta(D)}]} \right]\\[8pt]
&\geq {\mathbb{E}}\left[\mu(\textbf{x},D) \right]=h(\textbf{x}),\end{align*}
which corresponds to the situation where the choice ${\mathbb{P}}^*={\mathbb{P}}$
would produce a negative bias (under-pricing). The calculation of
${\mathbb{P}}^*={\mathbb{P}}$
would produce a negative bias (under-pricing). The calculation of $\pi^{*,KL}(\textbf{x})$
assigns a higher premium to policyholders with covariates
$\pi^{*,KL}(\textbf{x})$
assigns a higher premium to policyholders with covariates $\textbf{X}=\textbf{x}$
such that
$\textbf{X}=\textbf{x}$
such that $\mu(\textbf{x},D)$
is more volatile, as can be seen in approximation (4.5) below. This represents policies for which lack of information on discriminatory covariates matters more, in the sense that there is a higher sensitivity to the uncertainty induced by not using the discriminatory factor D. One can thus view the bias correction in
$\mu(\textbf{x},D)$
is more volatile, as can be seen in approximation (4.5) below. This represents policies for which lack of information on discriminatory covariates matters more, in the sense that there is a higher sensitivity to the uncertainty induced by not using the discriminatory factor D. One can thus view the bias correction in $\pi^{*,KL}(\textbf{x})$
as an implicit discrimination-free risk load.
$\pi^{*,KL}(\textbf{x})$
as an implicit discrimination-free risk load.
For $\beta$
close to zero, a Taylor series expansion of
$\beta$
close to zero, a Taylor series expansion of $\pi^{*,KL}(\textbf{x})$
gives the approximation
$\pi^{*,KL}(\textbf{x})$
gives the approximation
 \begin{align}h^*(\textbf{x}) &\approx {\mathbb{E}}\left[\mu(\textbf{x},\textbf{D})\right]+\beta \mathbb C\mathrm{ov} \left[\mu(\textbf{x},\textbf{D}),\zeta(\textbf{D})\right]\\[6pt]
&={\mathbb{E}}\left[\mu(\textbf{x},\textbf{D})\right]+\beta \sqrt{\mathbb V\mathrm{ar}[\mu(\textbf{x},\textbf{D})]\mathbb V\mathrm{ar}[\zeta(\textbf{D})]} \mathbb C\mathrm{orr} \left[\mu(\textbf{x},\textbf{D}),\zeta(\textbf{D})\right].\nonumber\end{align}
\begin{align}h^*(\textbf{x}) &\approx {\mathbb{E}}\left[\mu(\textbf{x},\textbf{D})\right]+\beta \mathbb C\mathrm{ov} \left[\mu(\textbf{x},\textbf{D}),\zeta(\textbf{D})\right]\\[6pt]
&={\mathbb{E}}\left[\mu(\textbf{x},\textbf{D})\right]+\beta \sqrt{\mathbb V\mathrm{ar}[\mu(\textbf{x},\textbf{D})]\mathbb V\mathrm{ar}[\zeta(\textbf{D})]} \mathbb C\mathrm{orr} \left[\mu(\textbf{x},\textbf{D}),\zeta(\textbf{D})\right].\nonumber\end{align}
5. Estimated prices
All previous discussion and derivations of discrimination-free prices and indirect discrimination were conducted under the assumption that the “true” probabilistic model underlying the portfolio $(Y,\textbf{X},\textbf{D})$
is known, represented by the physical measure
$(Y,\textbf{X},\textbf{D})$
is known, represented by the physical measure ${\mathbb{P}}$
. In practice, an estimated model is used because, typically, the data generating mechanism is unknown.
${\mathbb{P}}$
. In practice, an estimated model is used because, typically, the data generating mechanism is unknown.
Specifically, one starts from data
 \begin{equation*} {\mathcal{S}} =\{(y_1,\textbf{x}_1,\textbf{d}_1), \ldots, (y_n,\textbf{x}_n,\textbf{d}_n) \},\end{equation*}
assuming that $(y_i,\textbf{x}_i,\textbf{d}_i)$
are i.i.d. realisations of
$(y_i,\textbf{x}_i,\textbf{d}_i)$
are i.i.d. realisations of $(Y,\textbf{X},\textbf{D}) \sim {\mathbb{P}}$
. As the data are generated under
$(Y,\textbf{X},\textbf{D}) \sim {\mathbb{P}}$
. As the data are generated under ${\mathbb{P}}$
, we cannot estimate discrimination-free prices
${\mathbb{P}}$
, we cannot estimate discrimination-free prices $h^*(\textbf{X})$
directly under
$h^*(\textbf{X})$
directly under ${\mathbb{P}}^*$
. Instead, we need to estimate best-estimate prices first under
${\mathbb{P}}^*$
. Instead, we need to estimate best-estimate prices first under ${\mathbb{P}}$
, and then we can derive discrimination-free prices by averaging out
${\mathbb{P}}$
, and then we can derive discrimination-free prices by averaging out $\textbf{d}$
with respect to the chosen distribution
$\textbf{d}$
with respect to the chosen distribution ${\mathbb{P}}^*(\textbf{d})$
.
${\mathbb{P}}^*(\textbf{d})$
.
Consequently, a regression model (in the broader sense) is chosen
 \begin{equation} \widehat{\mu}: (\textbf{x},\textbf{d}) \mapsto \widehat{\mu}(\textbf{x},\textbf{d})=\widehat{\mu}(\textbf{x},\textbf{d};\boldsymbol\theta),\end{equation}
which typically differs from the (true) best-estimate price functional $(\textbf{x},\textbf{d})\mapsto \mu(\textbf{x},\textbf{d})$
, given in Definition 2, but which should mimic
$(\textbf{x},\textbf{d})\mapsto \mu(\textbf{x},\textbf{d})$
, given in Definition 2, but which should mimic $\mu(\textbf{x},\textbf{d})$
in the best possible way. One may specify a fixed functional form for
$\mu(\textbf{x},\textbf{d})$
in the best possible way. One may specify a fixed functional form for $\widehat{\mu}$
in (5.1) or, in a wider sense, one can specify an algorithm that generates the mapping (5.1) from the data
$\widehat{\mu}$
in (5.1) or, in a wider sense, one can specify an algorithm that generates the mapping (5.1) from the data ${\mathcal{S}}$
. In either case,
${\mathcal{S}}$
. In either case, $\widehat{\mu}$
will still depend on unknown parameters
$\widehat{\mu}$
will still depend on unknown parameters $\boldsymbol\theta$
that have to be estimated from the data
$\boldsymbol\theta$
that have to be estimated from the data ${\mathcal{S}}$
(using a given objective function) yielding estimate
${\mathcal{S}}$
(using a given objective function) yielding estimate $\widehat{\boldsymbol\theta}=\widehat{\boldsymbol\theta}({\mathcal{S}})$
.
$\widehat{\boldsymbol\theta}=\widehat{\boldsymbol\theta}({\mathcal{S}})$
.
The resulting ${\mathcal{S}}$
-calibrated regression function
${\mathcal{S}}$
-calibrated regression function
 \begin{equation} (\textbf{x},\textbf{d}) \mapsto \widehat{\mu}(\textbf{x},\textbf{d};\widehat{\boldsymbol\theta}),\end{equation}
then provides the approximation to the best-estimate price functional $(\textbf{x},\textbf{d})\mapsto \mu(\textbf{x},\textbf{d})$
. Note that (5.2) provides an estimate of the best-estimate price and, obviously, this estimate is, generally, discriminatory because it explicitly considers the discriminatory covariate values
$(\textbf{x},\textbf{d})\mapsto \mu(\textbf{x},\textbf{d})$
. Note that (5.2) provides an estimate of the best-estimate price and, obviously, this estimate is, generally, discriminatory because it explicitly considers the discriminatory covariate values $\textbf{d}$
. Moreover, since we use the data
$\textbf{d}$
. Moreover, since we use the data ${\mathcal{S}}$
which have been generated under the physical measure
${\mathcal{S}}$
which have been generated under the physical measure ${\mathbb{P}}$
, the regression function (5.2) also needs to be understood under the physical measure
${\mathbb{P}}$
, the regression function (5.2) also needs to be understood under the physical measure ${\mathbb{P}}$
, we refer to Remark 13(d).
${\mathbb{P}}$
, we refer to Remark 13(d).
The unawareness price functional $\textbf{x}\mapsto \mu(\textbf{x})$
can be approximated in an analogous manner by just dropping
$\textbf{x}\mapsto \mu(\textbf{x})$
can be approximated in an analogous manner by just dropping $\textbf{d}$
in (5.1) and (5.2), resulting in an estimated regression function
$\textbf{d}$
in (5.1) and (5.2), resulting in an estimated regression function
 \begin{equation} \textbf{x} \mapsto \bar{\mu}(\textbf{x};\widehat{\boldsymbol\vartheta}),\end{equation}
where the functional forms $\widehat{\mu}$
and
$\widehat{\mu}$
and $\bar{\mu}$
may differ as well as their parameters
$\bar{\mu}$
may differ as well as their parameters $\boldsymbol\theta$
and
$\boldsymbol\theta$
and $\boldsymbol\vartheta$
, respectively. We emphasize that typically
$\boldsymbol\vartheta$
, respectively. We emphasize that typically $\bar{\mu}(\cdot;\widehat{\boldsymbol\vartheta})$
may indirectly discriminate w.r.t.
$\bar{\mu}(\cdot;\widehat{\boldsymbol\vartheta})$
may indirectly discriminate w.r.t. $\textbf{d}$
because in the estimation process of
$\textbf{d}$
because in the estimation process of $\widehat{\boldsymbol\vartheta}$
, we implicitly use covariate combinations
$\widehat{\boldsymbol\vartheta}$
, we implicitly use covariate combinations $(\textbf{x}_i,\textbf{d}_i)$
which (empirically) contain the dependencies
$(\textbf{x}_i,\textbf{d}_i)$
which (empirically) contain the dependencies ${\mathbb{P}}(\textbf{d} \mid \textbf{x})$
that may allow for inference of
${\mathbb{P}}(\textbf{d} \mid \textbf{x})$
that may allow for inference of $\textbf{D}$
from
$\textbf{D}$
from $\textbf{X}$
. The estimated unawareness price
$\textbf{X}$
. The estimated unawareness price $\bar{\mu}(\textbf{x};\widehat{\boldsymbol\vartheta})$
can also be interpreted as an approximation to
$\bar{\mu}(\textbf{x};\widehat{\boldsymbol\vartheta})$
can also be interpreted as an approximation to
 \begin{equation*} {\mathbb{E}}[\widehat{\mu}(\textbf{X},\textbf{D};\widehat{\boldsymbol\theta})\mid \textbf{X}=\textbf{x}; {\mathcal{S}}], \end{equation*}
using the tower property of conditional expectations argument for $\textbf{D}$
(under the physical measure
$\textbf{D}$
(under the physical measure ${\mathbb{P}}$
).
${\mathbb{P}}$
).
Typically, also ${\mathbb{P}}(\textbf{d})$
is not known. Assuming
${\mathbb{P}}(\textbf{d})$
is not known. Assuming $\textbf{D}$
is discrete,
$\textbf{D}$
is discrete, ${\mathbb{P}}(\textbf{d})$
can be estimated by the empirical probabilities
${\mathbb{P}}(\textbf{d})$
can be estimated by the empirical probabilities ${n_\textbf{d}}/{n}$
(observed relative frequency of the discriminatory covariate
${n_\textbf{d}}/{n}$
(observed relative frequency of the discriminatory covariate $\textbf{d}$
in
$\textbf{d}$
in ${\mathcal{S}}$
). This generates the discrimination-free price
${\mathcal{S}}$
). This generates the discrimination-free price
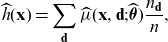 \begin{equation}\widehat{h}(\textbf{x}) = \sum_\textbf{d} \widehat{\mu}(\textbf{x}, \textbf{d}; \widehat{\boldsymbol\theta})\frac{n_\textbf{d}}{n},\end{equation}
where we use the estimated best-estimate price functional (5.2); if $\textbf{D}$
is continuous, we would use its empirical distribution function, which results in a discrete formula similar to (5.4). The price (5.4) is discrimination-free in the sense of Definition 6, that is, the discrimination-free property is not affected by the fact that we work with an estimated model. While potential estimation error may result in prices
$\textbf{D}$
is continuous, we would use its empirical distribution function, which results in a discrete formula similar to (5.4). The price (5.4) is discrimination-free in the sense of Definition 6, that is, the discrimination-free property is not affected by the fact that we work with an estimated model. While potential estimation error may result in prices $\widehat{h} (\textbf{x})$
that are not very close to
$\widehat{h} (\textbf{x})$
that are not very close to ${h}(\textbf{x})$
, the property of nondiscrimination is preserved within the selected model; we explore this in more detail in Section 6. When choosing the structure of the regression function
${h}(\textbf{x})$
, the property of nondiscrimination is preserved within the selected model; we explore this in more detail in Section 6. When choosing the structure of the regression function $\widehat{\mu}$
in (5.1), we should require existence of the discrimination-free price (5.4) in the sense of Proposition 14.
$\widehat{\mu}$
in (5.1), we should require existence of the discrimination-free price (5.4) in the sense of Proposition 14.
Finally, we note that one may attempt, in the light of Section 3, to estimate a graphical model (see e.g., Hernán and Robins, (Reference Hernán and Robins2020)), which would provide discrimination-free prices in a more direct way. However, we do not pursue this direction for two reasons. First, because actuarial pricing models typically comprise a large number of covariates (e.g., more than 50 is typical for direct motor insurance pricing), which could make construction, estimation, and validation of an appropriate graphical model challenging. Second, we do not make any claim about causality in the context of specific actuarial applications; we merely note that our proposal is in line with concepts from causal inference, if particular conditions are fulfilled.
6. Numerical illustration
6.1. Model and alternative pricing rules
We present a simple health insurance example that demonstrates our approach of discrimination-free insurance pricing. This example satisfies the causal relations of Figure 1 and, thus, it can also be understood in a causal inference context.
Let $\textbf{D} = D$
correspond to the single discriminatory characteristic “gender”, that is,
$\textbf{D} = D$
correspond to the single discriminatory characteristic “gender”, that is, $D \in \{\text{woman}, \text{man}\}$
. Furthermore, let
$D \in \{\text{woman}, \text{man}\}$
. Furthermore, let $\textbf{X} = (X_1, X_2)'$
, where
$\textbf{X} = (X_1, X_2)'$
, where $X_1 \in \{15,\ldots, 80\}$
denotes the age of the policyholder, and
$X_1 \in \{15,\ldots, 80\}$
denotes the age of the policyholder, and $X_2\in \{\text{non-smoker}, \text{smoker}\}$
; below we assume that smoking habits are gender related. We consider three different types of health costs: birthing-related health costs only affecting women between ages 20 and 40 (type 1), cancer-related health costs with a higher frequency for smokers and also for women (type 2), and health costs due to other disabilities (type 3). For simplicity, we only consider claim counts, assuming deterministic claim costs for the three different claim types. We assume independence between individuals, all having the same exposure (
$X_2\in \{\text{non-smoker}, \text{smoker}\}$
; below we assume that smoking habits are gender related. We consider three different types of health costs: birthing-related health costs only affecting women between ages 20 and 40 (type 1), cancer-related health costs with a higher frequency for smokers and also for women (type 2), and health costs due to other disabilities (type 3). For simplicity, we only consider claim counts, assuming deterministic claim costs for the three different claim types. We assume independence between individuals, all having the same exposure ( $=1$
). Moreover, we assume that the claim counts for the different claim types are described by independent Poisson GLMs with canonical (i.e., log-) link function. The three different types of claims are governed by the following log-frequencies (regression functions):
$=1$
). Moreover, we assume that the claim counts for the different claim types are described by independent Poisson GLMs with canonical (i.e., log-) link function. The three different types of claims are governed by the following log-frequencies (regression functions):
 \begin{align}\log \lambda_1(\textbf{X}, D) \,:\!=\,& \alpha_0 + \alpha_1 \, 1_{\{X_1 \in [20,40]\}}1_{\{D=\text{woman}\}},\end{align}
 \begin{align} \log \lambda_2(\textbf{X}, D) \,:\!=\,& \beta_0 + \beta_1X_1 + \beta_21_{\{X_2 = \text{smoker}\}} + \beta_3 \, 1_{\{D=\text{woman}\}},\end{align}
 \begin{align}\log \lambda_3(\textbf{X}, D) \,:\!=\,& \gamma_0 + \gamma_1 X_1, \end{align}
based on the joint nondiscriminatory and discriminatory covariates $(\textbf{X}, D)$
. The deterministic claim costs of the different claim types are given by
$(\textbf{X}, D)$
. The deterministic claim costs of the different claim types are given by $(c_1, c_2,c_3)=(0.5,0.9,0.1)$
for claims of type 1, type 2, and type 3, respectively.
$(c_1, c_2,c_3)=(0.5,0.9,0.1)$
for claims of type 1, type 2, and type 3, respectively.
The best-estimate price (considering all covariates) of Definition 2 is given by
 \[\mu(\textbf{X},D) = c_1 \lambda_1(\textbf{X}, D) + c_2\lambda_2(\textbf{X}, D) + c_3\lambda_3(\textbf{X}, D).\]
This best-estimate price is illustrated in Figure 2 for the parameter values $(\alpha_0, \alpha_1)= (-40, 38.5)$
,
$(\alpha_0, \alpha_1)= (-40, 38.5)$
, $(\beta_0, \beta_1,\beta_2,\beta_3)=( -2, 0.004, 0.1, 0.2)$
, and
$(\beta_0, \beta_1,\beta_2,\beta_3)=( -2, 0.004, 0.1, 0.2)$
, and $(\gamma_0, \gamma_1)= (-2, 0.01)$
. The plots on the left-hand side of Figure 2 refer to smokers
$(\gamma_0, \gamma_1)= (-2, 0.01)$
. The plots on the left-hand side of Figure 2 refer to smokers $(X_2=\text{smoker})$
, while those on the right-hand side to non-smokers
$(X_2=\text{smoker})$
, while those on the right-hand side to non-smokers $(X_2=\text{non-smoker})$
. The solid black lines give the best-estimate prices
$(X_2=\text{non-smoker})$
. The solid black lines give the best-estimate prices $\mu(\textbf{X},D)$
for women and the solid red lines for men. Obviously, by using D as a rating factor, these best-estimate prices discriminate between genders.
$\mu(\textbf{X},D)$
for women and the solid red lines for men. Obviously, by using D as a rating factor, these best-estimate prices discriminate between genders.
True model: (left) smokers and (right) non-smokers with solid black and red lines giving the best-estimate prices for women and men, respectively. The dotted orange lines show the discrimination-free prices and the dotted blue lines show the unawareness prices.
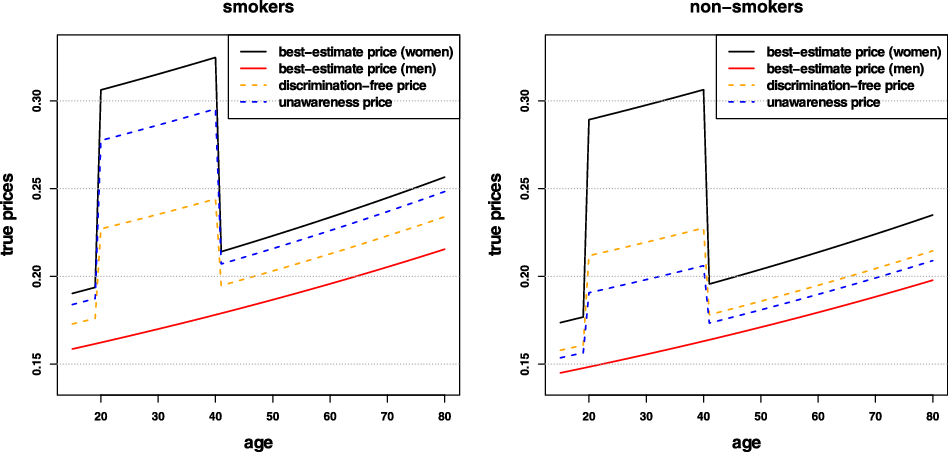
Next, we calculate the discrimination-free price of Definition 6 for ${\mathbb{P}}^*(d)={\mathbb{P}}(d)$
, see (2.5), motivated by Proposition 15. It is given by
${\mathbb{P}}^*(d)={\mathbb{P}}(d)$
, see (2.5), motivated by Proposition 15. It is given by
 \[h(\textbf{X})= \sum_{d \in \{\text{woman, man}\}}(c_1 \lambda_1(\textbf{X}, d) + c_2\lambda_2(\textbf{X}, d) + c_3\lambda_3(\textbf{X}, d)) {\mathbb{P}}(D=d).\]
For the calculation of this discrimination-free price, we need the gender proportions within our population. We set ${\mathbb{P}}(D = \text{woman}) = 0.45$
. The orange dotted lines in Figure 2 provide the resulting discrimination-free prices for smokers (left) and non-smokers (right). Note that these are identical for men and women, that is, all price differences can be described solely by different ages
${\mathbb{P}}(D = \text{woman}) = 0.45$
. The orange dotted lines in Figure 2 provide the resulting discrimination-free prices for smokers (left) and non-smokers (right). Note that these are identical for men and women, that is, all price differences can be described solely by different ages $X_1$
and smoking habits
$X_1$
and smoking habits $X_2$
, irrespective of gender D. Moreover, the smoking habits do not reveal information about the gender; note that in the exposition so far, it has not been necessary to describe how smoking habits vary by gender, that is, interpreted in a causal inference setting, we have not used any arrow
$X_2$
, irrespective of gender D. Moreover, the smoking habits do not reveal information about the gender; note that in the exposition so far, it has not been necessary to describe how smoking habits vary by gender, that is, interpreted in a causal inference setting, we have not used any arrow $D\to \textbf{X}$
, see Section 3.
$D\to \textbf{X}$
, see Section 3.
We compare this discrimination-free price to the unawareness price obtained by simply dropping the gender covariate D from the calculations (Definition 4). Thus, we calculate
 \begin{align*} \mu(\textbf{X})= c_1{\mathbb{E}}[\lambda_1(\textbf{X}, D)\mid \textbf{X}] + c_2{\mathbb{E}}[\lambda_2(\textbf{X}, D)\mid \textbf{X}] + c_3{\mathbb{E}}[\lambda_3(\textbf{X}, D)\mid \textbf{X}].\end{align*}
The calculation of the unawareness price requires additional information about the following conditional probabilities
 \begin{equation} {\mathbb{P}}(D=d\mid \textbf{X}=\textbf{x}) = \frac{{\mathbb{P}}(D=d, \textbf{X}=\textbf{x})}{{\mathbb{P}}(\textbf{X}=\textbf{x})}= \frac{{\mathbb{P}}(D=d, X_2=x_2)}{{\mathbb{P}}(X_2=x_2)},\end{equation}
the last equality making the assumption that the age variable $X_1$
is independent from the random vector
$X_1$
is independent from the random vector $(X_2,D)$
. In addition, we set
$(X_2,D)$
. In addition, we set ${\mathbb{P}}(D = \text{woman} \mid X_2 = \text{smoker})= 0.8$
and
${\mathbb{P}}(D = \text{woman} \mid X_2 = \text{smoker})= 0.8$
and ${\mathbb{P}}(X_2 = \text{smoker})= 0.3$
. The former assumption tells us that smokers are more likely women; this is similar to Example 1. As a consequence,
${\mathbb{P}}(X_2 = \text{smoker})= 0.3$
. The former assumption tells us that smokers are more likely women; this is similar to Example 1. As a consequence, $X_2$
has explanatory power to predict the gender D, and the unawareness price may therefore be indirectly discriminatory against women. These unawareness prices are illustrated by the blue dotted lines in Figure 2. The blue dotted line lies above the discrimination-free price (orange) for smokers (Figure 2, left) and below for non-smokers (right). Thus, the unawareness price implicitly allocates a higher price to women because smokers are more likely women in our example, or in other words, the portfolio distribution allows us to infer the more likely gender from smoking habits.
$X_2$
has explanatory power to predict the gender D, and the unawareness price may therefore be indirectly discriminatory against women. These unawareness prices are illustrated by the blue dotted lines in Figure 2. The blue dotted line lies above the discrimination-free price (orange) for smokers (Figure 2, left) and below for non-smokers (right). Thus, the unawareness price implicitly allocates a higher price to women because smokers are more likely women in our example, or in other words, the portfolio distribution allows us to infer the more likely gender from smoking habits.
True model: (left) smokers and (right) non-smokers with solid black and red lines giving the best-estimate prices for women and men, respectively. The dotted orange lines show the discrimination-free prices and the dotted green lines show the unawareness prices, for an alternative assumption on ${\mathbb{P}}(D = \text{woman} \mid \text{smoker})$
.
${\mathbb{P}}(D = \text{woman} \mid \text{smoker})$
.
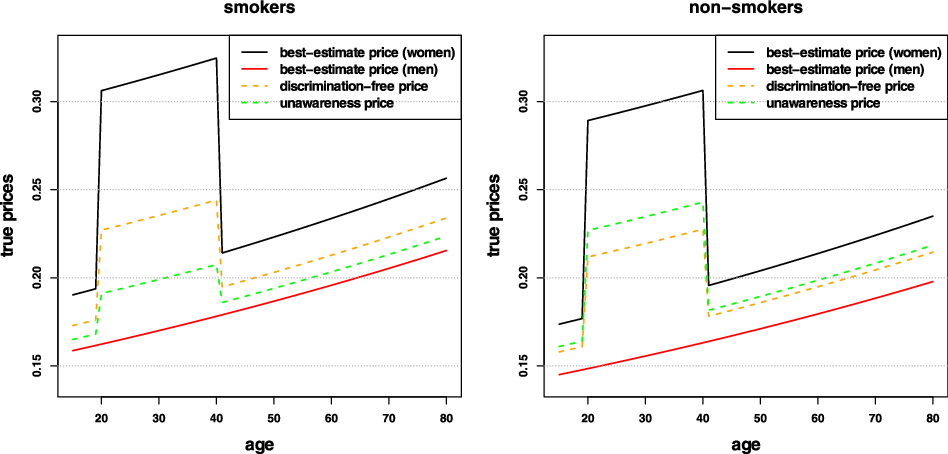
Since there is no particular reason to assume a population where the proportion of smokers is greater amongst women, the potential for indirect gender discrimination is easily verified by an alternative assumption, namely, that smokers are more likely men, say, ${\mathbb{P}}(D = \text{woman} \mid X_2 = \text{smoker})= 0.2$
. The resulting prices are plotted by the dotted green lines in Figure 3. We observe that unawareness prices for smokers are below the discrimination-free ones (orange dotted line), with the reverse holding for non-smokers. That is, in this case women may again be indirectly discriminated against through their (non-)smoking habits, serving as a proxy for the explanatory variable of gender. This scenario demonstrates that the adjustment underlying discrimination-free prices does not undermine the direct causal impact (in the sense of Section 3) of smoking on prices, given that under discrimination-free prices the price for smokers increases, compared to unawareness prices. In fact, when
${\mathbb{P}}(D = \text{woman} \mid X_2 = \text{smoker})= 0.2$
. The resulting prices are plotted by the dotted green lines in Figure 3. We observe that unawareness prices for smokers are below the discrimination-free ones (orange dotted line), with the reverse holding for non-smokers. That is, in this case women may again be indirectly discriminated against through their (non-)smoking habits, serving as a proxy for the explanatory variable of gender. This scenario demonstrates that the adjustment underlying discrimination-free prices does not undermine the direct causal impact (in the sense of Section 3) of smoking on prices, given that under discrimination-free prices the price for smokers increases, compared to unawareness prices. In fact, when ${\mathbb{P}}(D = \text{woman} \mid X_2 = \text{smoker})= 0.2$
, unawareness prices “mask” the impact of smoking. In other words, when smoking is allowed to act as a proxy for gender, the sensitivity of prices to smoking reduces. This is because, for smokers, the unawareness price includes the implicit inference that the policyholder is a man, who, other things being equal, is less likely to claim than a woman.
${\mathbb{P}}(D = \text{woman} \mid X_2 = \text{smoker})= 0.2$
, unawareness prices “mask” the impact of smoking. In other words, when smoking is allowed to act as a proxy for gender, the sensitivity of prices to smoking reduces. This is because, for smokers, the unawareness price includes the implicit inference that the policyholder is a man, who, other things being equal, is less likely to claim than a woman.
The break-even point is ${\mathbb{P}}(D = \text{woman} \mid X_2 = \text{smoker})= 0.45={\mathbb{P}}(D = \text{woman})$
because in this case D and
${\mathbb{P}}(D = \text{woman} \mid X_2 = \text{smoker})= 0.45={\mathbb{P}}(D = \text{woman})$
because in this case D and $X_2$
are independent, which prevents indirect discrimination through the portfolio distribution, and the unawareness price and the discrimination-free price are equal.
$X_2$
are independent, which prevents indirect discrimination through the portfolio distribution, and the unawareness price and the discrimination-free price are equal.
6.2. Application on estimated models
The previous discussion has been based on the knowledge of the model generating the data. We now address the more realistic situation where the model needs to be estimated. To this effect, we simulate data from $(\textbf{X},D,Y)\sim {\mathbb{P}}$
consistently with the given model assumptions, and subsequently calibrate a neural network regression model to the simulated data.
$(\textbf{X},D,Y)\sim {\mathbb{P}}$
consistently with the given model assumptions, and subsequently calibrate a neural network regression model to the simulated data.
Specifically, we choose a health insurance portfolio of size $n=100,000$
and simulate claim counts from the Poisson GLMs (6.1), (6.2), and (6.3), with the choice
$n=100,000$
and simulate claim counts from the Poisson GLMs (6.1), (6.2), and (6.3), with the choice ${\mathbb{P}}(D = \text{woman} \mid X_2 = \text{smoker})= 0.8$
. An age distribution for
${\mathbb{P}}(D = \text{woman} \mid X_2 = \text{smoker})= 0.8$
. An age distribution for $X_1$
is also needed for the simulation – the chosen probability weights are shown in Figure 4. We assume that age
$X_1$
is also needed for the simulation – the chosen probability weights are shown in Figure 4. We assume that age $X_1$
is independent from gender D and smoking habits
$X_1$
is independent from gender D and smoking habits $X_2$
, as in (6.4).
$X_2$
, as in (6.4).
Listing 1 gives an excerpt of the simulated data. We have the three covariates $X_1$
(age),
$X_1$
(age), $X_2$
(smoking habit), and D (gender) on lines 5–7, and lines 2–4 illustrate the numbers of claims
$X_2$
(smoking habit), and D (gender) on lines 5–7, and lines 2–4 illustrate the numbers of claims $N_1$
,
$N_1$
, $N_2$
, and
$N_2$
, and $N_3$
, separated by claim types. The proportion of women in this simulated data is 0.4505, which is close to the true value of
$N_3$
, separated by claim types. The proportion of women in this simulated data is 0.4505, which is close to the true value of ${\mathbb{P}}(D = \text{woman})=0.45$
. Our first aim is to fit a regression model to this data, under the assumptions that individual policies are independent, and that the different claim types are independent and Poisson distributed. Beside this, we do not make any structural assumption about the regression functions, but we try to infer them from the data using neural networks. The independence assumption between the claim counts
${\mathbb{P}}(D = \text{woman})=0.45$
. Our first aim is to fit a regression model to this data, under the assumptions that individual policies are independent, and that the different claim types are independent and Poisson distributed. Beside this, we do not make any structural assumption about the regression functions, but we try to infer them from the data using neural networks. The independence assumption between the claim counts $N_1$
,
$N_1$
, $N_2$
and
$N_2$
and $N_3$
motivates modeling them separately. Thus, we will fit three different neural networks to model
$N_3$
motivates modeling them separately. Thus, we will fit three different neural networks to model $\lambda_1$
,
$\lambda_1$
, $\lambda_2$
, and
$\lambda_2$
, and $\lambda_3$
, respectively. As we do not use any prior knowledge on the data generating process, we will feed all covariates
$\lambda_3$
, respectively. As we do not use any prior knowledge on the data generating process, we will feed all covariates $(X_1,X_2,D)$
to each of the three networks.
$(X_1,X_2,D)$
to each of the three networks.
The age frequency used for both genders and smoking habits to simulate the data.
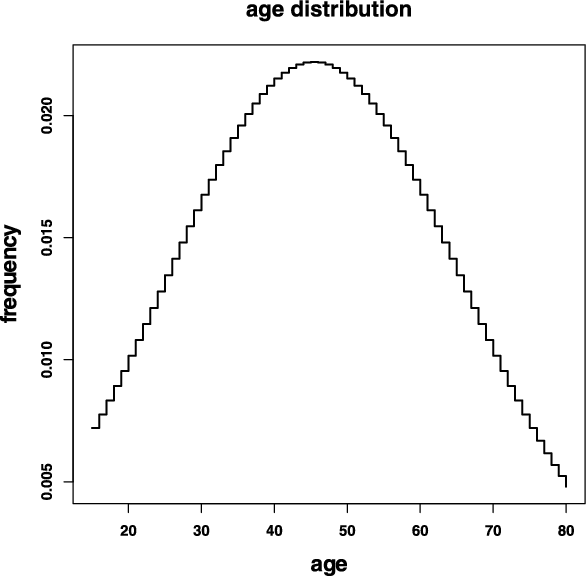
Simulated health insurance data.
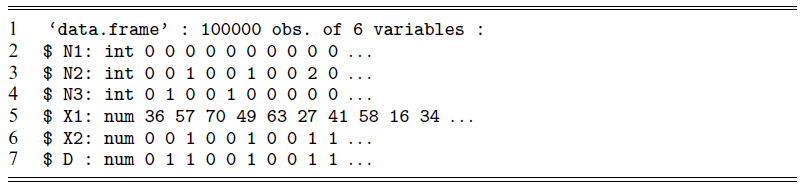
Neural network architecture used to infer $\lambda_1$
,
$\lambda_1$
, $\lambda_2$
and
$\lambda_2$
and $\lambda_3$
.
$\lambda_3$
.

Listing 2 illustrates the chosen neural network architecture, using the R library keras, with which the three regression functions (6.1)-(6.3) are estimated. We choose neural networks of depth 2 having 15 neurons in both hidden layers, the rectified linear unit (ReLU) activation function, and the canonical link under the Poisson assumption. Moreover, we select the Poisson deviance loss as our objective function. This network involves 316 weights that need to be calibrated. We train these weights of the three networks over 1000 epochs on batches of size 20,000.
Figure 5 illustrates the estimates $\widehat{\lambda}_1(\textbf{X},D)$
,
$\widehat{\lambda}_1(\textbf{X},D)$
, $\widehat{\lambda}_2(\textbf{X},D)$
, and
$\widehat{\lambda}_2(\textbf{X},D)$
, and $\widehat{\lambda}_3(\textbf{X},D)$
of the three regression functions (6.1), (6.2), and (6.3), respectively, obtained by fitting the three neural networks. The left-hand side of that figure gives claim type 1 which is birthing related. We see a rather accurate shape, with smoking habits correctly ignored and men not affected by these claims. Figure 5 (middle) gives the cancer related frequencies. Also here we receive the same order w.r.t. gender and smoking habits as in (6.2). Finally, the right-hand side illustrates all remaining claims. As, by (6.3) claim frequencies should not depend on gender and smoking habits, the variation between lines indicates that the regression model captures a spurious effect.
$\widehat{\lambda}_3(\textbf{X},D)$
of the three regression functions (6.1), (6.2), and (6.3), respectively, obtained by fitting the three neural networks. The left-hand side of that figure gives claim type 1 which is birthing related. We see a rather accurate shape, with smoking habits correctly ignored and men not affected by these claims. Figure 5 (middle) gives the cancer related frequencies. Also here we receive the same order w.r.t. gender and smoking habits as in (6.2). Finally, the right-hand side illustrates all remaining claims. As, by (6.3) claim frequencies should not depend on gender and smoking habits, the variation between lines indicates that the regression model captures a spurious effect.
Estimated regression functions $\widehat{\lambda}_1(\textbf{X},D)$
(left),
$\widehat{\lambda}_1(\textbf{X},D)$
(left), $\widehat{\lambda}_2(\textbf{X},D)$
(middle), and
$\widehat{\lambda}_2(\textbf{X},D)$
(middle), and $\widehat{\lambda}_3(\textbf{X},D)$
(right) using the neural network architecture of Listing 2.
$\widehat{\lambda}_3(\textbf{X},D)$
(right) using the neural network architecture of Listing 2.

Using these estimated frequencies, we calculate the estimated best-estimate price (5.2)
 \[ \widehat{\mu}(\textbf{X},D; \widehat{\boldsymbol\theta}) = c_1 \widehat{\lambda}_1(\textbf{X},D) + c_2\widehat{\lambda}_2(\textbf{X},D) + c_3\widehat{\lambda}_3(\textbf{X},D),\]
and its discrimination-free counterpart (5.4)
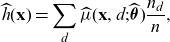 \[\widehat{h}(\textbf{x}) = \sum_d \widehat{\mu}(\textbf{x}, d; \widehat{\boldsymbol{\theta}})\frac{n_d}{n},\]
with empirical proportions $n_{\text{woman}}/n=1-n_{\text{man}}/n=0.4505$
. These prices are illustrated in Figure 6: black lines give best-estimate prices for women, red lines for men, and with the orange dotted lines showing the discrimination-free counterparts. Comparing Figures 2 and 6, we conclude that the resulting true prices and estimated prices are rather similar. Of course, by construction the resulting discrimination-free price is gender neutral within the estimated model, and in our case close to the theoretical one.
$n_{\text{woman}}/n=1-n_{\text{man}}/n=0.4505$
. These prices are illustrated in Figure 6: black lines give best-estimate prices for women, red lines for men, and with the orange dotted lines showing the discrimination-free counterparts. Comparing Figures 2 and 6, we conclude that the resulting true prices and estimated prices are rather similar. Of course, by construction the resulting discrimination-free price is gender neutral within the estimated model, and in our case close to the theoretical one.
Estimated neural network model: (left) smokers and (right) non-smokers with solid black and red lines giving the best-estimate prices for women and men, respectively. The dotted orange lines show the discrimination-free prices and the dotted blue lines show the unawareness prices.
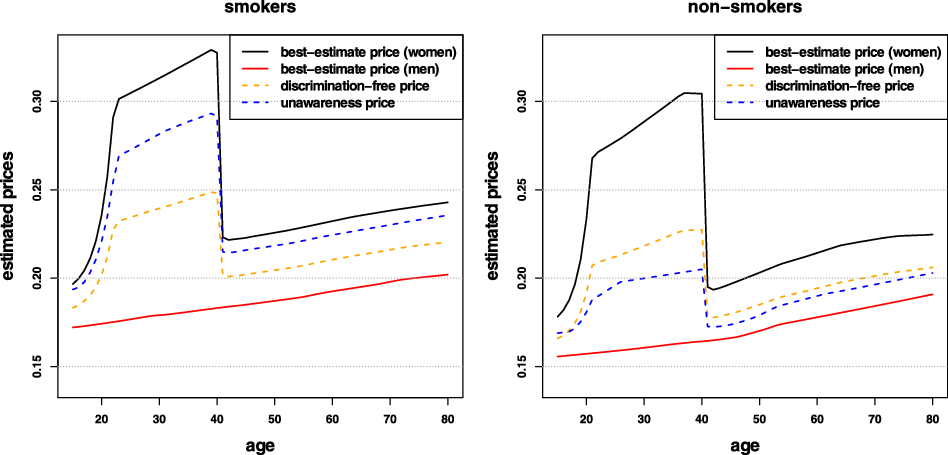
We indicate what happens if we drop the gender variable D from the very beginning, that is, if we train the networks only on the covariates $\textbf{X}=(X_1,X_2)$
as considered in (5.3). We choose exactly the same network architecture as in Listing 2 except that we modify the input dimension on lines 1 from 3 for
$\textbf{X}=(X_1,X_2)$
as considered in (5.3). We choose exactly the same network architecture as in Listing 2 except that we modify the input dimension on lines 1 from 3 for $(\textbf{X},D)$
to 2 for
$(\textbf{X},D)$
to 2 for $\textbf{X}$
. This network involves 301 weights that need to be trained. The resulting estimated regression functions
$\textbf{X}$
. This network involves 301 weights that need to be trained. The resulting estimated regression functions $\widehat{\lambda}_1(\textbf{X})$
,
$\widehat{\lambda}_1(\textbf{X})$
, $\widehat{\lambda}_2(\textbf{X})$
, and
$\widehat{\lambda}_2(\textbf{X})$
, and $\widehat{\lambda}_3(\textbf{X})$
, ignoring gender information D, are illustrated in Figure 7. The left-hand side shows that we can no longer distinguish between gender; however, smokers are more heavily punished for birthing related costs, which is an undesired indirect discrimination effect against women because they are more often among the group of smokers (note that the y-scales in Figures 5 and 7 are the same). Finally, merging the different claim types provides the estimated unawareness prices (when first dropping D) as illustrated by the blue dotted lines in Figure 6, which can be compared with the blue dotted lines in Figure 2.
$\widehat{\lambda}_3(\textbf{X})$
, ignoring gender information D, are illustrated in Figure 7. The left-hand side shows that we can no longer distinguish between gender; however, smokers are more heavily punished for birthing related costs, which is an undesired indirect discrimination effect against women because they are more often among the group of smokers (note that the y-scales in Figures 5 and 7 are the same). Finally, merging the different claim types provides the estimated unawareness prices (when first dropping D) as illustrated by the blue dotted lines in Figure 6, which can be compared with the blue dotted lines in Figure 2.
Estimated regression functions $\widehat{\lambda}_1(\textbf{X})$
(left),
$\widehat{\lambda}_1(\textbf{X})$
(left), $\widehat{\lambda}_2(\textbf{X})$
(middle), and
$\widehat{\lambda}_2(\textbf{X})$
(middle), and $\widehat{\lambda}_3(\textbf{X})$
(right) using neural networks and ignoring the gender information D.
$\widehat{\lambda}_3(\textbf{X})$
(right) using neural networks and ignoring the gender information D.

GLM estimated regression functions $\widehat{\lambda}^{\rm GLM}_1(\textbf{X},D)$
(left),
$\widehat{\lambda}^{\rm GLM}_1(\textbf{X},D)$
(left), $\widehat{\lambda}^{\rm GLM}_2(\textbf{X},D)$
(middle) and
$\widehat{\lambda}^{\rm GLM}_2(\textbf{X},D)$
(middle) and $\widehat{\lambda}^{\rm GLM}_3(\textbf{X},D)$
(right).
$\widehat{\lambda}^{\rm GLM}_3(\textbf{X},D)$
(right).
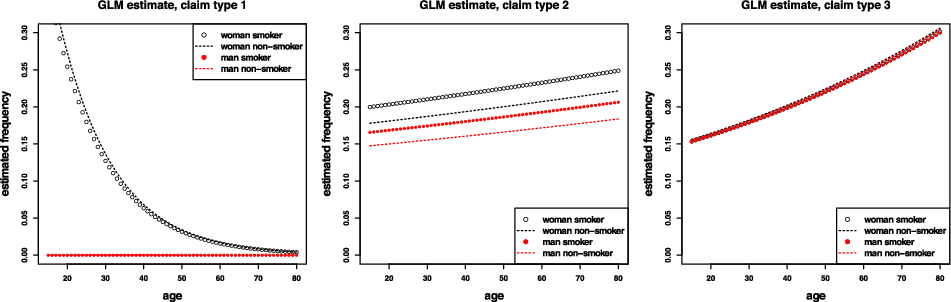
Estimated GLM: (left) smokers and (right) non-smokers with solid black and red lines giving the best-estimate prices for women and men, respectively. The dotted orange lines show the discrimination-free prices and the dotted blue lines show the unawareness prices.
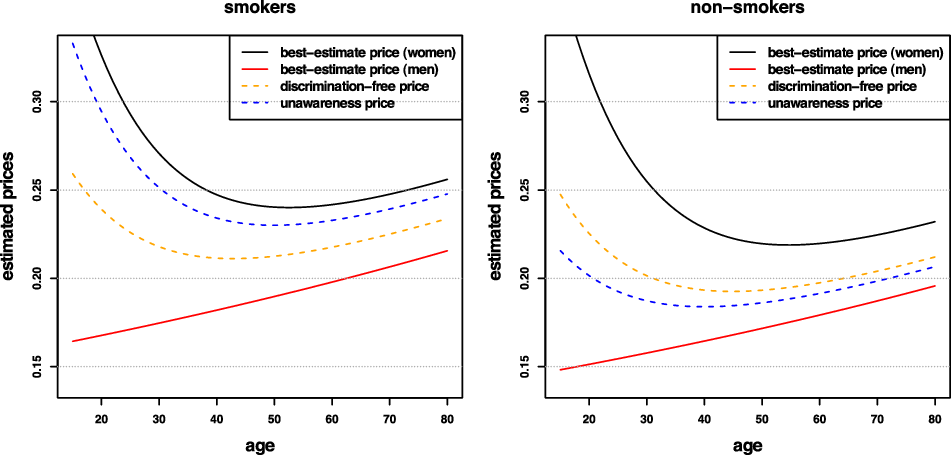
In our next analysis, we illustrate that the (non-)discrimination property does not depend on the quality of the regression model (5.1) chosen. We choose a poor regression model (compared to the neural network above) by just assuming GLMs for $j=1,2,3$
 \begin{equation} (\textbf{x},d) \mapsto \log \widehat{\lambda}^{\rm GLM}_j(\textbf{x},d)= \theta_0^{(j)} + \theta_1^{(j)} x_1 + \theta_2^{(j)} 1_{\{x_2 = \text{smoker}\}}+ \theta_3^{(j)}1_{\{d = \text{woman}\}}. \end{equation}
This model will perform well for $j=2,3$
, see (6.2)-(6.3), but it will perform poorly for
$j=2,3$
, see (6.2)-(6.3), but it will perform poorly for $j=1$
, see (6.1). This is because such a model has difficulties capturing the highly nonlinear birthing-related effects, as seen in Figure 8 (left).
$j=1$
, see (6.1). This is because such a model has difficulties capturing the highly nonlinear birthing-related effects, as seen in Figure 8 (left).
In Figure 9, we present the resulting best-estimate prices (black/red), unawareness prices (blue), and discrimination-free prices (orange), as estimated using the GLM. The first observation is that the resulting prices are a poor approximation to the true prices of Figure 2, the latter assuming full knowledge of the true model. However, the general discrimination behavior is the same in both figures, namely, that the unawareness price discriminates indirectly by learning the gender D from smoking habits $X_2$
. This is illustrated by the relative positioning of blue and orange dotted lines, with smokers more heavily charged for birthing related costs due to the fact that smokers are more likely women.
$X_2$
. This is illustrated by the relative positioning of blue and orange dotted lines, with smokers more heavily charged for birthing related costs due to the fact that smokers are more likely women.
Bias-corrected discrimination-free prices $\widehat h^*(\textbf{x})$
against unadjusted discrimination-free prices
$\widehat h^*(\textbf{x})$
against unadjusted discrimination-free prices $\widehat h(\textbf{x})$
.
$\widehat h(\textbf{x})$
.
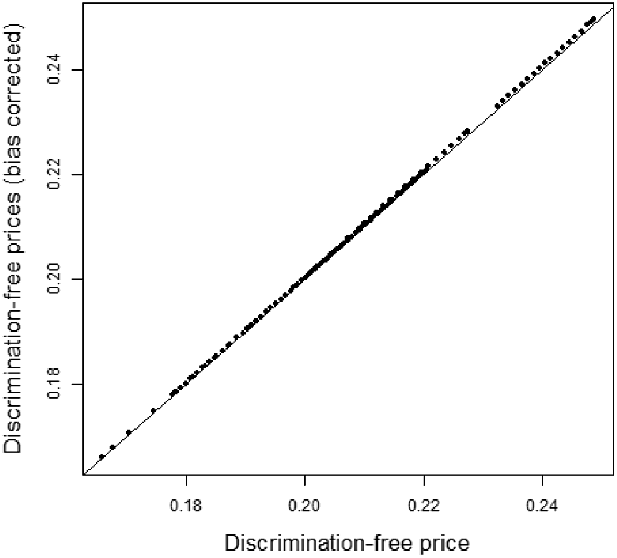
In our last step, we consider the issue of correcting the bias introduced by discrimination-free pricing. The average predicted cost per policyholder and the average discrimination-free price are, respectively:
 \begin{align*} \mu= \frac{1}{n}\sum_{i=1}^n \widehat{\mu}(\textbf{x}_i, d_i; \widehat{\boldsymbol{\theta}})&=0.2054\\ \frac{1}{n}\sum_{i=1}^n \widehat{h}(\textbf{x}_i; \widehat{\boldsymbol{\theta}})&=0.2050.\end{align*}
Thus, we have a small negative bias of approximately 0.2% of $\mu$
. We correct for this bias through an appropriate choice of
$\mu$
. We correct for this bias through an appropriate choice of ${\mathbb{P}}^*(D)$
, as discussed in Section 4, yielding a bias-corrected price
${\mathbb{P}}^*(D)$
, as discussed in Section 4, yielding a bias-corrected price
 \[\widehat{h}^*(\textbf{x}) = \sum_d \widehat{\mu}(\textbf{x}, d; \widehat{\boldsymbol{\theta}}){\mathbb{P}}^*(D=d).\]
As the discriminatory variable D has only two states, there is no need to use the complex formula (4.4); by setting $\frac{1}{n}\sum_{i=1}^n \widehat h^*(\textbf{x}_i)=\mu$
, one can directly obtain
$\frac{1}{n}\sum_{i=1}^n \widehat h^*(\textbf{x}_i)=\mu$
, one can directly obtain ${\mathbb{P}}^*(D=\text{woman})=0.4564$
, which is slightly higher than the empirical portfolio proportion
${\mathbb{P}}^*(D=\text{woman})=0.4564$
, which is slightly higher than the empirical portfolio proportion $n_{\text{woman}}/n=0.4505$
. In Figure 10, we display the bias-corrected discrimination-free prices
$n_{\text{woman}}/n=0.4505$
. In Figure 10, we display the bias-corrected discrimination-free prices $\widehat h^*(\textbf{x})$
against the unadjusted discrimination-free prices
$\widehat h^*(\textbf{x})$
against the unadjusted discrimination-free prices $\widehat h(\textbf{x})$
. We see that bias correction does not lead to any substantial price distortion in our example.
$\widehat h(\textbf{x})$
. We see that bias correction does not lead to any substantial price distortion in our example.
Remark. There is one issue that has not been considered so far and which has been mentioned in the EU legislation (European Commission, 2012), footnote (1) to Article 2.2(14) – life and health underwriting. Namely, we have implicitly assumed that the measurements of the nondiscriminatory covariates are independent of the discriminatory characteristics. If we think of gender as a discriminatory covariate, this is not necessarily the case because, for instance, the waist to hip ratios naturally live on different scales for different genders, but they may still have the same impact on health related questions. This implies that nondiscriminatory covariates may need pre-processing w.r.t. discriminatory ones, such that the resulting measurements for different discriminatory characteristics are comparable.
7. Concluding remarks
We conclude that the aim of this paper has been to provide:
-
(a) an actuarial formulation of discrimination-free prices;
-
(b) a demonstration that the omission of discriminatory information may lead to indirect discrimination in prices;
-
(c) a proposal for a simple formula that generates discrimination-free prices which works regardless of the choice of the underlying model;
-
(d) methods that ensure unbiasedness of discrimination-free prices at the portfolio level (the same considerations apply when transforming an actuarial tariff into a commercial one); and
-
(e) a discussion on the role of available data in obtaining discrimination-free prices.
The starting point to this paper has been an actuarial one. We have intentionally avoided a discussion on “fairness,” and, consequently, how fairness may be measured. For more on these topics, we refer to Kusner et al. (Reference Kusner, Loftus, Russell and Silva2017) and the references therein. Moreover, we have also not commented on which factors should be viewed as discriminatory – this is a societal decision that goes far beyond our actuarial discussion, see for example, Avraham et al. (Reference Avraham, Logue and Schwarcz2014). We (only) provide tools to implement such decisions.
We mention important points that have not been studied in this paper and which need further scientific research. First, discrimination-free pricing may have systemic implications, be they adverse or beneficial. For example, gender neutral pricing of motor insurance may result in cheaper premiums for more dangerous (male) drivers and vice versa, with the resulting incentives leading to a deterioration of aggregate driving behavior. On the other hand, removing gender from car insurance pricing, arguably calls for including other covariates that better represent the risks being priced – ultimately the driving behavior. This is something within reach using telematics data, notwithstanding associated privacy concerns. Another example relates to the use of post-code information, which often correlates with ethnicity. Here, discrimination-free pricing can prevent further penalization of ethnic groups that have suffered historical injustices. The role of insurance in engineering socially beneficial outcomes is yet another discussion we cannot engage with in this paper. Another point worth commenting is whether discrimination-free pricing negatively impacts portfolio mixes (by adverse selection). Such impacts may result in a worse risk landscape of the industry, higher capital demands and, likely, higher premiums for the whole society.
An issue worth stressing once again is that, in order to be able to calculate discrimination-free prices, one needs to have access to all discriminatory characteristics – otherwise, it is not possible to properly adjust for the influence of such characteristics. When it comes to gender, the availability of such data may be feasible, but if we wanted to adjust for, for example, religious beliefs or sexual orientation, such information is in general not readily available. Customers may perceive it as peculiar and intrusive to be approached with questions concerning this type of apparently irrelevant (and sensitive) information. A concrete example is discussed in De Jong and Ferries (Reference De Jong and Ferris2006), where sexual preference is discussed as a risk factor relating to AIDS; the authors also highlight the danger of obtaining untruthful answers to questions around sensitive information, undermining the reliability of collected data. More broadly, collecting data on prohibited characteristics, as well as measuring their predictive power, could itself be legally contested (Prince and Schwarcz, Reference Prince and Schwarcz2019).
A key position taken in the present paper concerns the role of the overall price prediction at portfolio level. We have argued that the aggregate price for the portfolio may be calculated using all available information, including discriminatory covariates. Given this, it is the allocation of this overall cost that may introduce discrimination, and the discrimination-free pricing may be thought of as generating an allocation that avoids this. From this perspective, we know from the start that the allocation is biased w.r.t. the underlying (best-estimate) portfolio risk profile. It is, hence, of interest to analyze how this biased risk profile will affect the performance of the overall portfolio price prediction.
The argumentation used in the present paper has focused directly on how to obtain a discrimination-free price. This has led us to a procedure that tells us how to adjust the best-estimate price to arrive at a discrimination-free price. In a statistical sense, this could be seen as a “discrimination-free point estimate.” A different line of thought instead could be that we try to develop a full statistical model that is discrimination-free, that is, sacrificing predictive performance by appropriately disregarding direct and indirect discrimination, this would result in a full statistical model that provides discrimination-free responses. An example of this approach in a life insurance context are the gender neutral intensities discussed in Chen and Vigna (Reference Chen and Vigna2017). The main reason for considering prices directly is that we believe that this approach is closer to actuarial thinking, and because maximal predictive accuracy is a desirable feature in risk management, that is, we may use the full model for risk management purposes, but charge insurance prices according to its discrimination-free counterpart.
Acknowledgments
The authors would like to thank (in alphabetical order) the following for constructive remarks on an earlier version of the manuscript: Alois Gisler, Andreas Lagerås, Arvid Sjölander, Dirk Tasche, and Ruodu Wang.


 Open access

