

Bipolar disorder (also called manic—depressive disease) is an important cause of psychiatric illness, with a life-time prevalence of 0.6% in the American population. Owing to the chronic nature of the disease process, as well as the high rate of alcohol- and drug-related comorbidity, the economic and personal costs of bipolar disorder are extremely high (Reference Goodwin and JamisonGoodwin & Jamison, 1990; Reference Torrey, Miller and RawlingsTorrey et al, 1997). The risk of acquiring bipolar disorder is increased in the first-degree relatives of affected individuals. Genetic linkage analyses have led to the identification of several regions in the human genome that may contain genes conferring disease susceptibility. However, specific genes that are highly associated with disease acquisition have not been unequivocally identified (Reference Done, Johnstone and FrithDone et al, 1991; Reference Benettini, Ferraro and GoldinBerrettini et al, 1997; Reference Daly, Kirby and KruglyakDaly et al, 1997; Reference ModlinModlin, 1997; Reference Stine, McMahon and ChenStine et al, 1997). The complex nature of the genetics of bipolar disorder might be explained by the interaction of multiple genes with environmental factors, perhaps leading to the expression of disease-associated RNA transcripts within the central nervous system (Reference GershonGershon, 1989; Reference Yee and YolkenYee & Yolken, 1997).
The recently described technique of serial analysis of gene expression (SAGE) allows the accurate identification of large numbers of RNA transcripts in a practical and efficient manner. This technique has been employed for the characterisation of RNA transcripts that are differentially expressed in tumour cells and cell lines which overexpress p63 tumour suppressor gene product (Reference Velculescu, Zhang and VogelsteinVelculescu et al, 1995; Reference Madden, Galella and ZhuMadden et al, 1997; Reference Polytak, Xia and ZweierPolytak et al, 1997; Reference Zhang, Zhou and VelculescuZhang et al, 1997). We applied SAGE to the analysis of RNAs expressed in the brains of individuals with bipolar disorder.
METHOD
Specimen collection and evaluation
Brains from individuals with psychiatric diseases and unaffected control subjects were collected by designated medical examiners (with permission of the families) as part of the Stanley Foundation Brain Collection (Reference KnableKnable, 1999). Diagnosis was established by three senior psychiatrists using DSM-IV (American Psychiatric Association, 1994) criteria based on the individual's psychiatric records and information obtained from the family. The cases and controls did not differ in terms of demographic and pre- or post-mortem variables, including age, gender, brain pH, post-mortem interval or time of specimen storage. The individuals with psychiatric diagnoses did not differ in terms of the rate of suicide. Four of the individuals with bipolar disorder, including the individual with bipolar disorder analysed by SAGE, had not received any medication in the month prior to death. None of the individuals with psychiatric diseases had serious physical illnesses defined during life. Brains from individuals with Huntington's disease were obtained from Dr Christopher Ross, Department of Psychiatry, Johns Hopkins School of Medicine. All of the individuals with Huntington's disease had clinical courses typical of that disease and had received neuroleptic medication during life.
Serial analysis of gene expression
One microgram of total RNA was converted to complementary cDNA using a CapFinder cDNA synthesis kit (Clontech, catalogue no. K1052-1, Palo Alto, CA) and the biotinylated primers required for SAGE. The tagging enzyme Nlalll was used and BsmFl was used as the anchoring enzyme. Multitag fragments were selected to clone into a plasmid vector, pZero (Invitrogen, catalogue no. K2500-1, Carlsbad, CA) for bacterial transformation by electroporation. Bacterial colonies were randomly picked, amplified by polymerase chain reaction (PCR) using M13 forward and reverse primers, and the PCR products sequenced. Tag information was then identified and analysed using the SAGE computer software.
Reverse transcriptase—polymerase chain reactions
The reverse transcriptase—polymerase chain reaction (RT-PCR) technique was performed using primers designed specifically for amplifying genes identified in SAGE. The following cycling conditions were employed in the DNA Thermal Cycler 480: 94 °C, 1 min; 55 °C, 1 min; and 72 °C, 2 min. The number of cycles for each PCR was adjusted according to the relative abundance of each RNA in the tag library. Oligo-dT-primed cDNAs from the frontal cortex regions were used as templates for PCR. The primers employed for the amplification of glyceraldehyde-3-phosphate dehydrogenase (GAPDH) RNA have been described by Johnston et al (Reference Johnston, Cerevnak and Shore1997). The primers for the amplification of serotonin transporter RNA were 5′-CAGAGCTACCCTGTGTGTCCG-3′ and 5′-GTGTCTGGGGGAAGTCTTTCG-3′. The primers used for amplification of NF-κB2 were 5′-CACTAGACAGAGCCGGGCCTA-3′ and 5′-CACAGCCATATCGAAATCGGA-3′.
Ribonucleic acid encoding additional transcription factors was measured using a semi-nested RT-PCR approach to visualise low-abundance transcripts. Initial reactions consisting of 35 cycles were performed under the conditions described above. For each sample, a 5 μl aliquot of the first PCR was diluted in 25 μl of PCR buffer and re-amplified for an additional 20 cycles employing a semi-nested set of primers. The primers used for these reactions were as follows:
-
▪ IκB:
-
▪ 5′-GCTGTGATCACCACATTACCGTC-3′ (forward.
-
▪ 5′-GAGTACATTTGCGCGTTCACG-3′ (reverse.
-
▪ 5′-CACATTACCGTCTGTGGTCCG-3′ (nested in combination with the above reverse primer.
-
-
NF-κB1:
-
▪ 5′-CCCACACTATGGATTTCCTACT-TATGG-3′ (forward.
-
▪ 5′-CCAGCAGCATCTTCACGTCTC-3′ (reverse.
-
▪ 5′CTGTCACCGCGTAGTCGAAAA-3′ (nested in combination with the above forward primer.
-
-
NF-κB3:
-
▪ 5′-ATGGCTCGTCTGTAGTGCACG-3′ (forward.
-
▪ 5′-GCAGTCCTTTCCTACAAGCTCGT-3′ (reverse.
-
▪ 5′-GGTGGTATCTGTGCTCCTCTCG-3′ (nested in combination with the above forward primer).
-
Following amplification, PCR products were separated and visualised as described below.
Amplicon quantitation
The PCR products were resolved by polyacrylamide gel electrophoresis and stained with SYBR Green I. The gel was converted to a digital image and the fluorescence generated by the appropriately sized band quantified by a digital fluoroimager (Vistra II, Molecular Dynamics, Sunnyvale, CA). For each target amplicon, levels were expressed as the ratio of the fluorescence generated by the target amplicon to the fluorescence generated in the same sample by primers directed at the constitutively expressed RNA encoding GAPDH. The resulting ratios of the diagnostic groups were compared using analysis of variance and t-test statistics performed by the statistical data-analysis program Statsoft (Tulsa, OK).
RESULTS
Initial SAGE analysis was performed on the frontal cortex region (Brodmann's area 10) of a brain obtained post-mortem from an individual with bipolar disorder and the brain of an age- and gender-matched unaffected individual. These brains were obtained as part of a neuropathology consortium devoted to the collection of brains from individuals with psychiatric diseases under controlled conditions (Reference Johnston, Cerevnak and ShoreJohnston et al, 1997).
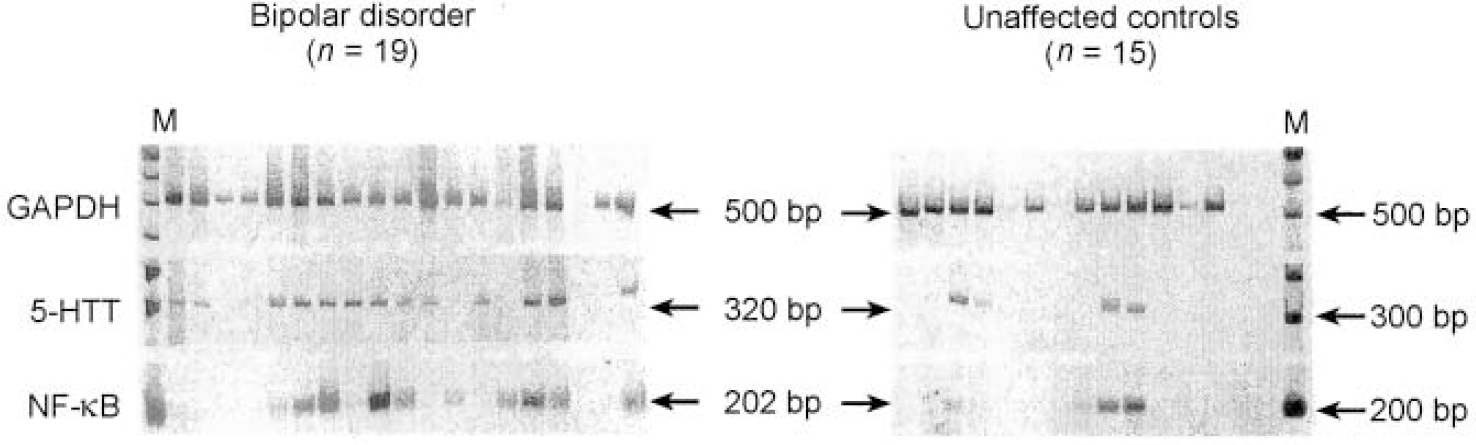
We constructed and identified 1856 sequence tags from the expressed RNAs from the brain of the individual with bipolar disorder and 4237 sequence tags from the brain of the unaffected control. We identified four sequence tags that displayed significant differences in number between the case and the control brain tissues (Table 1). The levels of RNA transcripts homologous to these tags were further analysed in tissue obtained postmortem from the same brain region of 19 individuals with bipolar disorder and 15 unaffected controls (Fig. 1). Serotonin transporter protein RNA transcripts were detected in 13 of the 19 (68%) individuals with bipolar disorder compared with 4 of the 15 (27%) unaffected individuals (P=0.018, Fisher's exact test). Transcripts encoding the nuclear transcription factor NF-κB2 were detected in 12 of the 19 (63%) individuals with bipolar disorder and 4 of the 15 (27%) control individuals (P=0.037, Fisher's exact test). Either serotonin transporter or NF-κB2 transcripts were detected in 17 of the 19 (89%) individuals with bipolar disorder compared with 5 of the 15 (33%) control individuals (P=0.001, Fisher's exact test). On the other hand, transcripts encoding GAPDH were detected in 18 of the 19 individuals with bipolar disorder and all 15 of the samples from the control individuals. The other two RNA transcripts identified in the initial SAGE evaluation, encoding RACH1 and biliary glycoprotein, were not found to be differentially expressed in the larger group of samples and were not analysed further (data not shown).
Reverse transcriptase-polymerase chain reaction (RT-PCR) analysis of differentially expressed genes in the frontal cortex regions of patients with bipolar disorder and unaffected controls. The PCR reactions were performed as described and visualised following polyacrylamide gel electrophoresis and staining with SYBR Green I. Each lane represents an individual sample. Arrows indicate the expected size of the PCR amplicon. GAPDH, glyceraldehyde-3-phosphate dehydrogenase; 5-HTT, serotonin transporter protein.
Differentially expressed serial analysis of gene expression (SAGE) tags
| Tag sequences | Number of tags | RNA homology | GenBank accession no. | |
|---|---|---|---|---|
| Case | Control | |||
| CATGGCAAAACCCC | 7 | 0 | Serotonin transporter | U79746 |
| CATGGTGGCAGGCG | 7 | 2 | NF-κB2 subunit | X61499 |
| CATGGTGGTGGGTG | 9 | 3 | Human RACHI | U35735 |
| CATGGTGGCGGGCG | 9 | 1 | Biliary glycoprotein | M72238 |
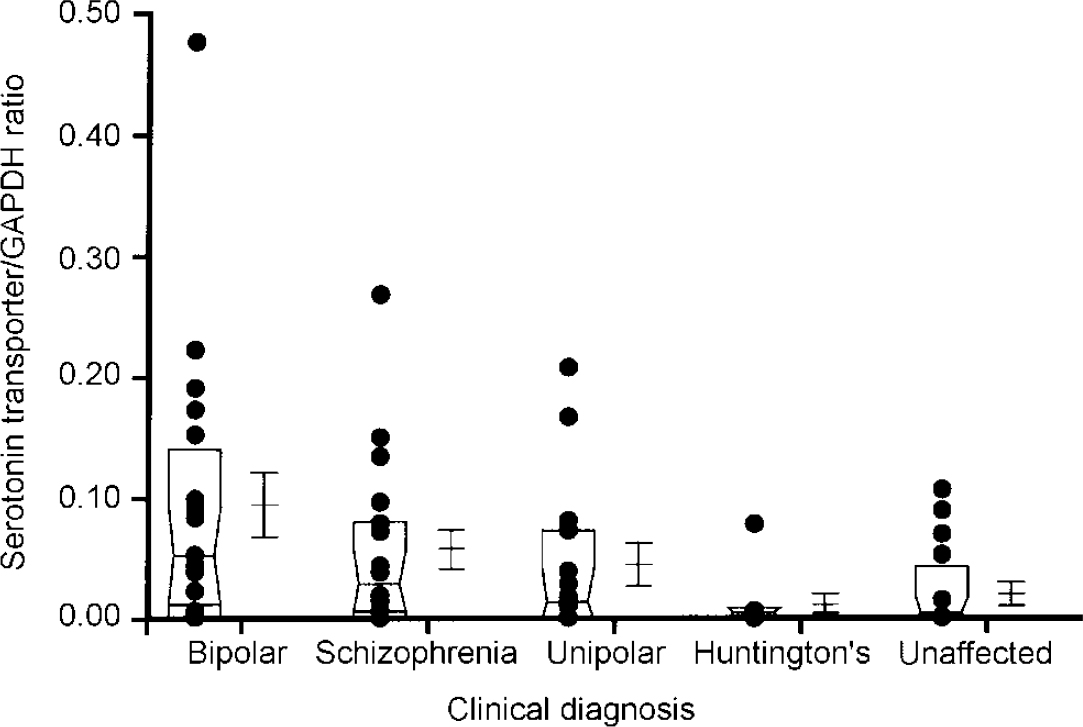
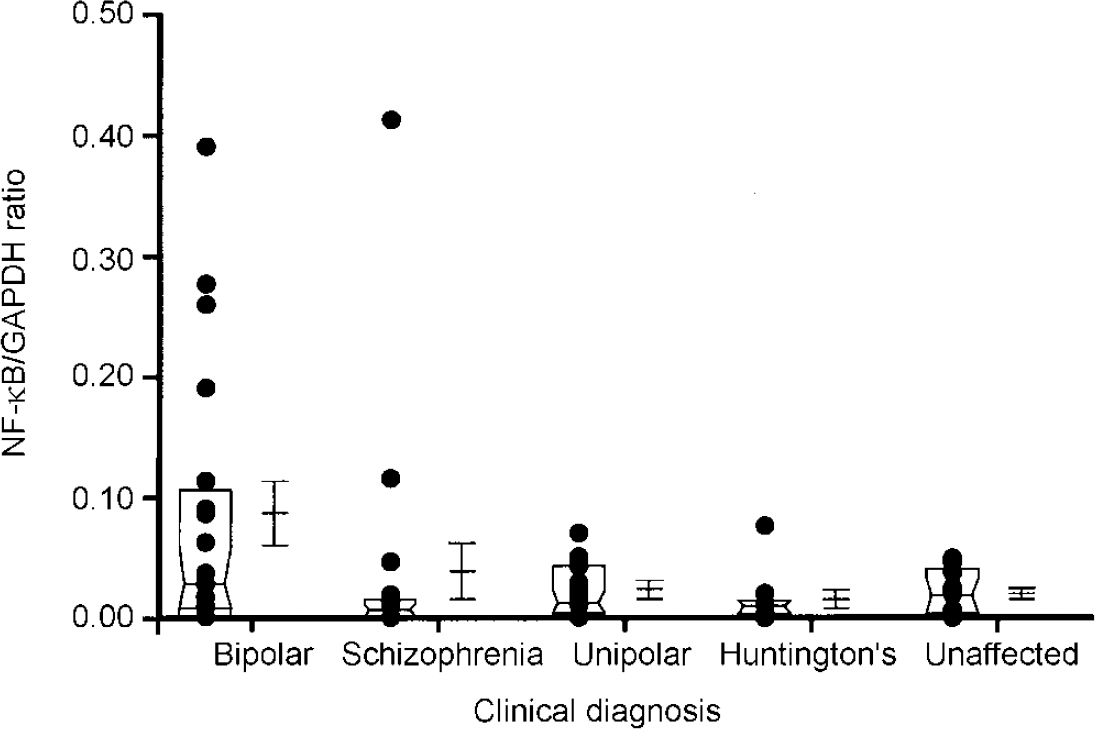
In addition to these sample analyses, RNA transcripts encoding the serotonin transporter protein and NF-κB2 were also quantitated in samples obtained from the same brain region of individuals with schizophrenia (n=18), unipolar depression (n=14) and Huntington's disease who had received neuroleptic medication (n=8) (Fig 2 and 3). These analyses were performed using a semi-quantitative RT-PCR procedure that expresses the level of target amplicons in relation to the level of amplicons generated by primers specific for GAPDH, which acts as a control for overall level of RNA expression (Reference Nicoletti and Sassy-PrigentNicoletti & Sassy-Prigent, 1995; Reference Zhao, Araki and NishimotoZhao et al, 1995). The levels of RNA transcripts encoding the serotonin transporter protein and NF-κB2 were significantly increased in the bipolar group compared with the unaffected controls (P < 0.002 and P < 0.02, respectively). There was no significant correlation between the levels of these RNA transcripts and a range of ante- and post-mortem variables including age, gender, medication history, brain pH and post-mortem interval. Elevated levels of RNA transcripts encoding the serotonin transporter protein and NF-κB2 were also found in samples obtained from some individuals with schizophrenia and unipolar depression. However, as a group, the levels did not differ from those measured in the unaffected controls to a statistically significant extent (all P > 0.1). Neither of these RNA transcripts were detected in the brains of individuals with Huntington's disease, despite the fact that these individuals had received neuroleptic medication.
Comparison of levels of serotonin transporter RNA in the frontal cortex regions of individuals with different clinical diagnoses. Each dot in the figure represents the ratio of serotonin transporter for glyceraldehyde-3-phosphate dehydrogenase (GAPDH) from an individual sample, computed as described in the text. The box represents the median, 25th and 75th percentiles of the samples for each diagnostic category. The adjacent error bars represent the mean and standard error of the values for the indicated diagnostic category. The values measured in the bipolar group are significantly greater than those in the unaffected group (P < 0.002). The other populations do not differ from the unaffected controls to a statistically significant extent.
Comparison of levels of NF-κB2 RNA in the frontal cortex regions of individuals with different clinical diagnoses. Each dot in the figure represents the ratio of serotonin transporter for glyceraldehyde-3-phosphate dehydrogenase (GAPDH) from an individual sample, computed as described in the text. The box represents the median, 25th and 75th percentiles of the samples for each diagnostic category. The adjacent error bars represent the mean and standard error of the values for the indicated diagnostic category. The ratios measured in the bipolar group are significantly greater than those in the unaffected group (P < 002). The other populations do not differ from the unaffected controls to a statistically significant extent. Methods were identical to those described in Fig. 1.
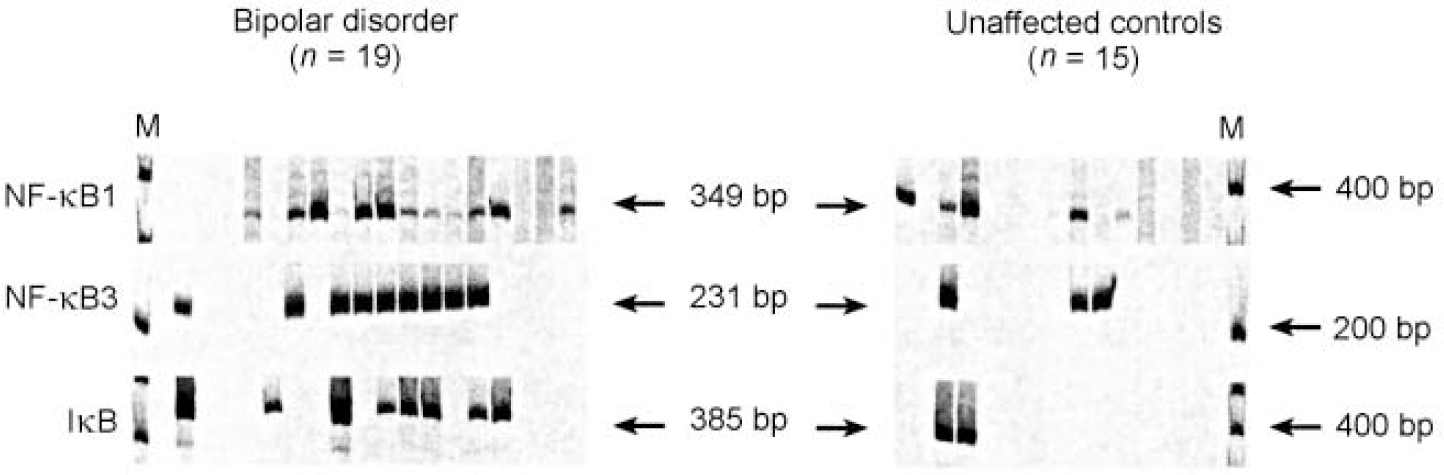
The expression of NF-κB2 was further analysed in terms of its biological properties. The gene encodes the p49/p100 subunit of the NF-κB transcription factor complex. This complex is expressed upon the induction of a wide variety of cellular and viral genes involved in immune function and inflammatory response. The NF-κB complex consists of a number of proteins involved in interrelated transcriptional and signal transduction pathways. Activation of NF-κB2 is thus often associated with activation of other transcription factors, including IκB, NF-κB1 and NF-κB3 (Reference Ten, Paya and IsraelTen et al, 1992; Reference Cogswell, Scheinman and BaldwinCogswell et al, 1993; Reference Deloukas and van LoonDeloukas & van Loon, 1993; Reference Liptay, Schmid and NabelLiptay et al, 1994). In fact, we found that in comparison with unaffected individuals, these factors are also increased in the frontal cortex of many people with bipolar disorder (Fig. 4).
Reverse transcriptase-polymerase chain reaction (RT-PCR) analysis of NF-κB1, NF-κB3 and IκB using cDNA from the frontal cortex region of patients with bipolar disorder and unaffected controls. The reactions were performed and quantified as described in the text. Arrows indicate the expected size of the product of the nested PCR reaction.
We also examined the samples for increased expression of a number of control RNA transcripts. Disease-associated differences were not detected in the expression of a number of housekeeping and metabolically active RNAs including those encoding actin, cytochrome oxidase, myelin basic protein, phosphotyrosine phosphatase, nerve growth factor, autoantigen DFS70, synaptosomal-associated protein (SNAP) 25, and heat shock proteins 70 and 90. In addition, diagnosis-related differences were not found in the levels of RNA transcripts homologous to the following sequence tags identified in equal numbers in the case and control brains employed in the original SAGE analysis: guanylate kinase (GenBank accession no. L76300), c-erbB3 receptor (GenBank accession no. M29366) and RNA helicase (GenBank accession no. D50924) (data not shown).
DISCUSSION
The specificities of the RNA transcripts which we found to be present at elevated levels in the frontal cortex of individuals with bipolar disorder are of interest in terms of possible pathophysiological mechanisms of this disease. Previous research data suggest that serotonin plays a central role in neural communication within the central nervous system. Furthermore, levels of serotonin can affect mood, appetite, sleep, pain perception and several aspects of human behaviour (Reference Kanner and SchuldinerKanner & Schuldiner, 1987; Reference Amara and KuharAmara & Kuhar, 1993; Reference Young, Pihl and BenkelfatYoung et al, 1996). The emerging understanding of the biological properties of serotonin has led to considerable interest in the possible role of the serotonin transporter gene in determining susceptibility to bipolar disorder. While mutations in the coding region have not been found, several studies have documented an association between the variable number of tandem repeats in the transcriptional control region of the gene and the occurrence of bipolar disorder (Reference Battersby, Ogilvie and SmithBattersby et al, 1996; Reference Collier, Stober and LiCollier et al, 1996a ,Reference Collier, Arranz and Sham b ). Our findings of a statistically significant increase in the levels of serotonin transporter RNA in the frontal cortex region of a population of individuals with bipolar disorder is consistent with these genetic studies. In addition, our results demonstrating increased levels of serotonin transporter RNA in the frontal cortex of some individuals with schizophrenia is in agreement with previous studies reporting altering levels of serotonin transporter RNA in adjacent cortical regions of individuals with schizophrenia (Reference Hernandez and SokolovHernandez & Sokolov, 1997). The finding of increased levels of this RNA in individuals with different clinical diseases is probably a reflection of the genotypic and phenotypic overlap that can occur between individuals with different psychiatric diagnoses. The relationship between genetic polymorphism, serotonin transporter levels and disease phenotype merits further investigation, as does the quantitative analysis of serotonin transporter RNA in other brain regions.
The finding of increased levels of RNA encoding components of the NF-κB transcription complex in brains of many individuals with bipolar disorder is also of interest. Inducers of the NF-κB complex include viruses, oxidants, cell adhesion molecules, cytokines and growth factors (Reference Meyer, Hatada and HohmannMeyer et al, 1991; Reference Baeuerle and ThomasBaeuerle & Thomas, 1994; Reference Baeuerle and BaltimoreBeauerle & Baltimore, 1996). The presence of increased levels of RNA encoding NF-κB in the brains of some individuals with bipolar disorder is thus consistent with studies indicating that environmental factors may contribute to the pathogenesis of this disease. The documented occurrence of disease discordance in monozygotic twins, increased levels of autoreactive antibodies, and an increased prevalence of disease following winter or spring birth and maternal fever are in agreement with a possible role of infectious or inflammatory factors in the aetiopathogenesis of some cases of bipolar disorder (Reference Bertelsen, Harvald and HaugeBertelsen et al, 1977; Reference Kinney, Yurgelun-Todd and LevyKinney et al, 1993; Reference Haggerty, Silva and MarquardtHaggerty et al, 1997; Reference Torrey, Miller and RawlingsTorrey et al, 1997). The finding of increased levels of RNA encoding NF-κB transcription factors in the cortical regions of some individuals with schizophrenia indicates that such factors may also be operant in some cases of this disease as well. The interactions between transcription factors in cortical and other brain regions, genetic susceptibilities and disease phenotype are the subject of current investigations.
Our study differs from others employing the SAGE technique in that we analysed RNA extracted from post-mortem human brain tissue as opposed to RNA from cell lines or tumour tissues (Reference Velculescu, Zhang and VogelsteinVelculescu et al, 1995; Reference Madden, Galella and ZhuMadden et al, 1997; Reference Polytak, Xia and ZweierPolytak et al, 1997; Reference Zhang, Zhou and VelculescuZhang et al, 1997). Therefore, the number of tags we were able to characterise was substantially lower than the number required for the complete analysis of RNA expression, a limitation related to the quantity and quality of RNA that can be obtained from post-mortem human brain specimens. In addition, initial analysis was limited to cortical regions from only two representative individuals. Furthermore, owing to the limited sample size, the possibility that RNA expression may have been affected by environmental factors not directly related to the underlying clinical diagnosis cannot be completely excluded. Despite these limitations, we were able to identify RNA transcripts that are differentially expressed in the brains of a population of individuals with bipolar disorder and that correspond to potential genetic and environmental components of this disease. The elucidation of differentially expressed RNA transcripts in the initial SAGE analyses could also be used to identify the differential expression of additional functionally related RNA transcripts. Our studies indicate that SAGE analyses of human brain tissues are potentially useful for the analysis of complex human brain disorders.
Clinical Implications and Limitations
CLINICAL IMPLICATIONS
-
▪ Data from this study support the suggestion that environmental factors are important in the aetiology of bipolar disorder.
-
▪ The serial analysis of gene expression (SAGE) technique of analysing RNA could be used in other brain diseases.
-
▪ The technique is an additional means of identifying susceptibility genes.
LIMITATIONS
-
▪ The number of specimens was limited.
-
▪ Initial analysis was limited to cortical areas from two individuals.
-
▪ The quantity and quality of RNA that can be obtained from post-mortem specimens are limited.


eLetters
No eLetters have been published for this article.