


Introduction
In the face of global environmental change and the wide range of anthropogenic threats that animal populations face, collecting data on species’ distributions, demography, and abundance is essential to inform wildlife conservation and management strategies. Species-specific information is used to detect changes in population dynamics, assess anthropogenic threats or evaluate the effectiveness of conservation measures (Butchart et al. Reference Butchart, Walpole, Collen, Van Strien, Scharlemann and Almond2010; Danielsen et al. Reference Danielsen, Jensen, Alviola, Balete, Mendoza and Tagtag2005). Furthermore, the classification of species in terms of extinction risk or conservation needs in various national and global assessments (e.g. Birdlife International 2021), which are catalysts for policy changes and the allocation of resources to species conservation, relies on robust information on the abundance of species and changes in population sizes over time (Betts et al. Reference Betts, Young, Hilton‐Taylor, Hoffmann, Rodríguez and Stuart2020). Consequently, considerable effort is invested within the field of animal ecology and conservation towards monitoring the distribution and abundance of animal populations (McComb et al. Reference McComb, Zuckerberg, Vesely and Jordan2010; Walsh et al. Reference Walsh, Halley, Harris, del Nevo, Sim and Tasker1995).
The Arctic Skua or Parasitic Jaeger Stercorarius parasiticus (Figure 1) is a migratory seabird with a Holarctic breeding distribution throughout the circumpolar Arctic and some northern temperate regions, falling within the jurisdictions of USA, Canada, Greenland, Iceland, the Faroe Islands, UK, Norway, Sweden, Finland, and Russia (Figure 2). Arctic Skuas nest in both coastal and inland areas in a spectrum of open habitats such as peatland, low-lying marshes, tundra, and rock-dominated polar landscapes (Furness Reference Furness1987; Wiley and Lee Reference Wiley, Lee and Billerman2020). At a species level, Arctic Skuas are generalists, breeding in different biomes and exploiting diverse prey. However, regionally they often exhibit different foraging strategies. In inland tundra (and some coastal tundra), Arctic Skuas may nest in low densities, establishing large all-purpose individual territories where they generally have a broad prey base and can be either kleptoparasitic or direct foragers of both terrestrial and aquatic prey (hereafter “generalist populations”). Conversely, some coastal populations are high-density, rely more heavily on marine resources, and are largely kleptoparasitic (hereafter “kleptoparasitic populations”) during all or part of the breeding season, engaging in aggressive aerial chases where they steal food, predominantly forage fish, from other seabirds as their main foraging strategy (Andersson Reference Andersson1976; Furness Reference Furness1987; Phillips Reference Phillips2001) (Figure 1). In this group of kleptoparasitic populations, we include populations that have historically formed colonies of c.100–250 breeding pairs in proximity to large breeding aggregations of other seabirds and that appear to be limited to the North Atlantic, usually on small islands in Scotland, the Faroe Islands, and Norway, but may also be found as single pairs or small colonies (Furness Reference Furness1987; O’Donald Reference O’Donald1983; van Bemmelen et al. Reference van Bemmelen, Schekkerman, Hin, Pot, Janssen and Ganter2021).
Arctic Skuas in their breeding grounds in Fair Isle, Scotland (left), and chasing Black-legged Kittiwakes in the subarctic (right). (Photographs by Alex Penn and Kate Persons for Smithsonian Institution, Nome, Alaska)

Global breeding and non-breeding distributions of the Arctic Skua Stercorarius parasiticus. Known, recently described flyways and stop-over sites are presented. Connectivity between non-breeding areas, stop-over sites, and breeding areas are depicted with arrows. Additional potential flyways based on unpublished data or expert opinion in the Pacific populations are indicated by question marks. The annual cycle schematic indicates the proportion of time spent in each area and is based on van Bemmelen et al. (Reference van Bemmelen, Moe, Schekkerman, Hansen, Snell and Humphreys2024) with 1 January at the centre bottom.
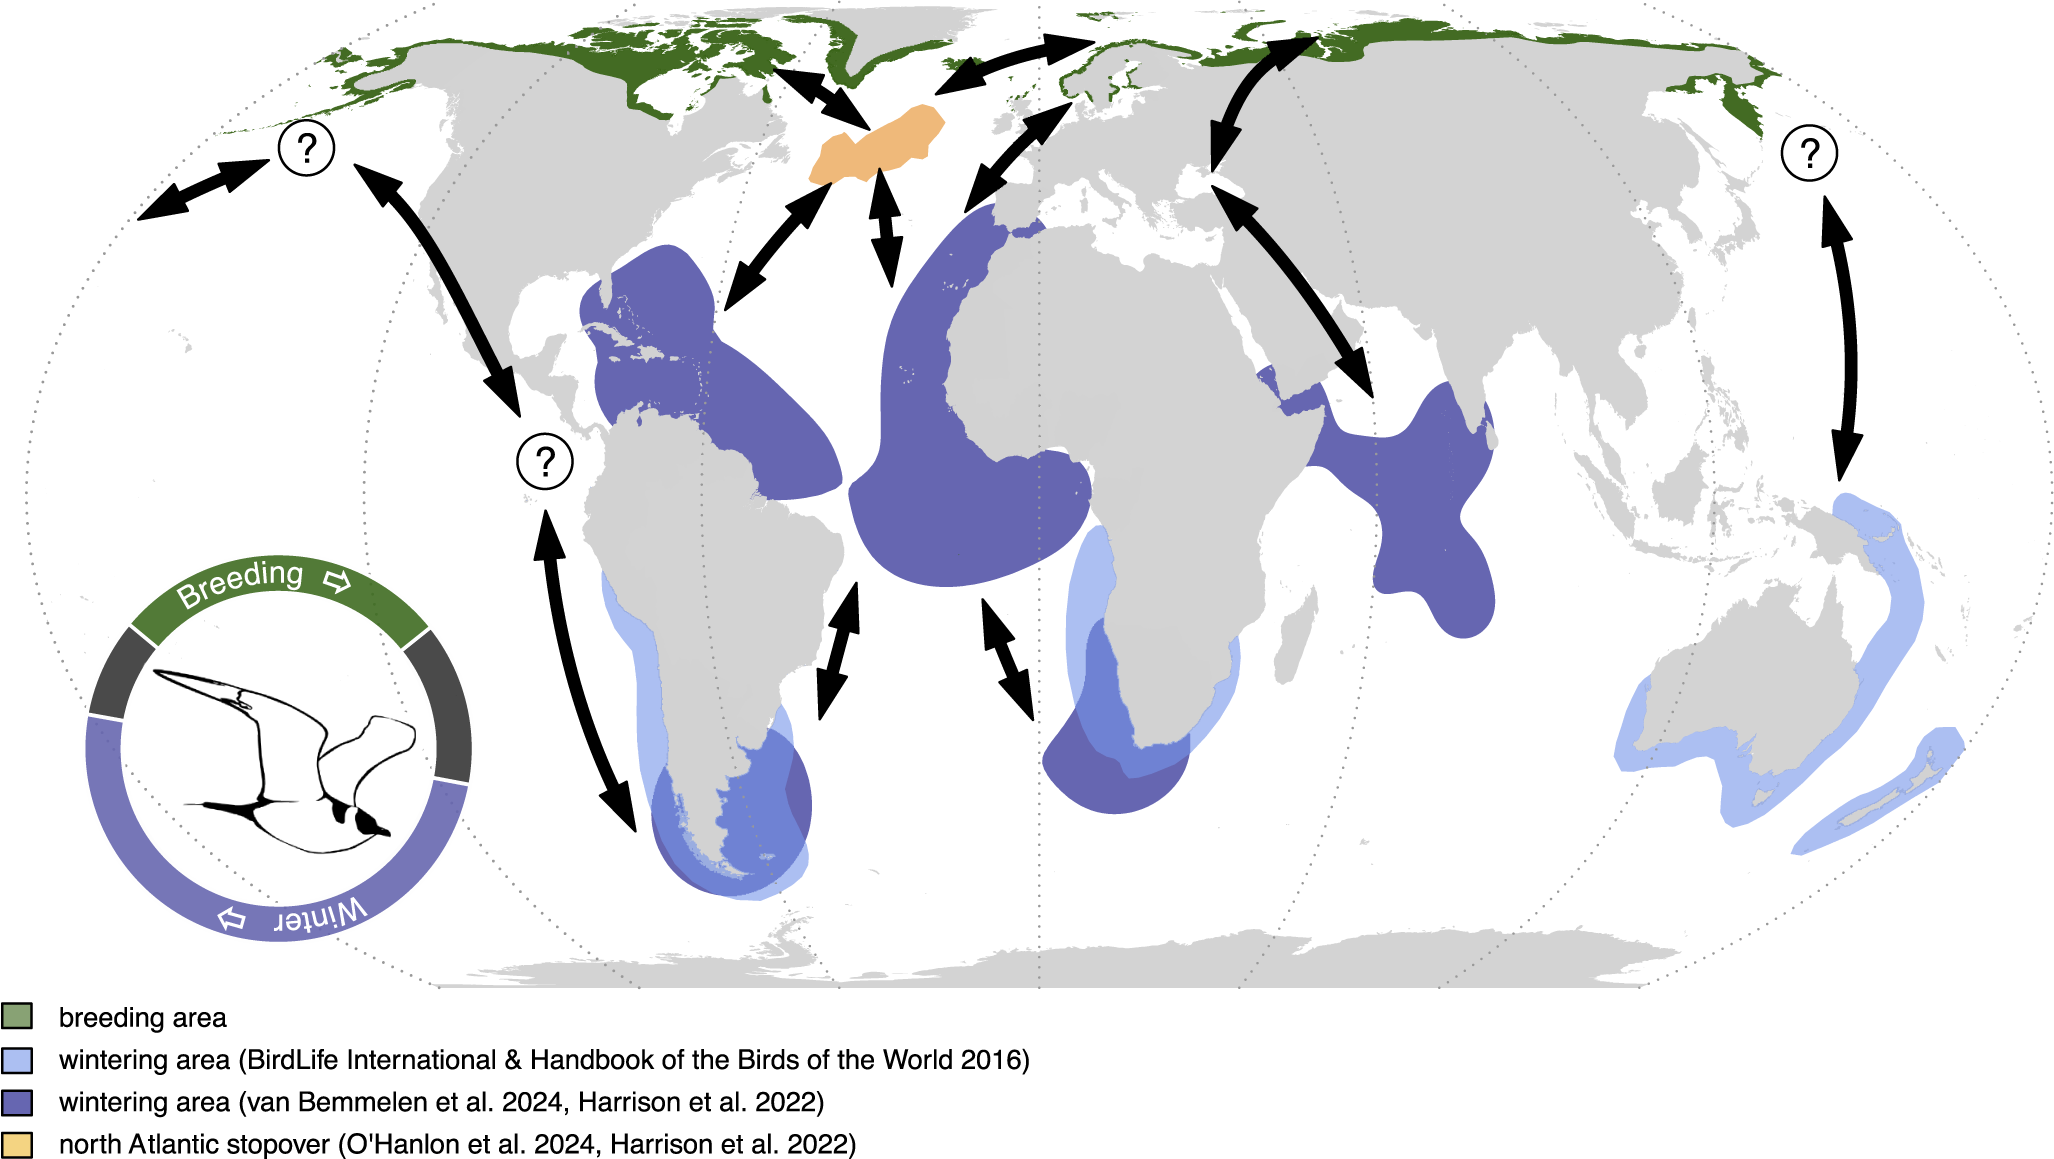
As with many seabirds, knowledge of the foraging and movement ecology of Arctic Skuas during the non-breeding period is scant compared with the breeding period. The miniaturisation and advancement of telemetry devices have revealed migration routes and wintering areas of Arctic Skuas from a range of breeding populations, mainly from the north-eastern Atlantic, demonstrating that Arctic Skuas spend the boreal winter in pelagic waters around the Mediterranean, the tropics, and productive seas around South America, Africa, Australasia, and in the north-western Indian Ocean (Figure 2) (Harrison et al. Reference Harrison, Woodard, Mallory and Rausch2022; O’Hanlon et al. Reference O’Hanlon, van Bemmelen, Snell, Conway, Thaxter and Aiton2024; van Bemmelen et al. Reference van Bemmelen, Moe, Schekkerman, Hansen, Snell and Humphreys2024): a larger wintering distribution than previously described (Furness Reference Furness1987; Isenmann et al. Reference Isenmann, Benmergui and Browne2010; Simeone et al. Reference Simeone, Anguita and Luna-Jorquera2014). Less is known about their diet and foraging behaviour during this time, but kleptoparasitism of several seabird species has been observed at sea during migration, together with evidence of other prey types such as cephalopods, barnacles, and fish (Bélisle and Giroux Reference Bélisle and Giroux1995; Furness Reference Furness1987; Spear et al. Reference Spear, Ainley and Walker2007; Wiley et al. Reference Wiley, Lee and Rodewald1999).
The Arctic Skua is currently classified as “Least Concern” in the global International Union for Conservation of Nature (IUCN) European Red List of Threatened species, but it is “Endangered” in Europe, with declines recorded in recent decades (Birdlife International 2018, 2021; Burnell et al. Reference Burnell, Perkins, Newton, Bolton, Tierney and Dunn2023; Perkins et al. Reference Perkins, Ratcliffe, Suddaby, Ribbands, Smith and Ellis2018; Snell et al. Reference Snell, dos Santos, van Bemmelen, Moe and Thorup2025). However, the availability and quality of monitoring and ecological data for Arctic Skuas are patchy across most of its breeding range. Collating existing knowledge about Arctic Skuas at a global scale is necessary to identify where knowledge gaps lie regarding their ecology and population status and trends, and thus research and conservation priorities. Hence, we formed a collaboration of seabird ecologists to collate and evaluate relevant literature, data, and expert opinion on Arctic Skuas with the following aims: (1) to provide an updated global estimate of breeding population size and best possible population trends by country/region; (2) to identify and summarise drivers of population change; (3) to identify immediate knowledge gaps and their implications for the conservation of Arctic Skuas.
Data sources and quality
Estimates of breeding population size and trends, and demographic parameters presented in this study were collated from published literature, national databases, expert consultation or, in few cases, were provided by the authors of this study either from unpublished data at their study sites or calculations based on best available information. Further searches in Google Scholar and Web of Science ensured greater coverage of potentially useful information using the search terms Arctic Skua OR Parasitic Jaeger OR Stercorarius parasiticus with population OR abundance OR colony OR breeding OR survey OR survival OR breeding success OR productivity. We also searched the available literature in Russian separately using the term “Короткохвостый поморник” (the common name of Arctic Skua in Russian) in Google Scholar. Additionally, articles were retrieved from the Cyberleninka (cyberleninka.org) and Elibrary (elibrary.ru) libraries.
To provide a measure of the quality of population estimates presented in this study, we classified population estimates according to Birdlife International criteria relevant to IUCN Red List assessments (https://datazone.birdlife.org/species/spcquality) with slight amendments to their definitions. These categories were:
A = Based on reliable and complete or representative quantitative data;
B = Based on reliable but incomplete or partially representative quantitative data;
C = Based on qualitative information, potentially unreliable/unrepresentative quantitative data, or quantitative data extrapolated from regions with similar habitats and breeding densities.
Breeding population
The level of monitoring effort achieved across the large and diverse range of jurisdictions where Arctic Skuas breed is highly variable, resulting in heterogeneous and regionally specific knowledge of population status and trends. A large proportion of the breeding distribution of Arctic Skuas is found across vast Arctic landscapes with limited facilities (e.g. roads, airports) which, in combination with low nesting densities, makes large-scale monitoring logistically challenging and expensive (e.g. for the Canadian Arctic; Mallory et al. Reference Mallory, Gilchrist, Janssen, Major, Merkel and Provencher2018), and for some parts of the range, unfeasible due to financial, logistical or legal constraints (Gallo-Cajiao et al. Reference Gallo-Cajiao, Dolšak, Prakash, Mundkur, Harris and Mitchell2023). As a result, the most comprehensive census data are from smaller countries (e.g. UK, Faroe Islands, Finland, Sweden), where breeding sites of Arctic Skuas are more accessible, but which only cover small proportions of the entire breeding range (Burnell et al. Reference Burnell, Perkins, Newton, Bolton, Tierney and Dunn2023; HELCOM 2018; Snell et al. Reference Snell, dos Santos, van Bemmelen, Moe and Thorup2025). Some countries derived national estimates from modelled regional abundance, including a recently completed survey of the avifauna of the Canadian Arctic, which has added a new source of large-scale data to describe the status of Arctic Skuas. Additionally, long-lived seabirds such as skuas may skip breeding in some years, and a large proportion of their populations is composed of juvenile and immature birds that rarely attend breeding colonies (Hamer et al. Reference Hamer, Schreiber, Burger, Schreiber and Burger2002), thus only part of the population is monitorable at the breeding grounds. Previous global estimates were primarily based on expert opinion. For example, Furness (Reference Furness1987) speculated that the Arctic Skua is the most numerous skua species, arriving at a figure of 500,000–1,000,000 breeding pairs, though this is “little more than a guess!”. More recently, Birdlife International (2021) and the European Breeding Bird Atlas 2 (Keller et al. Reference Keller, Herrando, Voříšek, Franch, Kipson and Milanesi2020) reported a global population of 400,000–599,999 mature individuals, of which 20% are estimated to breed in Europe. Below, we summarise and review the most recent data on breeding population size from all countries where Arctic Skuas breed and combine these to produce an updated global population estimate.
Alaska
There are no estimates of breeding population size for Alaska as a whole, but several regions of Alaska have been surveyed as part of the Program for Regional and International Shorebird Monitoring (PRISM) (Bart and Johnston Reference Bart and Johnston2012). In the mid-twentieth century, breeding densities ranged from 0.01 to 0.1 nesting pairs/km2 at various study sites across the North Slope (141–166°W; Figure 3), that included coastal and inland sites with nesting pairs or single birds sometimes separated by several kilometres, where Arctic Skuas forage within their own territories on eggs, birds, berries, invertebrates, small mammals, and fish (Andersson Reference Andersson1973; Maher Reference Maher1974). Plot-based surveys across the North Slope of Alaska covered >50,000 km2 of suitable breeding habitat between 1992 and 2005. Extrapolation across the study area yielded an estimated 46,761 (CV = 0.29) individuals (potentially including some non-breeding birds), simplistically equivalent to 23,380 pairs (SE = 16,600–30,160) of Arctic Skuas (Bart and Johnston Reference Bart and Johnston2012) (Table 1 and Figure 3). These were primarily found as single birds in low densities in wetland and moist areas, as has been previously reported locally (Maher Reference Maher1974). Aerial transect surveys across the North Slope, during 2007–2024, estimated breeding and total count indices for skuas, but did not distinguish among the three Alaskan skua species and should be used as an assessment of relative abundance only (see Population trends section; Amundson Reference Amundson, Flint, Stehn, Platte, Wilson and Larned2019; Wilson et al. Reference Wilson, Safine, Frost and Osnas2025). Surveys were also conducted in Western Alaska (Selawik National Wildlife Refuge, the central portion of the Yukon–Kuskokwim Delta, and Alaska Peninsula and Maritime region) under the PRISM program, albeit with lower intensity (McCaffery et al. Reference McCaffery, Bart, Wightman, Krueper, Bart and Johnston2012). These surveys yielded only two observations of Arctic Skua, suggesting that the species is not common in these regions (unpublished data). Historically, up to six pairs were found nesting on islands of the Alaska Peninsula during ground-nesting surveys 1977–1981 (Bailey and Faust Reference Bailey and Faust1984). A ground-nesting marine bird survey in Glacier Bay (Southeast Alaska), 2003–2005 (Arimitsu et al. Reference Arimitsu, Piatt and Romano2007) recorded four nests distributed across three inlets of the bay (2003, n = 1; 2004, n = 1; 2005, n = 2). Given that encounters outside the North Slope are low, mostly unsystematic, and certainly orders of magnitude less than the North Slope population, we use this estimate as representative of Alaska in global estimates. However, it is possible that substantial numbers breed in unsurveyed areas of their large Alaskan breeding range. For example, the Aleutian Islands were historically reported to have large populations by Murie (Reference Murie1959). On-going efforts to survey Alaska with the PRISM program (e.g. Lyons et al. Reference Lyons, Brown, Saalfeld, Johnson, Andres and Sowl2024) may yield additional abundance estimates for Arctic Skua in the years to come.
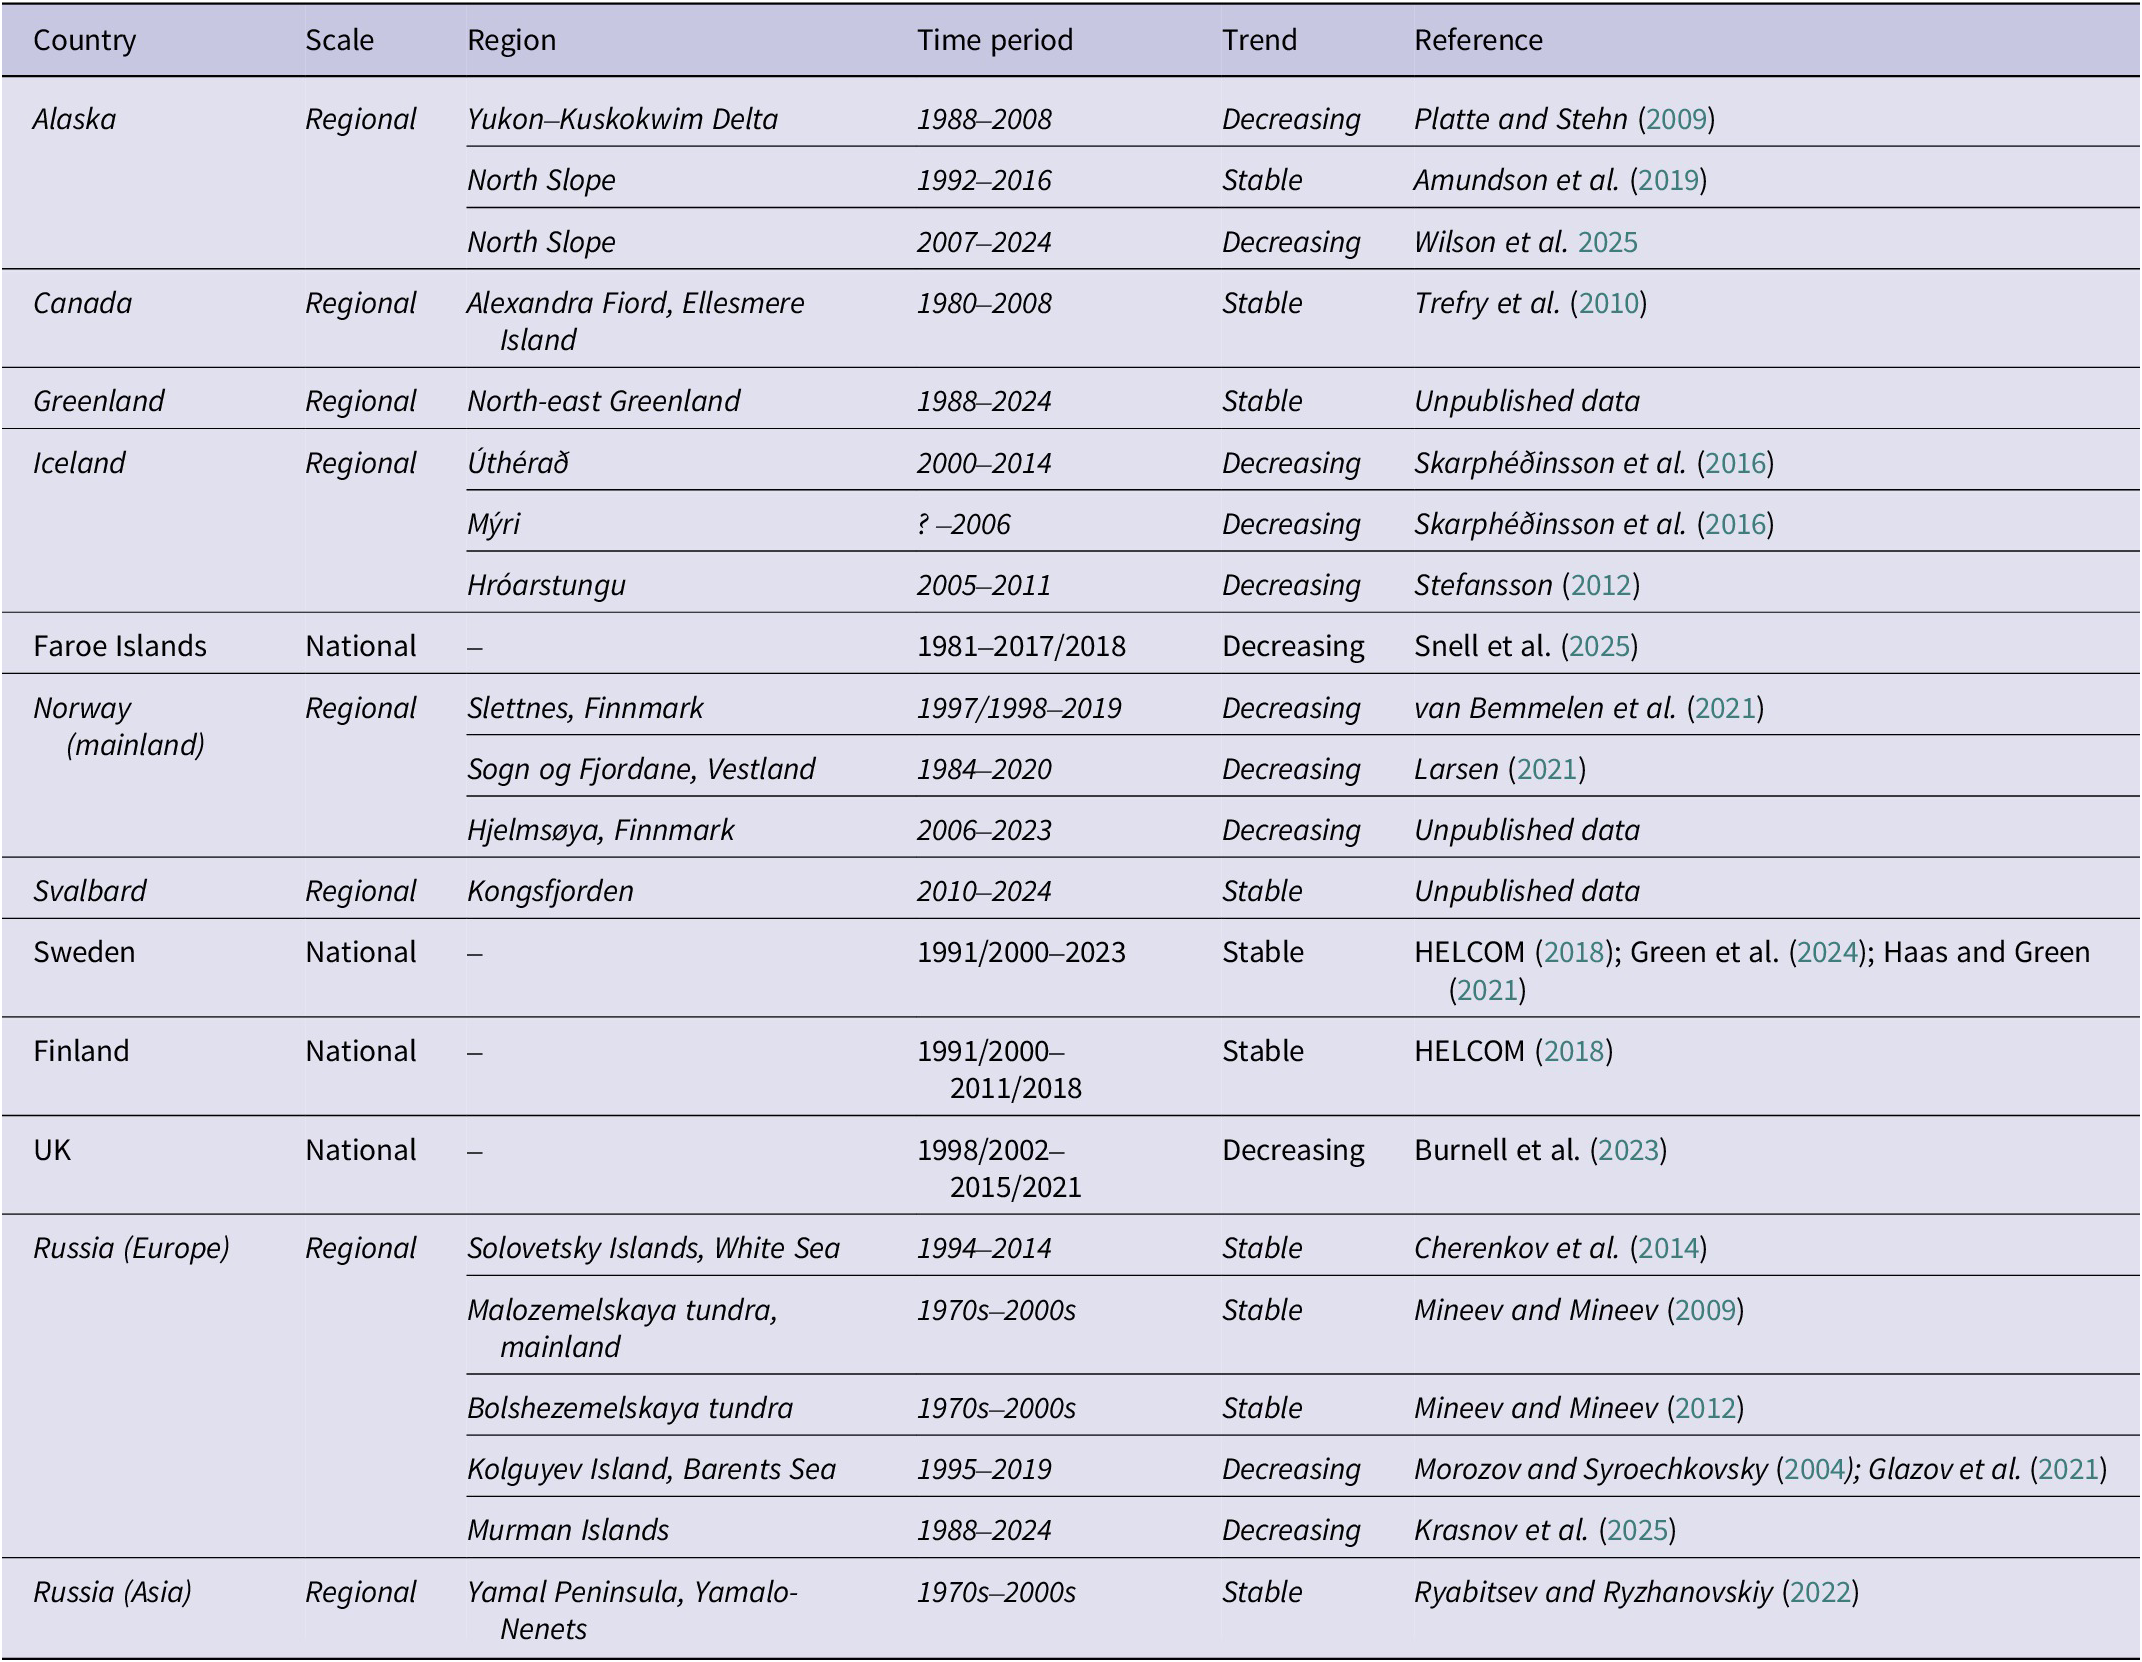
Summary of estimated Arctic Skua breeding populations sizes and trends per country. The top panel plots the estimated size of the breeding population (number of breeding pairs) and colour-coded according to population trajectory. Where a range is given, either as a range estimate, known variance or standard error (SE) calculated from coefficient of variance (CV), this is indicated by whiskers (census data are plotted with a variance of 0). Where a single figure estimate has been published, range is unknown, indicated by *. The bottom panel maps the breeding range of Arctic Skuas (BirdLife International 2016), where pale green indicates Asian Russia where abundance is uncertain. National population trends are colour coded by population trajectory. The location of study sites where Arctic Skua numbers are monitored in countries where no population trends are available at a national scale are indicated.

Estimates of Arctic Skua breeding population per country. Data quality categories are based on slightly tweaked Birdlife International data quality criteria used in IUCN Red List assessments as follows: A = Based on reliable and complete or representative quantitative data; B = Based on reliable but incomplete or partially representative quantitative data; C = Based on qualitative information, potentially unreliable/unrepresentative quantitative data, or quantitative data extrapolated from similar populations. AOTs = Apparently Occupied Territories. * Norway - coast only.

Canada
The continuous breeding range, totalling c.3 million km2 (BirdLife International 2016) (Figure 2), of the Arctic Skua in tundra habitats along coasts and inland regions of Canada and Alaska supports a large proportion of the global breeding population. Plot-based surveys were carried out across Arctic Canada under the PRISM program between 1994 and 2018, where 2,528 plots (12–16 ha) were surveyed across a 2.6 million km² study area (Smith et al. Reference Smith, Bart, Johnston, Aubry, Brown and Francis2025). This area encompasses the entire range of the Arctic Skua in Canada, with the exception of northern Labrador, along the north Atlantic Coast. The surveys recorded 102 Arctic Skuas, yielding a national population estimate of 475,000 (CV = 0.38) individuals (potentially including some non-breeding birds) (Table 1 and Figure 3). A simplistic conversion of individuals to breeding pairs, assuming that all individuals encountered were breeding birds, yields 237,500 pairs (SE = 147,250–327,750) (Smith et al. Reference Smith, Bart, Johnston, Aubry, Brown and Francis2025). Densities in wet habitat were 2.5 birds/km², in contrast to 0.4 birds/km² and 0.2 birds/km² in moist and dry habitats, respectively (Smith et al. Reference Smith, Bart, Johnston, Aubry, Brown and Francis2025). While densities were lower in the latter habitats, 61% of the population was estimated to occur here due to the vast extent of this habitat in northern Canada. The areas of high densities in coastal wetlands are often associated with large populations of nesting Snow Geese Anser caerulescens and Ross’s Geese Anser rossii which provide more feeding opportunities, especially through the stealing of eggs (Flemming et al. Reference Flemming, Nol, Kennedy, Bedard, Giroux and Smith2019; Martin and Barry Reference Martin and Barry1978; Parmelee et al. Reference Parmelee, Stephens and Schmidt1967). The national estimate for Canada is likely an underestimate given that northern Labrador was not surveyed. However, given the uncertainty in the estimates and the small size of northern Labrador compared with the provinces surveyed, it is unlikely that the exclusion of northern Labrador would greatly alter the estimate.
Greenland
The distribution of Arctic Skuas in Greenland is exclusively coastal, occupying snow- and ice-free lowlands and archipelagos across most of the latitudinal gradient of the country (Boertmann et al. Reference Boertmann1994, Reference Boertmann, Merkel and Gilg2020). Similarly to Alaska and Canada, breeding densities are low with mostly isolated pairs, although small (≤5 pairs) and loose colonies are found in some of the extensive archipelagos (Boertmann et al. Reference Boertmann, Merkel and Gilg2020). Wiley and Lee (Reference Wiley, Lee and Billerman2020) reported between 5,000 and 10,000 breeding pairs for the whole country. However, ground and aerial surveys undertaken between 2004 and 2016 suggest a much smaller breeding population, with an estimated 200 breeding pairs in North and East Greenland (i.e. along more than half of the Greenland coastline; Boertmann et al. Reference Boertmann, Merkel and Gilg2020), and an estimated 1,000 pairs possibly breeding along the west coast (unpublished data). While these surveys did not cover all potential breeding sites, the breeding population of Arctic Skuas in Greenland is likely much smaller than suggested by Wiley and Lee (Reference Wiley, Lee and Billerman2020) (Table 1 and Figure 3).
Iceland
A handful of whole-country estimates of breeding population size have been published since the 1970s, the most recent being in 2016 where the density of breeding Arctic Skuas was modelled across habitat types yielding an estimate of 11,000 breeding pairs (Skarphéðinsson et al. Reference Skarphéðinsson, Katrínardóttir, Guðmundsson and Auhage2016) (Table 1 and Figure 3). Arctic Skuas are widespread throughout coastal and inland regions. Breeding densities are generally low at approximately 1 pair/km2 in lowland areas and much less at higher elevations (Skarphéðinsson et al. Reference Skarphéðinsson, Katrínardóttir, Guðmundsson and Auhage2016). However, higher densities are found in some areas of east Iceland which hold large proportions of the country’s population (Guðmundsson et al. Reference Guðmundsson, Magnússon, Egilsson, Stefánsson and Skarphéðinsson2001).
Faroe Islands
Arctic Skuas have historically bred throughout the islands in dense colonies: range 47–181 Apparently Occupied Territories (AOTs)/km2 (dos Santos Reference dos Santos2018). The most recent comprehensive census of breeding Arctic Skuas was undertaken in 2017 and 2018 through nest counts and vantage point surveys, where all historical and extant skua colonies were visited and mapped, yielding a total of 207 AOTs for the entire archipelago (Snell et al. Reference Snell, dos Santos, van Bemmelen, Moe and Thorup2025) (Table 1 and Figure 3). Arctic Skuas were found in seven sites on seven islands, forming colonies of between 9 and 49 AOTs (dos Santos Reference dos Santos2018).
Norway
No comprehensive national censuses have been carried out in Norway. Arctic Skuas breed both along the coast and inland in mountainous regions, which are often challenging to reach. In mainland Norway, Arctic Skuas have historically formed large colonies at coastal sites next to large aggregations of other seabirds, such as Slettnes and Hjelmsøya in Finnmark, where c.250 breeding pairs of Arctic Skua were present in 1997–1998 in an area of c.5.5 km2, and 220 breeding pairs were present in 2006 in an area of c.1 km2, respectively (van Bemmelen et al. Reference van Bemmelen, Schekkerman, Hin, Pot, Janssen and Ganter2021; unpublished data). However, most colonies are smaller, comprising 20–30 pairs (unpublished data). The most recent estimates for mainland Norway, though with large uncertainties, are 5,000–10,000 (Shimmings and Øien Reference Shimmings and Øien2015) and 2,000 breeding pairs (coastal population only; Anker-Nilssen et al. Reference Anker‐Nilssen, Barrett, Lorentsen, Bustnes, Christensen‐Dalsgaard and Deschamps2015) (Table 1 and Figure 3).
Svalbard
In Svalbard, Arctic Skuas are found in relatively low densities ranging from 0 to 4 nests/km2 (Kongsfjorden; unpublished data), similar to Alaska, Canada, and Greenland. An estimated 1,000 breeding pairs are found and this estimate includes 100 pairs on Bjørnøya and approximately 50 on Jan Mayen (Anker-Nilssen et al. Reference Anker‐Nilssen, Barrett, Lorentsen, Bustnes, Christensen‐Dalsgaard and Deschamps2015; Shimmings and Øien Reference Shimmings and Øien2015) (Table 1 and Figure 3). Suitable habitat is extensive along the coast and in valleys, and Arctic Skuas are found breeding around the entire archipelago. Given the breeding density found in Kongsfjorden, the total population estimate of 1,000 pairs for Svalbard is in all likelihood an underestimate.
Sweden
Arctic Skuas breed along the Baltic coasts of Sweden with lower numbers along the Swedish west coast. Most pairs breed on offshore skerries in low densities (Ottosson et al. Reference Ottosson, Ottvall, Elmberg, Green, Gustafsson and Haas2012). The most recent estimate for Sweden, 564 (447–671) breeding pairs, is from 2012 and is based on complete regional surveys mainly conducted between 2000 and 2010 (Ottosson et al. Reference Ottosson, Ottvall, Elmberg, Green, Gustafsson and Haas2012) (Table 1 and Figure 3).
Finland
In Finland, Arctic Skuas are found in low densities along south-western and western coasts, also on offshore skerries (HELCOM 2018), with a total breeding population of 500–600 pairs estimated in 2006–2010 (Valkama et al. Reference Valkama, Vepsäläinen and Lehikoinen2011) (Table 1 and Figure 3).
UK
A comprehensive census of all breeding seabirds in the UK was undertaken between 2015 and 2021 (Burnell et al. Reference Burnell, Perkins, Newton, Bolton, Tierney and Dunn2023). For Arctic Skuas, 727 AOTs were found in Scotland through ground counts and vantage point surveys (Table 1 and Figure 3). The bulk of the population was in the archipelagos of Shetland, Orkney, and the Western Isles, which respectively held 295, 237, and 133 AOTs, while the remaining territories were on the Scottish mainland or small islands off the west coast (Burnell et al. Reference Burnell, Perkins, Newton, Bolton, Tierney and Dunn2023). Similarly to the populations of the Faroe Islands and some Norwegian sites, Arctic Skuas were largely distributed in colonies, some of largest (19–27 AOTs) being those on Fair Isle and Foula (Shetland), Handa (Sutherland), and Papa Westray (Orkney) (Burnell et al. Reference Burnell, Perkins, Newton, Bolton, Tierney and Dunn2023).
Russia
Arctic Skuas breed along northern coastal and inland areas of Russia. The European Russia (west of the Ural Mountain range, c.66°E; Figure 3) population size is estimated at between c.1,200 and 12,000 breeding pairs (Kalyakin and Voltzit Reference Kalyakin and Voltzit2020; Keller et al. Reference Keller, Herrando, Voříšek, Franch, Kipson and Milanesi2020), and 20,000–60,000 individuals (Mischenko Reference Mischenko2017), although the authors of the latter point out that the quality of the data is poor. There are no estimates of the breeding population size for the Asian region of Russia. Breeding density appears low where data are available, such as in the Yamal Peninsula and near Ob’ forest tundra, with an estimated 0.02–0.3 pairs/km2, depending on latitude and lemming abundance (Ryabitsev and Ryzhanovskiy Reference Ryabitsev and Ryzhanovskiy2022). Given the complete lack of population data for Asian Russia, a crude estimation can be made based on these breeding densities (in line with those of the Nearctic), and the Russian breeding area east of the Urals (c.66°E–170°W; Figure 3) of around 2 million km2 (BirdLife International 2016) (Figure 2), suggesting the breeding population size could range between 40,000 and 600,000 pairs (40,000 being conservative), although this is little more than speculation (Table 1 and Figure 3). Similarly to the Nearctic, a large proportion of the global breeding population of Arctic Skua is expected to breed in Russia due to the apparent large extent of suitable breeding habitat along Arctic coasts and inland regions (BirdLife International 2016).
Global breeding population
Where breeding population data are available, these are presented in the literature as individuals, breeding individuals, breeding pairs or AOTs, which we have combined to present global figures as breeding pairs. However, we acknowledge that surveys that only report individuals may include non-breeding birds (e.g. Alaska and Canada), and thus our conversion to breeding pairs is simplistic and may slightly overestimate the number of breeding pairs for those areas. Given the extreme uncertainty in the Asian Russia breeding estimate, it would not be appropriate to combine it with higher quality estimates that were reached through surveys and modelling in the rest of the breeding range. Therefore, we present a global breeding population as two estimates, one covering Alaska, Canada, Greenland, and Europe, yielding a minimum of 185,131–395,315 breeding pairs, and an extrapolated conservative estimate for Asian Russia of 40,000 breeding pairs (Table 1).
Population trends
As the second half of the twentieth century was a key period for the establishment of seabird monitoring across countries, and thus most available data globally is from the 1970s onwards, here we collate known changes in the breeding population of Arctic Skuas over the last 50 years.
Alaska
Annual aerial surveys undertaken between 1992 and 2016 along the North Slope of Alaska, covering 90,000 km² between the Chukchi and Southern Beaufort Seas and the Canadian border, suggested that the populations of all skua species combined (Arctic Skua, Long-tailed Skua Stercorarius longicaudus, and Pomarine Skua S. pomarinus) remained stable over this time (Amundson et al. Reference Amundson, Flint, Stehn, Platte, Wilson and Larned2019). A recent update of results from this same survey scheme includes estimates from 2017 to 2024 (Wilson et al. Reference Wilson, Safine, Frost and Osnas2025) and demonstrated with high statistical confidence that skua numbers had declined from a long-term average (2007–2024) of 8,174 (SE = 602) to a three-year average (2022–2024) of 5,833 (SE = 484). This decline is equivalent to an annual growth rate of 0.96 (CI = 0.94–0.98) (Wilson et al. Reference Wilson, Safine, Frost and Osnas2025). Similar aerial surveys carried out at the Yukon–Kuskokwim Delta reported a decline of 34% in the long-term average between 1988 and 2008) (Platte and Stehn Reference Platte and Stehn2009). Overall, the large-scale aerial surveys undertaken over much of Alaska demonstrated with high confidence that skua species have declined in recent decades. However, surveys were conducted during the first three weeks of June and thus may be skewed toward Long-tailed Skuas which are the earliest of the three species to arrive and lay. Trend data derived from ebird, which account for changes in the observation process typical of community science data, reported a median decline in relative abundance of 16.6% between 2012 and 2022 along coastal regions of Alaska, during the early breeding season (14–28 June) (Fink et al. Reference Fink, Auer, Johnston, Strimas-Mackey, Ligocki and Robinson2023) (Table 2 and Figure 3). Given the relatively scarce and geographically limited observations of this species in ebird, it is not possible to confidently determine the population trend of Arctic Skuas, or disentangle trends from other skua species in this region.
Trends in Arctic Skua populations
Canada
In Canada, the Arctic Skua is considered to be a Data Deficient species with no information on national population trends (Environment and Climate Change Canada 2019). Regionally, at the study site of Alexandra Fiord, Ellesmere Island, the abundance of Arctic Skuas did not change between 1980 and 2008 (Trefry et al. Reference Trefry, Freedman, Hudson and Henry2010). Ebird trend data reported a (non-significant) median decrease of 3% in relative abundance between 2012 and 2022 (14–28 June), although data are limited to very few coastal areas in Hudson Bay and Nunavik (Fink et al. Reference Fink, Auer, Johnston, Strimas-Mackey, Ligocki and Robinson2023) (Table 2 and Figure 3) and thus cannot be considered representative at a national scale.
Greenland
Although based on few pairs, the only time series available on breeding Arctic Skuas comes from East Greenland where the Groupe de Recherche en Ecologie Arctique has been monitoring seabirds at several sites since 1979 (see details in Boertmann et al. Reference Boertmann, Merkel and Gilg2020). In this region, where coastal Arctic Skuas only breed in single pairs, four breeding sites have been regularly visited over the last 15–45 years. In the Karupelv Valley (study area of 20 km²) and Hochstetter Forland (18 km²), where uninterrupted monitoring has been carried out since 1988 and 2010, respectively, numbers have remained stable, with 1–3 pairs per year in the Karupelv Valley and one pair at Hochstetter. It should be noted that a pair was already breeding at the first site in 1979, while at the second site the species was not breeding in 1976 (Meltofte et al. Reference Meltofte, Elander and Hjort1981). At Ymers Ø (8 km²) and Mestersvig (5 km²), where observations have been undertaken for more than 10 years, the number of pairs (1–3) has remained stable (unpublished data) (Table 2 and Figure 3). While the quality of the monitoring data at these sites is high, since they are based on absolute counts of breeding pairs, their spatial extent is very limited. As such, they provide only a localised snapshot of trends in parts of north-east Greenland and cannot be considered representative of population trends across Greenland as a whole.
Iceland
At least three national estimates of breeding population size have been published since the 1970s, and available estimates have been relatively consistent, ranging between 4,000 and 12,000 breeding pairs (Asbirk et al. Reference Asbirk1997; Bengston and Owen Reference Bengtson and Owen1973), with the most recent one from 2016 estimating 11,000 breeding pairs (Skarphéðinsson et al. Reference Skarphéðinsson, Katrínardóttir, Guðmundsson and Auhage2016). However, these have employed different methodologies and the first two have large uncertainty around the estimates. Consequently, direct comparisons among them are problematic, and they may not provide a reliable indicator of population trends at a national scale. More localised monitoring at breeding sites – such as Úthérað in east Iceland and Mýri in south-west Iceland – has indicated population declines, although the magnitude of change for these regions is not reported (Skarphéðinsson Reference Skarphéðinsson2018; Skarphéðinsson et al. Reference Skarphéðinsson, Katrínardóttir, Guðmundsson and Auhage2016). At the smaller study site of Hróarstungu in north-east Iceland, breeding numbers fluctuated between 0 and 40 pairs from 2005 to 2011, with a net loss of 25 pairs over the study period (Stefansson Reference Stefansson2012) (Table 2 and Figure 3). Overall, these limitations imply that robust national-scale population trends cannot be reliably inferred from the currently available data.
Faroe Islands
Two comprehensive censuses of breeding Arctic Skuas have been undertaken in the Faroe Islands in recent decades with the aim of quantifying changes in population size, the first in 1981 (Benston and Bloch Reference Bengtson and Bloch2003) and most recently in 2017–2018 (Snell et al. Reference Snell, dos Santos, van Bemmelen, Moe and Thorup2025). During the second census, all historical and extant breeding colonies were visited and Arctic Skuas were surveyed following protocols in the Seabird Monitoring Handbook developed for Britian and Ireland (Walsh et al. Reference Walsh, Halley, Harris, del Nevo, Sim and Tasker1995), revealing a decline from 1,145 to 207 AOTs (-82%) (Snell et al. Reference Snell, dos Santos, van Bemmelen, Moe and Thorup2025) (Table 2 and Figure 3). Over this period, many colonies were lost, from over 60 across most of the archipelago to just seven, with large-scale losses of breeding pairs occurring uniformly across large and small colonies (dos Santos Reference dos Santos2018).
Norway
Arctic Skuas are currently classified as “Vulnerable” for mainland Norway in the Norwegian Red List of Species (Strøm et al. Reference Strøm, Stokke, Dale, Jacobsen, Lislevand and Solvang2021). This status is due to assumed strong declines in coastal populations in all parts of the country (Table 2 and Figure 3). Few Arctic Skuas are left in the south and west (Strøm et al. Reference Strøm, Stokke, Dale, Jacobsen, Lislevand and Solvang2021). The number of breeding individuals in Sogn og Fjordane on the west coast declined from 62 in 1984 to just two in 2020 (Larsen Reference Larsen2021). It is also evident that breeding numbers in Finnmark, a northern region where most Arctic Skuas breed, are declining: the colony at Slettnes declined from an estimated 250 breeding pairs in 1997–1998 to 112 AOTs in 2019 (van Bemmelen et al. Reference van Bemmelen, Schekkerman, Hin, Pot, Janssen and Ganter2021). Furthermore, only 37 active nests of the 112 AOTs were located in 2019 (van Bemmelen et al. Reference van Bemmelen, Schekkerman, Hin, Pot, Janssen and Ganter2021). On the island of Hjelmsøya, breeding pairs declined from 220 in 2006 to just 10 in 2023 (unpublished data). While no national-scale population trends have been estimated, these absolute counts of Arctic Skua territories at key breeding sites along Norway’s coast provide a strong indication that substantial population declines have occurred at a national scale, at least in the coastal population, which is reflected in the Norwegian Red List of Species.
Svalbard
In Svalbard, Arctic Skuas are classified as “Least Concern” in the Norwegian Red List of Species, and the population is assumed to be stable (Strøm et al. Reference Strøm, Stokke, Dale, Jacobsen, Lislevand and Solvang2021). In Kongsfjorden, where uninterrupted monitoring has been carried out since 2010 in an area of c.18 km2 of suitable habitat, the number of active nests has hovered at around 20, with 18 recorded in 2024 and no linear trend detected between 2010 and 2024 (unpublished data) (Table 2 and Figure 3). However, while these data are of high quality (annual counts of territorial pairs), they are limited to a single site, and therefore these observations provide only a localised snapshot; caution is warranted when assuming that Arctic Skuas are stable across Svalbard.
Sweden and Finland
At a Baltic Sea scale, which includes parts of both Sweden and Finland, annual monitoring of 585 breeding sites during two periods (1991–2000 and 2011–2018) showed a slight increase in Arctic Skua abundance. During the second survey period, the abundance index was above one in all years of the survey, with a mean annual population growth rate of 1.011 (SE = 0.009) (HELCOM 2018; Ottosson et al. Reference Ottosson, Ottvall, Elmberg, Green, Gustafsson and Haas2012; Valkama et al. Reference Valkama, Vepsäläinen and Lehikoinen2011). In Sweden, the national population size has been stable between 2015 and 2023 (Green et al. Reference Green, Haas and Lindström2024), but differing trends are found between the north and south-west of the country. In the Gulf of Bothnia, there was a slight increase in population size between 2010 and 2020 (Haas and Green Reference Haas and Green2021). However, along the Swedish west coast Arctic Skuas have declined by >80%, from around 80 to 15 breeding pairs between 2002 and 2021 (Åhlund Reference Åhlund2023) (Table 2 and Figure 3).
UK
Since 1985 there have been three comprehensive censuses of Artic Skua populations (Burnell et al. Reference Burnell, Perkins, Newton, Bolton, Tierney and Dunn2023; Lloyd et al. Reference Lloyd, Tasker and Partridge1991, Mitchell et al. Reference Mitchell, Newton, Ratcliffe and Dunn2004). Declines have been recorded in the number of AOTs, falling from 3,388 AOTs in 1985–1988 to 2,141 AOTs in 1998–2002, followed by a steeper decline to 727 AOTs in 2015–2021 (Table 2 and Figure 3). Additionally, annual estimates of population abundance of Arctic Skua from the Seabird Monitoring Program at selected seabird colonies (n = 10–11) demonstrated a consistent decline in the number of AOTs since 1992, to a low of 83% below the 1986 baseline in 2023 (Harris et al. Reference Harris, Baker, Balmer, Bolton, Burton and Caulfield2024). Almost complete coverage of all sites surveyed during Mitchell et al. (Reference Mitchell, Newton, Ratcliffe and Dunn2004) was achieved by Burnell et al. (Reference Burnell, Perkins, Newton, Bolton, Tierney and Dunn2023) using the same methodology. Therefore, confidence about population changes presented in Burnell et al. (Reference Burnell, Perkins, Newton, Bolton, Tierney and Dunn2023) is high. The Arctic Skua is the fastest declining seabird in the UK, warranting its inclusion in the UK Red List of Birds of Conservation Concern (Stanbury et al. Reference Stanbury, Burns, Aebischer, Baker, Balmer and Brown2024).
Russia
The national population trend of breeding Arctic Skuas is unknown for both European and Asian Russia (Mischenko Reference Mischenko2017). Regionally, on the Solovetsky Islands in the White Sea, and on the mainland of the European Russian Arctic, the population is considered stable at 0.02–2.29 pairs/km2 (Cherenkov et al. Reference Cherenkov, Seamashko and Tertitski2014; Mineev and Mineev Reference Mineev and Mineev2009, Reference Mineev and Mineev2012). In contrast, on Kolguyev Island in the Barents Sea, the density of breeding pairs was considered stable between 1995 and 2006–2008, after which a decrease from 0.50 to 0.14 pairs/km2 between 2006 and 2019 was reported (Glazov et al. Reference Glazov, Loshchagina, Kondratyev, Zaynagutdinova, Kruckenberg and Pokrovsky2021; Morozov and Syroechkovsky Reference Morozov and Syroechkovsky2004). In the Yamal peninsula, Asian Russia, Arctic Skua populations are reportedly stable (Ryabitsev and Ryzhanovskiy Reference Ryabitsev and Ryzhanovskiy2022) (Table 2 and Figure 3). On Kharlov Island (Murman Islands), a 71% decline by 2024 was recorded, whereas in coastal tundras of Western Murman the population remained relatively stable at 1–2 pairs per 10 km of survey route during 2010–2023, and in Eastern Murman (Gavrilov Islands area) local disappearances were noted in 2017–2023 (Krasnov et al. Reference Krasnov, Nikolaeva and Ezhov2025) (Table 2 and Figure 3). These data provide only a localised snapshot of a few study sites and cannot be considered representative of population trends at a national scale.
Summarising the global population trend
In the UK and the Faroe Islands, where comprehensive national censuses have been conducted, Arctic Skua populations have declined by more than 80% in recent decades. Similarly steep declines have been reported at key sites along Sweden’s west coast, parts of Iceland, and the Norwegian coast; regions that share the North Atlantic basin and where Arctic Skuas exhibit comparable kleptoparasitic foraging strategies during the breeding season. No nationally representative trend data exist for Canada, Russia or Greenland, where monitoring is restricted to very few sites, although populations appear broadly stable at these locations. In Alaska, large-scale population declines have been documented over recent decades; however, these surveys did not differentiate among skua species, limiting the ability to assess trends specifically for Arctic Skua breeding abundance. Overall, there is a clear cluster of declining populations in the North Atlantic, where data quality is higher. Substantial knowledge gaps remain for many inland and coastal Arctic populations, which may be more stable, but this inference could be the result of low power to detect change from limited evidence (Table 2 and Figure 3).
Drivers of population change
Seabirds are one of the most threatened taxonomic groups globally due to direct and indirect anthropogenic pressures: 56% of the 362 species for which there are trend data are in decline, including several species currently classified as Least Concern in the IUCN Red List (Phillips et al. Reference Phillips, Fort, Dias, Young and van der Werf2023). The major threats seabirds face are environmental change, overfishing, invasive species, hunting, disease, pollution, and habitat loss/disturbance (Dias et al. Reference Dias, Martin, Pearmain, Burfield, Small and Phillips2019; Phillips et al. Reference Phillips, Fort, Dias, Young and van der Werf2023). The Arctic Skua, as a long-distance migratory species which inhabits vast terrestrial and marine regions of the Holarctic during the breeding season, and largely global pelagic and coastal waters during non-breeding, is likely exposed to a range of these anthropogenic threats (Figures 2 and 4).
Schematic representation of the range of known and potential anthropogenic threats faced by Arctic Skuas. Ranges of low density, generalist foraging populations (purple) and coastal, largely kleptoparasitic populations (orange) based on the literature herein, are a simplified stratification for visualising purposes (see Introduction). Confidence of threat on population trends has been assigned as follows: High – empirical evidence supporting a driver of Arctic Skua population level processes; Medium – empirical data for a proximate mechanism of population change; Low – expected effect based on studies in similar species, or speculated.
Region of study: 1Arctic breeding range; 2North Sea; 3Faroe Islands; 4Scotland; 5Norway and Svalbard; 6Iceland; 7Baltic Sea; 8Russia; 9Nearctic; 10Canada; 11Alaska.
References by region and threat group: Bottom-up processes – Gauthier et al. (Reference Gauthier, Ehrich, Belke-Brea, Domine, Alisauskas and Clark2024)1, Davis et al. (Reference Davis, Nager and Furness2005)2, Snell et al. (Reference Snell, dos Santos, van Bemmelen, Moe and Thorup2025)3, Ruffino et al. (Reference Ruffino, Oksanen, Hoset, Tuomi, Oksanen and Korpimäki2016)5, Glazov et al. (Reference Glazov, Loshchagina, Kondratyev, Zaynagutdinova, Kruckenberg and Pokrovsky2021)8; Maher et al. (Reference Maher1974)11, Pearce et al. (Reference Pearce, Dooley, Patil, Sformo, Daniels and Greene2022)11, Smith et al. (Reference Smith, Smith, Andres, Francis, Harrington and Friis2023)11; Fisheries and Bottom-up processes – Furness and Tasker (Reference Furness and Tasker2000)2, Monaghan (Reference Monaghan1992)2, Rindorf et al. (Reference Rindorf, Wanless and Harris2020)2, Perkins et al. (Reference Perkins, Ratcliffe, Suddaby, Ribbands, Smith and Ellis2018)4, Fauchald et al. (Reference Fauchald, Anker-Nilssen, Barrett, Bustnes, Bårdsen and Christensen-Dalsgaard2015)5, van Bemmelen et al. (Reference van Bemmelen, Schekkerman, Hin, Pot, Janssen and Ganter2021)5, Skarphéðinsson (Reference Skarphéðinsson2018)6; Heat stress – Snell et al. (Reference Snell, Aldará, Hammer and Thorup2024)3; Predation/competition – Perkins et al. (Reference Perkins, Ratcliffe, Suddaby, Ribbands, Smith and Ellis2018)4, Veitch et al. (Reference Veitch, Clout, Martin, Russell and West2019)4, van Bemmelen et al. (Reference van Bemmelen, Schekkerman, Hin, Pot, Janssen and Ganter2021)5, Nordström et al. (Reference Nordström, Högmander, Laine, Nummelin, Laanetu and Korpimäki2003)7, Birt and Cairns (Reference Birt and Cairns1987)10, Birkhead and Nettleship (Reference Birkhead and Nettleship1995)10; Hunting – Merkel and Barry (Reference Merkel and Barry2008)1, Hammer et al. (Reference Hammer, Madsen, Jensen, Pedersen, Bloch and Thorup2014)3, Priest and Usher (Reference Priest and Usher2004)9; Land-use change – Furness (Reference Furness1987)4, Ims and Henden (Reference Ims and Henden2012)5; Energy infrastructure – Furness et al. (Reference Furness, Wade and Masden2013)2; Disease – Dias et al. (Reference Dias, Martin, Pearmain, Burfield, Small and Phillips2019)1, Harvell et al. (Reference Harvell, Mitchell, Ward, Altizer, Dobson and Ostfeld2002)1, Gorta et al. (Reference Gorta, Berryman, Kingsford, Klaassen and Clarke2024)1; Contaminants – Bustnes et al. (Reference Bustnes, B-J, Moe, Herzke, van Bemmelen and Tulp2025)1.

Food availability and environmental change
Understanding the impacts of environmental change and food availability on the population dynamics of Arctic Skuas is complex due to the different ecoregions Arctic Skuas inhabit and the composition and abundance of the wide range of prey species they exploit (De Korte Reference De Korte1972; Furness Reference Furness1987; Hussell Reference Hussell1972; Løvenskiold Reference Løvenskiold1964; Perkins et al. Reference Perkins, Ratcliffe, Suddaby, Ribbands, Smith and Ellis2018; Salter et al. Reference Salter, Gollop, Johnson, Koski and Tull1980; Taylor Reference Taylor1974; Wiley and Lee Reference Wiley, Lee and Billerman2020). Based on a diet study spanning coastal and inland areas of Alaska, Arctic Skuas across inland areas of Canada and Russia may feed predominantly on other birds, including passerines, shorebirds, and the eggs and chicks of waterfowl and shorebirds, as well as small mammals (Maher Reference Maher1974; Young et al. Reference Young, Kennedy, Smith and Nol2021). In years with an abundance of lemmings, voles, and other small mammals, these can make up the bulk of the diet, although the reliance of Arctic Skuas on mammals is less than that of Long-tailed and Pomarine Skuas which are highly specialised (Maher Reference Maher1974). In areas of shrubby tundra, the density of Willow Ptarmigan Lagopus lagopus may be a determinant of Arctic Skua abundance (Glazov et al. Reference Glazov, Loshchagina, Kondratyev, Zaynagutdinova, Kruckenberg and Pokrovsky2021). In coastal populations of the Arctic, Arctic Skuas may directly predate a range of species or may kleptoparasitise other seabirds and waterfowl if these are abundant, or a combination of the two (PAS, personal observation 2025). In the North Atlantic, Arctic Skuas are predominantly kleptoparasites of other seabirds, stealing forage fish (e.g. Ammodytes, Clupeidae, Gadidae, and Osmeridae) from auks, gulls, and terns to feed themselves and their offspring throughout the breeding period, sometimes supplemented with terrestrial prey items (Furness Reference Furness1987; Ruffino et al. Reference Ruffino, Oksanen, Hoset, Tuomi, Oksanen and Korpimäki2016). Consequently, environmental change and resulting shifts in prey availability are likely to have differential effects on specialised marine kleptoparasitic populations and more generalist populations that exploit both terrestrial and marine prey during the breeding season.
The drivers of population change of Arctic Skuas are better understood in the kleptoparasitic populations of the North Atlantic which have been studied over several decades. Here, bottom-up processes relating to changes in the hydroclimatic conditions of the ocean due to global warming, alongside industrial fishing, have impacted the life history and abundance of key forage fish, causing food shortages for seabirds (Furness and Tasker Reference Furness and Tasker2000; Krasnov et al. Reference Krasnov, Nikolaeva and Ezhov2025; Monaghan Reference Monaghan1992; Perkins et al. Reference Perkins, Ratcliffe, Suddaby, Ribbands, Smith and Ellis2018; Rindorf et al. Reference Rindorf, Wanless and Harris2020). Consequently, substantial declines in key host species such as Arctic Tern Sterna paradisaea, Black-legged Kittiwake Rissa tridactyla, Common Guillemot Uria aalge, Razorbill Alca torda, and Atlantic Puffin Fratercula arctica throughout much of their North Atlantic breeding range similarly impact Arctic Skua populations as kleptoparasitism opportunities decline with decreasing forage fish and seabird numbers (Fauchald et al. Reference Fauchald, Anker-Nilssen, Barrett, Bustnes, Bårdsen and Christensen-Dalsgaard2015; Krasnov et al. Reference Krasnov, Nikolaeva and Ezhov2025; Perkins et al. Reference Perkins, Ratcliffe, Suddaby, Ribbands, Smith and Ellis2018; Skarphéðinsson Reference Skarphéðinsson2018; van Bemmelen et al. Reference van Bemmelen, Schekkerman, Hin, Pot, Janssen and Ganter2021). Dwindling marine resources is a primary driver of low breeding success in several European populations of Arctic Skuas, underpinning most observed population declines (Perkins et al. Reference Perkins, Ratcliffe, Suddaby, Ribbands, Smith and Ellis2018; van Bemmelen et al. Reference van Bemmelen, Schekkerman, Hin, Pot, Janssen and Ganter2021).
Little is known about the demographic responses of more generalist populations to potential fluctuations in prey availability in Alaska, Canada, and Russia, which hold most of the breeding population. As the abundance and distribution of tundra-dwelling biota change in response to environmental conditions (Smith et al. Reference Smith, McKinnon, Meltofte, Lanctot, Fox and Leafloor2020; van Beest et al. Reference van Beest, Beumer, Andersen, Hansson and Schmidt2021), populations with different foraging strategies will likely have different outcomes, as has been observed between marine kleptoparasitic populations and more generalist populations (Perkins et al. Reference Perkins, Ratcliffe, Suddaby, Ribbands, Smith and Ellis2018; Trefry et al. Reference Trefry, Freedman, Hudson and Henry2010). Even among generalist populations, different trends may be expected given the variability of population trajectories among prey species such as the massive fluctuations in numbers of breeding geese in the Canadian Arctic, declining populations of shorebirds throughout the Nearctic, or stochastic cycles of abundance in small mammals (Gauthier et al. Reference Gauthier, Ehrich, Belke-Brea, Domine, Alisauskas and Clark2024; Lehikoinen et al. Reference Lehikoinen, Brotons, Calladine, Campedelli, Escandell and Flousek2019; Maher Reference Maher1974; Pearce et al. Reference Pearce, Dooley, Patil, Sformo, Daniels and Greene2022; Smith et al. Reference Smith, Smith, Andres, Francis, Harrington and Friis2023). Cyclic fluctuations in small mammals are a central driver of predator abundance and breeding success in tundra ecosystems, particularly for specialised avian predators (Korpimäki Reference Korpimäki1994). However, there is growing evidence that environmental change has disrupted these cycles, largely through changes in climatic and vegetation dynamics (Henden et al. Reference Henden, Ims, Fuglei and Pedersen2017; Ims et al. Reference Ims, Henden and Killengreen2008; Kausrud et al. Reference Kausrud, Mysterud, Steen, Vik, Østbye, Cazelles, Framstad, Eikeset, Mysterud, Solhøy and Stenseth2008). Whilst Arctic Skuas are not as specialised on small mammals as Pomarine or Long-tailed Skuas (Maher Reference Maher1974), they may still be affected by reduced abundance or dampened cycles of small mammals in Arctic habitats.
Food availability during the breeding period can have a positive relationship with the inter-annual survival of Arctic Skuas (see supplementary feeding experiments by Davis et al. Reference Davis, Nager and Furness2005). In the Faroe Islands, capture-mark-recapture (CMR) survival models indicated long-term declines in the survival of all Arctic Skua age classes, with environmental conditions in their wintering range influencing first-year survival. While the ultimate drivers of this relationship remain unknown, food availability and migratory conditions were speculated to underlie this trend (Snell et al. Reference Snell, dos Santos, van Bemmelen, Moe and Thorup2025).
Arctic regions, which hold most of the Arctic Skua breeding distribution, are warming faster than most other areas of the planet (Rantanen et al. Reference Rantanen, Karpechko, Lipponen, Nordling, Hyvärinen and Ruosteenoja2022), and polar seabirds may have little plasticity to cope with direct and indirect consequences of such warming during the breeding season when they are geographically constrained by incubation, chick rearing, and central-place foraging (Choy et al. Reference Choy, O’Connor, Gilchrist, Hargreaves, Love and Vézina2021; Whelan et al. Reference Whelan, Hatch, Gaston, Gilchrist and Elliott2022). Near the southern limit of their breeding range, Arctic Skuas initiated energetically expensive thermoregulatory panting at relatively low air temperatures while incubating (Snell et al. Reference Snell, Aldará, Hammer and Thorup2024). Heat stress is increasingly reported in other seabirds, including Great Skuas Stercorarius skua, and may result in reduced chick guarding or increased time spent bathing, leading to higher predation risk and ultimately lower productivity through egg loss or chick mortality (Lewden et al. Reference Lewden, du Fretay and Stier2024; Olin et al. Reference Olin, Dück, Berglund, Karlsson, Bohm and Olsson2024; Oswald et al. Reference Oswald, Bearhop, Furness, Huntley and Hamer2008). Indirectly, a warming Arctic may trigger changes in snow and rainfall patterns, altering when breeding grounds become available to Arctic Skuas and their prey. Increases in the likelihood of extreme weather events and flooding may cause nest/chick losses, predator–prey mismatches, and increases in thermoregulatory costs for Arctic Skuas (Chmura et al. Reference Chmura, Krause, Pérez, Asmus, Sweet and Hunt2018; Demongin et al. Reference Demongin, Poisbleau, Strange and Quillfeldt2010; Descamps et al. Reference Descamps, Tarroux, Varpe, Yoccoz, Tveraa and Lorentsen2015). Furthermore, increasing temperatures are leading to the northwards shift of marine and terrestrial species in the Arctic, including Arctic Skua prey species, with potential consequences for the energetics and movements of seabirds such as skuas (Clairbaux et al. Reference Clairbaux, Fort, Mathewson, Porter, Strøm and Grémillet2019; van Beest et al. Reference van Beest, Beumer, Andersen, Hansson and Schmidt2021).
Interspecific interactions
Mortality of Arctic Skua adults, chicks, and eggs due to interspecific competition and predation impact population sizes at regional and local scales. Invasive species pose one of the primary threats for seabirds globally (Phillips et al. Reference Phillips, Fort, Dias, Young and van der Werf2023), and their removal from offshore islands has proven highly beneficial to breeding seabirds and shorebirds, including Arctic Skuas in the Baltic Sea (Nordström et al. Reference Nordström, Högmander, Laine, Nummelin, Laanetu and Korpimäki2003; Veitch et al. Reference Veitch, Clout, Martin, Russell and West2019). In Scotland, predation or injury of Arctic Skuas by native Great Skuas, which increased rapidly throughout the twentieth and twenty-first centuries, was associated with lower Arctic Skua breeding success (Perkins et al. Reference Perkins, Ratcliffe, Suddaby, Ribbands, Smith and Ellis2018; Phillips et al. Reference Phillips, Furness and Stewart1998). Great Skuas also indirectly reduce feeding opportunities for Arctic Skuas by predating/kleptoparasiting host species such as Black-legged Kittiwakes and auks, and they outcompete Arctic Skuas from breeding territories due to their larger size and earlier arrival at breeding colonies (Church et al. Reference Church, Furness, Tyler, Gilbert and Votier2019; Dawson et al. Reference Dawson, Macleod, Smith and Ratcliffe2011). Consequently, the abundance and breeding success of Arctic Skuas in some colonies is modulated by both the abundance of Great Skuas and availability of forage fish and host seabirds for feeding opportunities (Dawson et al. Reference Dawson, Macleod, Smith and Ratcliffe2011; Perkins et al. Reference Perkins, Ratcliffe, Suddaby, Ribbands, Smith and Ellis2018). In Slettnes, Norway, predation of clutches by red foxes Vulpes vulpes was a significant driver of breeding outcome, causing almost total breeding failure between 2015 and 2019 (van Bemmelen et al. Reference van Bemmelen, Schekkerman, Hin, Pot, Janssen and Ganter2021). The Hjelmsøya colony (Norway) declined from 220 breeding pairs in 2006 to just 10 in 2023 (unpublished data), attributed to declining numbers of Black-legged Kittiwakes (from 40,000 pairs in 1985 to 100 pairs in 2024), which the Arctic Skuas kleptoparasitise (unpublished data). In the Nearctic, it has been suggested that mammalian predators, notably Arctic foxes Vulpes lagopus and polar bears Ursus maritimus, may drive low densities of Arctic Skua territories at coastal sites where large numbers of potential host seabirds are present (Birt and Cairns Reference Birt and Cairns1987; Birkhead and Nettleship Reference Birkhead and Nettleship1995; Burke et al. Reference Burke, Hedd, Montevecchi and Regular2011).
Hunting
Hunting and egg harvesting of Arctic Skuas are legal in Iceland, although only carried out to protect breeding Eiders Somateria mollisima (Merkel and Barry Reference Merkel and Barry2008). In 2025 Arctic Skuas were excluded from legally hunted species in the Faroe Islands (Faroe Islands Law Database 1954). Approximately 17% of all recoveries of ringed Arctic Skuas in the Faroe Islands were shot birds (Hammer et al. Reference Hammer, Madsen, Jensen, Pedersen, Bloch and Thorup2014), which suggests the number of birds killed was not trivial. Arctic Skuas were shot in numbers in Scotland until the 1950s–1960s, as it was thought they impacted the ability of sheep to graze in productive areas, leading to possible illegal killing in Shetland in the late twentieth century (Furness Reference Furness1987). Despite the likely elimination of this threat since, over the last 50 years, numbers of breeding birds have continued to decline, suggesting that hunting is no longer a current driver of change in Scotland. In Alaska and Canada, subsistence harvest by indigenous peoples is legal, but the species is protected from harvest by non-indigenous people under Federal legislation. No numerical estimates of indigenous harvest for skuas are available (Naves Reference Naves2018), but a study of wildlife harvest in Canada has no records for skuas, suggesting that they are not targeted, and that harvest is minimal (Priest and Usher Reference Priest and Usher2004). Throughout the circumpolar Arctic, other seabirds such as murres, auklets, sea ducks, and gulls are the primary targets of hunters, whereas the number of skuas killed appears much lower (Merkel and Barry Reference Merkel and Barry2008), likely due to Arctic Skuas breeding at low densities and migrating away during the non-breeding period.
Habitat loss and disturbance
The human distribution and breeding Arctic Skua distribution have little overlap as Arctic Skuas occupy vast swathes of tundra and sparsely populated coastlines. However, some populations in Europe have been exposed to land-use changes from sheep farming and increases in human footfall. Human–Arctic Skua conflicts are known to occur in the UK, Faroe Islands, and Iceland, although these tend to be extensions from conflicts of humans with Great Skuas, and have occasionally been perceived to negatively impact sheep farming (see Hunting above; Furness Reference Furness1987).
The transformation of breeding habitats through agriculture and the introduction of grazing animals has significantly reduced vegetation cover in coastal and mountainous regions (Ims and Henden Reference Ims and Henden2012). Such changes have resulted in disturbed landscapes with reduced biodiversity with negative impacts that also overspill into open habitats with ground-nesting birds (Ims and Henden Reference Ims and Henden2012). While these changes may not directly affect the ability of Arctic Skuas to nest, on-going declines in ground-nesting birds and other skua prey species within coastal and inland Arctic Skua territories may result in reduced feeding opportunities (Lehikoinen et al. Reference Lehikoinen, Brotons, Calladine, Campedelli, Escandell and Flousek2019). Furthermore, sheep and ungulates may kill Arctic Skua chicks and eggs through disturbance, trampling, and predation (Barton et al. Reference Barton, Conway, Henderson, Baddams, Balchin and Brides2025; Furness Reference Furness1988).
Human infrastructure can cause additional Arctic Skua mortality, particularly of juveniles; lethal collisions with powerlines have been regularly recorded near colonies such as in Slettnes (Norway) and Akraberg (Faroe Islands) where lines have now been removed (Karl-Birger Strann, personal communication; unpublished data Faroe Islands National Museum), and Unst (UK) (David Cooper, personal communication). At sea, the construction of offshore wind farms may result in direct mortality of seabirds through collisions, or they may increase energy expenditure through displacement and “barrier effects” where wind farms block foraging grounds or are placed on commuting routes between foraging and breeding grounds (Drewitt and Langston Reference Drewitt and Langston2006). While there is limited information about the sensitivity of Arctic Skuas to these developments due to their low at-sea densities and lack of GPS tracking studies, skuas share similar habitats and flight traits to at-risk species such as gulls and may thus be susceptible to the impacts of wind farms (Furness et al. Reference Furness, Wade and Masden2013).
In the Arctic, climate-driven reductions in sea ice have consequences for seabird population dynamics due to the change of resting habitats and foraging grounds (Amélineau et al. Reference Amélineau, Grémillet, Harding, Walkusz, Choquet and Fort2019). Similarly, sea level rise and flooding events due to ice melt are predicted to flood coastal plains and low-lying breeding grounds making them unsuitable for nesting (Haverkamp et al. Reference Haverkamp, Bysykatova-Harmey, Germogenov and Schaepman-Strub2022).
Disease and pollution
Diseases are frequent in wild bird populations but, until recently, only 15 seabird species were considered to be threatened by them, albeit with high mortality rates in many cases (Dias et al. Reference Dias, Martin, Pearmain, Burfield, Small and Phillips2019). However, since 2021, a new strain of Highly Pathogenic Avian Influenza (HPAI) H5N1 has spread throughout all continents, killing seabirds at a rate and scale never documented before (Gamarra-Toledo et al. Reference Gamarra-Toledo, Plaza, Angulo, Gutiérrez, García-Tello and Saravia-Guevara2023; Lane et al. Reference Lane, Jeglinski, Avery‐Gomm, Ballstaedt, Banyard and Barychka2024; Pohlmann et al. Reference Pohlmann, Stejskal, King, Bouwhuis, Packmor and Ballstaedt2023). Great Skuas, where they breed in sympatry with Arctic Skuas, were heavily impacted (Camphuysen et al. Reference Camphuysen, Gear and Furness2022), but surprisingly, negligible mortality of Arctic Skuas was recorded in these colonies due to HPAI. Arctic Skuas, however, may be susceptible to further strains of avian flu given they are predators and kleptoparasites of many bird species (Furness Reference Furness1987; Gorta et al. Reference Gorta, Berryman, Kingsford, Klaassen and Clarke2024; Maher Reference Maher1974). Additional diseases and pathogens that impact seabirds at large scales include botulism, caused by the toxin Clostridium botulinum, which causes mortality in waterfowl and large gulls that associate with water-bodies or scavenge food that carries the toxin (Ortiz and Smith Reference Ortiz and Smith1994). Avian cholera is also widespread across seabird species, causing large outbreaks with high mortality. For example, it is one of the primary drivers of population declines of albatrosses and penguins on Amsterdam Island, Southern Indian Ocean, and is found in skua species in the subantarctic (Jaegar et al. Reference Jaeger, Lebarbenchon, Bourret, Bastien, Lagadec and Thiebot2018). However, no skua mortality has been observed at a long-term study site in Arctic Canada (East Bay, Nunavut), where eiders and gulls have been confirmed to have died from cholera and avian influenza. While there is no published literature on the impacts of disease on Arctic Skuas, diseases affect other skua species in both hemispheres and thus Arctic Skuas may also be susceptible to them. Furthermore, the potential for disease impacts on wild birds and other wildlife is expected to increase with global warming and continued poor practices in aviculture farming (Harvell et al. Reference Harvell, Mitchell, Ward, Altizer, Dobson and Ostfeld2002; Lane et al. Reference Lane, Jeglinski, Avery‐Gomm, Ballstaedt, Banyard and Barychka2024).
As apex predators, seabirds are susceptible to the bioaccumulation of chemical pollutants in their tissues that enter the environment through anthropogenic industrial activities (Cherel et al. Reference Cherel, Barbraud, Lahournat, Jaeger, Jaquemet and Wanless2018). Such accumulation may have sublethal consequences for seabird physiology, for example, impacting endocrine function and limiting an individual’s ability to carry out reproductive and feeding activities efficiently, reducing breeding success and survival (Mills et al. Reference Mills, Ibañez, Bustamante, Carneiro, Bearhop and Cherel2022). Great Skuas, and to some extent Arctic Skuas, have been the focus of several studies involving the measurement of halogenated organic contaminants, heavy metals, plastics, and persistent organic pollutants (Albert et al. Reference Albert, Strøm, Helgason, Bråthen, Gudmundsson and Bustamante2022; Leat et al. Reference Leat, Bourgeon, Hanssen, Petersen, Strøm and Bjørn2019). The accumulation of these compounds in Arctic Skuas is variable according to foraging strategy, breeding grounds, and wintering grounds, with differences in their concentration among individuals and populations (Bustnes et al. Reference Bustnes, B-J, Moe, Herzke, van Bemmelen and Tulp2025). However, few detectable consequences for physiological function that are then translated into consequences for egg hatching success, breeding success, DNA damage or other markers of health have been detected in skua species (Albert et al. Reference Albert, Strøm, Helgason, Bråthen, Gudmundsson and Bustamante2022; Bourgeon et al. Reference Bourgeon, Leat, Magnusdottir, Fisk, Furness and Strøm2012; Haarr et al. Reference Haarr, Hylland, Eckbo, Gabrielsen, Herzke and Bustnes2018; Leat et al. Reference Leat, Bourgeon, Hanssen, Petersen, Strøm and Bjørn2019).
Population processes
The drivers of population change described above (some demonstrated, some potential) ultimately impact the survival and breeding success of Arctic Skuas, both of which underpin population dynamics. Arctic Skuas have an extended immature phase, high adult survival rates, and low reproductive outputs (they can fledge up to two chicks per season if conditions are good) (Furness Reference Furness1987). The estimation of these rates alongside population counts are key to building population models that can predict trends and identify where conservation actions are best placed (Lewison et al. Reference Lewison, Oro, Godley, Underhill, Bearhop and Wilson2012; Schaub and Abadi Reference Schaub and Abadi2011; Shaffer Reference Shaffer and Decker2019). However, estimating breeding success and survival is labour intensive, requiring more complex analytical methods based on the monitoring of adequate samples of nesting attempts and the marking/recapture or resighting of individual birds over several years with leg rings/bands for CMR analysis, respectively (Horswill et al. Reference Horswill, Humphreys and Robinson2018). Productivity is often reported for discrete colonies, but it is rare that enough of these are monitored throughout the geographical area of a country to be representative at a national scale. Long-term, representative monitoring of productivity and survival is key when investigating the population dynamics of long-lived species whose productivity and survival respond to environmental stochasticity (Perkins et al. Reference Perkins, Ratcliffe, Suddaby, Ribbands, Smith and Ellis2018; Snell et al. Reference Snell, dos Santos, van Bemmelen, Moe and Thorup2025; van Bemmelen et al. Reference van Bemmelen, Schekkerman, Hin, Pot, Janssen and Ganter2021).
In the coastal breeding populations of the UK and the Faroe Islands, the annual breeding success of Arctic Skuas has fluctuated considerably between years: ranging from 0 to 1, and 0.57 chicks per breeding pair, respectively (modelled mean since 1986, UK, and yearly weighted average since 2017, Faroe Islands), with increasingly frequent periods of very poor breeding success (<0.2 chicks per pair) or total failure (Harris et al. Reference Harris, Baker, Balmer, Bolton, Burton and Caulfield2024; dos Santos Reference dos Santos2018). In Slettnes, Norway, where nest survival and, to some extent, breeding success has been monitored since 2014, breeding success was clearly above zero only in 2014, whereas in 2015–2019 (virtually) no chicks fledged in the study area (van Bemmelen et al. Reference van Bemmelen, Schekkerman, Hin, Pot, Janssen and Ganter2021). Although there is no national estimate of productivity for Russia, breeding success appears to be recorded at some sites (Soloviev and Tomkovich Reference Soloviev and Tomkovich2025), but the only reported productivity was from 1983 at Khanovey field station, where productivity was 1.09 (12 clutches) (Ryabitsev and Ryzhanovskiy Reference Ryabitsev and Ryzhanovskiy2022) and from Kharlov Island in 1991–1995, where monitoring of 21 clutches (39 eggs) showed 15.4% loss and a breeding success of 1.6 chicks per pair (Krasnov et al. Reference Krasnov, Nikolaeva and Ezhov2025). In Alaska, Maher (Reference Maher1970) reported that fledging success ranged from 50% to 75% in 18 nests spread over six years. Overall, monitoring in Arctic regions appears to be very low, probably due to the large effort required to monitor an adequate sample of Arctic Skuas breeding at low densities in difficult-to-access areas.
Few studies have estimated Arctic Skua survival. In Slettnes, Norway, mean annual adult apparent survival was 0.89 (95% CI = 0.84–0.93) between 2014 and 2019, a value considered sufficient to maintain a stable population if productivity exceeded 0.48 females fledged per breeding pair (van Bemmelen et al. Reference van Bemmelen, Schekkerman, Hin, Pot, Janssen and Ganter2021). In the UK, average survival of Arctic Skuas on Fair Isle between 1973 and 1975 was 0.88 when not persecuted by local crofters (Furness Reference Furness1987). On Foula, survival was 0.89 between 1992 and 1999 (Phillips Reference Phillips2001). In the Faroe Islands, there was support for a decline in survival between 1985 and 2008, from 0.93 ± 0.05 to 0.77 ± 0.09 in adults and from 0.60 ± 0.19 to 0.26 ± 0.14 in juveniles (Snell et al. Reference Snell, dos Santos, van Bemmelen, Moe and Thorup2025). Reductions in survival are concerning in long-lived species with low reproductive outputs such as skuas, particularly when associated with periods of low breeding success (Sandvik et al. Reference Sandvik, Erikstad, Barrett and Yoccoz2005). We were unable to find published estimates of survival from populations in the Nearctic and Russia.
The declines observed in North Atlantic populations due to low breeding success and potentially decreasing annual survival may also be self-driven by positive density-dependence mechanisms. Indeed, in kleptoparasitic colonies of Arctic Skuas, areas of higher nest density showed greater productivity (Phillips et al. Reference Phillips, Furness and Stewart1998; dos Santos Reference dos Santos2018). Thus, it is possible that many colonies reached a tipping point, leading to the collapse of the colony due to the limited ability of birds to dissuade or fend off predators, for example.
Knowledge gaps and research priorities
(1) National estimates of population size and trends of Arctic Skuas are critical to assess their global conservation status. Currently, few population counts exist from Russia, and, to some extent Alaska, where large proportions of the breeding population are believed to occur. Here, absolute counts are economically and logistically unfeasible given the vast distribution and low nesting density of Arctic Skuas. A combination of aerial and ground surveys such as those by Bart and Johnston (Reference Bart and Johnston2012) could provide an index of relative abundance and the possibility to monitor changes in such abundance over large areas in the Arctic if carried out at regular intervals, as is currently being undertaken in parts of the Nearctic. Recent analyses of such data have shown even relatively small changes in population trends can be detected with high confidence despite the large-scale approach to their monitoring (Wilson et al. Reference Wilson, Safine, Frost and Osnas2025). Alternatively, comprehensive species distribution models may be used to extrapolate occurrence or density data to total abundance (Elith and Leathwick Reference Elith and Leathwick2009). Citizen science platforms such as eBird may offer opportunities to monitor changes in Arctic Skua abundance at breeding grounds or during the non-breeding period (Walker and Taylor Reference Walker and Taylor2017), although eBird observations are scant in the Arctic. At-sea seabird surveys could also be used, although sample sizes are small given the low densities of Arctic Skuas at sea. Standardised migration counts from seawatching hotspots have already proven useful to estimate changes in bird abundance assuming these represent real changes in population size, as has been used to assess the impacts of HPAI on Great Skuas (Macgregor et al. Reference Macgregor, Gillings, Balmer, Boersch-Supan, Harris and Hereward2024). Lastly, aerial surveys using drones equipped with thermal imaging cameras may prove useful to detect skua nests and increase monitoring in open habitats, as has been demonstrated for other species in Arctic regions (Frederiksen et al. Reference Frederiksen, Layton-Matthews, Bennett, Funder Castenschiold, Cruz-Flores and Edney2025).
(2) Additional long-term demographic rate data from Arctic Skua populations, particularly breeding success and survival (all age classes), is necessary to build population models and understand the demographic drivers of population change. However, such data are currently collected at very few sites, primarily in the North Atlantic, with no long-term financial support. A larger sample of demographic data representative of populations with different foraging strategies is thus a priority, particularly from Arctic populations where the bulk of the global population breeds and where trends appear to differ from the North Atlantic. These data should be collected using established protocols to allow comparison across regions (e.g. Walsh et al. Reference Walsh, Halley, Harris, del Nevo, Sim and Tasker1995).
(3) Further foraging ecology studies (diet and behaviour) are required to understand differences in population trends and predict likely impacts of climate change. We reviewed evidence for declines in the kleptoparasitic populations in the North Atlantic but potentially more stable populations in coastal and inland regions in the Arctic. Environmental change is expected to influence these populations differently. While there is some understanding of the foraging ecology of specialised kleptoparasitic populations, less is known about how the diet, foraging behaviour, and specialisation of more generalist populations affect their demography, particularly in the Arctic where environmental change is occurring rapidly. Similarly, data on the general ecology during the non-breeding period are largely lacking.
(4) An understanding of bird movements throughout their annual cycles is critical to assess sensitivity to anthropogenic threats and design conservation and management strategies. The creation of conservation legislation such as the European Union Birds and Habitats Directives, improved fisheries legislation, and the establishment of Marine Protected Areas (MPAs) with enforced management are key for the conservation of Arctic Skuas and other seabirds at their breeding grounds and at sea (Péron et al. Reference Péron, Grémillet, Prudor, Pettex, Saraux and Soriano-Redondo2013). In addition, far-ranging seabirds that undertake trans-oceanic migrations often travel beyond protected areas (O’Hanlon et al. Reference O’Hanlon, van Bemmelen, Snell, Conway, Thaxter and Aiton2024). Therefore, management of marine resources and mitigation of anthropogenic threats are required at oceanic scales to protect the habitats Arctic Skuas and other seabirds use year-round and limit direct mortality from anthropogenic activities (Oppel et al. Reference Oppel, Bolton, Carneiro, Dias, Green and Masello2018; Yorio Reference Yorio2009). Informing such conservation actions requires a better understanding of the foraging ecology and migratory movements of all age classes of Arctic Skuas throughout the full annual cycle, as migratory flyways have only been revealed for a portion of the breeding populations/range using telemetry data (Harrison et al. 2021; O’Hanlon et al. Reference O’Hanlon, van Bemmelen, Snell, Conway, Thaxter and Aiton2024; van Bemmelen et al. Reference van Bemmelen, Moe, Schekkerman, Hansen, Snell and Humphreys2024). Migratory connectivity has not yet been studied for populations that spend the non-breeding period in the Indian and Pacific Oceans. Furthermore, all Arctic Skuas spend the non-breeding period at sea, and thus their foraging behaviour will differ to when breeding inland. As the non-breeding period modulates their survival (Snell et al. Reference Snell, dos Santos, van Bemmelen, Moe and Thorup2025), identifying the areas and habitats Arctic Skuas use for feeding during migration and wintering, their diet, and the threats they face during this time is key to building a global picture of drivers of population change and informing conservation actions beyond their breeding grounds.
Conclusions
As a result of this exercise, we estimated that the minimum global breeding population of Arctic Skua comprises 185,131–395,315 breeding pairs across Alaska, Canada, Greenland, and Europe, whilst Asian Russia could potentially hold an estimated further 40,000–600,000 breeding pairs. While national population estimates (with varying levels of uncertainty) are now available for most countries where Arctic Skuas breed, virtually no information exists on the population of Arctic Skuas breeding in Asian Russia, which likely holds a large proportion of the global population, perhaps at a similar or larger scale to Canada.
We found that the high-density populations of the North Atlantic that specialise on stealing fish from other seabirds during the breeding period have undergone steep declines in recent decades. However, there is evidence that more generalist populations with a wider prey base, typical of Arctic regions, are currently a stronghold for this species in the Nearctic and other Arctic areas, albeit information about population trends in these regions is scarce. The current limited evidence about population trends beyond the North Atlantic hampers our ability to adequately assess the conservation status of the Arctic Skua at a global scale; considering the species as Data Deficient at a global scale may therefore be more appropriate than Least Concern. Given the variable foraging traits exhibited by Arctic Skuas throughout their breeding range, which may condition their population trend, understanding their ecology and demography beyond the North Atlantic, covering coastal and inland regions of the Arctic, is a priority. This information is key to building a global picture of the drivers of population trends and helping to assess their sensitivity to environmental change and other anthropogenic threats which currently impact the species’ strongholds.
The Arctic Skua is one example among many species that share traits which make them challenging to monitor at a global scale: (1) they have large geographical breeding and non-breeding ranges coupled with long-distance migrations; (2) they occur in economically and logistically difficult-to-access regions, leading to deficient abundance and demographic data; (3) they may exhibit variable foraging ecologies due to occupying highly disparate regions. Species- and region-specific data are required in a conservation context to assess the status of populations, and to monitor changes in response to threats or conservation actions. Thus, approaches to species monitoring that account for the shortcomings highlighted for Arctic Skuas in this study would significantly improve our baseline knowledge of Arctic Skuas and many other circumpolar species with similar traits.
Kleptoparasitic Arctic Skuas are inextricably linked to the ecology of their host species, while Arctic Skuas that directly predate on songbirds, and seabird eggs and chicks, may contribute to regulating their prey species. Therefore, in addition to the intrinsic importance of Arctic Skuas as a species in its own right, its wider study can be leveraged as a powerful indicator of change in seabird assemblages, marine food webs, and terrestrial and marine environments throughout their range.
Acknowledgements
We thank Benoît Sittler and Johannes Lang for sharing unpublished long-term data from Karupelv Valley (Greenland). Thanks to Jennie Rausch of Environment and Climate Change Canada, who leads the Canadian PRISM surveys, to Rick Lanctot, Stephen Brown, Jon Bart, Brad Andres, and Brian McCaffery, who led the PRISM surveys in Alaska, and to Jón Aldará and Sjúrður Hammer, for demographic work in the Faroe Islands. We are very grateful to Ella Benninghaus and Imran Razik for their contributions to the artwork, and Alex Penn and Kate Persons for providing the photograph for Figure 1. We also thank John Calladine and an anonymous reviewer for their useful comments during review. BTO’s contribution to this paper was supported by funding from Gifts in Wills and individual donors, for which we are extremely grateful. KS was supported by the Deutsche Forschungsgemeinschaft (DFG, German Research Foundation) under Germany’s Excellence Strategy – EXC 2117 – 422037984. The Greenland study is part of the long-term Studies in Ecology and Evolution (SEE-Life) program of the CNRS and was funded by the Agence Nationale de la Recherche (ANR-21-CE02-0024 PACS) and IPEV (French Polar Institute; Program “Interactions 1036”). Recent work on Arctic Skuas in Alaska, USA by the Smithsonian Institution’s Migratory Connectivity Project has been supported by the ConocoPhillips Charitable Investments Global Signature Program.


 Open access