

Introduction
Nationally representative studies about health and health care must demonstrate that study participants (clinicians and patients) sufficiently represent the population at large, especially underserved populations. By definition, these groups have limited access to health care. One type of underserved population group comprises residents of rural areas, or equivalently termed in the United States, non-metropolitan residents. These residence locations are associated with worse health outcomes and worse health care access, across many diseases and conditions [Reference Eberhardt, Ingram and Makuc1,Reference Meit, Knudson and Gilbert2].
Recruiting both patients and providers from these regions is challenging due to geographic isolation, limited access to specialists, fewer continuing education opportunities, and infrastructural barriers that include inadequate transportation [Reference Broyles, Rodriguez, Price, Bayliss and Sevick3]. This may cause under-representation of these populations in clinical research studies [Reference UyBico, Pavel and Gross4]. Another approach to defining “underserved” focuses on residents of areas where there are limited health care resources. One example is the health professional shortage area (HPSA), defined as a “geographic area, population group, or health care facility that has been designated by the Health Resources and Services Administration (HRSA) as having a shortage of health professionals” [5].
Clinical research networks have attempted many methods to recruit these populations, with mixed success. One such network is the National Dental Practice-Based Research Network (“Network”). The Network is a clinical research network continuously funded since its inception in 2005 by the National Institutes of Health/National Institute of Dental and Craniofacial Research (NIH). Its stated mission is to improve clinical decision-making by engaging dental practices and their patients in research [Reference Gilbert, Williams and Rindal6–Reference Cunha-Cruz, Gilbert and Allareddy8]. It has been cited as the largest and most successful dental PBRN globally [Reference Canceill, Monsarrat, Faure-Clement, Tohme, Vergnes and Grosgogeat9]. As of 2026 the Network has conducted 58 studies that have involved a broad range of clinical topics and engaged its 9,000+ members in a broad range of study-related and non-study-related activities. Over 100,000 patients have been enrolled. As of January 2026, 248 peer-reviewed scientific publications in 74 different journal titles have resulted from Network studies. Analysis of this scholarly output has demonstrated that its publications have been influential, as judged by their Relative Citation Ratios [Reference Gilbert, Fellows and Allareddy7,Reference Allareddy, Mungia, Lee, Oubaidin and Gilbert10,Reference Hutchins, Yuan, Anderson and Santangelo11].
Dentists who practice in rural areas often face difficulties that their urban counterparts do not; specifically, they provide treatment to patients who tend to be older and less-educated, and fewer have dental insurance, especially private insurance [Reference Martin, Santoro, Heaton, Preston and Tranby12]. Rural practitioners and their patients often do not have ready access to dental specialists when needed [Reference Doescher and Keppel13]. Longer travel distance for patients and lack of alternative modes of transportation (other than driving one’s own car, e.g., public transportation) may be additional challenges [Reference Skillman, Doescher, Mouradian and Brunson14,Reference Rahman, Blossom, Kawachi, Tipirneni and Elani15]. Regarding dentists, distances between dental practices in rural areas can be more substantial than in urban areas, making peer-to-peer interaction more challenging. For these reasons, rural dentists may benefit more from Network involvement, including easy access to continuing education (CE) opportunities, which is available with Network membership [Reference Mungia, Funkhouser and Makhija16]. Other dentist activities, such as participation in research studies and peer-to-peer interactions, are enhanced by participation in Network in-person and virtual meetings [Reference Mungia, Funkhouser and Trejo17]. The Network’s recruitment strategies for practitioners and patients have been detailed previously [Reference Mungia, Funkhouser and Cochran18]. The primary objectives of this report are to quantify: (1) the proportion of Network dentists who practice in rural areas, Health Professional Shortage Areas (HPSAs), and safety-net clinics, and compare these proportions to national estimates; and (2) the proportion of dental patients participating in Network clinical studies who live in rural areas and compare this to national dental patient estimates. A secondary objective was to compare the characteristics of rural and non-rural practitioners and patients in the Network to those from national estimates.
Methods
This study is a secondary data analysis integrating multiple data sources. Practitioner data were obtained from the Network Enrollment Questionnaire (EQ). Patient demographic data were collected from patients who participated in a Network clinical study between 2014 and 2024. The study protocol for overall Network operations was reviewed and approved by the Institutional Review Board (IRB) of the University of Alabama at Birmingham.
Data sources
To become a member of the Network, practitioners must complete an EQ that is available at the National Dental PBRN website [19]. The EQ is completed online and provides information about practitioners’ demographic and clinical training characteristics [Reference Cunha-Cruz, Gilbert and Allareddy8,Reference Gilbert, Gordan and Korelitz20]. Questionnaire items, which had documented test/re-test reliability, were taken from our previous work in a practice-based study of dental care [Reference Gilbert, Richman and Gordan21].
The Network uses a wide range of recruitment and retention methods to attract and retain a broad representation of practitioners, practice types, and patient populations [Reference Gilbert, Fellows and Allareddy7,Reference Cunha-Cruz, Gilbert and Allareddy8]. The Network comprises six administrative regions: Northeast, South Atlantic, South Central, Midwest, Southwest, and Western (Figure 1), and based on patient-participant ZIP codes from its clinical studies (2014–2024), has engaged patients in all 50 U.S. states, the District of Columbia, and Puerto Rico (Figure 1).
Geographic regions of the National Dental Practice-Based Research Network.

Practitioner data collected via the EQ include demographics and professional details of training, type of practice setting, and the physical address of practice site(s). At a patient level, all Network clinical studies collected the following sociodemographic variables: gender, age, race, ethnicity, level of formal education, whether they had any dental insurance, and their residential ZIP code. Patients in clinical studies are linked to the practitioner by a unique Network practitioner identification number.
National estimates
Non-Network national data on dentists and patients were derived from national representative surveys. The national data on dentists are derived from American Community Surveys (ACS) accessed via the Integrated Public Use Microdata Series (IPUMS) [Reference Ruggles, Flood and Sobek22]. The ACS is a repeated cross-sectional survey with a random one percent sample of the United States population. This report pooled data biannually from 2016 to 2022, including four years of total data (e.g., 2016, 2018, 2020, and 2022). Sampled individuals are legally required to respond to the survey, and the response rate has exceeded 80% in recent years. The ACS collects detailed information on respondents’ demographic and socioeconomic characteristics, as well as their occupation and industry if they were employed at the time of the survey. We specified, for comparison, national dentists by selecting employed individuals whose occupation code is “29-1020,” in accordance with the 2018 Standard Occupational Classification (SOC) system of the U.S. government.
To obtain national-level data on dental patients, we used the Behavioral Risk Factor Surveillance System (BRFSS) [23]. The BRFSS is a series of large cross-sectional telephone surveys (using random digit dialing for landlines and cellular telephones) conducted monthly across all 50 states and the District of Columbia. Participants respond to an annual core questionnaire that collects information on demographics, socioeconomic status, health status, behaviors, and healthcare access. The BRFSS also incorporates a rotating biennial core questionnaire, including a module that explicitly asks about dental care utilization. We defined dental patients from the BRFSS as those who reported having had at least one dental visit in the past 12 months in 2016, 2018, 2020, and 2022.
Measures
Definition of rural area
“Rural” is an inexact term that can mean different things to different people. The U.S. Census Bureau (Census) and Office of Management and Budget (OMB) have definitions of rurality that are widely used [24]. The Census defines urban areas as having at least 5000 people or 2000 housing units. The OMB designates counties as Metropolitan, Micropolitan, or Neither. A Metro area contains a core urban area of 50,000 or more people, and a Micro area contains an urban core of at least 10,000 (but less than 50,000) people. All counties that are not part of a Metropolitan Statistical Area (MSA) are considered rural. Micropolitan counties are considered non-Metropolitan or rural along with all counties that are not classified as either Metro or Micro. One of the more commonly used measures is the Rural-Urban Continuum Codes (RUCC) [25]; RUCC uses classifications based on the OMB. The 2023 RUCC distinguishes U.S. metropolitan (metro) counties by the population size of their metro area, and nonmetropolitan (nonmetro) counties by their degree of urbanization and adjacency to a metro area. RUCC has subdivisions within “metro (or urban)” and “non-metro (or rural)” areas. There are 3 metro and 6 non-metropolitan levels, all based on county population. They are first based on an urban population level, then within that level, whether adjacent to a metro area. The broad category of “urban” and “rural” is the primary definition used in this report for Network dentists and patients. For both provider and patient data from the Network, we determined rural status based on ZIP codes of the practice (dentists) or place of residence (patients).
The ACS only provides geographic information at the level of Public Use Microdata Areas (PUMAs), which are big regions with at least 100,000 people. Since the ACS does not include county-level identifiers, we could not directly match counties or Rural-Urban Continuum Codes (RUCC) to ACS data. To connect PUMAs with RUCCs, we used a tool called Geocorr from the Missouri Census Data Center [26]. Geocorr creates crosswalks that link different geographic areas, including one that maps each PUMA to the appropriate RUCC based on the 2020 Census. Details about how well RUCC and PUMA match using this method can be found in Appendix A.
Measures for underserved
We assessed Network practitioners’ service to underserved areas and populations using two approaches. The first approach focused on geographic location using county-level dental Health Professional Shortage Area (HPSA) designations from the Area Health Resource File (AHRF) [27]. Practitioners were classified as serving a dental HPSA area if their practice county included any geographically designated dental HPSA. The AHRF contains publicly accessible data from the Health Resources and Services Administration that provides annual information on health care professions, health facilities, population characteristics, economics, health professions training, hospital utilization, hospital expenditures, and environment at the county, state, and national levels. A county is classified as a dental HPSA county if any part of that county has been geographically designated as a dental HPSA. From national estimates, a majority of counties (68.7%) have some proportion that is a dental HPSA. In comparison, relatively smaller proportions have either no dental HPSA areas (15.9%) or the entire county is a dental HPSA (15.3%) [Reference Benavidez, Crouch, Nelson and Martin28].
The second approach focused on providers’ reported type of practice from the EQ questionnaire. Providers were classified as working in safety-net clinics if they described their dental practice as a public health practice, community health center, publicly funded clinic (excluding federal facilities), or a federal government facility (e.g., VA, Department of Defense, or Public Health Service). We further identified dentists working at Federally Qualified Health Centers (FQHCs), given that FQHCs represent a critical component of the U.S. safety-net system [Reference Jones, Shi, Hayashi, Sharma, Daly and Ngo-Metzger29]. FQHCs are community-based healthcare organizations funded under Section 330 of the Public Health Service Act to provide primary care (including dental services) for nearly 30 million socioeconomically disadvantaged populations annually in recent years, and over 6 million of them also received dental care at FQHCs in recent years [30]. To determine a practitioner’s FQHC status, we compared their practice site addresses against a list of FQHC service site addresses obtained from the Uniform Data System (UDS), an administrative dataset maintained by the Bureau of Primary Health Care (BPHC) within HRSA. Currently, there are 1363 FQHCs in the U.S. [31], representing approximately 1% of the 139,00 dental clinics [32].
Statistical analysis
Descriptive statistics were calculated for all variables; means with standard deviations (sd) and medians with inter-quartile range (IQR) for continuous variables; namely, age, and proportions for categorical variables. Dentist frequencies from ACS were obtained and classified according to RUCC, overall, and according to the same characteristics available from the EQ (specifically, dentist gender, age, race-ethnicity, and geographic region). Frequencies of dentist characteristics from the EQ were compared to those of the National estimates from the ACS.
Next, we performed a series of logistic regression models separately for Network and ACS dentists. Four dichotomous variables were used: rurality (rural or urban), gender (male or female), age (<55 or 55 and older), race-ethnicity (non-Hispanic white or other), and regions (Midwest or South Central or other). The age and region categories were based on where the maximum difference was between rural and urban overall. We used a non-Hispanic white race-ethnicity classification because it was the predominant race-ethnicity category. We compared the demographic models for Network and ACS dentists overall and then separately for rural and urban dentists. All statistics derived from the ACS were weighted by the sampling weights to yield national representative estimates. Dentist characteristics were similarly assessed based on whether dentists were in a HPSA and whether they were in a safety-net dental clinic.
Comparisons of Network dentists working in HPSA areas and those not, and Network dentists working in safety-net dental clinics and those not, were made using the approach described above for rural; namely, chi-square for each characteristic separately, then logistic regression to ascertain independence of associations.
The last set of comparisons was of patients participating in any of 10 Network clinical studies conducted between 2014 and 2024 (see Appendices B and C for a list of studies included and comparison of dentists). Using BRFSS patient population data, we determined the proportions from a rural area, by demographics (gender, age, race-ethnicity, and education). As with ACS, all statistics derived from BRFSS were weighted by the sampling weights to yield nationally representative estimates. Lastly, we compared differences by demographics within Network patients and with BRFSS, assessing whether the same differences are present in each group. All statistical analyses were performed using SAS9v4.
Results
Sample description
Data were available for 5116 Network dentists who were practicing dentists in the United States. When completing the EQ, dentists indicate at what level they want to participate, i.e., only want to receive information, willing to complete surveys but not clinical studies, and full participation (willing to participate in clinical studies). We excluded 439 dentists who enrolled as information only, 28 who were missing data on this variable, 164 who were missing ZIP code, and 232 who had died. Thus, 4653 Network dentists are included in the analysis described below. The number of dentists from the ACS surveys was 6210, for a total of 10,863 dentists.
Dentists’ distribution in rural areas
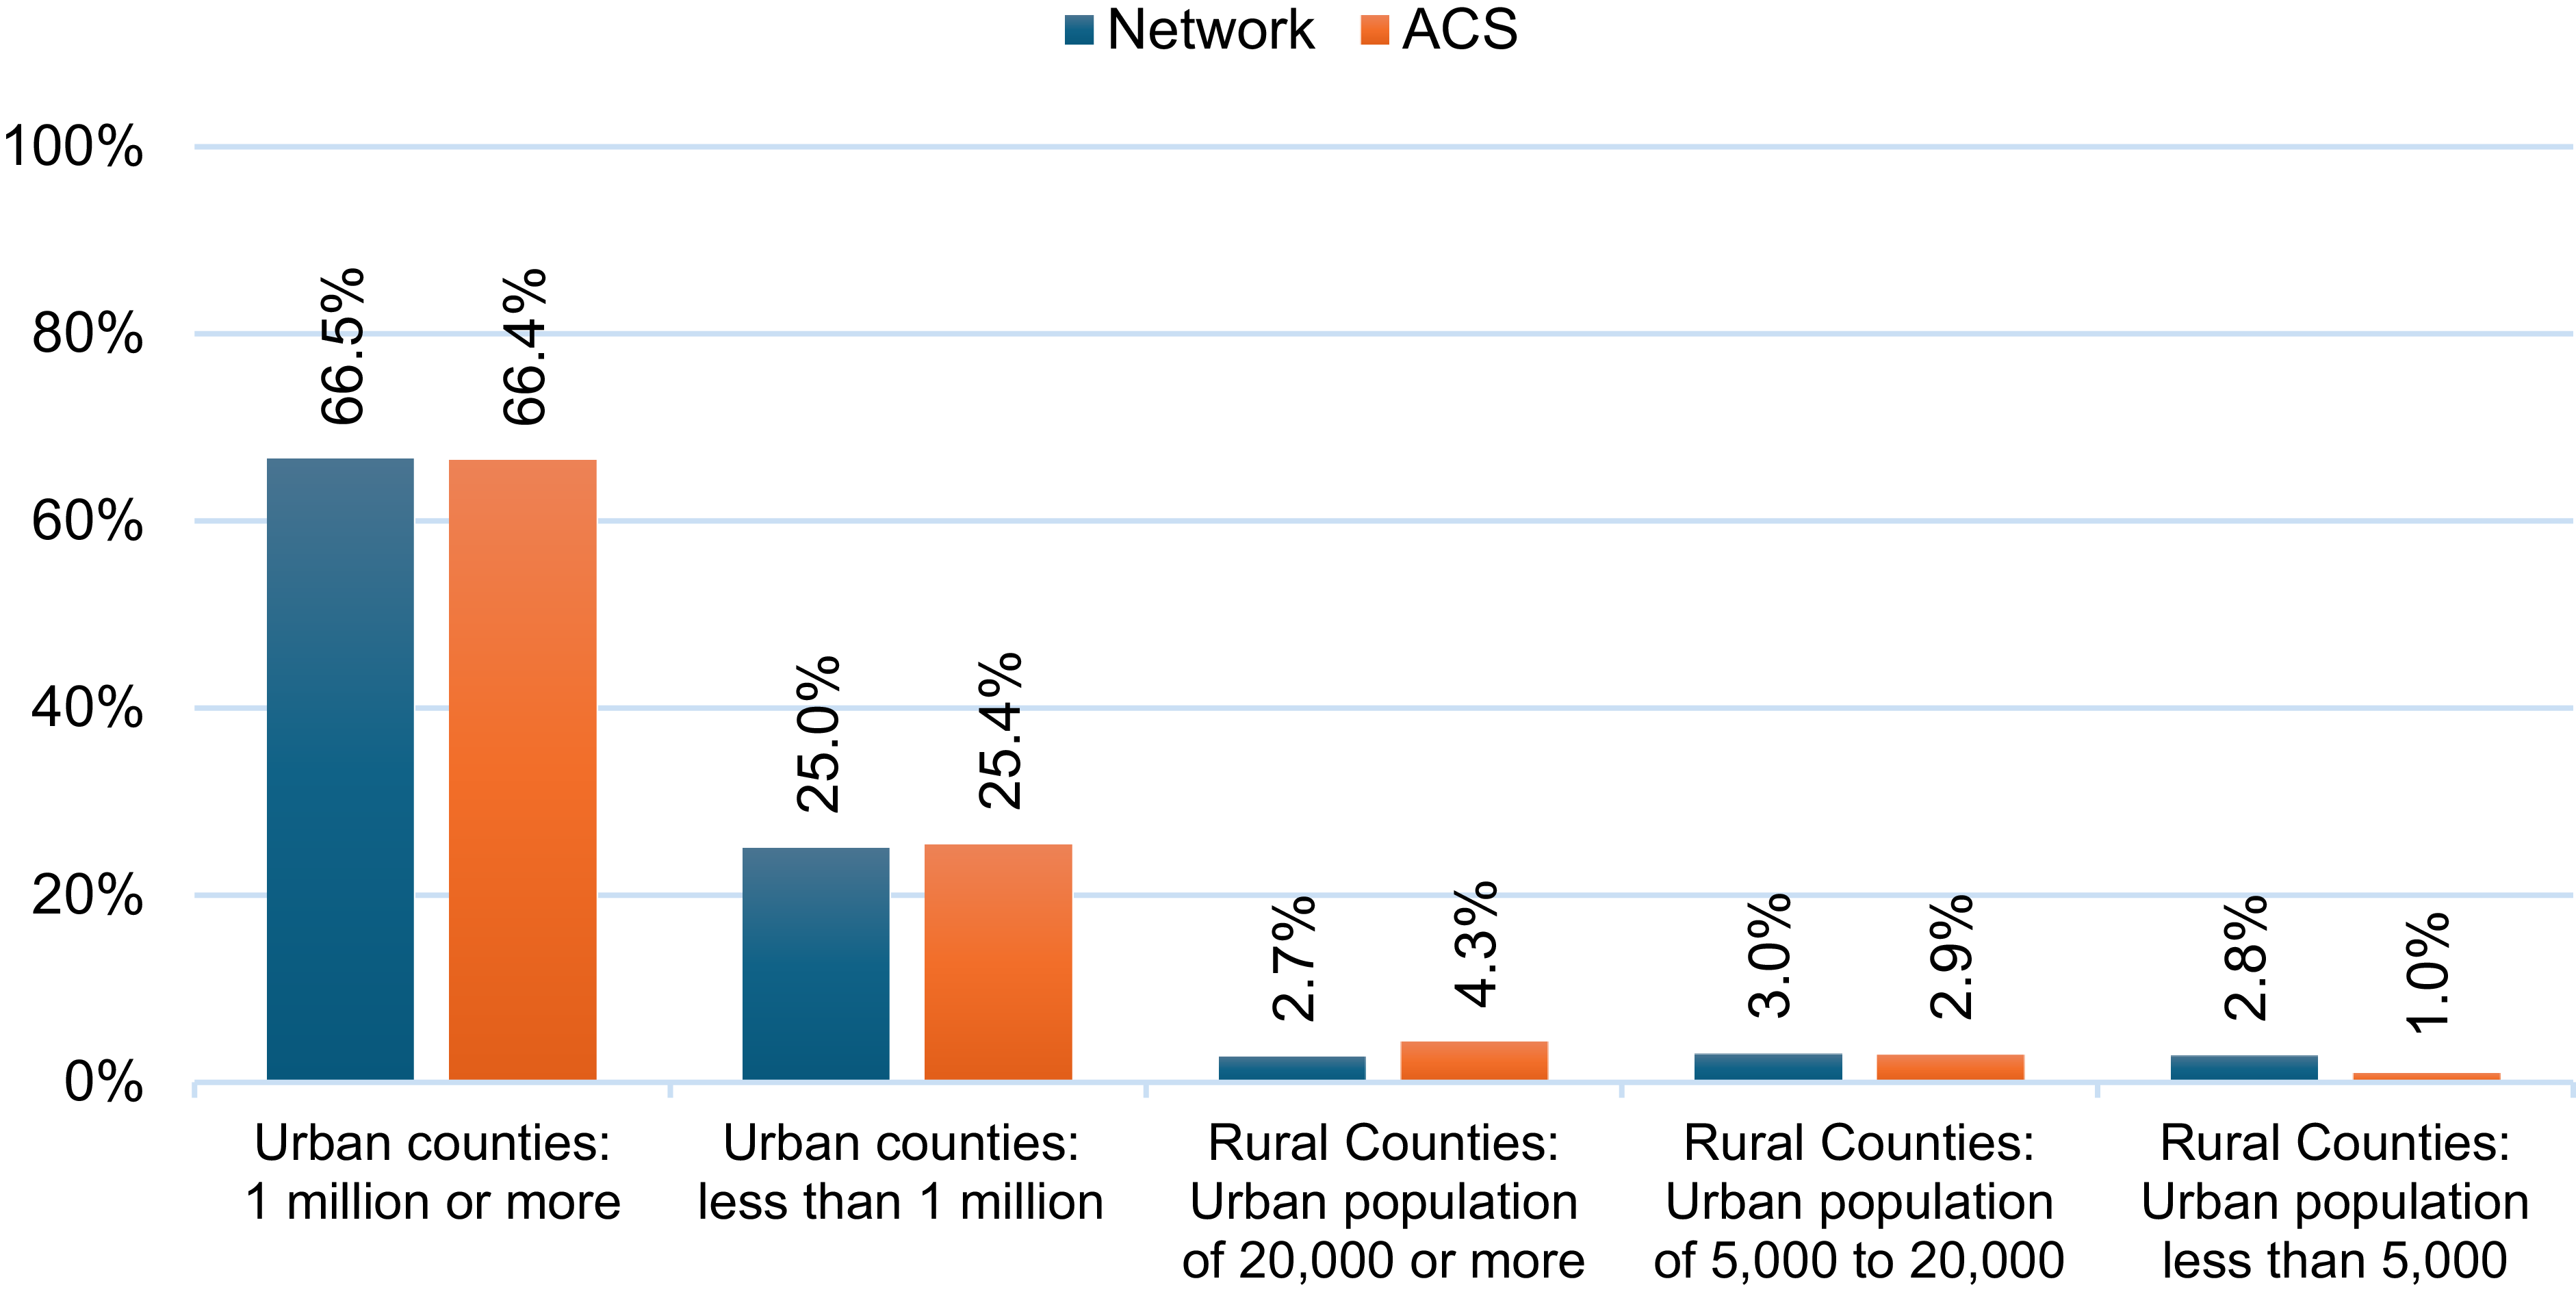
The distribution of dentists across RUCC categories, comparing the Network dentists to the ACS sample, is presented in Figure 2. Distributions appear broadly similar in the urban categories but show divergences within the rural classifications. The overall proportions of dentists working in a rural area/county were similar for the ACS sample and in the Network at 8.2% and 8.5%, respectively. In counties with the smallest urban populations (less than 5000), the Network had a higher proportion of dentists (2.8% vs. 1.0% ACS). In contrast, in rural counties with larger urban populations (20,000 or more), the ACS sample showed a higher proportion (4.3% vs. 2.7% Network).
Geographical distribution of patient-participants’residences in 16 clinical studies from the National Dental Practice-Based Research Network (2012–2025).

For HPSA (not shown in the Figure), overall, 76.8% (N = 3,572) of Network dentists practiced in a county that had at least one of its subareas designated as a dental HPSA; only 9 (<1%) were in a county that was entirely a dental HPSA. This is less than the estimates of 84.0% dentists in a county that had at least one of its subareas designated as a dental HPSA using AHRF as a source. Overall, only 7% (N = 312) of Network dentists worked in safety-net (public health) dental clinics, and among them, 84 worked at FQHCs.
Patient distribution in rural areas
Although Figure 3 demonstrated that the proportion of dentists working in rural and urban areas was similar to other national estimates (ACS), the
Comparison of geographic distribution of National Dental Practice-Based Research Network and American Community Survey (ACS) dentists by 2023 Rural-Urban Continuum Code. Notes: Data from American Community Survey (ACS) are pooled over four years in 2016, 2018, 2020, and 2022. Rates obtained from ACS data are weighted using the ACS sampling weights.

proportion of patients in the Network from rural areas was notably higher (33.6%) than that of dentists (8.5%) (Figure 4). The proportion of Network patients from rural areas was also higher than that of BRFSS (33.6% vs. 28.5%) (Figure 5).
Geographic distribution of National Dental Practice-Based Research Network dentists and patients participating in clinical studies by 2023 Rural-Urban Continuum Code (N = 4653 dentists; N = 19,011 patients).

Comparison of geographic distribution of National Dental Practice-Based Research Network and Behavioral Risk Factor Surveillance System (BRFSS) dental patients by area of residence* (N = 19,011 Network; N = 933,948 BRFSS). Notes: *Rural: For Network based on Rural-Urban Continuum Codes (RUCC), for BRFSS based on Urban-Rural Classification Scheme for Counties. Data from BRFSS are pooled over four years in 2016, 2018, 2020, and 2022, and all weighted using the BRFSS sampling weights.

Dentists’ characteristics, overall and by data source and rurality (Table 1).
Distribution of networka and American Community Surveysb (ACS) dentists by data source and whether they practiced in a ruralc area

a Network: National Dental Practice-Based Research Network.
b ACS: pooled over four years in 2016, 2018, 2020, and 2022 and weighted by the sampling weights to yield national representative estimates.
c Rural: Based on 2023 Rural-Urban Community Codes (RUCC).
d All missing are among Network dentists.
e p:p-value from chi-square.
The majority of the dentists were male (65% in the Network; 68% in ACS), less than 55 years of age (57% in the Network; 59% in ACS), and non-Hispanic white (69% in the Network; 71% in ACS). All characteristics differed by data source and rurality (all chi-square p-values were < .001). Most were male and non-Hispanic white in each data source regardless of whether they worked in a rural or urban area. Most were 55 years old or younger in each data source but differed by urban-rural area; namely, in rural areas, most were 55 years or older (52%). The region differed by data source and whether it was rural.
Logistic regression analysis (details in Appendix D)
Among Network and ACS dentists, separately, males, older persons, non-Hispanic white, and being from either Midwest or South Central regions were more common (OR >1 in logistic model), although gender and age were not always statistically significant.
Network dentists’ characteristics by underserved measures (Table 2)
When comparing dentists’ characteristics by whether they worked in a dental HPSA, there were no differences in dentists’ gender, age, or whether they worked in a rural county. A slightly higher percent of Network dentists were non-Hispanic white who worked in an HPSA (71% vs. 67%, p = .03). There was also a statistically significant difference for dental HPSA dentists by geographic region (p < .001), with a lower percentage of Network dentists working in a dental HPSA county in the Midwest region at 13%; other regions were 16–18% each. Regarding working in a safety-net (public health) dental clinic, higher proportions were observed in safety-net clinics for rural, female, and younger dentists, as well as dentists who reported race as other than non-Hispanic White, and those who worked in the Western or Midwest region (all p≤ .01).
Distribution of networka dentists according to whether they practiced in a Health Provider Shortage Area (HPSA) and whether their practice was a Safety Net Clinic (self-reported public health or federal [VA]) clinic)

a Network: National Dental Practice-Based Research Network.
b p: p-value from chi-square.
c AA: African-American.
Patients’ characteristics by rural/urban status
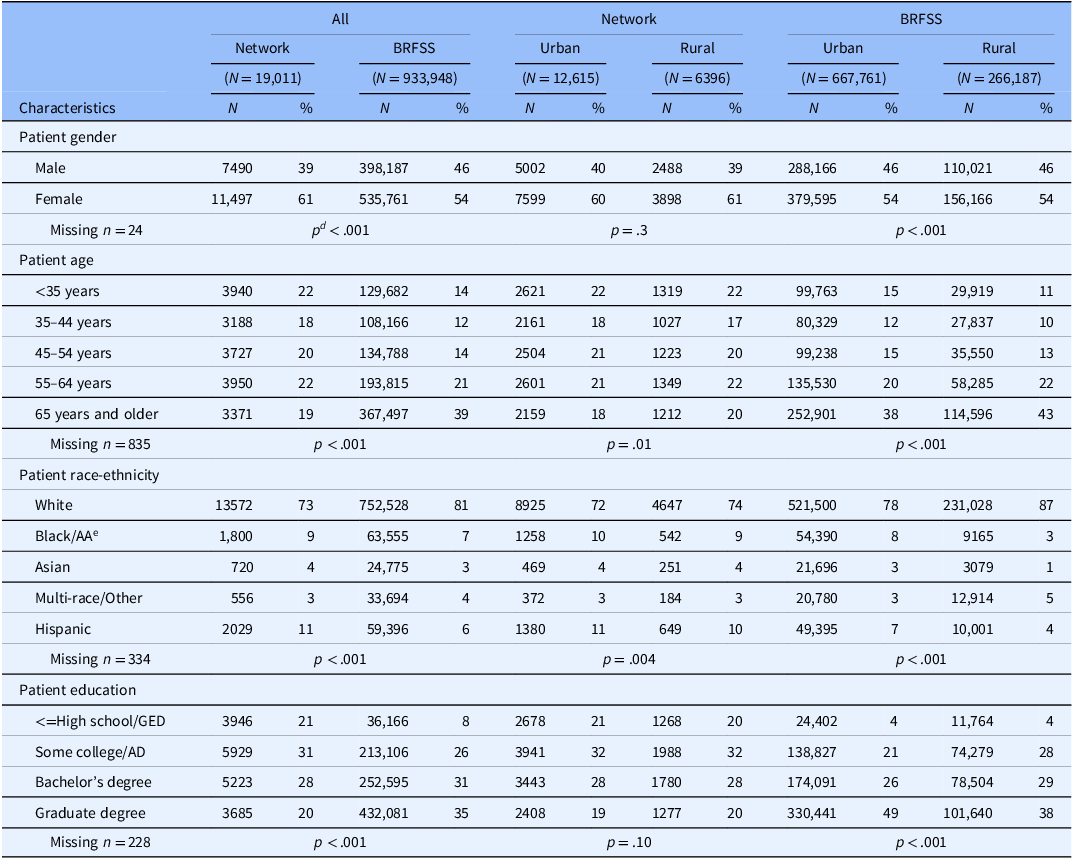
(See Appendix C for a comparison of Network dentists according to whether they had a patient in a study.) There were notable differences between Network patients and the BRFSS sample (all p < .001) (Table 3): the Network had a higher proportion of female patients (61% vs. 54%), and patients whose highest education was at high school/GED level or lower (21% vs. 8%). The Network had fewer non-Hispanic white patients (73% vs. 81%), and of persons of age 65 or older (19% vs. 39%).
Distribution of dental patients participating in networka studies and in Behavioral Risk Factor Surveillance Studies (BRFSSb), overall and by urban/ruralc status

a Network: National Dental Practice-Based Research Network clinical studies (2014–2024).
b BRFSS: pooled over four years in 2016, 2018, 2020, and 2022; and weighted by the sampling weights to yield nationally representative estimates.
c Rural: For Network based on Rural-Urban Continuum Codes (RUCC), for BRFSS based on Urban-Rural Classification Scheme for Counties.
d p:p-value from chi-square.
e AA: African-American.
When analyses were limited to patients within the Network (middle column in Table 3), neither patient gender nor education level differed by rural/urban status. Patients from rural areas were less than one year older than patients from urban areas (means: 49.5 [sd = 15.8] vs. 48.9 [sd = 15.8] years, p = .04). A slightly higher proportion of Network rural patients were of non-Hispanic white race-ethnicity than were patients from urban areas (74% vs. 72%, p = .004).
Analyses were next limited to BRFSS patients (right column in Table 3). Because of the large sample size in BRFSS, even differences of <1% are significant, so we focused on magnitude of differences. There was no meaningful difference (>1%) in gender by rural/urban area. Rural areas had a higher proportion of persons 65 years or older (43% vs. 38%), non-Hispanic White persons (87% vs. 78%), and less-educated persons (no 4-year college degree) (32% vs. 25%).
Discussion
The proportion of Network practitioners working in rural areas is comparable to national estimates, and differences between rural and urban Network members are similar to the differences in the national sample of dentists. The majority (77%) of Network dentists practiced in a county where at least part of the county was designated as a dental HPSA, similar to national estimates of 78.5% [Reference Benavidez, Crouch, Nelson and Martin28]. A slightly higher percent of Network dentists (2%) worked in an FQHC, compared to national estimates of 1% [33]. The proportion of patients living in rural areas (33.7%) is nearly 4 times that of practitioners (8.5%), and is higher than that of the US population overall (20.3%) [24].
The finding that the Network enrolled a higher proportion of rural patients than national estimates of dental care users (33.6% vs. 28.5%) further underscore its success in reaching underserved populations. Notably, BRFSS respondents are already a more selective subset of the population at large, because they reported a dental visit within the past year; however, the Network exceeded even this benchmark in rural representation. This suggests that the Network not only engages a representative provider base but also engages participation among rural patients who may be underrepresented in clinical research. These findings reinforce the Network’s potential as a platform for inclusive, generalizable, and community-relevant dental research.
PBRNs and other clinical research networks have sought to engage practices and populations representative across the rural-urban residence continuum [Reference Riley-Behringer, Davis, Werner, Fagnan and Stange34–Reference Phillips, Bishop, Peterson and Dai37]. The current results are consistent with the notion that the Network has been effective at attracting a diverse representation of practitioners and patients based on practice location. As described in the Methods section, network dentists are not recruited randomly, so unmeasured factors that are presumably associated with network membership, such as interest in clinical research, may make network clinicians less representative. However, analyses have demonstrated that Network dentists have much in common with dentists at large, using the American Dental Association (ADA) Survey of Dental Practice, albeit with some differences in characteristics while also providing substantial diversity in these characteristics [Reference Makhija, Gilbert, Rindal, Benjamin, Richman and Pihlstrom38,Reference Makhija, Gilbert and Rindal39]. This assertion is warranted because substantial percentages of Network dentists are represented in the various response categories of the characteristics in the Enrollment Questionnaire and studies document that Network dentists report patterns of diagnosis and treatment that are similar to patterns determined from non-Network dentists [Reference Gilbert, Gordan and Korelitz20,Reference Gordan, Heft and etal40–Reference Heaven, Gordan and Litaker43].
Although rural practitioners may be faced with challenges different from those of practitioners in urban areas, rural practice is not without its benefits. A consequence of not having specialists nearby and a reluctance on the part of some patients to travel the needed distance to see a specialist (difficulty with transport, inconvenience, cost of specialty care, etc.) may lead to greater trust and even expectation that rural practitioners can deliver the full scope of general dental services. This could include using a wider range of treatments (e.g., more endodontics, implant dentistry, and oral surgery) and potentially more satisfaction on the practitioner’s part. In addition, although rural practitioners on average have older patients and a larger proportion of white patients than do urban practitioners, this does not characterize all rural practices.
A higher proportion of patients participating in Network studies were from rural areas not only compared to the dentists, but also compared to the BRFSS dental patient sample, which indicates that the Network is reaching substantial proportions of vulnerable populations. The over 2-times higher proportion of Network than BRFSS patients with no more than a high school education (21.0% vs. 8.2%) is additional evidence that the Network is reaching vulnerable populations. The lower proportion of patients ages 65 years or older in Network studies than BRFSS may be partly explained by the proportion of those age 65+ who are edentulous, and thus not eligible for most Network studies.
The Network has representation of practitioners in rural and underserved populations and clinics comparable to that of the distribution in the U.S. at large, and the practitioners’ characteristics with respect to area of residence are also comparable to those of the U.S. Rural practitioners participate in clinical studies at the same rate as urban practitioners, consistent with the notion that a national practice-based research network can be effective at attracting rural practitioners and their patient populations.
There could be some bias in the comparisons due to the slightly different time frames and related potential differences in trends in migration, retirement, and post-COVID patterns. Dentist benchmarks (ACS pooled 2016–2022) were compared to Network dentists enrolled across 2014–2024; patient benchmarks (BRFSS 2016/2018/2020/2022) were compared to Network study participants across 2014–2024. For the Network dentist enrollment, the information pertaining to dentists is constantly updated and a thorough update was recently conducted between 2020 and 2024. Also, our goal is not to compare year differences but rather to have a national sample for comparison. Pooling the data across years should mitigate issues related to temporary sample composition change. For patients, about 42% were enrolled between 2016 and 2022. Also, except for 2 of the smaller studies (AOB, N = 337 and ROCS, N = 876), the proportion that was rural (the characteristic of primary interest) was between 30% and 40%. The demographics across all the studies were similar except for the SOCL study, which was younger. Pooling data across years and noting demographic similarities between groups may help to address some of these potential limitations and strengthen the overall comparisons.
Limitations
Several data sources, such as RUCC and the NCHS classifications used in BRFSS, were employed to categorize areas as metro or nonmetro. While these methods are broadly comparable, they do not capture the full spectrum of rurality; therefore, additional analyses were conducted using subcategories within metro and nonmetro areas. Key demographic variables, including sex, age, race-ethnicity, and region, were included in comparative models. However, interactions among these demographic factors were not examined, which may limit a more nuanced interpretation of rural–urban differences. Exploring these interactions may be a valuable focus for future research. HPSA relies on a broad county-level definition (“any part of the county”). This may inflate estimates and obscure meaningful differences. This comparison is conservative and may mask finer-grained differences at the census-tract or service-area level. Also, by the “underserved” term in this article, we mean rural geographic areas, Dental Health Profession Shortage Areas, and safety-net clinics, although we acknowledge the importance of other “underserved” definitions, such as persons with physical limitations and developmental disabilities.
Implications
These findings demonstrate that a national PBRN can serve as an effective platform for inclusive clinical research, especially in dentistry where rural access disparities persist. The engagement of FQHCs and safety-net clinics, although modest in numbers, further emphasizes the Network’s relevance in reaching public health providers.
Conclusion
The National Dental PBRN exhibits strong representativeness in both provider and patient samples across rural and underserved strata. This success highlights the Network as a viable model for expanding representative, practice-based clinical research nationwide.
Supplementary material
The supplementary material for this article can be found at https://doi.org/10.1017/cts.2026.10721.
Acknowledgements
An Internet site devoted to details about the nation’s Network is located at http://NationalDentalPBRN.org. The informed consent of all human subjects who participated in this investigation was obtained after the nature of the procedures had been explained fully. We are very grateful to the Network’s Regional Coordinators and other network staff who engaged in this activity (Midwest Region: Sarah Basile, Chris Enstad, Amanda Gillesby, Heather Weidner; Western Region: Chalinya Ingphakorn, Christine Catlin; Northeast Region: Kathy Bohn, Rita Cacciato, Pat Ragusa, Victoria Thomas; South Atlantic Region: Danny Johnson and Brenda Thacker; South Central Region: Aleena Potluri; Southwest Region: Caitlin Sangdahl; National Program Manager Muna Anabtawi and National Program Coordinator Brittni Ball, along with network practitioners on the National Dental PBRN Practitioner Executive Committee.
Author contributions
Ellen Funkhouser: Conceptualization, Data curation, Formal analysis, Methodology, Writing-original draft, Writing-review and editing; Wei Lyu: Data curation, Formal analysis, Writing-original draft, Writing-review and editing; Joana Cunha-Cruz: Conceptualization, Writing-review and editing; Rahma Mungia: Conceptualization, Writing-review and editing; Gregg H. Gilbert: Conceptualization, Funding acquisition, Writing-review and editing.
Funding statement
This work was supported by NIH grant U19-DE-28717. Opinions and assertions contained herein are those of the authors and are not to be construed as necessarily representing the views of the respective organizations or the National Institutes of Health.
Competing interests
We affirm that we have no financial affiliation (e.g., employment, direct payment, stock holdings, retainers, consultantships, patent licensing arrangements, or honoraria), or involvement with any commercial organization with direct financial interest in the subject or materials discussed in this manuscript, nor have any such arrangements existed in the past three years. Any other potential conflict of interest is disclosed.


 Open access