


Major depressive disorder (MDD) is a heterogeneous syndrome varying considerably in clinical presentation, progression, treatment response and neurobiology.Reference Chahal, Gotlib and Guyer1 Failure to effectively resolve this heterogeneity, especially in biological terms, limits drug discovery and personalised treatment approaches for patients with MDD. Most data-driven MDD subtyping efforts have focused on discriminating different symptom profiles. In general, these approaches have not proven to be clinically useful or helpful for treatment development, as similar particular symptom profiles could be attributed to different biological mechanisms.Reference Beijers, Wardenaar, van Loo and Schoevers2 Also, symptom-based subtyping has low stability over time.Reference Drysdale, Grosenick, Downar, Dunlop, Mansouri and Meng3 Most importantly, symptom-based clustering has not been useful in illuminating heterogeneity at the biological level.
Neuroimaging-based subtyping
Although there are multiple biological approaches that might prove useful for subtyping patients with MDD, considerable attention has been paid to psychoradiological substrates for depression.Reference Lui, Zhou, Sweeney and Gong4 Some neuroimaging studies typically have identified MDD subtypes based on a single modality of neuroimaging data, such as functional activity or structural patterns.Reference Yamamura, Okamoto, Okada, Takaishi, Takamura and Mantani5 Partly because of the focus on high-dimensional neurobiological data, cluster results have had weak correspondence to clinical symptoms, which limits understanding of the clinical relevance of brain-based subtyping.
Intergrating analysis with cluster technique
This concern can be addressed by using analytic approaches designed to identify MDD subtypes based on both neurobiology and clinical phenomenology.Reference Beijers, Wardenaar, van Loo and Schoevers2 Recent resting-state magnetic resonance imaging (MRI) studiesReference Drysdale, Grosenick, Downar, Dunlop, Mansouri and Meng3 have identified neurophysiological subtypes of MDD by applying clustering analysis, together with some dimensionality reduction via canonical correlation analysis (CCA) or principal component analysis, with functional connectivity data, clinical ratings and gene expression data. These approaches not only enhance the quality of clustering, but also facilitate interpretation of clustering results.Reference Ultsch and Lötsch6
Although previous efforts in this area have made significant advances, they have been limited by factors including small samples, multisite imaging with different scanners and acquisition protocols, limited or absent approaches for data reduction before clustering to reduce concerns with overfitting and validation, separate consideration of symptoms and biology in cluster analyses, and complex effects of medications and illness course on both symptoms and brain function on input parameters for cluster analysis.Reference Beijers, Wardenaar, van Loo and Schoevers2,Reference Marquand, Wolfers, Mennes, Buitelaar and Beckmann7 An approach that defines robust cluster results that considers MRI and symptom features simultaneously during clustering, in a large sample of medication-naïve patients with MDD, could address these concerns and advance progress in this area. To this end, we conducted a data-driven decomposition of functional MRI-defined functional brain connectivity, and defined subtypes by clustering medication-naïve patients with MDD according to a multivariate correspondence between functional network connectivity (FNC) and clinical symptoms, using a regularised canonical correlation analysis (rCCA).Reference Dinga, Schmaal, Penninx, van Tol, Veltman and van Velzen8 We then examined symptom severity and functional brain connectivity differences between identified subtypes. Finally, we applied multivariate regression modelling, to detect associations between clinical profiles and abnormal FNC in each identified subtype.
Method
Participants
We recruited 115 first-episode and medication-naïve patients with MDD at the West China Hospital of Sichuan University. Diagnoses of MDD were confirmed with the Structured Clinical Interview for DSM-IV Disorders (SCID), determined by consensus of two experienced clinical psychiatrists. All patients had not received any lifetime psychotherapy or psychiatric medications before MRI scanning, and none had a significant history of systemic or neurological illness. They received different antidepressant treatments later according to clinical guidelines. We also recruited 129 healthy controls, matched for age, gender, handedness and education, from the local area by poster advertisement. Healthy controls were screened with the SCID Non-Patient Version to confirm the lifetime absence of non-affective psychosis, eating disorders and mood and anxiety disorders. See Supplementary Table 1 available at https://doi.org/10.1192/bjp.2021.103 for detailed inclusion and exclusion criteria. Two experienced clinical psychiatrists rated clinical symptoms of patients with MDD by using the 17-item Hamilton Rating Scale for Depression (HRSD)Reference Zimmerman, Martinez, Young, Chelminski and Dalrymple9 and the 14-item Hamilton Rating Scale for Anxiety (HRSA).Reference Matza, Morlock, Sexton, Malley and Feltner10 All participants provided written informed consent and the protocol was approved by the Research Ethics Committee of West China Hospital, Sichuan University (study ethical approval number: 2018(610)).
MRI acquisition and preprocessing
Neuroimaging data were acquired with a whole-body 3.0 T MRI scanner (Siemens Trio, Erlangen, Germany), using a 12-channel head coil, including T1-weighted anatomic imaging and resting-state functional MRI. For functional studies, participants were instructed to relax with their eyes closed, and each scan lasted 6 min and 40 s (i.e. 200 volumes). See Supplementary material for the detailed information on MRI sequences and protocols.
MRI data preprocessing was done with MATLAB version R2016b for Windows (MathWorks, Inc, USA; see https://www.mathworks.com/products/matlab.html), and MRI data analyses were done with SPM12 (Wellcome Centre for Human Neuroimaging, UK; http://www.fil.ion.ucl.ac.uk/spm) and CONN version 2019b for Windows (The Gabrieli Lab. McGovern Institute for Brain Research, MIT, USA; see http://www.nitrc.org/projects/conn). Briefly, resting-state images of each participant were motion corrected, corrected for slice timing, normalised to Montreal Neurological Institute space and smoothed with a Gaussian kernel of 8 mm full width at half maximum. Denoising (e.g. physiological aliasing) and head motion correction procedures are detailed in the Supplementary material.
Group independent component analysis
Independent component analysis (ICA) is data-driven approach for constructing a whole-brain FNC within the CONN toolbox, and has been well validated. Unlike region of interest-based functional connectivity analyses, ICA can delineate distinct, coherent resting-state networks.Reference Jackson, Cloutman and Lambon Ralph11 We performed a participant-wise group ICA to uncover ordered components across all participants. Group ICA was performed with 30 components and a dimensionality reduction of 64, which are the default settings of CONN. This approach provides an optimised determination of network spatial locations for the sample, image acquisition and analysis pipeline. It also allows identification of discrete subregions/networks within networks identified by Yeo et al.Reference Yeo, Krienen, Sepulcre, Sabuncu, Lashkari and Hollinshead12 Spatial ICA was performed on the preprocessed images to decompose the data into spatial independent components. We then examined the similarity of extracted independent components with canonical resting-state networks (Yeo et al's seven networks), using spatial correlation analysis with confirmation by visual inspection. Independent components were assigned into different networks, including the visual network, sensorimotor network (SMN), dorsal attention network (DAN), ventral attention network (VAN), affective/limbic network, frontoparietal network (FPN) and default mode network (DMN). We additionally defined subcortical and cerebellar networks, which have been implicated in MDD pathophysiology (see Supplementary Fig. 1(a)).Reference Sweeney, Strojwas, Mann and Thase13 A detailed description of group ICA procedures is presented in the Supplementary material.
Functional connectivity comparison between patients and healthy controls
First-level correlation maps were produced by extracting the residual blood oxygen level-dependent time course from each independent component, and Pearson correlations were performed between each pair of independent components to index FNC. Correlation coefficients of each participant were converted to normally distributed z-scores, using the Fisher transformation for second-level generalised linear model analyses. In the second-level analysis, connectivity maps from all participants were entered into GLM to compute differences in functional connectivity between patients and healthy controls, with age, gender and head motion as covariates. Statistical significance for all comparisons was thresholded at connection-wise P < 0.001 and cluster-level false discovery rate (FDR)-corrected P < 0.05.Reference Schrepf, Kaplan, Ichesco, Larkin, Harte and Harris14 Correlation coefficients of each participant were extracted for the subsequent rCCA.
rCCA and K-means clustering
High-dimensional neuroimaging data invariably includes features not relevant to clustering results. We reasoned that more reliable and meaningful depression subtypes would be marked by a low-dimensional representation of the significant correlation between neuroimaging features and clinical symptoms. Therefore, to reduce dimensionality, in a first-step preliminary screener we first identified all significant computed Spearman's correlations (P < 0.005) between connectivity features and each item of HRSD and HRSA psychopathology ratings.Reference Drysdale, Grosenick, Downar, Dunlop, Mansouri and Meng3 Next, we used rCCA to define a low-dimensional projection from these associations for use in clustering. Then, to identify potential MDD subtypes, the two-dimensional variates (representing connectivity features and clinical symptoms, respectively) of the first component derived from the significant rCCA models were subjected to K-means clustering. The first component represents canonical correlations that describes the maximum covariation between the two multidimensional variables. The significance of the rCCA model was determined by permutation tests. Finally, the optimal cluster number and the validity of the cluster solution were determined with the ‘Nbclust’ package in R version 4.0.3 for Windows (R Foundation for Statistical Computing, Vienna, Austria; see https://cran.r-project.org/mirrors.html).Reference Charrad, Ghazzali, Boiteau and Niknafs15 Clustering stability was examined with the Jaccard coefficient and a bootstrap technique (n = 1000) in the ‘fpc’ package in R.Reference Hennig16 Methodological details regarding rCCA and K-means clustering algorithms are described in the Supplementary material.
Functional connectivity comparisons between subtypes and healthy controls
To assess whether dysfunctional FNC differed by MDD subtypes, or between subtypes and healthy controls, we performed a one-way ANOVA analysis for subtype 1, subtype 2 and healthy controls by using a GLM in CONN, with age, gender and head motion as covariates. Statistical significance for all comparisons was thresholded at connection-wise P < 0.001 and cluster level FDR-corrected P < 0.05. Post hoc t-tests were performed to compare connectivity patterns across each MDD subtype and the healthy controls group. The FDR correction maintained a corrected P < 0.05 for these comparisons.
Partial least square regression analysis
We applied partial least square regression (PLSR) to create a low-dimensional representation that relates symptoms and network connectivity. PLSR involves projecting a predictor space (X) and a response space (Y) onto a latent space, and then finding the variance in X-space that explains the maximum variance in Y-space. This statistical approach is suited for the current problem because it can work with multivariate response variables as well as multicollinearity among the predictors.Reference Maitra and Yan17 We constructed a PLSR model for both subtype 1 and subtype 2 (the two subtypes defined by the cluster analysis), to examine relations between subtype-differentiated connectivity features and subtype-differentiated symptoms. In addition, to assess the association of connectivity alterations and symptoms in patients with MDD as a whole, we also conducted a PLSR model for the whole MDD group. Details of this analysis are presented in the Supplementary material. A graphic representation of the analysis pipeline is presented in Fig. 1.
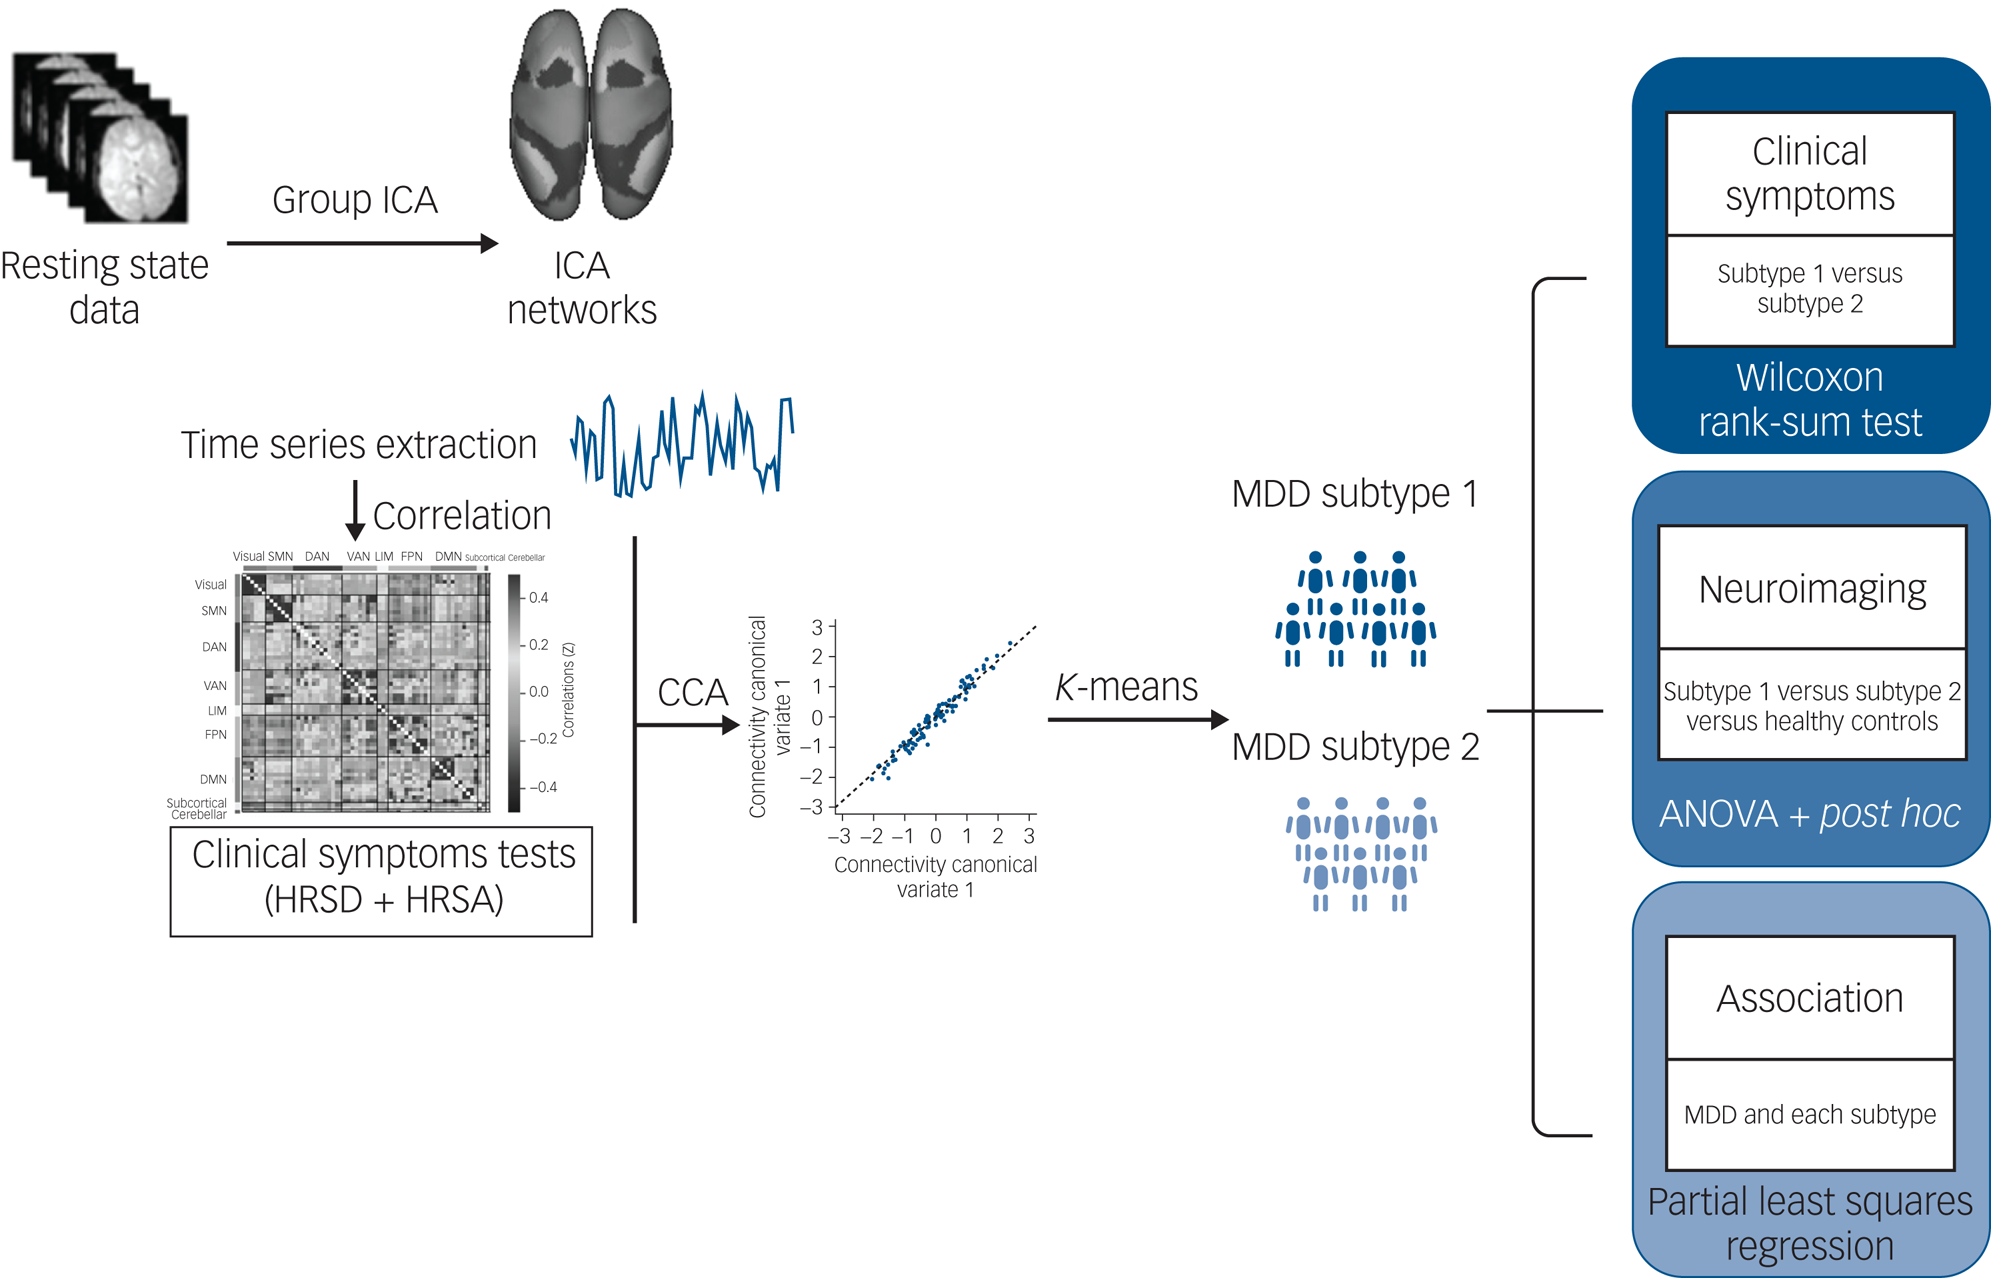
Overview of data processing and analysis pipeline. Group independent component analysis (ICA) was used to calculate and extract the average signal time series from brain parcellations. Following data reduction steps, connectivity networks and clinical symptoms were used to perform a regularised canonical correlation analysis (CCA). Regarding the discovery of categorical biotypes, K-means clustering was used to test identify subtypes defined by associations between functional network connectivity and symptoms patterns. Finally, the Wilcoxon rank-sum tests were used to test for differences in the severity of clinical symptom scores between subtypes. The generalised linear modelanalyses were performed to examine common and distinct network connectivity patterns across groups. The associations between specific symptoms and distinct network connectivity patterns were examined with partial least squares regression. DAN, dorsal attention network; DMN, default mode network; FPN, frontoparietal network; HRSA, Hamilton Rating Scale for Anxiety; HRSD, Hamilton Rating Scale for Depression; LIM, limbic network; MDD, major depressive disorder; SMN, sensorimotor network; VAN, ventral attention network.
Results
Group ICA
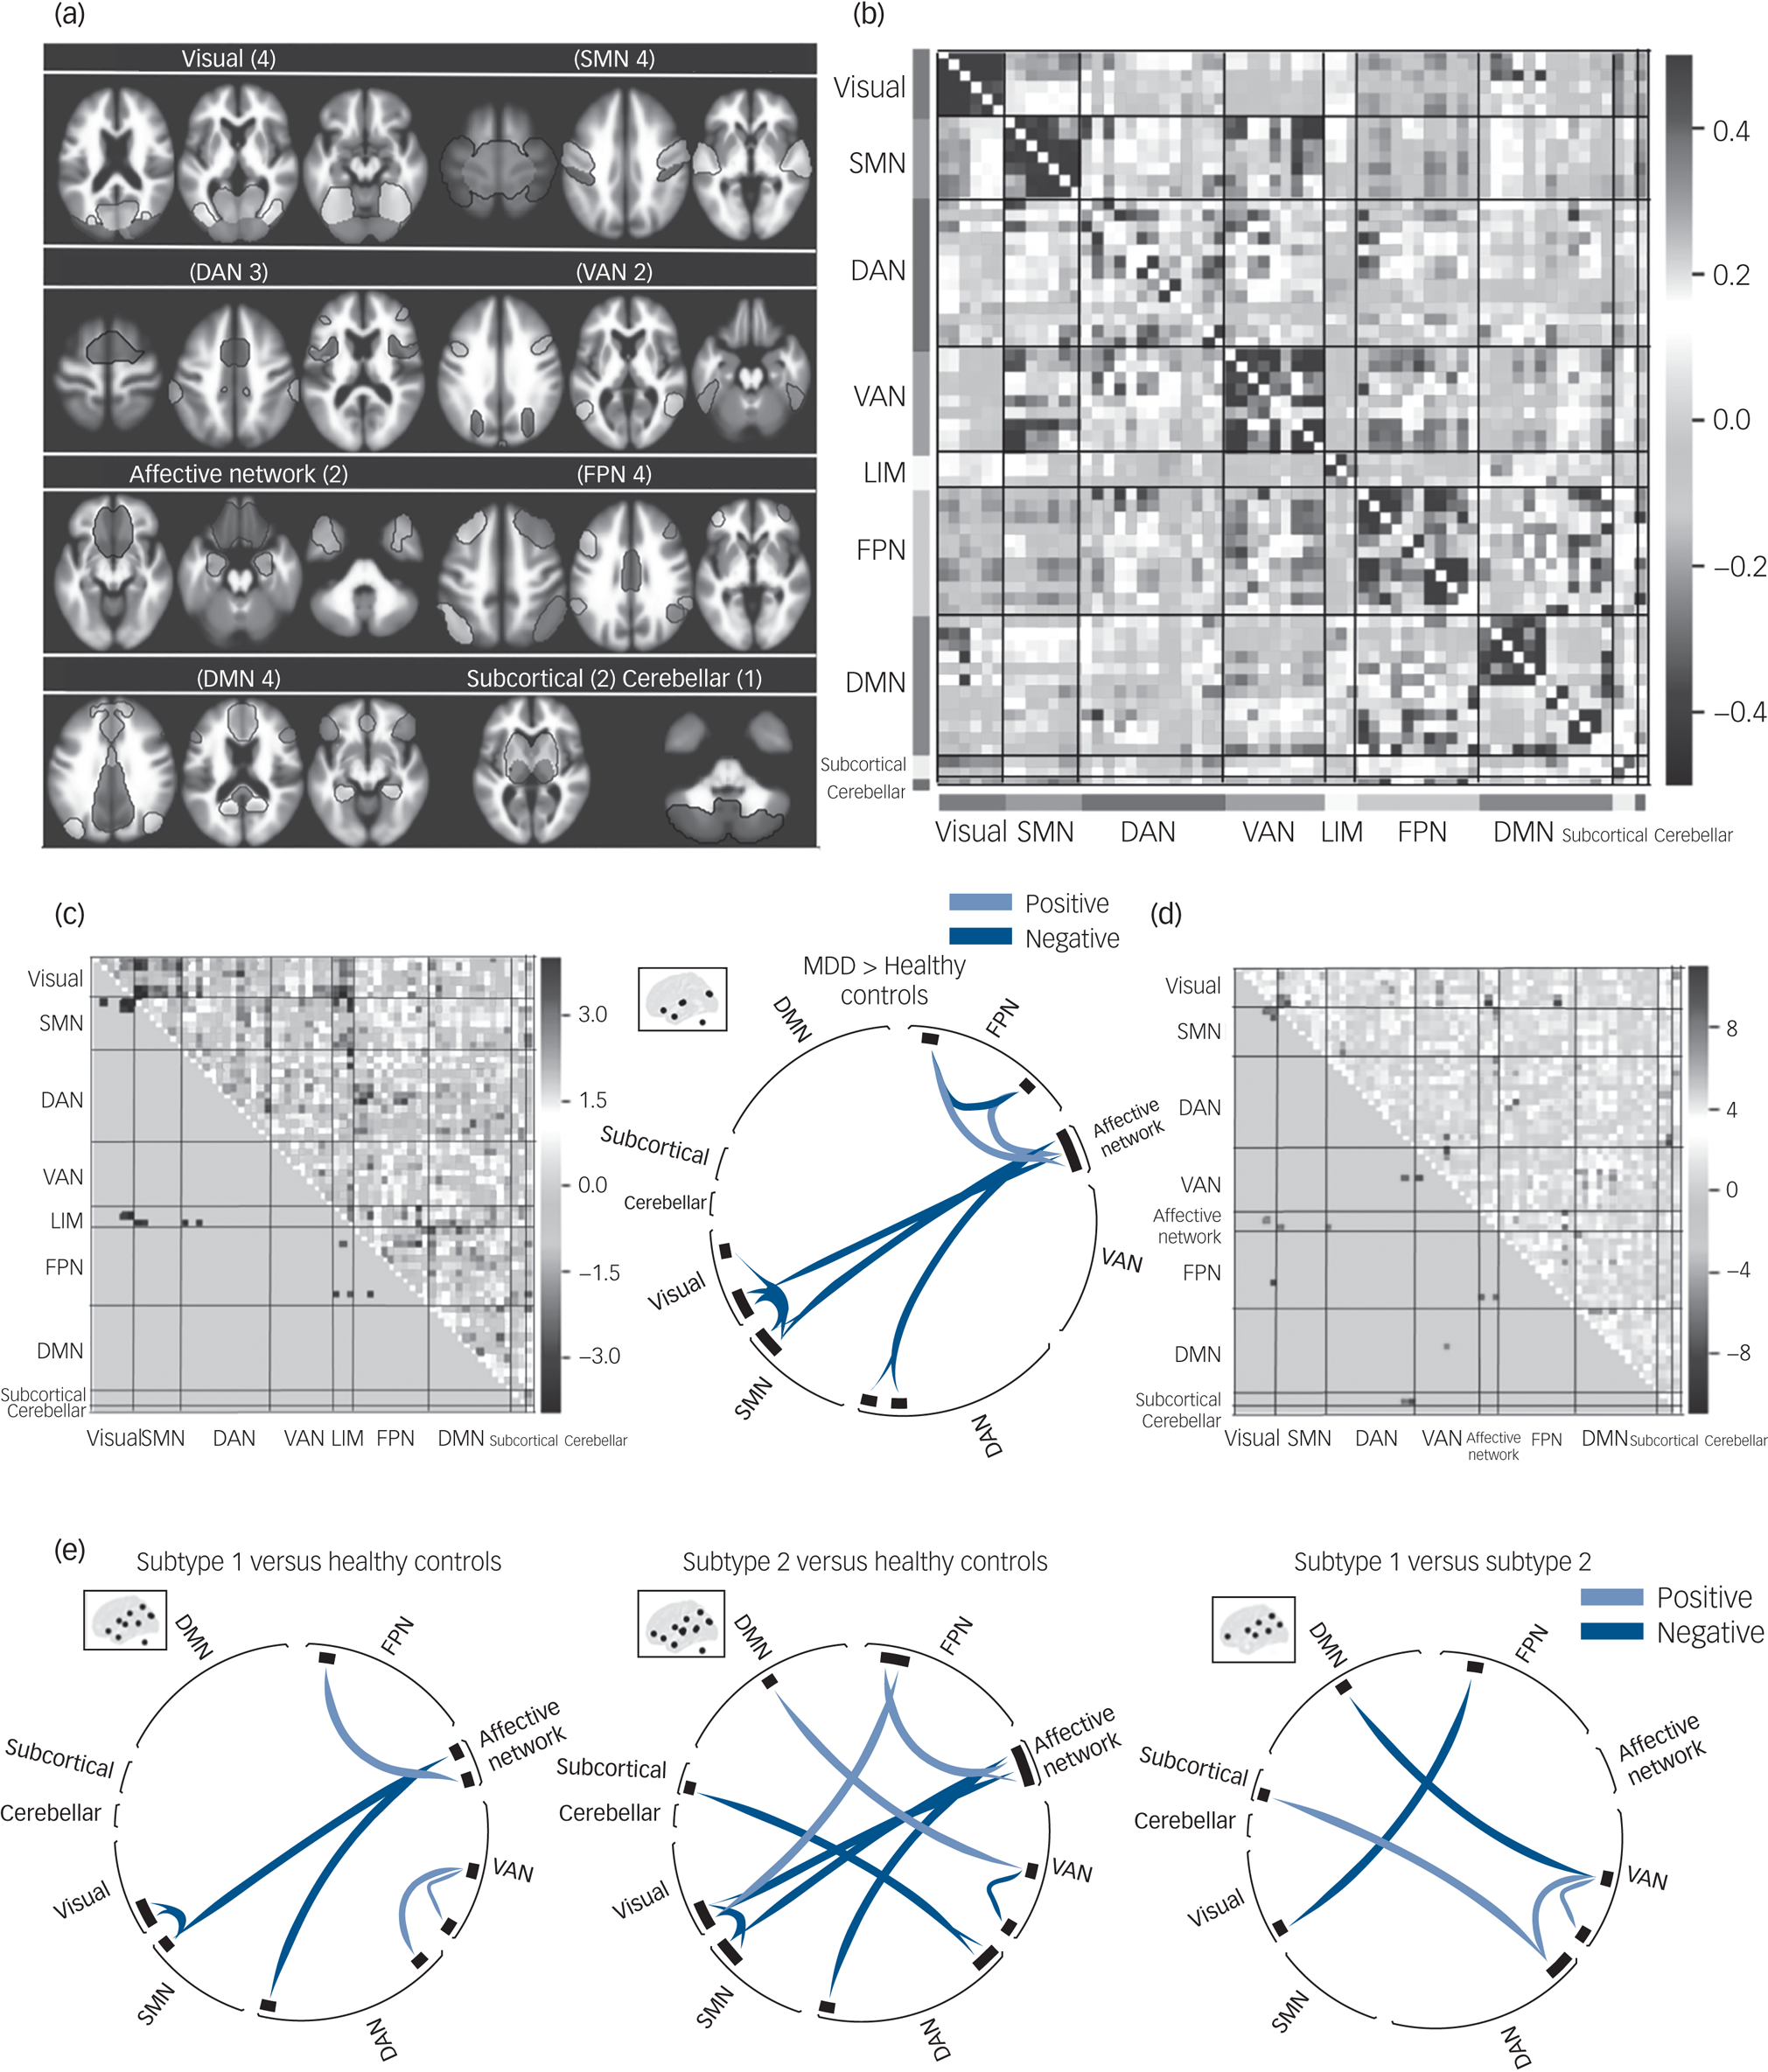
The spatial matching across all participants between extracted independent components and Yeo et al's seven networks implemented in CONN are shown in Supplementary Fig. 1. Among the 30 independent components, four were identified as noise components, leaving 26 for subsequent connectivity analyses. The selected 26 independent components included four independent components in the visual network, four independent components in the SMN, three independent components in the DAN, two independent components in the VAN, two independent components in the limbic network (LIM), four independent components in the FPN, four independent components in the DMN, two independent components in the subcortical network and one independent component representing the cerebellar network (see Fig. 2(a)). More details including the labels and peak coordinates of these independent components are presented in Supplementary Table 2.
The functional network connectivity (FNC) differences between MDD, MDD subtypes and healthy controls. (a) Nine functional networks identified by group independent component analysis. (b) Whole-brain 64 × 64 averaged functional connectivity matrix between independent component pairs was computed over all participants. The value in the correlation matrix represents the Fisher's z-transformed Pearson correlation coefficient. (c) Heat map and circular plot showing features that were significantly abnormal in patients with MDD relative to healthy controls. (d) Heat map showing significant results of ANOVA in FNC among MDD subtypes and healthy controls. (e) Circular plots showing significant FNC patterns between subtype 1, subtype 2 and healthy controls, using post hoc analyses. Results of statistical comparisons were thresholded at connection-wise P < 0.001 with false discovery rate–corrected P < 0.05. DAN, dorsal attention network; DMN, default mode network; FPN, frontoparietal network; LIM, limbic network; MDD, major depressive disorder; SMN, sensorimotor network; VAN, ventral attention network.
rCCA and K-means clustering
Results of rCCA analysis indicated that the first component has the highest canonical correlation coefficient (r = 0.86) between FNC and clinical symptoms, by permutation test (see Supplementary Fig. 2). Therefore, the first component, including two canonical variates of FNC and clinical features, was used as input for the cluster analysis.
Participants with MDD were subdivided into two subtypes by K-means clustering analysis of the two-dimensional variates. In terms of the cluster distribution, 59 and 56 patients were partitioned into subtypes 1 and 2, respectively. Validity and stability analyses showed that the two cluster solution had the highest silhouette index (0.56) and Jaccard similarity (0.82) (Supplementary Fig. 3).
Demographic and clinical profiles in MDD subtypes
Demographic and clinical data for each subtype are shown in Table 1. HRSD and HRSA total scores did not differ between subtypes, indicating that the discrimination was not by illness severity (Fig. 3(c)).
Demographic features of the two subtypes of patients with major depressive disorder and healthy controls

All data are shown as mean (s.d.) or ratios. HRSD, Hamilton Rating Scale for Depression; HRSA, Hamilton Rating Scale for Anxiety.
a. Level 1: bachelor’s or equivalent education; level 2: postsecondary non-tertiary or upper secondary education; level 3: lower secondary education; level 4: primary education; level 5: no education.
Subtype-specific clinical profiles for (a) depression symptoms and (b) anxiety symptoms that varied most significantly by cluster (P < 0.05, Wilcoxon rank-sum tests, false discovery rate corrected). Each item value was z-transformed with respect to the mean for all patients in each subtype. (c) Boxplot of subtype differences in overall depression and anxiety severity (total HRSD/HRSA score). (d) Loadings of the distinct functional network connectivity (FNC) and clinical symptoms from partial least squares regression (PLSR) in each of the two identified subtypes. The left graph shows loadings of PLSR relating distinct FNC (within the VAN) to insomnia-middle (D5) in subtype 1; the right graph shows loadings of PLSR relating distinct FNC (between the subcortical network and DAN) to anhedonia symptoms (D7) in subtype 2. Items in HRSA and HRSD rating instruments are presented on the y-axis (e.g. D7 is the seventh item of HRSD). The asterisk indicates significant difference from mean symptom severity rating for all patients, P < 0.05; error bars depict s.e.m. *P < 0.05, **P < 0.005, ***P < 0.001.

We used the Kruskal–Wallis ANOVA to test subtype differences in scores for each item of the HRSD and HRSA. Eleven symptom measures showed significant differences, with anhedonia symptoms prominent in subtype 1 and sleep maintenance insomnia prominent in subtype 2 (Fig. 3(a) and 3(b)).
Group comparison of FNC
Comparisons of FNC between the combined MDD group and healthy controls showed abnormal connectivity patterns, including hypoconnectivity within the FPN, visual network and SMN, LIM and SMN, and LIM and DAN, and hyperconnectivity between the FPN and LIM in the MDD group (Fig. 2(c)).
Distinct patterns of abnormal FNC between networks were observed in the two MDD subtypes. Compared with healthy controls, subtype 1 showed hyperconnectivity between the VAN (left central opercular gyrus) and DAN (right lateral occipital gyrus) and within the VAN (between left supramarginal gyrus and left central opercular gyrus). By contrast, subtype 2 showed hyperconnectivity between the DMN (left praecuneus) and VAN (left operculum), FPN (right frontal pole) and visual network (right occipital gyrus), and subcortical network (bilateral thalamus) and DAN (bilateral lateral occipital gyrus), and hypoconnectivity within the VAN (between left supramarginal gyrus and left operculum) (Fig. 2(e)).
In addition, there were common (‘shared’) connectivity abnormalities across the two patient groups versus healthy controls (subtype 1 versus healthy controls and subtype 2 versus healthy controls), which involved hypoconnectivity between the visual network (bilateral occipital gyrus) and SMN (right superior temporal gyrus), affective network (frontal orbital/medial gyrus) and SMN (right superior temporal gyrus), and affective network (frontal orbital/medial gyrus) and DAN (right middle temporal gyrus), and hyperconnectivity between the affective network (left amygdala/hippocampus/temporal pole) and FPN (left cerebellum-crus II) (Fig. 2(d) and 2(e)).
Association between FNC and MDD symptoms
Significance of exploratory pairwise correlations in PLSR model was determined by permutation test (P < 0.05, n = 1000). Hyperconnectivity within the VAN was only negatively correlated with sleep maintenance insomnia in subtype 1. Anhedonia was only positively correlated to hypoconnectivity between the subcortical network and DAN in subtype 2. To illustrate relations between FNC and symptoms, feature loadings are shown in Fig. 3(d). There were no other significant associations in the PLSR analyses.
Discussion
Main findings
The considerable heterogeneity of MDD presents a major obstacle for the development of new treatment and personalised medicine. Many previous studies have worked to parse this heterogeneity in either purely clinical or biological terms – strategies that have had limited utility and an unclear relationship to clinical practice. In the present study, we evaluated a cohort of 115 patients with first-episode MDD, and used an analytic approach that considered neuroimaging and clinical ratings simultaneously. Importantly, the patients with MDD were treatment-naïve, so that medication effects on functional connectivity patterns symptoms and symptoms did not confound the data analysis. We identified two specific MDD subtypes with different symptom domains (insomnia dominated and anhedonia dominated) that had distinct patterns of FNC alteration. Our findings provide insight into MDD heterogeneity in biological and clinical terms, and represent a promising step toward categorical subtype classification and, potentially, the development of personalised treatments for MDD.
Interpretation of our findings
Of the two subtypes we defined, subtype 1 had more prominent sleep maintenance insomnia and genital symptoms. In contrast, subtype 2 demonstrated more prominent depressed mood, feelings of guilt, suicide attempts and lack of enjoyment (anhedonia). Importantly, total scores of depression and anxiety severity did not differ between subtypes, indicating that our subtype delineation did not merely separate mild and more severely ill patients. Heterogeneity regarding insomnia and anhedonia features have long been considered in depression research, and our findings advance those clinical conceptualisations by linking them to different regional alterations in functional brain systems.
Biological differences associated with these two symptom dimensions included hyperconnectivity within the VAN, a network involved in attention to salient events (especially negative events)Reference Menon and Uddin18 that was associated with more severe insomnia. This association suggests that an overactivation of attention systems might be related to difficulties achieving and maintaining restful sleep. This is consistent with a previous study demonstrating that increased resting-state activity in the VAN was related to a hyperarousal state and insomnia in patients with MDD.Reference Buysse19 In contrast to this hyperconnectivity, hypoconnectivity in the subcortical network and DAN, networks involved in orienting attention to internal thoughts rather than engaging with the external world,Reference Kaiser, Andrews-Hanna, Wager and Pizzagalli20 were more characteristic of subtype 2, consistent with their association with anhedonia symptoms. These findings indicate that distinct patterns of FNC were associated with hyperarousal features of MDD and with the deficits of social motivation and hedonic tone. Importantly, not only were there different symptom-brain correlations, but the two patterns were evident in different subgroups of patients with MDD. Thus, these observations may be helpful for understanding the complex pathophysiological mechanisms of MDD and its clinical heterogeneity. Further, they may suggest the need to target different neural systems in patients with MDD, depending on their pattern of symptom manifestation.
In addition to these distinguishing subtype features, some abnormal network patterns were shared across the two patient subgroups. Overlapping abnormalities included hypoconnectivity among the visual network and SMN, and affective network and SMN, networks involved in emotion and sensorimotor processing,Reference Snyder21 and hyperconnectivity between the FPN and affective network, networks involved in visceral/emotional monitoring.Reference Helm, Viol, Weiger, Tass, Grefkes and Del Monte22 These findings highlight that although patients with MDD as a group share some traits, distinguishing features of subtypes of patients can still be identified. From a broader perspective, our findings indicate that combining clinical and neurobiological features in subtype identification may permit delineation of distinct and clinically relevant subtypes of patients with MDD, to advance integration of neurobiology with clinically relevant behavioural features for refining disease classification and treatment for depression syndromes.Reference Insel and Cuthbert23
Heterogeneity is a common issue not only for MDD but across psychiatric syndromes. Identification of discrete homogeneous subtypes is becoming recognised as an important path for the development of more personalised diagnostics and treatments.Reference Beijers, Wardenaar, van Loo and Schoevers2 Working to resolve heterogeneity by using both clinical and neurobiological information together represents a promising strategy in this regard. Although our findings represent a significant step forward in this direction, they to be replicated and their clinical utility needs to be established in clinical trials.Reference Dinga, Schmaal, Penninx, van Tol, Veltman and van Velzen8 Further, given the complexity of the problem, group clustering efforts such as ours are beginning with single or a small domain of biological phenotypes. In the longer term, combining wider ranges of phenotypes in predictive/classification models likely will be needed to optimize subtype characterisation for nosology refinement and identifying targets for subtype-specific therapies. Comparison of different methodological approaches for identifying subtypes will also be needed. In the present study, we used a regularised version of CCA to incorporate latent relations between neuroimaging and clinical data-sets, which tends to avoid overfitting and unstable solutions that can result from use of classical CCA,Reference Xia, Ma, Ciric, Gu, Betzel and Kaczkurkin24 but alternative approaches may have benefits as well.
Limitations
Out study has limitations that need to be considered. First, although we used the bootstrapping method to establish the stability of clustering, we did not have an external validation data-set to replicate the clustering results. Second, our study included treatment-naïve patients with first-episode MDD. This group is useful for identifying disease-related features independent of drug treatment effects, but it is unclear whether our findings would be applicable to MDD groups with multiple prior episodes and active antidepressant therapy, and across the lifespan, to paediatric and elderly patients. Third, more precise estimates of functional connectivity may be obtained using longer data acquisitions, which can increase the reliability of intrinsic connectivity estimates compared with 5–7 min of resting-state data.Reference Birn, Molloy, Patriat, Parker, Meier and Kirk25
Practical implications
The aim of the present study was to use the association between clinical profiles and functional brain imaging features in an integrated way for the purpose of defining MDD subtypes. We applied a rCCA and clustering-based method, considering both neuroimaging and clinical data, to define two subtypes of MDD that differentiated both in their symptom profiles (insomnia dominated and anhedonia dominated) and distinct patterns of altered brain function. Although the two subtypes were associated with different MDD symptom features, they cannot be simply distinguished in overall depression severity or duration, as has been a challenge in some previous efforts at subgroup identification. Further, we note that neither subtype was a rare entity, with the two subtypes being relatively equally represented in our sample. Our specific findings regarding the neurobiological-clinical framework for defining subtypes need to be examined in terms of its utility for personalising MDD treatments, and for guiding treatment development efforts. Success in such efforts would accelerate personalised treatment for depression, and speed the integration of neuroscience-based evaluations and clinical/behavioural evaluation in providing optimal treatment for patients with MDD.
Supplementary material
To view supplementary material for this article, please visit https://doi.org/10.1192/bjp.2021.103
Funding
This study was supported by the National Natural Science Foundation of China (grant numbers 81171488, 81621003, 81671669 and 81820108018) and Science and Technology Project of Sichuan Province (grant number 2017JQ0001).
Acknowledgements
Drs. Q. Gong and X. Huang contributed equally to playing the role of corresponding and senior author. The authors thank the patients who volunteered to participate in this study.
Data availability
The data that support the findings of this study are available from the corresponding author, X. Huang, upon reasonable request.
Author contributions
Y.W., S.T. and Q.G. contributed to the conception and design of the study. Y.W. and S.T. performed the analyses and drafted the manuscript. L.Z., X.B., J.A.S. and L.L. participated in discussion of statistical analyses and imaging analyses. H.L., Y.G., X.Hu, Z.J. and W.K. recruited participants and collected the data. J.A.S., Q.G. and X.Huang reviewed and revised the manuscript. Q.G. and X.Huang obtained grant funding. All authors read and approved the final version of the submitted manuscript.
Declaration of interest
J.A.S. consults for VeraSci. All other authors report no conflicts of interest.


 Open access
eLetters
No eLetters have been published for this article.