

1 INTRODUCTION
In recent years, the two-dimensional (2D) distribution of galaxy properties has provided a remarkably high number of useful constraints to understand galaxy formation and evolution processes. For example, the stellar and gas 2D line-of-sight kinematics are strongly linked with galaxy intrinsic shape, internal orbital structure, and radial mass-to-light ratio (M/L) profile (e.g. van der Marel & Franx Reference van der Marel and Franx1993; Gerhard Reference Gerhard1993; Cretton, Rix, & de Zeeuw Reference Cretton, Rix and de Zeeuw2000; Cappellari et al. Reference Cappellari2013b). Furthermore, from absorption line index and/or full spectral fitting analyses, it is possible to extract the luminosity- and mass-weighted parameters of the integrated stellar population (e.g. age, total metallicity [Z/H], α-element abundance [α/Fe], stellar initial mass function), as well as single chemical element abundances (e.g. Kuntschner et al. Reference Kuntschner2010; McDermid et al. Reference McDermid2015).
Long-slit spectroscopy, along different position angles in a galaxy, has been used in the past to access this 2D information (e.g. Davies & Birkinshaw Reference Davies and Birkinshaw1988; Statler & Smecker-Hane Reference Statler and Smecker-Hane1999; Saglia et al. Reference Saglia2010). Even though this approach provides information out to large radii, it is incapable of properly mapping the galaxy internal structure and requires a large amount of telescope time (Statler Reference Statler1994; Arnold, de Zeeuw, & Hunter Reference Arnold, de Zeeuw and Hunter1994). Furthermore, the spectra are obtained at different times, suffering from systematic effects in the case of imperfect sky subtraction.
A way to overcome such issues is the use of Integral Field Unit (IFU) spectrographs. These instruments are able to obtain full spectral coverage of a 2D field-of-view (FoV) with a single exposure. Because of their efficiency, IFU spectrographs have been extensively used in surveys to explore the properties of large numbers of galaxies in the nearby Universe, although without being able to explore out to more than a few effective radii (Re).
For instance, the ATLAS3D survey used the SAURON IFU (Bacon et al. Reference Bacon2001) to explore the kinematics and the stellar populations of 260 local early-type galaxies (ETGs) in their inner regions (i.e. probing R < 1Re in most cases, Cappellari et al. Reference Cappellari2011). Similarly, the Sydney-AAO Multiobject Integral-field spectrograph (SAMI) is used in the SAMI survey to observe 3400 galaxies, reaching not much beyond 2Re (Bryant et al. Reference Bryant2015).
In some cases, IFU spectrographs have been used to explore the galaxy chemodynamics beyond 1Re.
For example, using the SAURON spectrograph, Weijmans et al. (Reference Weijmans2009) measured both kinematics and absorption line-strengths in NGC 821 and NGC 3379 out to almost 4Re. With a larger sample, the Visible Integral-field Replicable Unit Spectrograph prototype (VIRUS-P) has been used to study the kinematics (Raskutti, Greene, & Murphy Reference Raskutti, Greene and Murphy2014) and stellar populations parameters (Greene et al. Reference Greene, Murphy, Graves, Gunn, Raskutti, Comerford and Gebhardt2013) of ETGs out to R ≈ 2.5Re, although with poor velocity resolution (i.e. σ ≈ 150kms−1) and low S/N ratio at large radii. The same instrument is also used for the MASSIVE survey, which targets the most massive ETGs (i.e. M ⋆ ⩾ 1011.5M⊙, Ma et al. Reference Ma, Greene, McConnell, Janish, Blakeslee, Thomas and Murphy2014). Furthermore, the Calar Alto Legacy Integral Field Area Survey (CALIFA) takes advantage of the PMAS/PPAK instrument and aims to observe 600 galaxies in the local Universe out to generally 2Re (Sánchez et al. Reference Sánchez2012). Finally, an even larger sample of galaxies is that explored by the Mapping Nearby Galaxies at APO (MaNGA, i.e. ≈ 10000 galaxies), but with a FoV still limited to the inner 1.5–2.5Re (Bundy et al. Reference Bundy2015).
As shown by Brodie et al. (Reference Brodie2014), in a typical ETG, only a small fraction of the total galaxy mass and angular momentum is included in the inner few Re. Furthermore, whilst these inner regions are dominated in mass by the stellar component, at large radii the dominant component is the dark matter (DM). In order to sample a sufficiently large fraction of total galaxy mass and angular momentum, good 2D spatial coverage is needed in both these regions. In particular, it is important to consistently measure the stellar kinematics and population parameters at both small and large radii.
Applying the Stellar Kinematics from Multiple Slits (SKiMS) method (Norris et al. Reference Norris2008; Proctor et al. Reference Proctor, Forbes, Romanowsky, Brodie, Strader, Spolaor, Mendel and Spitler2009; Foster et al. Reference Foster, Proctor, Forbes, Spolaor, Hopkins and Brodie2009), it is possible to measure both the kinematics and the metallicity of nearby galaxy stellar components out to large radii (e.g. Foster et al. Reference Foster, Arnold, Forbes, Pastorello, Romanowsky, Spitler, Strader and Brodie2013; Arnold et al. Reference Arnold2014; Pastorello et al. Reference Pastorello, Forbes, Foster, Brodie, Usher, Romanowsky, Strader and Arnold2014). In particular, Foster et al. (Reference Foster, Pastorello, Roediger, Arnold, Brodie, Forbes, Romanowsky and Spitler2015) obtained SKiMS kinematic measurements out to 5Re (2.6Re on average) and Pastorello et al. (Reference Pastorello, Forbes, Foster, Brodie, Usher, Romanowsky, Strader and Arnold2014) metallicity measurements out to about 3Re.
The original SKiMS method was developed to extract the background galaxy stellar light spectra from the same DEIMOS slits that were primarily targeting globular cluster (GC) candidates. In this way, the galaxy stellar component is probed at randomly scattered spatial positions. Furthermore, the bright inner galaxy regions are not targeted, since GCs are difficult to detect in the presence of a strong stellar background. In order to include the innermost regions in their dynamical models of 14 ETGs, Cappellari et al. (Reference Cappellari2015) combined the SKiMS large-radii stellar kinematics with those from ATLAS3D at small radii.
The use of two different datasets required the accounting for a number of systematic issues given by the non-homogeneity of the data (e.g. different spatial sampling and kinematic uncertainties). A way to overcome such issues is to use an homogeneous, although optimal azimuthally and spatially distributed, kinematic dataset.
Here, we present a new mask design that takes advantage of the Keck/DEIMOS multislit spectrograph to reliably explore the stellar kinematics and stellar population parameters in ETGs out to large radii, with complete azimuthal coverage. We name this SuperSKiMS, since it is an application of the SKiMS method on data obtained using specially designed multislit masks. In particular, the Keck/DEIMOS slit distribution in the SuperSKiMS configuration allows for the optimal sampling of both the inner and the outer regions of nearby galaxies. Tho demonstrate this, we present the results from mock SuperSKiMS simulations in order to show that such a technique can return data comparable to that from IFU spectroscopy. In particular, we use such simulated observations to extract the total mass profile slope of the nearby lenticular galaxy NGC 1023 from the modelling of the galaxy kinematics. These results are compared with those obtained from ATLAS3D kinematic measurements in the centre and with the results by Cappellari et al. (Reference Cappellari2015) (i.e. using a similar but smaller sample, with a shorter radial baseline).
Moreover, we use two SuperSKiMS masks to obtain new stellar kinematics and metallicity measurements for NGC 1023. These values are used together with already published SKiMS measurements, thus extending the study of stellar kinematics and metallicity out to 3.6 and 2.5Re, respectively.
At such galactocentric radii, the stellar light from the galaxy is just 1.6 and 5.5% of the sky flux at similar wavelengths. At the same time, our new data extend into the central regions of NGC 1023, overlapping with several published longslit and IFU observations.
We then evaluate how the addition of these new datapoints to the dataset affects several results already presented in the SAGES Legacy Unifying Globulars and GalaxieS (SLUGGS) survey.
In particular, from the new stellar velocity and velocity dispersion 2D maps, we measure the radial specific angular momentum profile and compare it with the results from Foster et al. (Reference Foster, Pastorello, Roediger, Arnold, Brodie, Forbes, Romanowsky and Spitler2015). From the stellar-metallicity 2D distribution, we extract the azimuthally averaged radial metallicity profiles, from which we obtain new measurements for the inner (i.e. R < 1Re) and outer (i.e. R ⩾ 1Re) metallicity gradients and compare them with the results presented in Pastorello et al. (Reference Pastorello, Forbes, Foster, Brodie, Usher, Romanowsky, Strader and Arnold2014) and Forbes et al. (Reference Forbes, Pastorello, Romanowsky, Usher, Brodie and Strader2015).
In this work, we assume the following NGC 1023 parameters: effective radius Re = 48arcsec, axial ratio b/a = 0.37, position angle PA = 83.3° and distance d = 11.1Mpc (Brodie et al. Reference Brodie2014). The NGC 1023 photometric decomposition by Savorgnan & Graham (Reference Savorgnan and Graham2016) shows that a faint but spatially extended bar is present in the galaxy inner regions. Such a bar extends out to R bar ≈ 40arcsec and has a width of w bar ≈ 20arcsec, oriented ΔPA = −22° from the galaxy major axis PA.
The structure of the paper is as follows. In Section 2, we describe the new SuperSKiMS mask design and observation method. In Section 3, we then present how, under typical observing conditions, the data from the SuperSKiMS technique would compare with ATLAS3D data in the inner regions of NGC 1023. In Section 4, we model the galaxy mass density distribution with both the original SKiMS, the ATLAS3D, and the SuperSKiMS mock datasets. Section 5 describes the observation and data reduction of two SuperSKiMS masks on NGC 1023. In Section 6, we present the extraction of stellar kinematics and metallicity 2D maps and radial profiles, which we compare with available literature measurements in Section 7. In the same Section, we compare the results with those from Foster et al. (Reference Foster, Pastorello, Roediger, Arnold, Brodie, Forbes, Romanowsky and Spitler2015) and Pastorello et al. (Reference Pastorello, Forbes, Foster, Brodie, Usher, Romanowsky, Strader and Arnold2014), in order to show the improvement given by the addition of the new data. Finally, in Section 8, we present our conclusions.
2 SuperSKiMS MASK DESIGN
As discussed in Section 1, IFU instruments are able to probe the 2D galaxy kinematic and stellar population structures with very high spatial resolution, but they are limited in spatial extent. As a consequence, observing a large FoV with IFU spectroscopy is time-expensive since it requests a high number of pointings.
To extend the exploration to larger galactocentric radii in nearby ETGs, one can use longslit or multi-object spectrographs. In the first case, the use of simple longslits at multiple position angles allow the exploration out to several Re (e.g. Statler & Smecker-Hane Reference Statler and Smecker-Hane1999; Saglia et al. Reference Saglia2010).
In the second case, one can take advantage of multi-object spectrographs. Such instruments generally have a large FoV which allows for a wide distribution of slits in 2D. The spatial sampling of multislit spectrographs is not comparable with that of IFUs, as the latter naturally sample a 2D field in a contiguous pattern. This limitation can be partially overcome by adopting a reliable spatial interpolation technique together with an optimally designed 2D slit distribution.
Here, we present a new multislit mask design, which we call SuperSKiMS, that maximises the azimuthal coverage of the stellar field around the galaxy centre. In particular, we test this design on the DEIMOS spectrograph mounted on the Keck II telescope. Given a number of DEIMOS masks N used on a given target, the slits in a single mask can be placed within a cone of angle α = 180/N°. In this way, the whole set of masks gives complete azimuthal coverage of the field.
In Figure 1, we show the slit distribution of a prototype DEIMOS mask in which the slits are distributed within 45° cones. In this configuration, four masks are needed to cover the whole azimuthal range (i.e. 360°).
SuperSKiMS slit distribution for a NGC 1023 mask assuming four slit mask pointings. The upper panel shows the layout of a DEIMOS mask optimised for the best azimuthal coverage. The red lines show the positions and lengths of the slits targeting the integrated stellar population. The blue lines show the positions of the ‘sky’ slits used for the non-local sky subtraction. The green dotted lines show the two 45° cones within which the slits are distributed. In this configuration, four masks are required to cover the whole azimuthal range (i.e. 360°). In the bottom panel, the NGC 1023 R-band photometric profile along the major axis by Noordermeer et al. (Reference Noordermeer2008) is plotted as a black solid line. In this case, the x-axis represents the real galactocentric radius along the major axis.

Each SuperSKiMS mask design is adapted to the specific galaxy under observation, given its 2D galaxy surface brightness distribution (i.e. ellipticity and effective radius) and a total exposure time of 2h for each mask. The length of each slit is defined from the galaxy surface brightness radial profile in order to obtain a spectrum (after the sky subtraction) with S/N > 8, which is the threshold to reliably measure the stellar kinematics. Arnold et al. (Reference Arnold2014) showed that a S/N cut-off at ~ 8 generally corresponds to a surface brightness of μi ~ 23magarcsec−2. This cut-off allows for DEIMOS spectra kinematic measurements that are commensurate with the estimated kinematics errors. Below this S/N ratio threshold, velocity measures may become unreliable.
In the innermost regions, the minimum slit length is 3 arcsec. In proportion to the galaxy surface brightness profile, larger galactocentric radii slits are longer in order to increase the signal at the expense of the spatial accuracy of the spectra.
The outermost regions of the mask are reserved for ‘sky’ slits or alignment star boxes. In the first case, the spectra retrieved from the ‘sky’ slits are used to model the sky contribution. In addition, between the outer ‘sky’ and the inner stellar mask regions, slits targeting GC candidates can be included in the mask design pattern.
A limitation of DEIMOS is that slits cannot overlap vertically in the mask design. Under this constraint, we need to optimise their spatial distribution in order to maximise the 2D sampling density.
This optimal slit distribution in a cone is found via Monte Carlo simulations. We simulated 5000 random slit distributions and, for each of them, we measure the radius of the largest circle (fully within the cone) that can be built in the empty space between the slits. By minimising this value, we retrieve the slit distribution which has the best spatial sampling.
The total number of slits in each mask is a free parameter and strongly depends on the surface brightness profile of the galaxy under observation along the mask direction.
3 COMPARING SuperSKiMS MASK DESIGN WITH ATLAS3D
As discussed in Section 2, issues with the DEIMOS mask alignment software prevented us from properly testing the SuperSKiMS mask design. As a consequence, the lack of good sampling in the inner regions and the non-optimal coverage of the whole field by our slits prevented us from obtaining 2D kinematic and metallicity maps fully comparable to IFU data.
Here, we simulate the sampling of the SuperSKiMS central data and how well kriging can recover the underlying field. To simulate the potential dataset returned by the SuperSKiMS approach in absence of alignment issues, we merge the available standard observations (mostly outside the ATLAS3D FoV) with mocked slits in the central regions (within the ATLAS3D FoV). The mocked slit data are obtained by selecting from the ATLAS3D dataset the kinematic and metallicity values at the location of the SuperSKiMS slits, assuming a mask with slits within 45° cones observed four times (i.e. each time rotated by 45° around the galaxy/mask centre). Since most mocked SuperSKiMS slits spatially overlap with more than one ATLAS3D pixel, to retrieve their values, we average the ATLAS3D values within the slits’ surface, according to the slits’ orientation. The uncertainties associated with the mocked slits are the sum in quadrature of the uncertainties of all the spatially overlapping ATLAS3D measurements. We do not include any additional systematic error to account for the use of two different instruments, as our data is consistent with ATLAS3D data in the overlapping regions (see Figure 8).
In Figure 2, we present a comparison between velocity, velocity dispersion, and metallicity 2D maps from the mocked SuperSKiMS and ATLAS3D data in the innermost region. In the SuperSKiMS simulation, we build the kriging map from the 43 mocked slits that overlap with the ATLAS3D FoV.
Comparisons between SuperSKiMS and ATLAS3D 2D maps. From top to bottom, the first column of panels shows the 2D velocity (A), velocity dispersion (D) and [Z/H] (G) kriged maps for the central regions of NGC 1023. These maps are obtained with kriging from a mocked SuperSKiMS dataset, in which the slits in the ATLAS3D field-of-view are extracted from the ATLAS3D kinematics and metallicity maps. Panels B, E, and H show the ATLAS3D velocity, velocity dispersion, and metallicity 2D maps, respectively, on the same spatial scale. Since ATLAS3D data is spatially binned, here we apply linear interpolation in order to obtain smooth 2D maps. In the third column of panels (C, F, and I), the differences between the ATLAS3D and the SuperSKiMS inner region maps are shown, colour coded according to the colour bars on the right-hand side. Since the difference is measured on the ATLAS3D datapoint locations, we apply linear interpolation in order to obtain smooth 2D maps. The right side colour bars have the same dynamical range as those on the left side of the plot. In all the maps, the black circles show the positions of the SuperSKiMS slits and the solid line shows the layout of the ATLAS3D data. Note that the Galactic star visible in the ATLAS3D field in the top-left corner is not present in the SuperSKiMS maps, since no slits have been placed on it.

In the first column of panels, we show the central regions of the SuperSKiMS kriged maps and the positions of the mocked slits in the ATLAS3D FoV. In the second column of panels, we show the ATLAS3D 2D maps at the same spatial scales. In order to improve the visualisation of such maps, we apply linear interpolation to the ATLAS3D datapoints. It is worth noticing that, whilst in the ATLAS3D maps a foreground Galactic star is present at $[\Delta \rm {RA}, \Delta \rm {Dec}]\approx [18,10]\, \rm {arcsec}$
, in the kriged maps such a star is not visible. This because no virtual slits have been placed on the star and, therefore, the kriged map does not retrieve such a feature.
$[\Delta \rm {RA}, \Delta \rm {Dec}]\approx [18,10]\, \rm {arcsec}$
, in the kriged maps such a star is not visible. This because no virtual slits have been placed on the star and, therefore, the kriged map does not retrieve such a feature.
The third column of panels in Figure 2 shows the central region residual maps between the SuperSKiMS and the ATLAS3D data. Similarly, to the second column of panels, we apply linear interpolation to the datapoints in order to improve the visualisation. The residual map values for the velocity are well represented by a Gaussian with a median value of − 2.75kms−1 and a standard deviation of 19.49kms−1. The rms of the residuals is 20.1kms−1.
Similarly, the velocity dispersion residuals show a distribution close to a Gaussian, with a median value of − 1.63kms−1 and a standard deviation of 14.17kms−1. The rms of the velocity dispersion residuals is 14.4kms−1.
Moreover, the stellar metallicity residual distribution is close to a Gaussian with a median value of − 0.01dex and a standard deviation of 0.11dex. The rms of the stellar metallicity residuals is 0.11dex.
In conclusion, the adoption of the sparsely sampled SuperSKiMS technique allows us to retrieve 2D kinematics and metallicity distributions that are highly consistent with a contiguously sampled (and binned) IFU field like ATLAS3D. This method can be used with multislit spectrographs other than DEIMOS, which effectively gives them pseudo-IFU capabilities.
4 MASS MODELLING WITH SuperSKiMS
An important parameter to constrain in galaxy formation models is the fraction of DM in a galaxy (White & Rees Reference White and Rees1978). Whilst in spiral galaxies, this quantity can be measured out to large radii from the kinematics of the cold gas, in ETGs such gas is generally not present (although NGC 1023 is an exception, e.g. Morganti et al. Reference Morganti2006). Instead, the fraction of DM in ETGs has been generally measured from the kinematics of the stellar component, which is limited to the bright central regions in most cases, where the stellar mass dominates (Cappellari et al. Reference Cappellari2013a).
From massive ETG studies, there is evidence that the total (stellar+DM) mass density profile is consistent with being isothermal, i.e. ρtot∝r −γtot with γtot ≈ 2 (e.g. Gerhard et al. Reference Gerhard, Kronawitter, Saglia and Bender2001; Thomas et al. Reference Thomas2011). This is also in agreement with the results from X-ray modelling (Humphrey & Buote Reference Humphrey and Buote2010) and both strong (Auger et al. Reference Auger, Treu, Gavazzi, Bolton, Koopmans and Marshall2010) and weak (Gavazzi et al. Reference Gavazzi, Treu, Rhodes, Koopmans, Bolton, Burles, Massey and Moustakas2007) gravitational lensing. However, these studies were biased towards high mass ETGs.
Recently, Cappellari et al. (Reference Cappellari2015) presented the first homogeneous analysis of the total mass distribution in 14 intermediate mass fast rotator ETGs out to a median radius of 4Re. In this work, the stellar kinematics measured in the galaxy centres from the ATLAS3D survey are used together with the outer stellar kinematics obtained by the SLUGGS survey. We found that the total mass density in all the galaxies follows a power-law profile, with an average slope $\overline{\gamma }_{\rm {tot}}=2.19\,{\pm}\, 0.03$
. This slope is largely independent of the galaxy mass or central stellar velocity dispersion.
$\overline{\gamma }_{\rm {tot}}=2.19\,{\pm}\, 0.03$
. This slope is largely independent of the galaxy mass or central stellar velocity dispersion.
In Cappellari et al. (Reference Cappellari2015), a source of systematic uncertainties is the adoption of two very different datasets (i.e. ATLAS3D and SLUGGS, masks 1 to 5), both in spatial sampling and in uncertainty on the single kinematic measurements. In addition, whilst SLUGGS kinematics are obtained from the Calcium Triplet (CaT) in the near-infrared, ATLAS3D kinematics are measured from optical absorption lines. In what follows, we test whether the adoption of a homogeneous dataset obtained from the SuperSKiMS technique allows us to retrieve consistent results. In particular, we apply the same modelling approach used in Cappellari et al. (Reference Cappellari2015) to two different kinematic datasets for NGC 1023. The first dataset (A+S) is similar to that used by Cappellari et al. (Reference Cappellari2015) (i.e. combining ATLAS3D and SLUGGS kinematics), although it includes the extra slits that have been observed since that work from masks 6 and 7 (see Section 5). The second dataset combines the same SLUGGS kinematic data with the simulated SuperSKiMS slits in the inner regions (see Section 3). We call this second dataset S+S.
4.1. Jeans anisotropic MGE models
With the 2D velocity and velocity dispersion maps, it is possible to measure the total mass density profile of NGC 1023, as well as retrieve an estimation of its inclination and orbital anisotropy. Cappellari et al. (Reference Cappellari2013a) measured such parameters in the ATLAS3D sample for 260 ETGs by constructing Jeans Anisotropic MGE (JAM) dynamical models. In their model D, they assumed a spherical DM mass density distribution, following a generalised Navarro, Frenk, & White (Reference Navarro, Frenk and White1996) (gNFW) radial profile. The DM mass density distribution is then
 $$\begin{eqnarray}
\rho _{\rm {DM}}=\rho _{\rm {S}}\left( \frac{r}{r_{\rm {S}}} \right)^{\gamma _{\rm {DM}}} \left( 0.5+0.5\frac{r}{r_{\rm {S}}}\right)^{-3-\gamma _{\rm {DM}}},
\end{eqnarray}$$
$$\begin{eqnarray}
\rho _{\rm {DM}}=\rho _{\rm {S}}\left( \frac{r}{r_{\rm {S}}} \right)^{\gamma _{\rm {DM}}} \left( 0.5+0.5\frac{r}{r_{\rm {S}}}\right)^{-3-\gamma _{\rm {DM}}},
\end{eqnarray}$$
where ρS is the DM mass density at the scale radius r S and γDM is the slope for r ≪ r S.
We model the stellar light distribution in 2D using the Multi-Gaussian Expansion (MGE, Emsellem, Monnet, & Bacon Reference Emsellem, Monnet and Bacon1994; Cappellari Reference Cappellari2002) tabulated, for the i-band surface brightness, by Scott et al. (Reference Scott2009). Unlike Cappellari et al. (Reference Cappellari2015), we do not clean and symmetrise our initial datasets, although in the A+S case, a proper weighting of the central points is needed. In fact, in this dataset, the high number of central points with small uncertainties in the ATLAS3D FoV would dominate the best-fit model estimation. Thus, the values in the outer regions (i.e. where the DM contribution is higher) would be under weighted in the estimation of the DM mass density profile. To compensate for this, we artificially increase the uncertainties on both ATLAS3D velocity and velocity dispersion values in order to have SLUGGS and ATLAS3D datapoints contribute equally to the χ2 value of each evaluated model, as in Cappellari et al. (Reference Cappellari2015). The uncertainties on the SuperSKiMS and SLUGGS kinematic values are unchanged. The output best-fit models are symmetric in both the A+S and S+S cases.
In order to model the stellar kinematics of both the A+S and S+S datasets, we use the Python version of the JAM code presented in Cappellari (Reference Cappellari2008). We adopt the python module emcee (Foreman-Mackey et al. Reference Foreman-Mackey, Hogg, Lang and Goodman2013) to obtain the posterior probability distribution of the model parameters from a Markov chain Monte Carlo (MCMC) sampling with the Metropolis-Hastings algorithm (Hasting Reference Hasting1970). The model free parameters are: the galaxy inclination i, the inner (R < Re) and outer (R > Re) orbital anisotropies βin and βout, and total mass density profile parameters ρS, and γtot. The two different orbital anisotropies are applied to the MGE Gaussians with σ (i.e. the width of the Gaussian spatial component) less and greater than 1Re, respectively (Cappellari et al. Reference Cappellari2015). The scale radius parameter is fixed to r S = 20kpc (Cappellari et al. Reference Cappellari2013a).
In Figure 3, we show the NGC 1023 V rms distribution from both the A+S and S+S datasets, together with their best fit models. In the same Figure, we also present the posterior probability distribution from the MCMC sampling for the total mass density slope γtot. In particular, in the A+S and S+S datasets, the best fit model has a total mass density slope of γtot, A + S = −2.03+0.35 −0.55 and γtot, S + S = −2.08+0.33 −0.44, respectively. These values are in good agreement with each other and with the γtot measured by Cappellari et al. (Reference Cappellari2015) for NGC 1023 (i.e. γtot, C15 = −2.19). They are typical of a galaxy with a nearly isothermal total density distribution. Therefore, probing the central regions of NGC 1023 with a SuperSKiMS slit pattern (i.e. four multi-object spectrograph pointings) allows us to retrieve consistent results with those from traditional IFU spectroscopy.
Comparison between the V rms input data and best fit model obtained from the two different datasets. Panels A and D show the V rms 2D distribution obtained from the SLUGGS+ATLAS3D and SuperSKiMS datasets, respectively. The black points show the position of the SLUGGS datapoints and the mocked SuperSKiMS datapoints in Panels A and D, respectively. The best-fit JAM models in the two cases are displayed in panels B and E. All the V rms maps are colour coded according to the colourbar. On the right hand side of the plot, panels C and D show the posterior total mass slope γtot probability distribution in the SLUGGS+ATLAS3D and SuperSKiMS cases, respectively. The two density distributions peak at similar values of γtot.

In particular, we measure a consistent slope for the total mass density profile.
5 OBSERVATIONS AND DATA REDUCTION
In Table 1, we summarise all the observations from which we obtain the stellar data presented in this paper.
DEIMOS mask parameters. The columns present: (1) mask number, (2) mask orientation, (3) observation date, (4) number of extracted spectra with S/N > 8, (5) mask exposure time, and (6) average seeing during the observation.

Masks 1 to 5 have been observed as part of the ongoing SLUGGS surveyFootnote 1 and the kinematics and metallicity obtained from them have been published by Arnold et al. (Reference Arnold2014), Foster et al. (Reference Foster, Pastorello, Roediger, Arnold, Brodie, Forbes, Romanowsky and Spitler2015), and Pastorello et al. (Reference Pastorello, Forbes, Foster, Brodie, Usher, Romanowsky, Strader and Arnold2014). The two most recently observed masks (i.e. masks 6 and 7) are presented here for the first time. These two masks incorporated the SuperSKiMS mask design. These masks were designed to be aligned along the major and the minor axis of NGC 1023, respectively. Unfortunately, during the observation, we experienced some issues with the mask alignment software. Because of this, we did not obtain a complete azimuthal coverage of the field, although we successfully added 74 spectra to the previously available dataset (particularly in the innermost regions, see Figure 4). Another consequence of the alignment issues is the misalignment between some exposures of the same masks. For this reason, we could not reach the targeted spectral S/N ratio in the outer regions of the galaxy since co-addition of spectra from different exposures was not possible.
Distribution of the observed seven DEIMOS masks in the NGC 1023 field. The background image shows the NGC 1023 field observed in the r filter with Subaru/Suprime-Cam. The green and magenta points show the positions of the spectra with S/N > 8 for masks 1–5 and 6–7, respectively. The blue dashed lines present NGC 1023 1, 2, and 3Re isophotes. The footprints of the seven DEIMOS masks are presented as solid lines. In particular, the magenta lines show the position of the two new SuperSKiMS masks and the green lines the position of the five masks previously observed in the SLUGGS survey. Since the galaxy surface brightness decreases with distance from the centre, it is not possible to extract high S/N integrated stellar spectra from the outer slits. (This plot is best viewed in colour).

The SLUGGS survey aims to study GC systems and integrated starlight in a number of nearby ETGs (Brodie et al. Reference Brodie2014) using specifically designed DEIMOS multislit masks. The instrument is set to use a central wavelength of 7 800 Å and a grating of 1 200 $\rm {line}\, \rm {mm^{-1}}$
. The slits are 1 arcsec wide, which yields a resolution of Δλ ~ 1.5Å (i.e. ΔV ~ 50kms−1). With this setup, we are able to efficiently cover the CaT region around 8 500 Å. A DEIMOS mask encloses 16.7 × 5 arcmin2 and typically includes up to ≈ 100 slits. Because of this large FoV, DEIMOS has been very efficient in obtaining high S/N spectra of GC candidates in nearby galaxies out to large galactocentric radii in few hours of exposure (typically around 2 h per mask). From these slits, it is possible to obtain the spectra of both the GC candidates and the background integrated stellar light. Throughout this paper, we focus on the latter, using DEIMOS to probe the galaxy integrated stellar population kinematics and metallicity.
$\rm {line}\, \rm {mm^{-1}}$
. The slits are 1 arcsec wide, which yields a resolution of Δλ ~ 1.5Å (i.e. ΔV ~ 50kms−1). With this setup, we are able to efficiently cover the CaT region around 8 500 Å. A DEIMOS mask encloses 16.7 × 5 arcmin2 and typically includes up to ≈ 100 slits. Because of this large FoV, DEIMOS has been very efficient in obtaining high S/N spectra of GC candidates in nearby galaxies out to large galactocentric radii in few hours of exposure (typically around 2 h per mask). From these slits, it is possible to obtain the spectra of both the GC candidates and the background integrated stellar light. Throughout this paper, we focus on the latter, using DEIMOS to probe the galaxy integrated stellar population kinematics and metallicity.
In Figure 4, the positions of the slits from which we have been able to extract the galaxy stellar light spectra are shown for all the seven masks. These slits sparsely cover the field out to more than 3Re. However, most of the DEIMOS mask’s real estate is not usable to probe the integrated stellar population of NGC 1023. This is because the outer regions of the masks are located where the stellar surface brightness is too low for extracting spectra with S/N > 8 (the measurement of the stellar kinematics in spectra with lower S/N ratios is not reliable).
5.1. Data reduction
5.1.1. SKiMS
All DEIMOS data presented in this work are reduced with a modified version of the SPEC2D pipeline (Cooper et al. Reference Cooper, Newman, Davis, Finkbeiner and Gerke2012; Newman et al. Reference Newman2013) as described in Arnold et al. (Reference Arnold2014). In each slit, the pipeline identifies the bright objects (e.g. GC candidates) and it extracts their spectra. After this, the spectra from the remaining slit pixels are summed and normalised, to be then used as background light, later subtracted from the bright target spectra. This background spectrum contains contributions from the background galaxy integrated stellar light and from the sky.
It is possible to separate these two contributions with the SKiMS technique, first described in Norris et al. (Reference Norris2008), Proctor et al. (Reference Proctor, Forbes, Romanowsky, Brodie, Strader, Spolaor, Mendel and Spitler2009), and Foster et al. (Reference Foster, Proctor, Forbes, Spolaor, Hopkins and Brodie2009). The first step in this method is the estimation of the sky contribution in the different slits to the total background. In order to quantify the sky contribution in each background spectrum, we define a sky index as the ratio of the spectral flux in a sky-dominated band (i.e. 8605.0–8695.5Å) to the flux in two nearby sky-free bands (8526.0–8536.5 and 8813.0–8822.5Å), as described in Proctor et al. (Reference Proctor, Forbes, Romanowsky, Brodie, Strader, Spolaor, Mendel and Spitler2009). This sky index is proportional to the sky contribution over the continuum level (i.e. background stellar light). Slits more than several Re from the galaxy centre show almost constant sky index values. This is an indication that such slits include negligible galaxy light contribution and are hence used as sky spectra. In each slit, we model the sky contribution with the penalised maximum likelihood pPXF software (Cappellari & Emsellem Reference Cappellari and Emsellem2004), using the sky spectra as templates. Finally, the best fitting linear combination of these templates in each slit is then subtracted from the original spectrum.
6 DATA ANALYSIS
Using the same software, after sky subtraction, we fit the integrated stellar spectrum with a set of template stars obtained with DEIMOS adopting the same instrumental setup. pPXF returns the first four line-of-sight velocity distribution Gauss–Hermite moments and the relative contributions of the templates to the final fitted spectrum. In this work, we focus on just the first two moments (i.e. mean velocity v and velocity dispersion σ). In addition, from the same spectra, we obtain the stellar total metallicity [Z/H] (see Section 7.1.5).
Finally, we measure the S/N ratio of all spectra as the median of the ratio between the flux and square root of the variance at each wavelength. In Figure 5, we present the S/N ratio for all the NGC 1023 stellar spectra in our dataset against the circularised galactocentric radius:
 $$\begin{eqnarray}
R_{c} = \sqrt{x^{2}q+y^{2}/q},
\end{eqnarray}$$
$$\begin{eqnarray}
R_{c} = \sqrt{x^{2}q+y^{2}/q},
\end{eqnarray}$$
where q is the photometric axial ratio and x, y are the coordinates along the galaxy major and minor axes, respectively. The slit points are placed on top of the (Noordermeer et al. Reference Noordermeer2008) R-band NGC 1023 surface brightness profile and are colour coded according to their S/N. In the same plot, we show the Maunakea R-band sky surface brightness during a typical SLUGGS observation (i.e. μR = 19.9–20.4magarcsec−2)Footnote 2 . We obtain stellar spectra from which we retrieve the stellar kinematics out to more than 170arcsec (corresponding to almost 3.6Re), where the galaxy surface brightness is several orders of magnitude fainter than the sky.
NGC 1023 surface brightness profile and spectra’s S/N radial distribution. The black line shows the NGC 1023 surface brightness profile in R-band from Noordermeer et al. (Reference Noordermeer2008) against the circularised galactocentric radius. The circles show the positions of the spectra obtained from SKiMS with S/N > 8 in all the seven DEIMOS masks. All the circles are colour coded according to their S/N values, as in the colour bar on the right-hand side. The red lines show the position of the SKiMS points from masks 6 and 7 (vertically offset for a better visualisation). The gray horizontal shade shows the typical average sky R-band surface brightness at Mauna Kea in dark time. In particular, within 30arcsec from the galaxy centre spectra have generally S/N > 100, whilst at 1Re (i.e. S/N ≈ 40). We are able to obtain the stellar kinematics (i.e. S/N > 8) out to more than 160 arcsec, where the surface brightness of the target is several magnitudes fainter than the sky. (This plot is best viewed in colour).

6.1. 2D mapping
Since the spectra we obtain from DEIMOS are located at random spatial positions in the sky, in order to obtain reliable 2D maps for the extracted parameters (e.g. velocity, metallicity), we use the kriging technique. In particular, we adopt the kriging code included in the package fields (Furrer et al. Reference Furrer, Nychka, Sain and Nychka2009) written in the programming language R. So far kriging has been used in several SLUGGS papers (e.g. Pastorello et al. Reference Pastorello, Forbes, Foster, Brodie, Usher, Romanowsky, Strader and Arnold2014; Foster et al. Reference Foster, Arnold, Forbes, Pastorello, Romanowsky, Spitler, Strader and Brodie2013), principally because it is able to recover a reliable estimation of the 2D distribution of a variable without any prior assumption. An exhaustive description of kriging can be found in Pastorello et al. (Reference Pastorello, Forbes, Foster, Brodie, Usher, Romanowsky, Strader and Arnold2014). In this work, we use kriging to obtain 2D maps for the stellar kinematics and the metallicity that will be compared with IFU 2D maps from the ATLAS3D survey.
7 RESULTS
7.1. NGC 1023 kinematics and metallicity
In this Section, we present the 2D velocity, velocity dispersion and total metallicity maps for NGC 1023 obtained from the whole available dataset (i.e. seven masks).
We do not compare our kinematic maps with those presented in Foster et al. (Reference Foster, Pastorello, Roediger, Arnold, Brodie, Forbes, Romanowsky and Spitler2015), since the latter are based on a largely overlapping dataset, except for the very inner regions. In fact, they do not measure the stellar kinematics for R < 10arcsec, and their kriging values at such radii are extrapolated from outer region measurements. For this reason, we compare our kinematic measurements with those from the independent literature studies that probed NGC 1023 at these small radii.
We compare our results with the available ATLAS3D IFU measurements and with the kinematics from the longslit observations by Debattista, Corsini, & Aguerri (Reference Debattista, Corsini and Aguerri2002) and Fabricius et al. (Reference Fabricius, Saglia, Fisher, Drory, Bender and Hopp2012). The SAURON kinematics for NGC 1023 were originally presented in Emsellem et al. (Reference Emsellem2004), but we used the re-analysis of the same data from Cappellari et al. (Reference Cappellari2011). Debattista et al. (Reference Debattista, Corsini and Aguerri2002) measured NGC 1023 stellar velocity and velocity dispersion radial profiles from a longslit placed at PA = 80° with width 0.7arcsec. Similarly, Fabricius et al. (Reference Fabricius, Saglia, Fisher, Drory, Bender and Hopp2012) extracted NGC 1023 kinematics from a longslit at PA = 87° with a width of 1arcsec. In order to compare with these two literature works, we extract virtual slits with similar PAs and widths from both the ATLAS3D and our kriged 2D maps.
Finally, we update several results from Foster et al. (Reference Foster, Pastorello, Roediger, Arnold, Brodie, Forbes, Romanowsky and Spitler2015) and Pastorello et al. (Reference Pastorello, Forbes, Foster, Brodie, Usher, Romanowsky, Strader and Arnold2014) with the addition of the newly obtained SuperSKiMS data.
7.1.1. Stellar velocity
In Figure 6, we show the NGC 1023 2D stellar velocity map obtained from our spectra. This map has been created using the kriging technique on a sample of 237 spectra with S/N ⩾ 8, and it extends out to almost 3.6Re. Clear signs of stellar rotation are visible out to these large galactocentric radii.
NGC 1023 2D velocity map and 1D radial profiles. The top panel presents the 2D stellar velocity map from kriging obtained from all our points. North is up and East is left. Both map pixels and points are colour coded according to their velocity as in the top colour bar. The black circles show the positions of the slits from which the kriged 2D map has been obtained. The 1, 2, and 3Re isophotes are shown as dashed lines. The green and black lines show, respectively, the position of Fabricius et al. (Reference Fabricius, Saglia, Fisher, Drory, Bender and Hopp2012) and Debattista et al. (Reference Debattista, Corsini and Aguerri2002) major axis slits. The solid black line show the field-of-view of ATLAS3D. In the middle and bottom panels, we present the velocity radial profiles from literature longslits compared with those extracted from a virtual longslit with the same PA and width. In both panels, the profiles extracted from our kriging map and the ATLAS3D map are plotted as solid blue and red dashed lines, respectively. The light blue contour shows the 1σ confidence region for our profile. We compare these profiles with the longslit data of Fabricius et al. (Reference Fabricius, Saglia, Fisher, Drory, Bender and Hopp2012, middle panel, green line) and Debattista et al. (Reference Debattista, Corsini and Aguerri2002, bottom panel, black line). The black dashed line shows the systemic velocity of NGC 1023. In general, the virtual slits show good agreement with the literature longslits in the overlapping regions at positive radii (Eastern side), whilst at negative radii, the agreement is weaker.

Most of the slits are randomly distributed in the field and do not cover the most central regions of NGC 1023. This is because most of the observed masks were originally targeting GC candidates in NGC 1023 and the high galaxy surface brightness prevents the detection of reliable GC candidates.
In the second panel of Figure 6, we plot the Fabricius et al. (Reference Fabricius, Saglia, Fisher, Drory, Bender and Hopp2012) stellar velocity profile, together with the profiles extracted from ATLAS3Dand our maps assuming a virtual slit with a width of 1arcsec placed at PA = 87°. Similarly, in the third panel, we compare the radial velocity profile by Debattista et al. (Reference Debattista, Corsini and Aguerri2002) with those extracted from ATLAS3Dand our maps assuming a virtual slit of width 0.7arcsec and PA = 80°. The confidence limits for our velocity radial profile are obtained with both Monte Carlo simulations and bootstrapping. In the first case, we build 1 000 kriging maps from datasets with the same number of data points and the same spatial position, but different associated velocity values. These velocities are randomly extracted from a bi-Gaussian distribution, where the positive and the negative σ are the positive and negative velocity uncertainties on the measured datapoint, respectively. Similarly, in the second case, we build 1 000 kriging maps from datasets obtained sampling with replacement the original dataset, but keeping the same velocity values and associated uncertainties. We obtain a 1D velocity profile from each kriging 2D map. From these sets of profiles, we obtain a median value and a distribution of velocity values in each radial bin from which we measure the velocity uncertainty. Since this distribution is not a Gaussian, we measure the uncertainties as the 16th and 84th percentiles of the distribution.
Because of the lack of datapoints in the central regions, the radial velocity profile we measure has higher uncertainties in these regions. We exclude from our profiles the inner region where we do not have measured data points.
In both the middle and bottom panels of Figure 6, the profiles extracted from the kriging maps show larger uncertainties at R c ≈ 30arcsec. These uncertainties reflect both a lack of measured datapoints near the narrow considered spatial region and the steepness of the spatial gradient of the velocity at those radii. This issue does not strongly affect azimuthally averaged profiles, where the higher number of datapoints scattered in the field provides reliable radial measurements (see Pastorello et al. Reference Pastorello, Forbes, Foster, Brodie, Usher, Romanowsky, Strader and Arnold2014).
Overall, we note a good agreement of our kriged 2D map extracted profile with the ATLAS3D profile at positive radii, within the uncertainties. Similarly, we observe a fair agreement with the two longslit results, within our errorbars at positive radii. On the other hand, at negative radii, our interpolated values are less consistent with both ATLAS3D and longslit profiles. These differences may be caused by a lower number of our points in the region of disagreement and, in the ATLAS3D case, by the contribution of the NGC 1023 bar. In fact, the presence of the bar may be affecting our scattered data points differently than the continuous data point distributions of ATLAS3D. For the same reason (i.e. fewer data points), the kriging profile could suffer by possible interpolation errors. This would explain why, despite the profiles’ slight disagreement, our and ATLAS3D individual velocity data points at the same locations are in very good agreement (see Section 7.1.3).
7.1.2. Stellar velocity dispersion
In Figure 7, we show the NGC 1023 velocity dispersion 2D map obtained from our spectra. Similarly, to the map in Figure 6, to create this map we have used the kriging technique with all the 237 available data points with S/N ⩾ 8. We detect a gradient of the velocity dispersion, with central regions showing higher values of σ than the outer regions. However, the lack of slits near the very centre of the galaxy prevents the observation of a clear high velocity dispersion peak.
As Figure 7, but for the velocity dispersion. In the overlapping regions, the velocity dispersion profiles of both ATLAS3D and our kriging virtual slits show a remarkable agreement. Both the Fabricius et al. (Reference Fabricius, Saglia, Fisher, Drory, Bender and Hopp2012) and Debattista et al. (Reference Debattista, Corsini and Aguerri2002) show higher velocity dispersions at large radii than the virtual slit profiles. This may be a consequence of their increasingly larger spatial bins with radius, which can artificially increase the measured velocity dispersion.

In the second panel of Figure 7, we compare the velocity dispersion profile from Fabricius et al. (Reference Fabricius, Saglia, Fisher, Drory, Bender and Hopp2012) with the profiles extracted from virtual slits on ATLAS3D and our kriging maps. These virtual slits have the same orientation and width as the actual slit in comparison. Similarly, in the third panel, we compare the velocity dispersion profile of Debattista et al. (Reference Debattista, Corsini and Aguerri2002) with those extracted from ATLAS3D and our kriged 2D map virtual slits with the same PA and width. We obtain the velocity dispersion profile’s uncertainties in a similar fashion to the velocity profile case presented above.
In general, we observe a remarkable consistency between our virtual slit radial profile and that from ATLAS3D in the overlapping radial regions, although these regions are small. However, in the outermost regions (i.e. outside ≈ 30arcsec in both directions), the longslit profiles show higher stellar velocity dispersions. Such disagreements are similar in both the negative and positive sides of the profiles. Therefore, a possible cause is the increasingly larger spatial binning that is applied to the outer regions of the longslits in order to preserve the S/N ratio of the extracted spectra. As a consequence, such bins include information from stars with different radial velocities. This may increase the measured velocity dispersion with respect to the real stellar velocity dispersion along the line of sight, although we note that the velocity profile at such radii is quite flat. We suspect that a second possible contribution to the velocity dispersion offset might be linked with the radii at which the literature binned values are assigned. If such radii are not weighted according to the galaxy surface brightness profile within the bin, they would overestimate the galactocentric radii where the stellar velocity dispersion has been measured. A third possibility is that the offset is linked to the different wavelength regions from which the kinematics are measured. However, since our velocity dispersion measurements (i.e. from the CaT lines in the near-infrared) are very consistent with those from ATLAS3D (i.e. from absorption lines in the optical), we consider this possibility as unlikely.
7.1.3. Comparison between ATLAS3D and SKiMS kinematics
The comparison between the velocity dispersion measurements by ATLAS3D and those obtained from the SKiMS technique from masks 1 to 5 at the same spatial locations shows a systematic offset in most of the galaxies in common between the two datasets (Arnold et al. Reference Arnold2014; Foster et al. Reference Foster, Pastorello, Roediger, Arnold, Brodie, Forbes, Romanowsky and Spitler2015). In particular, Foster et al. (Reference Foster, Pastorello, Roediger, Arnold, Brodie, Forbes, Romanowsky and Spitler2015) found that the difference between ATLAS3D and SKiMS velocity dispersions is on average Δσ ≈ 20kms−1, whilst the other velocity moments (i.e. v, h 3 and h 4) show a good general agreement.
In Figure 8, we show the comparison between the velocity (v), velocity dispersion (σ), h 3 and h 4 measurements of our updated dataset (i.e. masks 1 to 7) and those from ATLAS3D. In particular, we compare our datapoints with those from ATLAS3D at the same spatial locations within 1arcsec. Most of ATLAS3D values at their largest radii are measured from spectra that have been spatially binned in order to increase their S/N ratio. We use the centre coordinates of these bins to evaluate their distance from our points. As a consequence, our points in outer ATLAS3D regions are generally not matched with their strongly binned ATLAS3D counterparts (since they are generally not within 1arcsec). In total, we have 18 slits within the ATLAS3D FoV, of which eight are within 1arcsec of an ATLAS3D kinematic measurement.
Comparison between SKiMS (masks 1 to 7) and ATLAS3D kinematic data points. The top left panel shows on the x-axis the velocities obtained from the SKiMS points within the ATLAS3D field-of-view. On the y-axis, the ATLAS3D velocities at the same spatial locations are shown. The dashed line shows the one-to-one relation. Overall, the two datasets show a good agreement. In the top right panel, the velocity dispersion measurements of the two datasets are compared. Again, the dashed line present the one-to-one relation. We do not observe any significant offset between the velocity dispersions of the two datasets. The bottom left and bottom right panels show the comparison between the h 3 and h 4 values of the two datasets, respectively. Despite the narrow dynamical range covered, a reasonable agreement between ATLAS3D and SKiMS values is seen in both h 3 and h 4.

To the velocity and velocity dispersion uncertainties obtained with SKiMS, we add in quadrature 5kms−1 and 8kms−1, respectively, to take into account systematics (see Foster et al. Reference Foster2011 for a justification).
As in Foster et al. (Reference Foster, Pastorello, Roediger, Arnold, Brodie, Forbes, Romanowsky and Spitler2015), we find a good match between our velocity measurements and those from ATLAS3D. Comparing the two datasets, we find an average offset of Δv = 9.64 ± 0.94kms−1, well below the velocity resolution of both instruments.
However, Foster et al. (Reference Foster, Pastorello, Roediger, Arnold, Brodie, Forbes, Romanowsky and Spitler2015) found an average offset between SKiMS and ATLAS3D velocity dispersions in NGC 1023 of Δσ ≈ 20kms−1. In the top right panel of Figure 8, we plot our velocity dispersion measurements against the spatially overlapping measurements in ATLAS3D. We do not find a strong offset with the ATLAS3D velocity dispersion measurements, although the points present a large scatter. In particular, we measure an average difference of Δσ = 0.88 ± 1.21kms−1. This better agreement is probably due to the larger dataset we use, that probes more into the central regions of NGC 1023 (i.e. where the ATLAS3D datapoints are less binned), although we cannot exclude the presence of other systematics. At the same time, our comparison tends to exclude the points in the strongly binned regions near the edges of the ATLAS3D FoV.
The bottom left and bottom right panels of Figure 8 show the comparison of ATLAS3D and SKiMS measurements for the third (i.e. h 3) and fourth (i.e. h 4) stellar velocity moments, respectively. In both cases, there is a fair agreement between the two datasets with the exception of few outliers with large uncertainties. The average offset between our h 3 measurements and those by ATLAS3D is Δh 3 = −0.005 ± 0.058, consistent with being zero. Similarly, the average offset between the two datasets for the h 4 values is Δh 4 = −0.03 ± 0.06.
In all the comparisons, the scatter appears to be mostly due to the few slits of ours that have been matched with the ATLAS3D values from large bins (i.e. near the edges of the ATLAS3D FoV).
We speculate that the velocity dispersion offset measured by Foster et al. (Reference Foster, Pastorello, Roediger, Arnold, Brodie, Forbes, Romanowsky and Spitler2015) for NGC 1023 might be caused by the lack of datapoints in the innermost regions of the galaxy. However, in other galaxies in common between SLUGGS and ATLAS3D samples for which a high number of overlapping points already exist, such a possible explanation might not be valid.
7.1.4. Local specific angular momentum profile
From the velocity and velocity dispersion measurements, Foster et al. (Reference Foster, Pastorello, Roediger, Arnold, Brodie, Forbes, Romanowsky and Spitler2015) extracted the local specific angular momentum profile λ(R) for a number of galaxies, including NGC 1023. In this work, we present new data for NGC 1023, which extend more towards the centre of the galaxy. From our velocity and velocity dispersion profiles, we measure
 $$\begin{eqnarray}
\lambda (R) = \frac{|V(R)|}{\sqrt{V(R)^{2}+\sigma (R)^{2}}},
\end{eqnarray}$$
$$\begin{eqnarray}
\lambda (R) = \frac{|V(R)|}{\sqrt{V(R)^{2}+\sigma (R)^{2}}},
\end{eqnarray}$$
where V(R) and σ(R) are the velocity and the velocity dispersion at the circularised radius R. Similarly, we measure the same quantity from the kinematic radial profiles extracted from the kriging maps in Foster et al. (Reference Foster, Pastorello, Roediger, Arnold, Brodie, Forbes, Romanowsky and Spitler2015) (but assuming NGC 1023 photometric parameters presented here in Section 1).
In Figure 9, we show both the λ(R) radial profiles from the kinematic maps of this work and of Foster et al. (Reference Foster, Pastorello, Roediger, Arnold, Brodie, Forbes, Romanowsky and Spitler2015). From the plot, it is possible to appreciate how the addition of new data slightly decreases the uncertainties and allows the exploration of the innermost regions of NGC 1023, whilst being fully consistent in the outer regions.
Radial profile of the local specific angular momentum in NGC 1023. The solid blue line shows the profile measured from the kinematic data presented in this paper. The dashed black line is the local specific angular momentum profile as extracted from the kinematic data presented in Foster et al. (Reference Foster, Pastorello, Roediger, Arnold, Brodie, Forbes, Romanowsky and Spitler2015). In the first case, the higher number of datapoints (particularly in the inner regions) better probes the galaxy inner regions and slightly reduces the profile uncertainties.

7.1.5. Metallicity
From our stellar spectra, it is also possible to obtain the stellar total metallicity [Z/H]. This is because the CaT equivalent width strongly correlates with the metallicity of the stellar population and is almost independent of the stellar age if the stellar population is > 2Gyr (see Usher et al. Reference Usher2012 and references therein). Similarly to Pastorello et al. (Reference Pastorello, Forbes, Foster, Brodie, Usher, Romanowsky, Strader and Arnold2014), we extract a relation between the CaT equivalent width and the stellar metallicity from the MILES stellar population models (Vazdekis et al. Reference Vazdekis, Sánchez-Blázquez, Falcón-Barroso, Cenarro, Beasley, Cardiel, Gorgas and Peletier2010) assuming a Salpeter (Reference Salpeter1955) initial mass function (IMF). Since the CaT equivalent width depends on the IMF slope, we apply the same correction to the CaT-derived metallicity values as in Pastorello et al. (Reference Pastorello, Forbes, Foster, Brodie, Usher, Romanowsky, Strader and Arnold2014).
In Figure 10, we show the NGC 1023 stellar metallicity map and radial profile. The kriging map shows a centrally peaked 2D metallicity distribution, with metallicity isocurves roughly following the galaxy isophotes.
NGC 1023 2D metallicity map and 1D azimuthally-averaged radial profiles. The top panel shows the 2D stellar metallicity map from kriging obtained from all our points (i.e. masks 1 to 7). North is up and East is left. Both map pixels and datapoints are colour coded according to their metallicity as in the top colour bar. The 1, 2 and 3Re isophotes are shown as dashed lines. The solid black line show the field-of-view of ATLAS3D. In the bottom panel we plot the azimuthally averaged metallicity profiles against the circularised galactocentric radius measured from the ATLAS3D and our kriged maps as dashed red and solid blue lines, respectively. The inner limit of our radial profile is given by the position of the innermost available slit. The vertical dashed line shows the scale of 1Re. In the same plot we show the measured metallicity datapoints as square symbols, colour coded according to the colour scale at the top.

To retrieve reliable metallicity measurements from the CaT, we need a S/N ⩾ 30. Thus, our metallicity map extends to smaller radii than in the stellar kinematics case, i.e. about 2.5Re from the galaxy centre. The extracted metallicity radial profile is slightly less extended. This is because a sufficiently high number of map points are needed in each radial bin in order to obtain statistically reliable uncertainties.
In the bottom panel of Figure 10, we compare this azimuthally averaged radial metallicity profiles obtained from our SKiMS (i.e. masks from 1 to 7) kriged 2D map to the ATLAS3D dataset from Kuntschner et al. (Reference Kuntschner2010). In both cases, we bin the data points in annulii of 1arcsec that follow the galaxy isophotal shape and orientation. In particular, we adopt radially constant PA and axial ratio (see Section 1). The uncertainty on the azimuthally averaged kriging metallicity profile is obtained with the same approach used in the kinematic profiles.
The radial metallicity profiles shows a remarkable overall agreement, with our profile extending out to almost twice the galactocentric radius probed by ATLAS3D. We note that, whilst our values are obtained from the CaT lines in the near-infrared, ATLAS3D metallicities are obtained from optical absorption lines using the Lick system (Kuntschner et al. Reference Kuntschner2010). In the central-most regions, our lack of datapoints prevents the kriging map from correctly reproducing the steep metallicity profile that is visible in the ATLAS3D profile.
Pastorello et al. (Reference Pastorello, Forbes, Foster, Brodie, Usher, Romanowsky, Strader and Arnold2014) used the radial metallicity profiles extracted from the kriging maps to measure the inner (i.e. R < 1Re) and outer (i.e. R > 1Re) metallicity gradients of NGC 1023 in a logarithmic radial scale. An updated version of those measurements is presented in the appendix B of Forbes et al. (Reference Forbes, Romanowsky, Pastorello, Foster, Brodie, Strader, Pota and Usher2016). Adopting the same approach but with the updated dataset, we extract new inner and outer stellar metallicity gradients. Both Forbes et al. (Reference Forbes, Romanowsky, Pastorello, Foster, Brodie, Strader, Pota and Usher2016) and our metallicity gradients are presented in Table 2.
Comparison between old and new stellar metallicity gradients of NGC 1023.
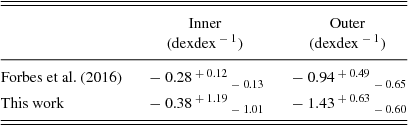
Such new gradients are steeper than those presented in Forbes et al. (Reference Forbes, Romanowsky, Pastorello, Foster, Brodie, Strader, Pota and Usher2016), although still consistent within the uncertainties. The larger uncertainties for the inner gradient are due to a spatially larger inner region from which such a gradient has been measured. The availability of measured SuperSKiMS datapoints in the inner regions allows us to probe the metallicity to smaller radii, where the metallicity profiles becomes steeper and the gradient uncertainty larger.
8 CONCLUSIONS
We present for the first time a new multislit mask design, called SuperSKiMS, that maximises the azimuthal and radial coverage of a galaxy’s 2D stellar field. This slit mask design can be optimised to the best azimuthal coverage given the expected number of mask pointings. In addition, the slit lengths are designed in order to provide a high S/N ratio at most radii. The outermost regions of the mask are used to obtain pure-sky spectra necessary for sky subtraction and to target GC candidates or background galaxies.
We tested the technique by simulating the exposure of four SuperSKiMS masks in the central regions of NGC 1023. For this galaxy, ATLAS3D 2D kinematic and metallicity maps are available. We extracted the velocity, velocity dispersion and metallicity measurements from these ATLAS3D maps, at the spatial locations where the SuperSKiMS central slits would be. We obtained 2D maps which we compared with those from ATLAS3D in the inner regions. We found that the observation of four SuperSKiMS DEIMOS masks would allow us to recover the stellar kinematic and metallicity 2D distribution observed by the ATLAS3D work with high accuracy.
Moreover, we compared a partially simulated SLUGGS+SuperSKIMS dataset with the composite SLUGGS+ATLAS3D dataset used by Cappellari et al. (Reference Cappellari2015) to model the total mass density profile of NGC 1023. In particular, from both datasets, we retrieved a nearly isothermal total mass density distribution in the probed radial range, consistent with that published by Cappellari et al. (Reference Cappellari2015) for this galaxy.
As a following step, we tested the SuperSKiMS technique using the large FoV DEIMOS multislit spectrograph on the nearby galaxy NGC 1023. Unfortunately, issues with the Keck alignment software prevented us from fully exploiting the capabilities of the SuperSKiMS mask design. In any case, we observed two masks with the SuperSKiMS design and added the new data to the pre-existing SLUGGS dataset. With such data, we then produced 2D stellar velocity and velocity dispersion maps. Such maps allowed the extraction of virtual slit radial profiles, which we compared with longslit literature results. Despite random sampling of the field, we found a good consistency with the literature velocity profiles. In addition, comparing our kinematic radial profiles with those extracted from ATLAS3D 2D maps, we found fair consistency in the overlapping regions.
Since many of the new datapoints lie in the ATLAS3D FoV, we also compared the differences in kinematics at the same spatial locations with ATLAS3D data. We found a good agreement between the velocity and a fair agreement between the velocity dispersion values (in particular, we did not observe the velocity dispersion offset noted in Arnold et al. Reference Arnold2014 and Foster et al. Reference Foster, Pastorello, Roediger, Arnold, Brodie, Forbes, Romanowsky and Spitler2015). These results suggest that the previously observed offset in NGC 1023 might be driven by the small number of datapoints overlapping with the ATLAS3D FoV, most of which also lie at the edges of this region, where the ATLAS3D values have been obtained from the binning of low S/N data. However, other galaxies in Arnold et al. (Reference Arnold2014) and Foster et al. (Reference Foster, Pastorello, Roediger, Arnold, Brodie, Forbes, Romanowsky and Spitler2015) show similar offsets even in the presence of a large number of datapoints overlapping with the ATLAS3D FoV.
From these kinematic measurements, we also extracted the local specific angular momentum radial profile of NGC 1023, extending the results by Foster et al. (Reference Foster, Pastorello, Roediger, Arnold, Brodie, Forbes, Romanowsky and Spitler2015) with our updated dataset.
In addition to the kinematics, it is possible to reliably measure the equivalent width of the CaT absorption lines and hence produce 2D metallicity maps. From these maps, we extracted the azimuthally averaged radial metallicity profile out to R ≈ 2Re. This profile is consistent with the stellar metallicity measurements by ATLAS3D in the overlapping radial regions, whilst extending to almost twice their probed galactocentric radii. In addition, we extracted the inner and outer stellar metallicity gradients for NGC 1023, updating the results already presented in Forbes et al. (Reference Forbes, Romanowsky, Pastorello, Foster, Brodie, Strader, Pota and Usher2016) with our new dataset.
In future studies, the adoption of the SuperSKiMS mask design to observe nearby galaxies with multislit spectrographs will allow one to probe the stellar component homogeneously from the innermost to the outermost regions. From this, it will be possible to efficiently retrieve reliable kinematics and stellar population 2D maps comparable to those from IFU spectrograph studies, although reaching much larger radii.
ACKNOWLEDGEMENTS
The authors wish to thank the (anonymous) referee for his/her very useful comments and suggestions. They also wish to express their gratitude to Dr. Joachim Janz for his help and feedback. Some of the data presented herein were obtained at the W. M. Keck Observatory, operated as a scientific partnership amongst the California Institute of Technology, the University of California, and the National Aeronautics and Space Administration, and made possible by the generous financial support of the W. M. Keck Foundation. The authors wish to recognise and acknowledge the very significant cultural role and reverence that the summit of Mauna Kea has always had within the indigenous Hawaiian community. The analysis pipeline used to reduce the DEIMOS data was developed at UC Berkeley with support from NSF grant AST-0071048. DF thanks the ARC for support via DP130100388. AP thanks the AAO for financial support via the Honours/Masters Scholarship. MC acknowledges support from a Royal Society University Research Fellowship. This work was also supported by NSF grant AST-1211995.


