


Introduction
Channel scour is a form of local river bed erosion resulting in the formation of deep scour holes that may impose increased risk to the stability of nearby embankments and infrastructure (e.g. Beltaos et al., Reference Beltaos, Carter and Prowse2011; Termini, Reference Termini2014; Wang et al., Reference Wang, Yu and Liang2017). The formation of scour holes is largely driven by the hydrodynamic conditions resulting from channel geometry (bend, confluence, local narrowing) and constructions such as bridge pillars and groynes which cause local flow perturbations. A second factor is the susceptibility of the channel bed to erosion which in turn depends on the subsurface composition.
Many river deltas and estuaries such as the Mekong delta, Yangtze delta and the Rhine–Meuse delta are subject to channel bed degradation due to human activity such as channelisation, dredging for navigation or sand mining (Brunier et al., Reference Brunier, Anthony, Goichot, Provansal and Dussouillez2014; Luan et al., Reference Luan, Ding, Wang, Ge and Yang2016; Hoitink et al., Reference Hoitink, Wang, Vermeulen and Kästner2017). For instance, in the Rhine–Meuse delta, this has caused vertical incision in the major river branches (Blom, Reference Blom2016; Huismans et al., Reference Huismans, Koopmans, Wiersma, De Haas, Berends, Sloff and Stouthamer2021) and, partly because of heterogeneous subsurface composition, scour holes (Sloff et al., Reference Sloff, van Spijk, Stouthamer and Sieben2013; Huismans et al., Reference Huismans, Velzen, Mahoney, Hoffmans and Wiersma2016; Hoitink et al., Reference Hoitink, Wang, Vermeulen and Kästner2017). Local variations in vertical incision of river channels depend on downstream changes in erosive capacity of the river flow and resistance of the channel bed material to erosion. This variation will increase in areas where the river is incised in substrate showing strong spatial heterogeneity in erodibility, resulting in local preferential erosion of the erodible material. Spatial variation in erodibility of the channel bed is determined by subsurface architecture – defined as the geometry, proportion and spatial distribution of different types of deposits from varying sedimentary environments (Allen, Reference Allen1978; Leeder, Reference Leeder1978; Gouw, Reference Gouw2007) – and subsequent material properties, such as grain size distribution, cohesion and sorting. These in turn are a result of the processes that formed the deposits in the past. With ongoing vertical incision, deeper lying erosion susceptible architectural elements may be encountered leading to new scour holes.
Scour holes are often not only caused by turbulent flows induced by engineering works (Hoffmans and Verheij, Reference Hoffmans and Verheij1997; Termini, Reference Termini2014; Pandey et al., Reference Pandey, Ahmad and Sharma2018; Liang et al., Reference Liang, Du, Pan and Zhang2020) but also occur in natural settings such as river or tidal confluences (Kjerfve et al., Reference Kjerfve, Shao and Stapor1979; Best, Reference Best1986; Best and Ashworth, Reference Best and Ashworth1997; Ginsberg and Perillo, Reference Ginsberg and Perillo1999; Ferrarin et al., Reference Ferrarin, Madricardo, Rizzetto, Mc Kiver, Bellafiore, Umgiesser, Kruss, Zaggia, Foglini, Ceregato, Sarretta and Trincardi2018; Smith et al., Reference Smith, Nicholas, Best, Bull, Dixon, Goodbred, Sarker and Vardy2019). In many river deltas and estuaries, scour holes have been reported including the Mississippi (Nittrouer et al., Reference Nittrouer, Mohrig, Allison and Peyret2011), Ganges-Brahmaputra (Best and Ashworth, Reference Best and Ashworth1997), Mahakam (Vermeulen et al., Reference Vermeulen, Hoitink, van Berkum and Hidayat2014), Mackenzie deltas (Beltaos et al., Reference Beltaos, Carter and Prowse2011), Tisza river (Cserkész-Nagy et al., Reference Cserkész-Nagy, Tóth, Vajk and Sztanó2010) and Venice lagoon (Ferrarin et al., Reference Ferrarin, Madricardo, Rizzetto, Mc Kiver, Bellafiore, Umgiesser, Kruss, Zaggia, Foglini, Ceregato, Sarretta and Trincardi2018). Previous research on scour hole formation largely focused on hydrodynamic conditions causing their development or the morphological characteristics (e.g. Kjerfve et al., Reference Kjerfve, Shao and Stapor1979; Best, Reference Best1986; Best and Ashworth, Reference Best and Ashworth1997; Ginsberg and Perillo, Reference Ginsberg and Perillo1999; Pierini et al., Reference Pierini, Perillo, Carbone and Marini2005; Gharabaghi et al., Reference Gharabaghi, Inkratas, Beltaos and Krishnappan2007; Blanckaert, Reference Blanckaert2010; Ottevanger et al., Reference Ottevanger, Blanckaert and Uijttewaal2012; Vermeulen et al., Reference Vermeulen, Hoitink, van Berkum and Hidayat2014; Ferrarin et al., Reference Ferrarin, Madricardo, Rizzetto, Mc Kiver, Bellafiore, Umgiesser, Kruss, Zaggia, Foglini, Ceregato, Sarretta and Trincardi2018; Pandey et al., Reference Pandey, Ahmad and Sharma2018; Liang et al., Reference Liang, Du, Pan and Zhang2020). A large number of scour holes have also been identified in the heavily engineered river channels of the Rhine–Meuse delta. Here, it is increasingly recognised that local and regional subsurface composition is a key control on scour hole formation (Sloff et al., Reference Sloff, van Spijk, Stouthamer and Sieben2013; Huismans et al., Reference Huismans, Velzen, Mahoney, Hoffmans and Wiersma2016). For that reason, Huismans et al. (Reference Huismans, Koopmans, Wiersma, De Haas, Berends, Sloff and Stouthamer2021) highlighted the temporal development of 18 selected scour holes and attributed their depth and size development to local geological heterogeneity due to the occurrence of intercalated cohesive and erodible substrate layers. Although the selected examples in Huismans et al. (Reference Huismans, Koopmans, Wiersma, De Haas, Berends, Sloff and Stouthamer2021) demonstrate the role of local substrate heterogeneity in the emergence and growth of scour holes and the associated local controlling mechanisms, they remain descriptive analyses on key examples in downstream branches alone where this link is always clear-cut. Currently, a comprehensive delta-wide quantitative analysis on the relation between geological heterogeneity and the occurrence and characteristics of scour holes is still lacking. Estimates of the risks resulting from scour holes can however greatly benefit from such quantitative insights. Therefore, we aim to expand the morphological and geographical analyses of scour holes controlled and co-controlled by the substrate to the complete delta channel network. Generating observational and quantitative data covering the full channel network provides the essential basis to relate scour hole characteristics to subsurface architecture resulting from the palaeogeographic development of a delta which is needed to transpose such insights to other delta systems.
In this paper, we assess the effects of delta-scale geological heterogeneity, related depositional history and local subsurface architecture on scour hole formation. To this end, we (1) create a delta-scale inventory of scour hole locations, (2) use available 1D and 2D hydrodynamic modelling output to determine the main trigger of scour holes and assess which locations have been influenced by subsurface conditions, (3) extract geometric characteristics and (4) compile the architectural elements at the scour hole locations which reflect the local geological circumstances. We chose the Rhine–Meuse delta as our study area because its evolution and subsurface architecture have been studied in great detail and at different spatio-temporal scales (e.g. Törnqvist, Reference Törnqvist1993; Stouthamer and Berendsen, Reference Stouthamer and Berendsen2000, Reference Stouthamer and Berendsen2001; Cohen et al., Reference Cohen, Gouw and Holten2005; Gouw and Erkens, Reference Gouw and Erkens2007; Erkens, Reference Erkens2009; Hijma et al., Reference Hijma, Cohen, Hoffmann, van der Spek and S.2009; Hijma and Cohen, Reference Hijma and Cohen2011; Stouthamer et al., Reference Stouthamer, Cohen and Gouw2011a). In addition, detailed bathymetric data is available for scour hole identification. Owing to the availability of these studies and data, the Rhine–Meuse delta is an excellent area to study how scour hole formation is linked to subsurface architecture and hence palaeogeographic development which can provide important insight into the geological boundary conditions for channel scour.
Study area
Geographical setting
The Rhine–Meuse delta is located in the central Netherlands and ranges from the apex near the German border to the coast near Rotterdam (Fig. 1a). In the study area, the discharge of the Rhine is distributed over three major branches: the Waal, Nederrijn-Lek and IJssel. The river Meuse flows through the southern part of the study area and confluences with the river Waal to the west. The branches in the study area have been heavily managed from approximately 800 years ago onwards as part of flood protection works and maintaining the shipping navigability of the river (see Cox et al., Reference Cox, Huismans, Knaake, Leuven, Vellinga, van der Vegt, Hoitink and Kleinhans2021 for detailed overview). Most important measures were the building of dikes and channel fixation and normalisation through the installation of groyne fields. As a consequence of these measures, the present-day river channels are in an engineered state with rather constant channel width confined by groyne fields, fixed banks that prevent lateral migration and with standard channel depth that is maintained through systematic and incidental dredging.
(a) The Rhine-Meuse delta with the current river branches and mappings of sand bodies from former channel-belts and river dunes (Cohen et al., Reference Cohen, Stouthamer, Pierik and Geurts2012, Reference Cohen, Schokker, Hijma, Koster, Pierik, Vos, Erkens and Stafleu2017), and (b) a schematic cross-section illustrating the anatomy of the fluvio-deltaic wedge (after Cohen and Hijma, Reference Cohen and Hijma2014). The blue dashed line in the cross-section indicates the mean depth of the current river branches. The study area is divided into different Holocene substrate regions (following Cohen et al., Reference Cohen, Schokker, Hijma, Koster, Pierik, Vos, Erkens and Stafleu2017) here relabeled as the lower delta, central delta and upper delta regions (LD, CD and UD respectively), the Southwest tidal region (SW) and the Upper and Lower IJssel valley region (LIJ and UIJ).

Substrate build-up
The location of the present-day Rhine–Meuse delta is largely inherited from the position of the Late Weichselian Rhine and Meuse valleys (Stouthamer and Berendsen, Reference Stouthamer and Berendsen2000). Until 20,000 years ago, the combined Rhine–Meuse systems formed a wide braided river valley in the study area, bounded by 2–5 m higher terraces to the north and south (Hijma and Cohen, Reference Hijma and Cohen2011). The braided river systems mainly deposited coarse sand and gravel (Gouw, Reference Gouw2008). Due to glacial to interglacial climate change fluvial style changed to meandering during the Holocene, causing reduced width of the active river bed and consequent bed level lowering (Cohen, Reference Cohen2003; Hijma and Cohen, Reference Hijma and Cohen2011). The abandoned part of the palaeovalley is covered by a Late Glacial and Early Holocene stiff loam bed (Wijchen Mb.; Törnqvist et al., Reference Törnqvist, Weerts and Berendsen1994; Gouw and Erkens, Reference Gouw and Erkens2007). The Wijchen Mb loam is partly covered by aeolian dune complexes (Fig. 1a) which mainly consist of blown-out sand from the seasonally dry, active river bed (Stouthamer and Berendsen, Reference Stouthamer and Berendsen2001; Hijma and Cohen, Reference Hijma and Cohen2011).
During the Holocene, the Rhine and Meuse systems formed a fluvio-deltaic wedge on top of the inherited Pleistocene topography which was primarily controlled by sea-level rise, land subsidence and changes in discharge and sediment supply (Berendsen and Stouthamer, Reference Berendsen and Stouthamer2000; Cohen et al., Reference Cohen, Gouw and Holten2005; Gouw, Reference Gouw2008; Erkens, Reference Erkens2009). Drowning of the palaeovalley below the coastal plain occurred from approximately 9000 years ago onwards. Due to the relatively steep slope of the Pleistocene surface, approximately 0.3 m km−1 (Cohen et al., Reference Cohen, Gouw and Holten2005), backfilling progressed eastward over time resulting in Holocene deposits onlapping the Pleistocene surface (Gouw and Erkens, Reference Gouw and Erkens2007; Stouthamer et al., Reference Stouthamer, Cohen and Gouw2011a). Relative sea level rise (Fig. 1b) at the river mouth was initially associated with rapid aggradation and backfilling of the palaeovalley (Stouthamer et al., Reference Stouthamer, Cohen and Gouw2011a) and until 6000 years ago, eustatic sea-level rise has been the dominant control in the formation of the wedge. Thereafter under ongoing but decelerating sea level rise, regional land subsidence subsidence of the North Sea basin, together with local subsidence of peatlands are recognised as the dominant contributor to the continued creation of accommodation space and spatial distribution of aggradation (Stouthamer and Berendsen, Reference Stouthamer and Berendsen2000; Cohen, Reference Cohen2003; Gouw and Erkens, Reference Gouw and Erkens2007; Gouw, Reference Gouw2008; Erkens, Reference Erkens2009; Stouthamer et al., Reference Stouthamer, Cohen and Gouw2011a; Pierik et al., Reference Pierik, Cohen, Vos, van der Spek and Stouthamer2017; Gouw and Hijma, Reference Gouw and Hijma2022).
The Holocene sequence (Fig. 1b) is approximately 2 m thick near the delta apex and ∼20 m near the present-day river mouth consisting of intercalated tidal, estuarine and fluvial deposits and organic beds (Stouthamer et al., Reference Stouthamer, Cohen and Gouw2011a; Hijma and Cohen, Reference Hijma and Cohen2011). The base of the Holocene sequence is marked by a widespread typically decimetre thick basal peat layer; its depth follows the inherited Pleistocene topography. The lower delta region (LD; Fig. 1a) drowned during the early Holocene and initially developed as a wide estuary (Hijma and Cohen, Reference Hijma and Cohen2011). Here, the basal peat is buried by several meters of freshwater tidal deposits and estuarine deposits, generally consisting of freshwater tidal mud grading into brackish mud flat deposits (Fig. 1b). More upstream, the estuarine deposits grade into fluvial deposits. The Middle Holocene delta part of the wedge generally consists of fluvial clay and peat (Fig. 1b). Reduced rates of relative sea-level rise after 6000 years ago caused the establishment of a coastal barrier reducing marine input. Additionally, because the main course of the Rhine shifted to the northern rim of the delta, the central delta (CD; Fig. 1a) and lower delta received less fluvial input and changed to a protected inland lagoon (Berendsen and Stouthamer, Reference Berendsen and Stouthamer2000; Stouthamer et al., Reference Stouthamer, Cohen and Gouw2011a). This resulted in large scale silting up of tidal basins and caused a transition to a reed marsh dominated by organic rich clay. After the coastal barrier closed-off, the area from tidal dynamics and sedimentation large scale peat growth was facilitated (Stouthamer et al., Reference Stouthamer, Cohen and Gouw2011a; Pierik et al., Reference Pierik, Cohen, Vos, van der Spek and Stouthamer2017). In the last 3000 years, the Rhine shifted its course back through the lagoonal part resulting in burial of the peatlands with clastic overbank deposits (Erkens, Reference Erkens2009; Stouthamer et al., Reference Stouthamer, Cohen and Gouw2011a).
The Holocene sequence (Fig. 1b) and inherited Pleistocene topography are locally dissected by Holocene ribbon-shaped channel-belt sand bodies. In the more confined upper delta (UD; Fig. 1a), channel-belt sand bodies formed amalgamated (i.e. stacked) complexes over considerable length (Gouw, Reference Gouw2008; Stouthamer et al., Reference Stouthamer, Cohen and Gouw2011a). In contrast, large provision of accommodation space resulted in channels in the CD and LD regions that formed isolated sand bodies encased in cohesive floodplain sediments (Stouthamer et al., Reference Stouthamer, Cohen and Gouw2011a). Downstream, this resulted in a high variability of erodible and non-erodible materials in the subsurface whereas this effect is much smaller upstream.
Methods
To study the relation between the occurrence and characteristics of scour holes in present-day river channels and subsurface architecture, scour hole locations and their characteristics were determined from bathymetry data of the Rhine and Meuse river channels. The locations and characteristics were subsequently confronted with the local hydrodynamic conditions (i.e. river flow velocity, channel curvature, nearby confluence or structure) and subsurface architecture derived from a 3D subsurface model, geological mappings of different depositional environments and detailed cross-sections.
Bathymetry analysis
Huismans et al. (Reference Huismans, Velzen, Mahoney, Hoffmans and Wiersma2016) identified approximately 120 scour holes in the central and lower delta regions and southwest tidal region. We revisited and extended this inventory to the entire Rhine–Meuse delta. We identified scour holes and subsequently determined their extent and characteristics.
Scour hole identification
We analysed a bathymetric dataset by visual inspection to identify scour holes. The dataset was available from the Dutch Water Authority (Rijkswaterstaat) for the Rhine and Meuse river channels and consisted of multibeam soundings with 5 × 5 m resolution. Scour holes were manually identified using the following initial criteria: (1) a local deepening of at least 1 m compared to the mean of the surrounding channel bed (D mean; Fig. 2, black dashed line, relative to Dutch Ordnance Datum) and (2) a maximum length in longitudinal direction of 1 km. We used longitudinal and transverse depth profiles, drawn in ArcGIS, to test if the criteria were met. See Appendix A for the effect of different thresholds on the number of scour holes that are identified. The initial depth threshold along with expert judgement were used to exclude depth variations in the natural morphology of the channel-bed resulting from bedforms. During bank-full and higher discharges in the river Waal, bedforms develop with heights over 0.5 m over the full width of the navigable channel bed (Wilbers, Reference Wilbers1999; Kleinhans et al., Reference Kleinhans, Wilbers, De Swaaf and Van Den Berg2002). Regarding the length threshold, meter-scale depth undulations longer than 1 km length are considered as the normal channel-bed topography. This length threshold generally corresponds to 4–10 times the width of the navigable channel bed of the Rhine and Meuse branches. Therefore, a larger length threshold (3 km) was chosen for the three times wider former Haringvliet estuary, in the southwest tidal region (Appendix A).
(a) Stepwise visualisation of how the bathymetry threshold value (Dt; equation 1) is determined and (bcd) how scour hole boundaries are determined. The boundary determination consists of (b) rotating a line from the deepest point of the scour hole and searching the nearest occurrence of Dt, (c) adding random points within the defined boundary of the previous step and repeat the method of step b and (d) smooth the defined boundary of the previous step using a simplify operation from Shapely (Gillies et al., Reference Gillies2007).

Scour hole boundaries
To compare quantitative scour hole characteristics to subsurface architecture, we developed an objective automated method for the determination of the scour hole boundaries (Fig. 2). This method consisted of searching for a threshold depth (Dt ) relative to Dutch Ordnance Datum (DOD) in the river bathymetry to determine the outer boundary of each scour hole. The threshold was determined using the deepest point of the scour hole and local mean depth of the river branch. The deepest point of the scour hole was determined using a watershed analysis in PCRaster Python (Karssenberg et al., Reference Karssenberg, Schmitz, Salamon, de Jong and Bierkens2010). A watershed analysis determines the drainage of an area towards the lowest point. The local mean depth was used to reduce the influence of the scour hole or local bumps on the average depth of the river; for example, using the mean depth at the location of a scour hole would overestimate mean depth. The average depth of the total river branch was not sufficient to use due to the downstream gradient in bed elevation. The local mean depth of the river was determined in two steps. First, channel cross-sections were created every 5 m along the river centerline of which the mean depth was calculated. Second, the local mean depth was calculated using a 500 m moving average over the means of the cross-sections. Finally, we calculated the threshold according to eqn 1:
 $$ D_{t}=D_{\max }+{D_{{\rm mean}}-D_{\max } \over 2} $$
We determined the extent of scour holes by searching for the nearest occurrence of the threshold from the deepest point of the scour hole. The first step (Fig. 2b) consisted of defining a line of infinite length from the deepest point of the scour hole to ensure the scour hole boundary was within the extent of the line. The line was subsequently rotated 360° using steps of 1° and with each step we looked for the nearest occurrence of the threshold. This resulted in a rough first estimate of the scour hole boundary (Fig. 2c). Because of the type of analysis some areas are excluded from the scour hole that should be incorporated due to blockage from high edges or corners in the bathymetry (Fig. 2c). We repeated the analysis by adding random points (n = 10) within the defined boundaries from the previous step to get the complete outer edge. Tests using larger numbers of random points did not change the boundaries of the scour hole. Finally, we smoothed the rough edges of the scour hole caused by the cell size (i.e. 5 × 5 m; Fig. 2d). The tolerance used corresponds to the cell size of the bathymetry maps.
Scour hole characteristics
We derived basic characteristics which are depth (see equation in Fig. 2a), average and maximum slope and surface area using standard PCRaster tools. The depth of a scour hole is made dimensionless by including the water depth as shallow channel sections will lead to relatively shallow scour holes. Water depth was derived by subtracting the bathymetry from a representative water level obtained from water level elevation measurements done by Rijkswaterstaat (available at: https://waterinfo.rws.nl). We took elevations for normal discharge of the Rhine (i.e. representative water level) and linearly interpolated between measurement stations along the centerlines of the river to derive a spatially continuous water depth. Next, scour hole depth was expressed as the ratio between maximum depth of the scour hole (D max, wl) and the local average depth (D mean, wl) with respect to the water level (Fig. 2a). Furthermore, we determined two basic shape parameters aspect ratio and solidity. Aspect ratio is the length/width ratio and was calculated by fitting the smallest possible rectangle around the scour hole using Shapely’s minimum rotated rectangle (Gillies et al., Reference Gillies2007) and dividing the length and width of that rectangle. Solidity was calculated by taking the ratio between the area of the scour hole and its convex hull (i.e. a shape around the scour hole which excludes concave areas). This measure can vary between 0 and 1 and indicates if a scour hole is a solid object or has irregular boundaries; a lower value means more irregular boundaries.
Hydrodynamic conditions
To assess the potential correlation of scour holes with hydraulic conditions, we compared the scour hole dataset to available flow velocities from hydrodynamic model simulations. Furthermore, we compared the dataset to channel planform characteristics (e.g. bend curvature, confluences) and the occurrence of engineering structures (e.g. bridge pillars) that generally lead to local deviating flow conditions but might not be represented in the flow patterns of the model simulations.
For comparison with the flow velocities, we used readily available simulation results from calibrated hydrodynamic models as there is no measured flow data available covering the full length of the river branches. These state-of- the art models have been set up for Rijkswaterstaat as core instruments for river management tasks; they have been calibrated to long (multiple years and discharge states) hydraulic and bed-state observational data series. For the downstream reaches in the LD, CD and SW output from the 1D SOBEK model was available. For the upstream branches Waal, Nederrijn, Lek and Bovenrijn in the LD, output from the 2D WAQUA model was available. Full details on the respective models can be found in Kraaijeveld (Reference Kraaijeveld2003) and Kernkamp et al. (Reference Kernkamp, Van Dam, Stelling and de Goede2011). The modelled flow velocities represent depth-averaged 50 and 90 percentile (SOBEK) and 95 percentile (WAQUA) and allowed for a direct comparison between the abundance and depth of scour holes and general flow conditions in the branches. The model output is not suitable to represent local (e.g. 10 m spatial resolution) flow velocity, turbulence or associated shear stress at the channel bottom; capturing the local flow conditions around scour holes would require site-specific models. Nevertheless, it is suitable to identify overall differences in flow conditions between river branches and along these branches. Moreover, in combination with the bend curvature and location of confluences and engineering works as used proxies for local deviating flow conditions, we obtained a comprehensive view of the relevant hydraulic conditions that may induce scour holes.
Considering the channel planform or engineering structures as triggers of scour hole formation, we mapped for all river branches the locations of structures, confluences and derived the bend curvature (i.e. radius of curvature; RC). Note that for natural river settings changes in channel width also cause localised flow conditions that may induce scour holes but this is negligible in most cases for the engineered Rhine–Meuse branches with near constant, artificial widths. Therefore, we did not explicitly consider channel width variations as a potential control. By comparing the information with the scour hole dataset, we determined a potential hydrodynamic trigger for each scour hole; each scour hole was labelled for the occurrence near a confluence, bend or if no potential trigger could be determined (e.g. straight river section with no confluence or structures nearby). Note that even if a trigger was determined, there still could be a combination of factors influencing the scour hole.
The RC was derived from the river centerline for each branch within the study area. The centerlines are made up by line segments between unevenly spaced inflection points. Splines were interpolated through the x and y coordinates of the inflection points and the RC was calculated based on their derivatives, indicated by the prime (’), according to eqn 2:
 $$ {\rm RC}={\left(\left({x}{\rm '}\right)^{2}+\left({y}{\rm '}\right)^{2}\right)^{{3}\over{2}} \over {x}{'}{y}{''}-{y}{'}{x}{''}} $$
The RC was calculated every 100 m along the centerline. Finally, RC was normalised (RC n ) through division by the median channel width of a river branch (see Appendix B for median channel widths study area) conform Nittrouer et al. (Reference Nittrouer, Mohrig, Allison and Peyret2011).
Subsurface architecture
We combined different types of geological information to determine subsurface architecture. Large scale trends in the substrate composition of the delta were derived from GeoTOP v01 (maintained by TNO-Geological Survey of the Netherlands) which is a high-resolution 3D voxel model (100 × 100 × 0.5 m resolution [x, y, z]) containing lithostratigraphic architectural units and lithologic compositional information of the upper tens of meters of the Dutch subsurface (Stafleu et al., Reference Stafleu, Maljers, Gunnink, Menkovic and Busschers2011). We queried the lithostratigraphic units and lithologic composition for a buffered area of 500 m around the active river channel, in horizontal direction, and a vertical window of 3 m above and below the average depth (relative to DOD) of the floor of the modern river channels that are within the modelled area of GeoTOP. This captures the most relevant subsurface composition close to the river bed. For the purpose of this research, GeoTOP’s lithostratigraphic units were grouped according to their position in the Holocene deltaic wedge and pre-deltaic substrate (according to Table 1). From east to west in the study area, we calculated the relative frequencies of occurrence of each stratigraphic group and most likely to occur lithology at 100 m intervals, in correspondence to the cell size of GeoTOP.
Main lithostratigraphic units of the Geological Survey of the Netherlands (TNO-GSN) in the substrate of the study area and their relative resistance to erosion. The main erosion resistant layers are highlighted in bold

We used digital mapping products of locations of former channel belt deposits and buried landscapes available at Utrecht University (Fig. 1a; Cohen et al., Reference Cohen, Stouthamer, Pierik and Geurts2012, Reference Cohen, Schokker, Hijma, Koster, Pierik, Vos, Erkens and Stafleu2017) to investigate potential linkage between scour holes and certain types of architectural elements. The architectural elements tracked in this analysis (following Stouthamer et al., Reference Stouthamer, Cohen and Gouw2011a) are buried channel belt sand bodies, buried inland dunes and buried crevasse splay sands filling former deltaic lakes. These are sandy erodible elements that occur intercalated in the otherwise cohesive and compacted muddy to peaty Holocene deltaic wedge (Fig. 1b). From this, we determined the substrate setting for all scour holes and potential architectural elements in which they occur which allowed us to compare derived characteristics with individual architectural elements.
The material along the edge of the scour hole can affect the dimension and shape of scour holes and potentially limit lateral expansion. Therefore, for each scour hole location, we determined the lithologic composition along the edges of the scour hole; the edge zone was defined as 50 m in horizontal direction and 0.5 m in vertical direction directly bordering the earlier defined scour hole boundary (Fig. 2a). As a first step, we queried GeoTOP’s standard stochastic attributes (Stafleu et al., Reference Stafleu, Maljers, Gunnink, Menkovic and Busschers2011), to determine the possible lithological composition around the scour hole. Where possible, the results where refined using available local data from detailed geological cross-sections (Hijma et al., Reference Hijma, Cohen, Hoffmann, van der Spek and S.2009; Stouthamer et al., Reference Stouthamer, Pierik and Cohen2011b; Stouthamer and Haas, Reference Stouthamer and Haas2011; Wiersma, Reference Wiersma2015). This allowed to subdivide the scour hole inventory by differences in dominant lithology in the surrounding substrate.
Results
The bathymetric analysis resulted in 165 scour holes of which 75% are located in the downstream regions LD, CD and SW (Fig. 3). In the more upstream channels, scour holes only occur in a few specific areas. No scour holes have formed in long river stretches in the UD and IJssel regions (UIJ, LIJ). In almost all downstream river branches, scour holes generally occur throughout the entire branch (Fig. 3). The higher abundance of scour holes in the downstream regions coincides with regional trends in subsurface composition. The downstream part of the delta (dark green, Fig. 3) generally consists of alternating tidal and fluvial deposits and peat and therefore shows stronger heterogeneity (i.e. high variation of deposits of different erodibility) compared to the upstream part (light green, Fig. 3) which is dominated by fluvial deposits.
Locations of scour holes in the Rhine-Meuse delta compared to the large scale buildup of the Holocene substrate in the study area. The percentage of scour holes per geological region are indicated in the histogram. The river kilometers indicate distance along the river.

Relation to hydrodynamic conditions
The location of each scour hole together with river flow velocity, channel planform (i.e. bends, confluences) and structures (i.e. bridge pillars/tunnels) is presented in Fig. 4. Direct comparison shows that the number of scour holes per branch does not correlate with the average channel flow velocity (Fig. 4; Appendix B); large number of scour holes can occur in branches with both relatively high and low velocities. The potential triggers for local deviating flow conditions (i.e. bends, confluences, engineering structures) highlighted in Fig. 4 do not show clear correlations for most scour hole locations. Scour holes are located throughout different river sections with varying degrees of curvature; they occur both in straight channel sections as well as moderate and sharp bends. Due to past engineering works, only few sharp bends exist; most channels are only moderately curved. Approximately 15% and 25% of scour holes are located in sharp and moderate bends, respectively. The remaining scour holes are in slightly curved to straight channel sections. Furthermore, several scour holes occur at confluences or structures (Fig. 4) that likely caused their development.
Locations of scour holes in relation to normalized radius of curvature (RCn), flow velocity derived from SOBEK and WAQUA and relevant features (e.g. confluence/bifurcation, bridge/tunnel) for the main river branches in the Rhine-Meuse delta. Seaward direction corresponds to increasing rkm. The locations of scour holes are indicated by vertical dashed lines. RC indicates curvature of the river channel which can be classified into sharp bends (RCn < 3.5), moderate bends (3.5 < RCn < 10) and slightly curved to straight (RCn > 10). See appendix B for the location of each branch.

Overall, several scour hole in the delta are likely the result of the erosive forcing arising under specific hydraulic conditions occurring in moderate or sharp bends, confluences or engineering structures. However, the location of more than 50% of scour holes cannot be attributed to local flow conditions that enhance erosivity which indicates that their formation should be attributed to local variations in erodibility of the channel bottom material. Thus, the subsurface needs to be considered in understanding the formation of these scour holes.
Subsurface composition and scour hole density
The subsurface composition at depths around the river channel floor in the UD (Fig. 5) is dominated by fluvial deposits of Pleistocene or pre-Pleistocene age which mainly consist of coarse sand and gravel. Approximately 20% (with local maxima up to 50%) of the substrate near the river flooris made up by Holocene channel belt deposits. Furthermore, small contributions (up to ∼10%) of the Wijchen Mb are present. In downstream direction throughout the UD, the contribution of Pleistocene fluvial deposits gradually decreases. Simultaneously, the percentage of gravel and coarse sand decreases to near 0% and less than 10% respectively. Conversely, the contribution of Holocene fluvial deposits increases as well as finer lithological classes (Fig. 5a and b). Observed percentages of clay and sandy clay are on average 20% in this area.
Contribution (%) of (a) lithostratigraphic unit groups (cf. Table 1 and (b) lithology to subsurface composition compared to number of scour holes per km river (c) and regional division of the study area (UD, CD, LD & SW; Fig. 1a). Percentages are calculated in a zone of 500 meter around the river for every 100 meters from east to west.

Most notable changes occur in the CD (Fig. 5). In this area, the subsurface shows the highest variability in terms of contributions of different types of deposits, with alternating peat, deltaic tidal and fluvial clay, inland dunes and channel belt deposits. The CD is marked by a strong increase and the highest occurrence of peat near the river bed throughout the study area. In downstream direction, the percentage of peat rapidly rises to ∼30% with a maximum of up to 60% (Fig. 5a). A corresponding increase in organics can be observed which together with the finest lithological classes is dominating the substrate in this part (Fig. 5b). Towards downstream, some tidal deposits are observed.
In the most downstream parts (LD & SW; Fig. 5), the percentage of peat decreases to on average ∼15%. Here, the river bed substrate is strongly dominated by tidal deposits. Furthermore, channel belt deposits are locally present, with percentages varying between approximately 5 and 20%. For the largest part, regions LD and SW are dominated by organics, clay and sandy clay which together make up around 80% of the substrate near the river bed (Fig. 5b). Towards the delta mouth, however, a coarsening trend can be observed with a sharp rise in the fine and medium sand fractions (Fig. 5b).
From east to west, the number of scour holes per kilometer of river strongly increases (Fig. 5c). The lowest number of scours per kilometer, between 0 and 0.2, occurs in the UD. The sharpest increase in the number of scour holes is in the CD. Here, between 0.5 and 1 scour holes occur per kilometer. This coincides with the increase in percentage of peat and fine deposits resulting in increased heterogeneity of the substrate near the river bed in this area (Fig. 5).
Subsurface architecture and lithology at scour hole locations
An overview of the relation to subsurface architectural elements and lithology along the edge of scour holes is presented in Table 2 and locations in Fig. 6. Of the total of 154 scour holes incorporated in this part of the analysis – the IJssel (UIJ and LIJ; Fig. 1a) has been excluded here due to insufficient subsurface data – 78 occur in erodible material from sandy architectural elements or by a breach in an erosion resistant layer exposing erodible sediments below. In the SW region (Table 2), 12 scour holes occur in older tidal basin deposits (TB; Wormer Mb) and 5 in younger tidal estuarine deposits (Est; Walcheren Mb; Fig. 6b). The lithologic composition of the edges varies among these scours, but in Est the edges are predominantly sandy (Fig. 6a). The remaining 76 scour holes (Table 2) do not correlate with subsurface architecture and result from structures (n = 28; e.g. bridges, tunnels or fixed layers) or are related to confluences, bends, narrower channel sections or side channels (n = 48). This group of scour holes occurs throughout the study area and varies greatly in the lithologic composition along their edges (Fig. 6). Especially scour holes in the UD cannot be linked to local subsurface architecture.
Number of scour holes per region (n = 154; scour holes in regions UIJ and LIJ are excluded; Fig. 1a), link with architectural elements and the lithologic composition in the scour hole edge. Abbreviations in the table header stand for (Cb) Channel-belt, (Oe) Other elements (Incising channel-belts, buried Inland dune sands and buried lake fill sand-splays), (Est) Estuarine, (TB) Tidal Basin, (Wy) Wijchen Mb and (None) not applicable if there is no relation with any geological unit

Scour hole locations in the delta and southwest-tidal regions and (a) lithologic composition along the edge of the scour hole and (b) possible link to architectural element in the subsurface.

A total of 40 scour holes occur in erodible material from architectural elements of which 28 occur in channel-belt sand bodies (Cb; Table 2). The majority of these Cb scours is located in the N–S connecting branches in the western part of the CD (Fig. 6b). Most Cb scours contain cohesive clay and/or peat along their edge. Twelve scour holes occur in sandy deposits from other architectural elements (Oe; Table 2); five occur in inland dunes and 1 in a lake fill sand splay. These scour holes are all located in the Lek and Noord branches (Fig. 6b). The remaining six occur in Early Holocene channel belt sand bodies formed under net incising conditions and are distributed throughout different regions of the study area. Similar to Cb scours, Oe scours are mainly located in the CD, with three exceptions (Fig. 6b). The lithologic composition along the edge of Oe scours is more variable compared to Cb-scours (Table 2).
In total, 21 scour holes have formed due to breaches in the resistant Wijchen Mb loam underlying the river channel. These mainly occur in the LD and most western part of the CD and two occur in the UD (Fig. 6). In the CD, the lithology along the edge of the scour holes in this group consists mainly of clay below a peat layer. In the LD, a peat layer is mostly absent and the scour holes are more heterogeneous along their edges (Table 2). The formation of scour holes in the LD due to breaches of the Wijchen Mb (Fig. 6) can mainly be attributed to the increased mean river depth (Fig. 1b). Consequently, the river channel bottom intersects older deposits. The Wijchen Mb occurs at approximately −15 m DOD near the confluence of the Dordtsche Kil and Oude Maas (Fig. 6) increasing towards downstream to approximately −20 m DOD near the river mouth at Rotterdam (Hijma et al., Reference Hijma, Cohen, Hoffmann, van der Spek and S.2009; Wiersma and Hijma, Reference Wiersma and Hijma2015). A relatively large number of scour holes are attributed to the Wijchen Mb in the LD because it occurs at shallow depth below the river channel bottom here.
Scour hole characteristics by region
The derived characteristics for all scour holes in this study are presented for the delta regions (LD, CD and UD), the River IJssel region (LIJ and UIJ) and the southwest tidal region (SW; see Fig. 1 for regional subdivision) in Fig. 7. Although UIJ and LIJ results are included in Fig. 7, the number of scour holes here is too low to determine whether their characteristics can be related to subsurface composition. Analysis of Vvariance (ANOVA; Appendix C) shows that except for aspect ratio and solidity, the scour hole characteristics show significant variation between regions. In terms of area and depth, scour holes in the southwest tidal region clearly differ from the other regions; a post-hoc Tukey test (Appendix C, Table C2) shows that scour holes in the SW region are significantly larger (p = .001) and deeper (p = .001) than in the other regions (Fig. 7). The deepest scour holes occur in SW with relative depths of up to 3.5 and for two scour holes approximately 4.5 and 5.5. In the other regions (LD, CD and UD), generally a relative depth between 2 and 3 is observed.
Boxplots of scour hole characteristics per region. See figure 1 for regional division and meaning of abbreviations of the regions. Note that depth is dimensionless because it is a relative depth with respect to the water depth (see section 3.1.3).

Throughout the LD, CD and UD some trends in scour hole characteristics can be recognised (Fig. 7). Scour hole area increases two times on average but the minimum (ca. 1000m2; Fig. 7) does not change across the delta. In the UD, the largest observed scour holes are under 20,000 m2 while in the LD, the area of scour holes can exceed 40,000 m2. The aspect ratio of the scour holes shows considerable variation within the delta but no significant differences were found between the three regions (Appendix C, Table C1). While the range in aspect ratio decreases in downstream direction, the median increases from ∼2 (UD) to ∼3 (LD). Scour holes in the LD and CD often are more irregular (i.e. low solidity) as the median solidity is lower compared to the UD (Fig. 7). Furthermore, the average and maximum slope of scour holes increases in downstream direction with largest observed slopes in the LD.
Scour hole characteristics by substrate type
Figure 8 shows the scour hole characteristics for different architectural elements and lithologic composition along the edge of the scour hole. Although there is substantial variability in these characteristics, ANOVA shows that only some of those differences are significant which indicates scour hole characteristics are not related to substrate type alone (Appendix D). Most notable is that for Cb scours all characteristics, except area, ranges are approximately similar and narrow. Cb scours generally have low aspect ratios ranging between 2 and 4 and solidity values of mainly 0.8–0.9. Only with sand along the edge, the solidity shows lower values; for the other characteristics and edge compositions, relatively small ranges are observed. Average slope of Cb scours is relatively high and varies between 10 and 14 degrees and is independent of the lithology at the edge. Maximum slope shows higher values for clay or mixed lithologic composition at the edge. The depth of Cb scours is approximately two times the mean depth.
Boxplots of scour hole characteristics per architectural element grouped by the lithologic composition in the edge of the scour. Abbreviations in the top right legend are related to the geological feature the scour hole is linked to. (Oe) Other elements (Incising channel-belts, buried Inland dune sands and buried lake fill sand-splays), (Cb) Channel-belt, (Wy) Wijchen Mb and (None) if there is no link with a geological feature. Only scour holes in the delta regions are included in the figure (regions LD, CD, UD; Fig. 1).

Scour holes due to breaches of the Wijchen Mb show ranges for aspect ratio that are similar compared to Cb scours. However, with mixed lithology along the scour hole edge, a slightly wider range is observed. The solidity of Wijchen scours is generally higher than Cb scours. They show relatively high solidity with clay along the edge and lower values with mixed lithology. The average slope ranges between 8 and 16 degrees. The highest maximum slope (up to 50°) and scour depth (>3.5) have been observed with this group. In general, slope increases towards the downstream regions. This is most clear for scour holes of which the edge consists of clay which have higher slopes than scour holes with sandy edges (Fig. 8; Appendix D).
Largest ranges and lowest values for aspect ratio and solidity are observed with Oe scours that contain sand at the edge. These primarily occur in buried inland dune deposits. With mixed lithology along the edge, these ranges are smaller. As for Cb scours, the depth of Oe scours is relatively low and do not exceed approximately two times the mean depth. Other scours (None; Fig. 8) show the largest variation for all characteristics and throughout all the lithologic compositions in the scour edge.
Because hydrodynamic conditions exert control on the depth of scour holes, we compared the relative depth with the river flow velocity, RC and east-west location (i.e. Easting) in the study area (Fig. 9). Easting was used because tidal amplitude increases towards the west for the Rhine-Meuse delta. A strong scattering is observed within all plots of Fig. 9 suggesting that the relative depth shows no clear link with one of the variables; indicated by low coefficients of determination. Considering coefficients of determination among different hydrodynamic settings of the scour holes does not improve the relation with relative depth. Most notable is that scour holes that show a link to architectural elements (Channel-belt, Inland dunes, Lake fill sand-splay) have maximum relative depths of 2.2 even though they occur over a range of hydrodynamic settings (Fig. 9a, b and c). For scour holes related to other features (e.g. Wijchen, Tidal basin) or those that do not show a link with the substrate a larger range is observed with relative depths between 2 and 5.
Relative depth of scour holes plotted against (a) the 90 percentile of river flow velocity, (b) radius of curvature and (c) east-west location (Easting) in the study area. The colors indicate the link of each scour hole to architectural element. The symbols indicate the hydrodynamic setting that is likely related to the formation of the scour hole. Note: not all scour holes are included as flow velocity and channel curvature are not available for all branches.

Exploratory factor analysis
To further evaluate potential systematic variation within the scour hole characteristics and to evaluate whether these could be linked to hydrodynamic conditions or substrate characteristics, we performed Exploratory Factor Analysis (EFA) using Python’s FactorAnalyzer. The EFA was performed using a varimax rotation which maximises the sum of the variance of squared loadings while ensuring that the factors created are not correlated (orthogonality). EFA analysis describes the variability among the scour hole characteristics in terms of a potential lower number of latent variables (i.e. factors) which allows to derive underlying patterns within the data.
The results of the EFA show that the variability within the observed scour hole characteristics can be described by three factors which relate to slope, shape and dimension. The slope factor (F1) consists of the average and maximum slope, the shape factor (F2) of aspect ratio and solidity and the dimension factor (F3) of the area and depth (Table 3). At first sight, EFA results show no clustering of characteristics for any group in a downstream direction or for substrate type (Fig. 10). Also the hydrodynamic setting of the scour holes shows no clear correlation to any of the factors. This strong scattering indicates that no distinct type of scour hole with any specific characteristics can be expected based on its occurrence in any substrate type or hydrodynamic setting; rather, characteristics are governed by the local combination of factors (i.e. hydrodynamic conditions, substrate composition) at the scour hole location.
Loadings for the scour hole characteristics to each of the factors from the exploratory factor analysis. Numbers in bold indicate association of an attribute to a factor. We used a cutoff value of 0.5 to determine association

Biplots from the factor analysis and corresponding eigenvectors of the input variables indi-cating correlation to each of the factors. The derived scour hole characteristics can be described by three factors: slope factor (F1), shape factor (F2) and dimension factor (F3). See Table 2 for substrate links. The symbols indicate the hydrodynamic setting that is likely related to the formation of the scour hole (see legend Fig. 9).

Still, some inter-connections between the boundary conditions for scour hole formation and characteristics can be derived from the EFA. Mainly the slope and dimension factors show a correlation with location within the delta. Larger and steep scour holes, indicated by high scores of slope and dimension factors, are mainly located in the downstream part of the delta and vice versa (Fig. 10a). This corresponds to described longitudinal trends in section “Scour hole characteristics by region” and suggests that both factors are indicative of hydraulic conditions resulting from increased tidal flow velocities. The EFA results compared to substrate type (Fig. 10b and c) reveals that, to some degree, all factors are indicative for substrate setting as well. Scour holes resulting from breaches of the Wijchen Mb are relatively clean (i.e. high solidity) and confined (i.e. limited lateral expansion); showing low and intermediate scores of the shape and dimension factor, respectively (Fig. 10). A wide range of slopes, indicated by variable scores for the slope factor (Fig. 10b), are possible for these scour holes which suggests that this partly reflects the erodibility of the substrate along the edge of the scour hole. For Cb scours, a variety of shapes is possible which is indicated by variable scores of the shape factor (Fig. 10b). Relatively low scores for the dimension factor suggests these scour holes have small to intermediate dimensions (Fig. 10c) which suggests that the dimensions of these scour holes can be limited by the dimensions of the channel belt sand body.
Discussion
We assess the effects of delta-scale geological heterogeneity, related depositional history and local subsurface architecture on scour hole formation in the Rhine–Meuse delta. Less than half of the scour holes in the Rhine–Meuse delta can mainly be attributed to hydrodynamics which shows that this alone cannot account for the formation and abundancy of scour holes. Below we discuss how subsurface conditions influence scour hole locations and characteristics.
Scour hole locations in relation to the substrate
While scour holes have been observed in all river branches, they are much more abundant in the lower delta reaches (Fig. 3). The increase in abundance coincides with a downstream fining and increased heterogeneity of the substrate (Fig. 5). Lower delta reaches encounter stronger vertical and horizontal heterogeneity compared to upstream. This is the result of the depositional history of the delta and now forms an important driver for scour hole formation. Due to significant differences in material properties over relatively short distances, the heterogeneity causes local channel bed erosion (i.e. scour holes) in easily erodible bodies of sand that are surrounded by resistant clay and peat (Sloff et al., Reference Sloff, van Spijk, Stouthamer and Sieben2013; Huismans et al., Reference Huismans, Koopmans, Wiersma, De Haas, Berends, Sloff and Stouthamer2021).
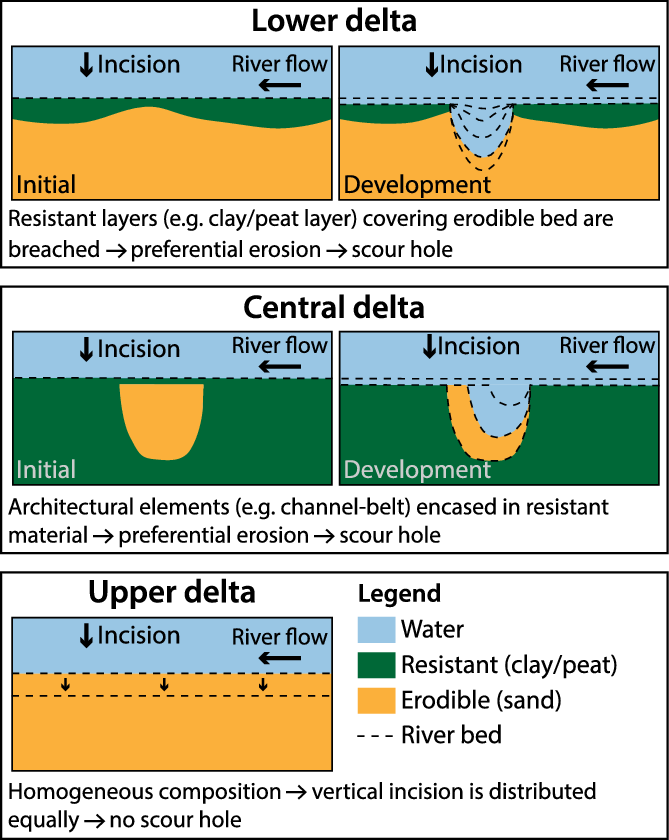
We have observed a clear regional subdivision for scour holes and their spatial correlation to subsurface architecture (Fig. 11). Scour holes that occur in sandy architectural elements (e.g. Cb scours) developed mainly in the CD whereas in the LD they are generally related to the Wijchen Mb (Fig. 6b; Fig. 11). This subdivision is related to the downstream increasing mean river depth (Fig. 1b) and substrate trends throughout the delta. In the UD, the river channel bottom encounters relatively little variation in erodibility because it is mainly incised in coarse sands and gravels. Therefore, vertical incision is distributed more equally (Fig. 11) and scour holes are more likely due to engineering works causing local disturbances in the river flow (e.g. Termini, Reference Termini2014). In the CD, the fluvio-deltaic wedge thickens (Stouthamer et al., Reference Stouthamer, Cohen and Gouw2011a) and the river channel bottom is incised in Holocene clay and peat alternated by locally more erodible sandy architectural elements. Most scour holes that occur in channel belts are located in roughly N–S oriented branches in the CD (Dordtsche Kil, Noord, Hollandsche IJssel; Fig. 6b). These branches formed between 2500 and 1500 years ago as part of major delta network and tidal inlet reconfiguration (Stouthamer and Berendsen, Reference Stouthamer and Berendsen2001; Stouthamer et al., Reference Stouthamer, Cohen and Gouw2011a; Vos, Reference Vos2015; Pierik et al., Reference Pierik, Stouthamer, Schuring and Cohen2018) and have a contrasting orientation to the general E–W flow direction of past Rhine and Meuse branches; they run perpendicular to the ribbon-shaped channel belt sand bodies in the deltaic substrate. Because these sand bodies are encased in cohesive floodbasin deposits, the river flow encounters large differences in bed erodibility where modern channels cross-cut the channel belt sands (Fig. 11). If the former channel belt is oriented in a direction parallel to the modern channel, this effect hardly occurs. In the LD, the modern river channels often encounter Early Holocene erosion resistant layers due to the high mean river depth. Local breaches in such layers may cause scour hole formation if erodible deposits below are exposed (Fig. 11).
Schematic illustration of how scour hole formation is associated to subsurface architecture and representation of the observed regional distinction between scour holes and typical relation to subsurface architecture.
The link between scour hole locations and substrate depositional history is very well illustrated in the Dordtsche Kil branch (Fig. 6). Huismans et al. (Reference Huismans, Koopmans, Wiersma, De Haas, Berends, Sloff and Stouthamer2021) recognised that the longitudinal bathymetry profile of this branch is strongly influenced by the substrate. A clear distinction in river depth is observed between the northern part, characterised by numerous scour holes (Fig. 6) and the southern part which is much more homogeneous in depth and contains no scour holes. This transition coincides with the southern edge of the Rhine–Meuse palaeovalley (Fig. 12a). Therefore, deposition of the resistant Wijchen Mb loam was restricted to the northern part of the Dordtsche Kil. Later dissection by Holocene channel belts resulted in local erosion of the Wijchen Mb and deposition of thick sand bodies with flanking overbank deposits. As a result, the northern part of the Dordtsche Kil is incised in heterogeneous substrate with large variation in erodibility over relatively short distance. In contrast, the southern part is incised into the coversand terrace (Fig. 12) which is much more homogeneous. Consequently, vertical incision in the north of the Dordtsche Kil mainly occurred in the channel belt sand bodies resulting in local deep scour holes while erosion was distributed more evenly in the south.
Paleogeographic reconstruction maps for the Lower delta in transgressive stages 9100 and 8500 years ago (from Hijma and Cohen, Reference Hijma and Cohen2011), showing the development of the western part of the Rhine-Meuse delta. Basal peats and estuarine deposits accumulated on top of abandoned floodplain deposits (i.e. Wijchen Mb.) in the submerging Rhine-Meuse palaeovalley but not in the bordering cover sand areas.

The Dordtsche Kil example highlights that the occurrence of erosion-resistant layers such as the Wijchen Mb at depths of the channel bottom is an important control for scour hole formation. Other erosion resistant layers are the basal peat, fine grained Holocene floodbasin deposits or gravel beds deposited by Pleistocene braided rivers. Such layers can influence scour hole formation by: (1) breaching a resistant layer may expose erodible sediments below forming a scour hole and (2) deepening is retarded where a resistant layer is encountered. Regional differences in properties or thickness of the erosion-resistant layer, resulting from differences in the substrate formation, may also be an important control. For example, palaeogeographic reconstructions from Hijma and Cohen (Reference Hijma and Cohen2011) show clear differences between the LD and CD near the present-day confluence of the Oude Maas and Dordtsche Kil. The area of the confluence was part of an abandoned floodplain for longer and experienced later drowning resulting from sea-level rise (Fig. 1b; Fig. 12a and b). Therefore, soil formation persisted longer which likely resulted in a more resistant Wijchen Mb at the confluence compared to further downstream. As a result, the associated scour holes have relatively confined shapes which indicated by a higher solidity and lower aspect ratio of scours with clay along their edge, located near the confluence, compared to a mixed lithology which are located further downstream (Figs. 6 and 8). Furthermore, regional variation in thickness, also highlighted in Huismans et al. (Reference Huismans, Koopmans, Wiersma, De Haas, Berends, Sloff and Stouthamer2021), or a sequence of erosion-resistant layers (e.g. basal peat on top of Wijchen Mb) has pronounced effects on the eventual locations and dimensions of scour holes.
Substrate influence on scour hole characteristics
Our analyses have shown that the substrate affects key scour hole characteristics such as slope, dimensions and depth. The downstream steepening of scour hole slopes coincides with the increased proportion of cohesive sediments in the substrate which are more capable of maintaining steep slopes. Second, due to the high shear strength clay erosion is often associated with plucking or sliding of chunks of clay leading to steep slopes (Hoffmans and Verheij, Reference Hoffmans and Verheij1997; Stouthamer et al., Reference Stouthamer, Pierik and Cohen2011b). Nevertheless, the steepening is not expected to increase linearly with increasing proportion of cohesive sediment. Variability in steepness can be expected because differences in hydrodynamic and geologic forcings. Different depositional environments (e.g. fluvial or estuarine environments), differences in burial history (e.g. stronger compaction) or varying organic content – and organic structure – affect the nature of the deposits. Such factors have implications for critical shear stress and strength – for example, lower shear strength of organic clay compared to clay (Stouthamer et al., Reference Stouthamer, Pierik and Cohen2011b) – and cohesion which will be reflected in variable scour hole slopes.
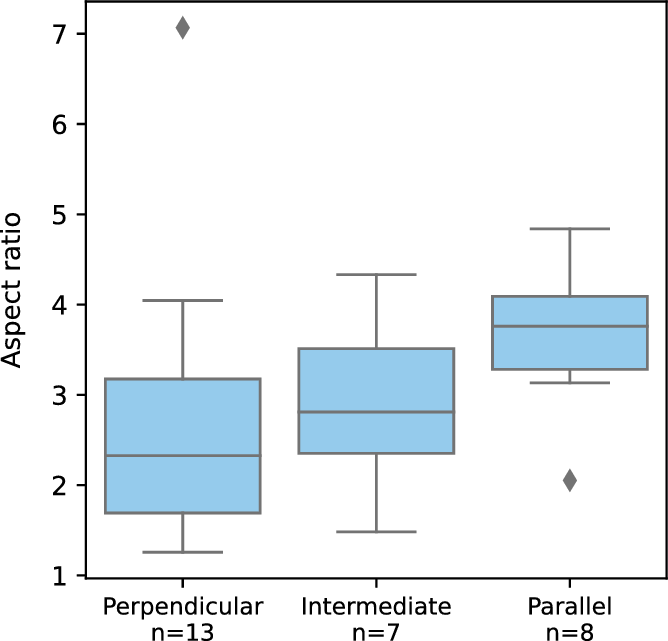
Subsurface architecture also influences the dimensions of scour holes. Scour holes related to the Wijchen Mb are relatively confined in extent which corresponds with the high erosion resistance; variations can partly be attributed to different inherited properties of the Wijchen Mb (section “Scour hole locations in relation to the substrate”). The dimension factors for Cb scours (Fig. 10c) support the observational hypothesis from Huismans et al. (Reference Huismans, Koopmans, Wiersma, De Haas, Berends, Sloff and Stouthamer2021) that the growth of a scour hole is bounded by the dimensions of the channel belt sand body. This is mainly expressed by the aspect ratio (Fig. 13): Cb scours become less elongated with increasing angle between the modern river channel and the intersecting channel belt sand body due to maximum contrast in along river erodibility (see also section “Scour hole locations in relation to the substrate”). Of course the dimensions of the channel belt sand body itself and width of the modern river channel are important controls on the aspect ratio to as these may limit growth.
Boxplots showing the range of aspect ratio for scour holes that occur in ribbon sand deposits from former channel-belts (Cb: Fig. 6b) and corresponding orientation of the crossing between the channel-belt sand body and modern river channel. Lower aspect ratio scour holes are observed at perpendicular crossings.
We observed relative depths between 2 and 5 times the mean channel depth for scour holes in the Rhine–Meuse delta. Similar observations of scour holes for different settings have been reported in the literature (Kjerfve et al., Reference Kjerfve, Shao and Stapor1979; Best and Ashworth, Reference Best and Ashworth1997; Smith et al., Reference Smith, Ashworth, Best, Woodward and Simpson2005; Blanckaert, Reference Blanckaert2010; Vermeulen et al., Reference Vermeulen, Hoitink, van Berkum and Hidayat2014; Ferrarin et al., Reference Ferrarin, Madricardo, Rizzetto, Mc Kiver, Bellafiore, Umgiesser, Kruss, Zaggia, Foglini, Ceregato, Sarretta and Trincardi2018). General broad relations suggest that the depth of scour holes increases with tidal amplitude or backwater length (Ferrarin et al., Reference Ferrarin, Madricardo, Rizzetto, Mc Kiver, Bellafiore, Umgiesser, Kruss, Zaggia, Foglini, Ceregato, Sarretta and Trincardi2018; Ganti et al., Reference Ganti, Lamb and Chadwick2019), or bend curvature (Blanckaert, Reference Blanckaert2010; Vermeulen et al., Reference Vermeulen, Hoitink, van Berkum and Hidayat2014) which are essentially drivers of flow strength and erosivity. Scour holes in tidal-dominated reaches of the Rhine–Meuse delta are generally deeper than a river dominated setting (SW vs. LD, CD, UD; Fig. 7) which is in line with Ferrarin et al. (Reference Ferrarin, Madricardo, Rizzetto, Mc Kiver, Bellafiore, Umgiesser, Kruss, Zaggia, Foglini, Ceregato, Sarretta and Trincardi2018) who compared their results to fluvial data (Smith et al., Reference Smith, Ashworth, Best, Woodward and Simpson2005). Furthermore, when only scours are incorporated that are within the backwater zone of the Rhine–Meuse delta (i.e. Easting coordinate <130) – tides affect water levels up to 100 km upstream at low discharge of the river Rhine (Van den Berg et al., Reference Van den Berg, Boersma and Gelder2007) – the relation between tidal range and depth becomes slightly stronger (R 2 = 0.27). This is more in line with for instance Ferrarin et al. (Reference Ferrarin, Madricardo, Rizzetto, Mc Kiver, Bellafiore, Umgiesser, Kruss, Zaggia, Foglini, Ceregato, Sarretta and Trincardi2018) who derived a coefficient of determination of 0.5, but still the relation is not strong within the Rhine–Meuse data.
Remarkably, scour holes that occur in architectural elements Cb or Oe do not exceed relative depths of more than two times the mean depth, regardless of hydrodynamic setting of the scour hole (Figs. 8 and 9). These scour holes mainly exist in the CD where the contribution of fines is highest (Fig. 5) which generally encase isolated sand bodies (Fig. 11). This encasing of fine cohesive deposits limits the ability of the scour hole to grow outside the dimensions of the sand body. The thickness of such sand bodies scales to present-day water depths (Gouw and Berendsen, Reference Gouw and Berendsen2007) which is reflected in the scour hole depths. In contrast, all other groups of scour holes exhibit depths between 2 and 5 times the mean depth. Part of this can be explained by different subsurface settings. For example, the depth of a scour hole that forms due to breaching a resistant layer is depending more on the combination of local hydrodynamic conditions and grain size of the erodible layer below. The depth is self-limiting because of the interplay between grain size and capability of the flow to carry particles out of the scour hole; finer particles and stronger flow result in deeper scour holes and vice versa. Moreover, different characteristics of tidal and fluvial sands enhance differences in scour depth. Tidal sands are generally finer and more homogeneous which inhibits grain segregation processes and fining-upward sequences, typical in meandering river deposits (i.e. Cb), are absent (Van den Berg et al., Reference Van den Berg, Boersma and Gelder2007). Therefore, in tidal sand deposits (TB and Est) scour hole depth will be more predictable whereas in fluvial meandering river deposits (Cb-scours), coarser, more heterogeneous composition and fining upward sequences may act as additional depth limiting factors.
Transferability to other deltas
The architecture of the Holocene fluvio-deltaic wedge and location and slope of the Pleistocene braided river valley has influenced scour hole formation in the Rhine–Meuse delta. Because boundary conditions controlling fluvio-deltaic architecture such as sea-level rise, local and basin subsidence, aggradation and avulsion (Gouw, Reference Gouw2008) are similar for transgressive deltas (e.g. Rhine-Meuse, Mississippi, Yangtze) we expect that relations between scour holes with palaeogeographic development and subsurface architecture in other deltas are similar. For example, the present-day Mississippi river occupies a river valley increasing in width downstream and is underlain by sloping Pleistocene braided fluvial and aeolian deposits underneath the Holocene fluvial succession consisting of sandy channel-belt deposits and fine grained overbank deposits (Gouw and Autin, Reference Gouw and Autin2008). Due to similar boundary conditions, while different in scale, Gouw and Autin (Reference Gouw and Autin2008) observed striking similarities between the architecture of the Rhine–Meuse and Mississippi deltas; both show similar increases of fine-grained floodbasin deposits and patterns of channel-belt deposits in downstream direction. Moreover, similar increases of fines can be expected in other deltas (Dalrymple and Choi, Reference Dalrymple and Choi2007). Large erosional scours that have been observed in the Mississippi (Nittrouer et al., Reference Nittrouer, Mohrig, Allison and Peyret2011), but also in other deltas, are likely associated with these trends in subsurface characteristics.
We have observed large variation in scour hole location and characteristics across the Rhine–Meuse delta and our analyses show that this results from a complex combination of local hydrodynamic and subsurface conditions. Characteristics such as depth are often attributed to several factors related to hydrodynamic conditions (e.g. Blanckaert, Reference Blanckaert2010; Vermeulen et al., Reference Vermeulen, Hoitink, van Berkum and Hidayat2014, Ganti et al., Reference Ganti, Lamb and Chadwick2019). However, several authors have addressed the issue that only the hydraulic component cannot fully explain locations and depth of scour holes (e.g. Sloff et al., Reference Sloff, van Spijk, Stouthamer and Sieben2013; Liang et al., Reference Liang, Du, Pan and Zhang2020; Huismans et al., Reference Huismans, Koopmans, Wiersma, De Haas, Berends, Sloff and Stouthamer2021). This is corroborated by our results which demonstrate that subsurface architecture is a major additional control for scour hole formation. Moreover, other examples can be found in the literature that show substrate influence on channel bed bathymetry (e.g. Smith and Perez-Arlucea, Reference Smith and Perez-Arlucea2004; Pierik et al., Reference Pierik, Leuven, Busschers, Hijma and Kleinhans2022). Our results allow to build a delta-scale explanatory framework for scour hole formation, that is transferable to other deltas with extensive Holocene deltaic wedge substrates around the world.
The position of present-day river channels with respect the Holocene fluvio-deltaic wedge and palaeovalley substrate results in key differences in degree of heterogeneity between upstream and downstream. This delta-scale architectural trend explains the sharp increase in scour hole abundance and coincides with the crossing where modern-day thalweg depths become shallower than the base of the Holocene fluvio-deltaic wedge in downstream direction. Downstream of the crossing, lower deltaic architecture (bottom half of the coastal deltaic wedge; Early to Middle Holocene features; Fig. 1b) provide for alternating resistant and erodible material properties encountered at critical depths near the modern-day channel bottom. Moreover, the characteristics that individual scours attain in the central to lower deltaic reaches are directly affected by planform directional and dimensional properties of the erodible substrate elements (e.g. ribbon-shaped sand bodies). As a consequence of downstream increasing modern-day channel depths and thickening of the fluvio-deltaic wedge, scour holes in central delta branches are mainly related to sandy architectural elements and in lower delta branches to breaches through Early Holocene erosion resistant beds. Upstream of the crossing, upper delta channels are incised in palaeovalley substrate that show less local contrasts in erodibility and consequently the river bed is less susceptible to substrate controlled scour hole formation. Here, scour holes mainly relate to man-made engineering structures and the associated hydraulic effects.
Especially in lower and central deltaic reaches, our explanatory model for linking subsurface architecture to scour hole formation can make scour hole growth more predictable. Moreover, reconstructions of subsurface architecture can help to assess the susceptibility of individual branches to scour hole formation and explain observed scour locations and dimensions which can improve predictions of depths, slopes and dimensions. As many rivers in deltas are experiencing channel bed degradation and incision (Brunier et al., Reference Brunier, Anthony, Goichot, Provansal and Dussouillez2014; Luan et al., Reference Luan, Ding, Wang, Ge and Yang2016; Hoitink et al., Reference Hoitink, Wang, Vermeulen and Kästner2017), it can be expected that the risk of scour hole formation will increase; continued vertical incision may expose deeper lying, erosion susceptible architectural elements. Incorporating not only hydraulic drivers, but subsurface architecture as a major control on scour hole formation can greatly benefit evaluations of the associated risks for destabilisation of channel banks and water defenses. Relations between subsurface architecture and key risk indicators that follow from our statistical analyses, such as scour hole occurrence, depth, slope and dimensions, can set the basis for making such risk estimates.
Conclusion
We created a delta-scale inventory of scour hole locations in the Rhine–Meuse delta and assessed the hydrodynamic conditions, extracted geometric characteristics and determined the architectural elements at scour hole locations to assess the effects of delta-scale geological heterogeneity, related depositional history and local subsurface architecture on scour hole formation.
A 165 scour holes are present in the Rhine–Meuse delta and downstream they are three times more abundant than upstream. Central and lower delta branches have 0.6–0.7 scour holes per km while upper delta branches have less than 0.2 associated with increased heterogeneity of the river bed substrate downstream. Confronting the scour hole dataset with hydrodynamic conditions shows that this alone cannot account for scour hole formation; less than half of the scour holes can be mainly attributed to hydrodynamic conditions. Downstream, 58% of scour holes were related to architectural elements such as former channel-belt or inland dune sand bodies and erosion-resistant beds. Here, scour holes have significantly steeper slopes (p = .04) which is related to a higher proportion of cohesive sediments near the river bed. Scour holes formed in channel belt sand bodies are limited in downstream length when the sand body crosses the present-day river channel perpendicular. Furthermore, these sand bodies significantly affect the depth (p = .01); the sand body dimensions limit deepening to a maximum of approximately two times the water depth.
Our results demonstrate that subsurface architecture acts as a key control for scour hole formation, explaining considerable part of their spatial variability in occurrence and dimensions. Moreover, they allow to build a delta-scale explanatory framework for scour hole formation, linking their occurrence and characteristics to subsurface architecture, that is transferable to other deltas with extensive Holocene deltaic wedge substrates around the world. Mainly for central and lower deltaic river branches the explanatory model can make scour hole formation more predictable. Geological reconstructions allow to identify spatial variability in the susceptibility to local channel bed incision of deltaic regions because of the large implications of the present-day configuration of the delta channel network with respect to antecedent fluvio-deltaic architecture. Incorporating this knowledge is of great benefit for evaluation of the associated risks for destabilisation of channel banks and water defenses.
Supplementary material
For supplementary material accompanying this paper visit https://doi.org/10.1017/njg.2023.5


 Open access