


1. Introduction
Pietrukowicz et al. (Reference Pietrukowicz2017) announced the discovery of a new class of variable stars, the ‘Blue large-amplitude pulsators’ (BLAPs). The non-sinusoidal light variations of the stars have optical amplitudes of a few tenths of a magnitude and periods 20–75 min (e.g., Borowicz et al. Reference Borowicz2023). Temperatures are similar to those of B-type subdwarf (sdB) stars ( $\sim$ $30\,000$
K), but the radii are larger and gravities lower. The stars all seem to be mono-periodic, pulsating in the fundamental radial mode (Pietrukowicz et al. Reference Pietrukowicz2017; Borowicz et al. Reference Borowicz2023).
$30\,000$
K), but the radii are larger and gravities lower. The stars all seem to be mono-periodic, pulsating in the fundamental radial mode (Pietrukowicz et al. Reference Pietrukowicz2017; Borowicz et al. Reference Borowicz2023).
A subgroup of BLAPs, the HG-BLAPs, has higher gravities and commensurately shorter periods (3–8 min – Kupfer et al. Reference Kupfer2019; McWhirter & Lam Reference McWhirter and Lam2022). Along with the shorter periods, the pulsation amplitudes are smaller and the light curves more symmetrical. Evidence which has been presented in support of the hypothesis that this type of pulsator is distinct from the majority of BLAPs is that there appears to be a gap between the two sets of pulsation periods (Xiong et al. Reference Xiong2022; Lin et al. Reference Lin2023). More recently, Kupfer et al. (Reference Kupfer2021) discovered 12 new HG-BLAPs, 4 of which have periods in the range 9–17 mins, which somewhat blurs the distinction. Nonetheless, results of evolutionary population synthesis (Byrne, Stanway, & Eldridge Reference Byrne, Stanway and Eldridge2021) are also consistent with the existence of two groups of BLAPs. Physical properties of HG-BLAPs suggest that these stars are hot subdwarfs (McWhirter & Lam Reference McWhirter and Lam2022).
This paper presents further photometric observations of the HG-BLAP ZTF J071329.02-152125.2, also referred to as HG-BLAP-1 by Kupfer et al. (Reference Kupfer2019). Pertinent information from the latter paper is that the physical properties of the star ( $T_{eff} \sim 33\,000$
K,
$T_{eff} \sim 33\,000$
K, $\log\,g \sim 5.7$
,
$\log\,g \sim 5.7$
, $M_G=5.8$
) are consistent with its being a sdB star. A single pulsation period of 200.20 s, with an amplitude of 54 mmag in the r band and a radial velocity amplitude of 23 km s
$M_G=5.8$
) are consistent with its being a sdB star. A single pulsation period of 200.20 s, with an amplitude of 54 mmag in the r band and a radial velocity amplitude of 23 km s $^{-1}$
, was detected.
$^{-1}$
, was detected.
2. New photometry
All the new measurements were made with the SAAO (South African Astronomical Observatory) SHOC CCD camera mounted on the SAAO 1.0-m telescope at Sutherland, South Africa. The camera operates in frame-transfer mode. Successive sets of observations in B and $R_C$
were obtained during the first night, thereafter only the
$R_C$
were obtained during the first night, thereafter only the $R_C$
filter was used. Pre-binning was changed from
$R_C$
filter was used. Pre-binning was changed from $2 \times 2$
for the first night to
$2 \times 2$
for the first night to $4\times 4$
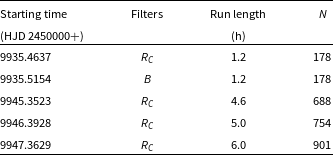
for the remainder. An exposure time of 20 s was used throughout—see Table 1 for an observing log.
$4\times 4$
for the remainder. An exposure time of 20 s was used throughout—see Table 1 for an observing log.
The observing log. All exposures were 20 s in duration.
Photometric reductions were performed using an automated version of DOPHOT (Schechter, Mateo, & Saha Reference Schechter, Mateo and Saha1993). Magnitudes determined from point spread functions were used as these proved less noisy than those from aperture photometry. Differential corrections were applied, using 2–4 bright stars in the $2.9 \times 2.9$
arcmin
$2.9 \times 2.9$
arcmin $^2$
field of view.
$^2$
field of view.
3. Frequency analysis
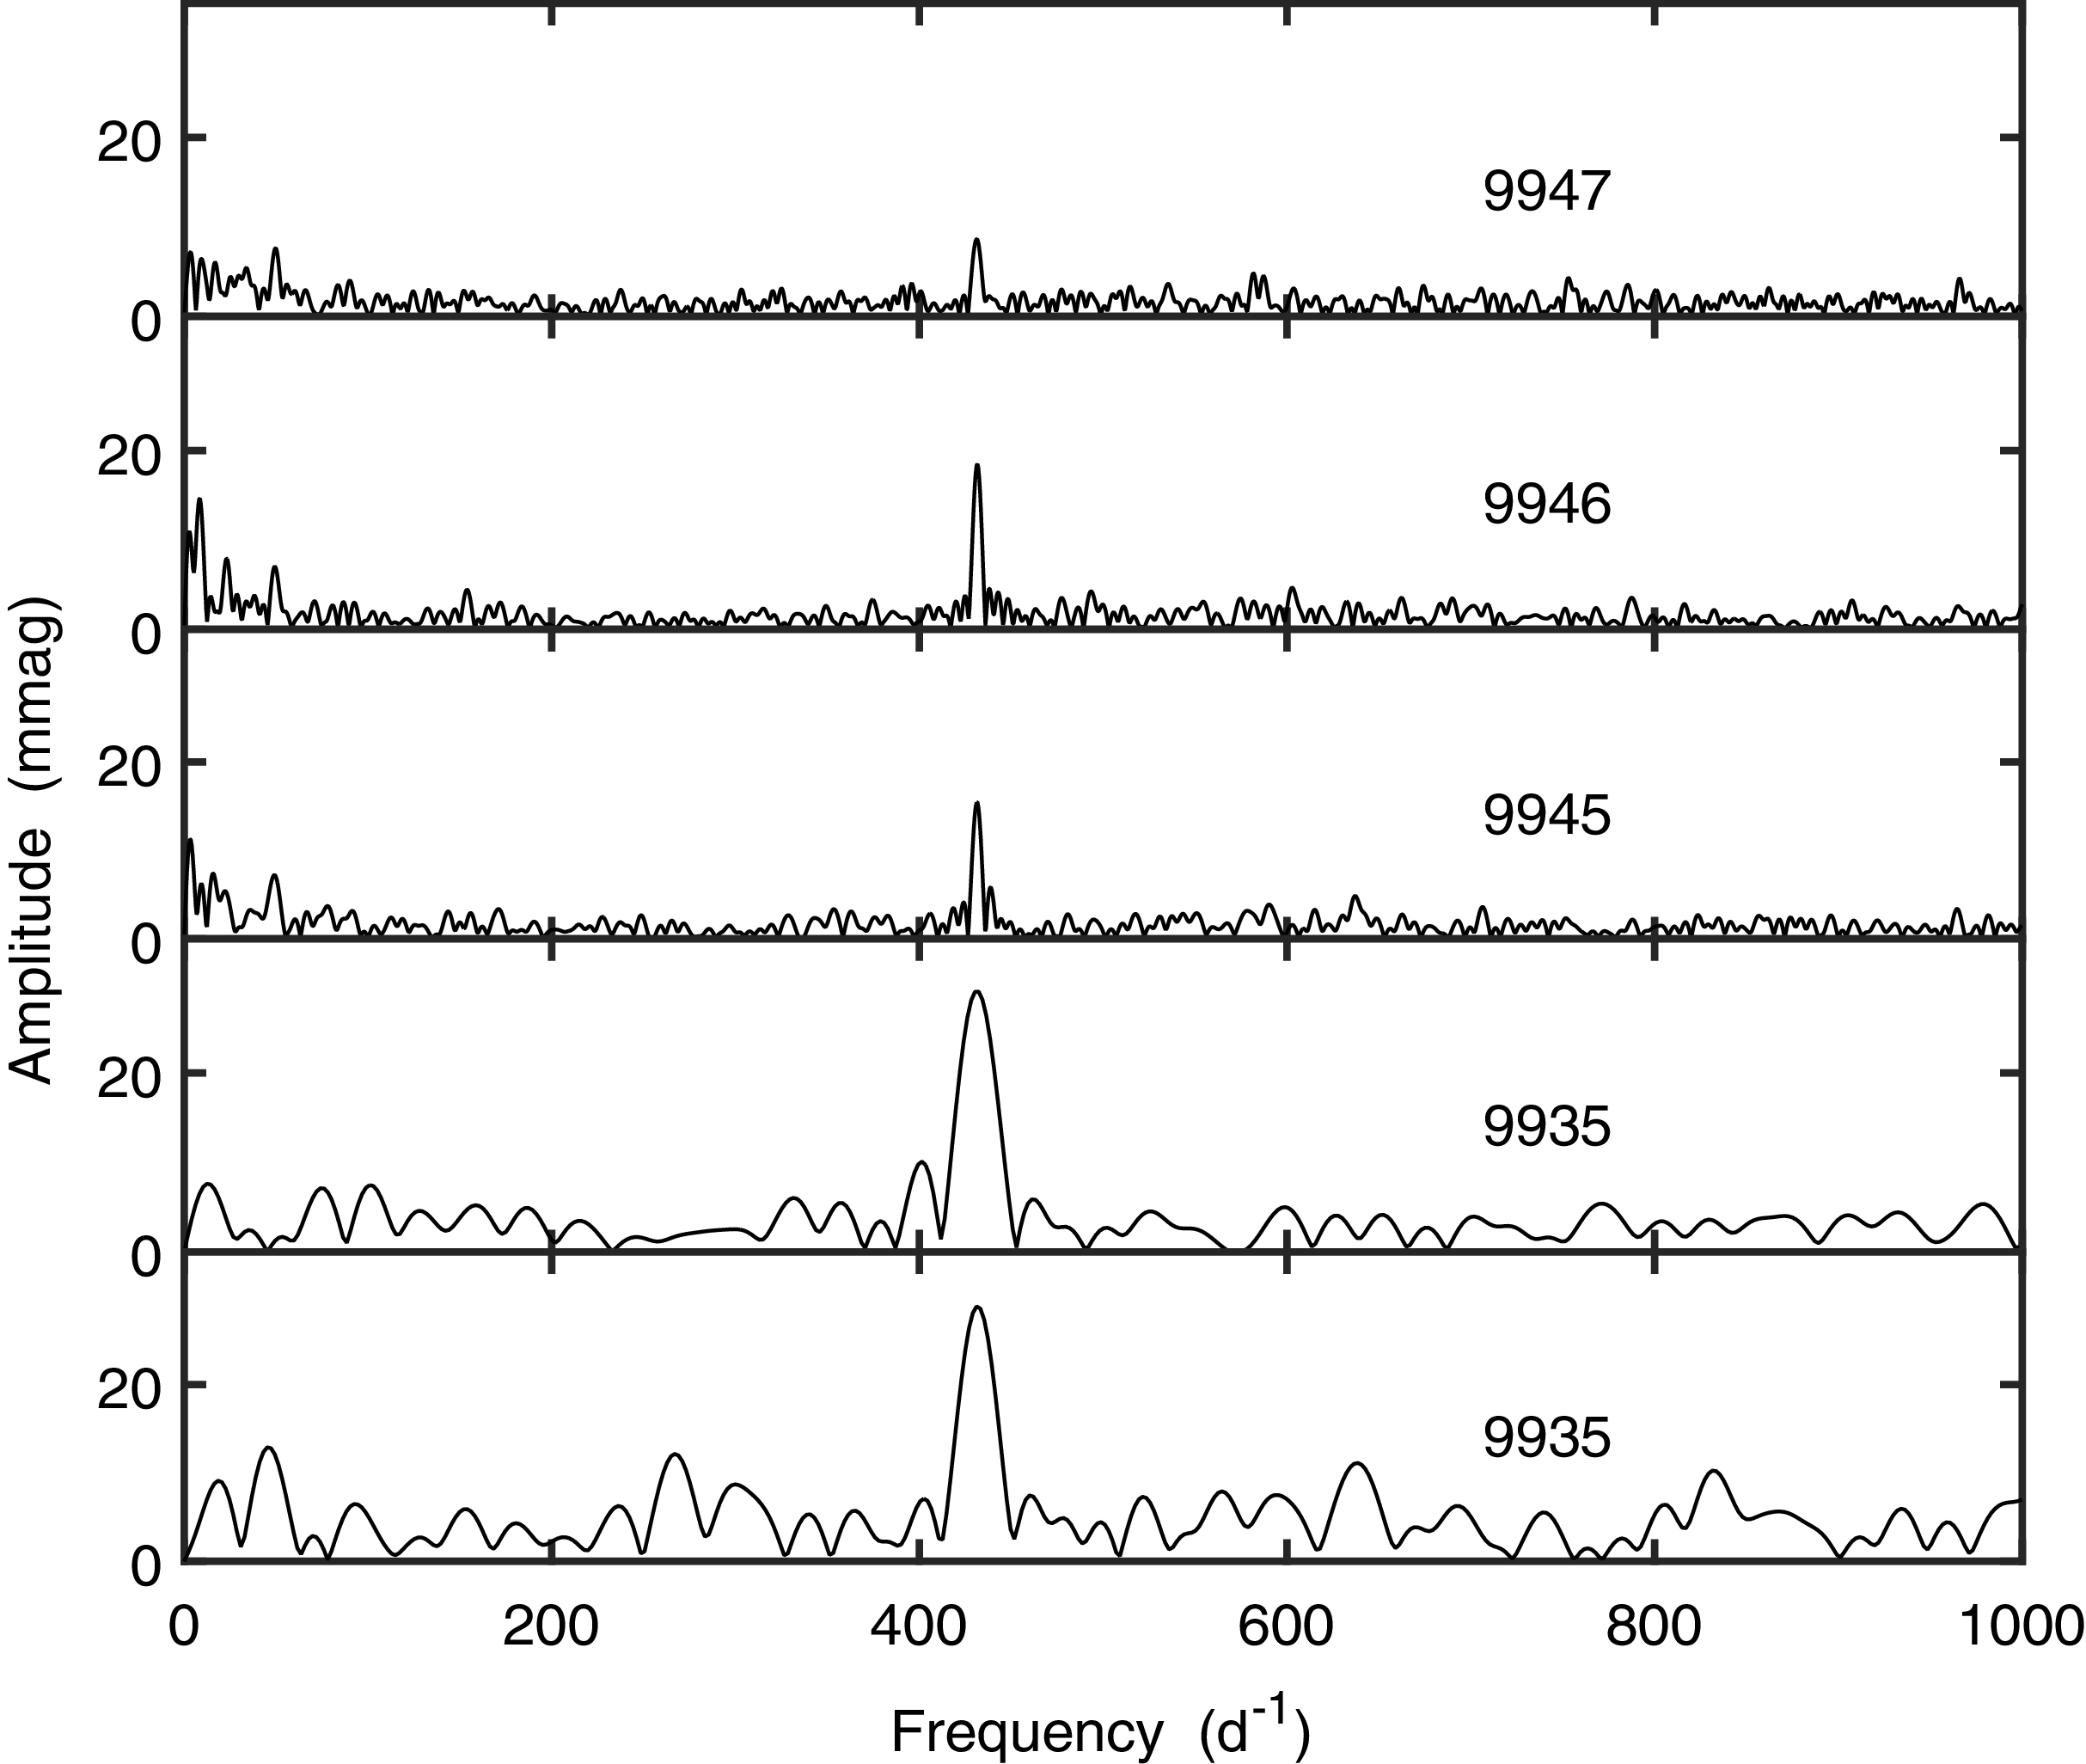
Amplitude spectra of the individual runs in Table 1 are plotted in Fig. 1. The dominant peak is at 431 d $^{-1}$
, as expected. It is immediately apparent though that the amplitude of the variability can change dramatically on a timescale of a day or shorter: from top to bottom, the maxima are 8.6, 18.5, 15.4, 29.1, and 28.8 mmag. It is also interesting that the amplitudes in
$^{-1}$
, as expected. It is immediately apparent though that the amplitude of the variability can change dramatically on a timescale of a day or shorter: from top to bottom, the maxima are 8.6, 18.5, 15.4, 29.1, and 28.8 mmag. It is also interesting that the amplitudes in $R_C$
and B (bottom two panels) are much the same—although it should be said that these two runs were each only 1.2 h in duration.
$R_C$
and B (bottom two panels) are much the same—although it should be said that these two runs were each only 1.2 h in duration.
Amplitude spectra of the five SAAO photometric runs. Panels are labelled with the last four digits of the Julian Date. All observations were made through the $R_C$
filter, except for that giving rise to the bottom spectrum, for which the B filter was used.
$R_C$
filter, except for that giving rise to the bottom spectrum, for which the B filter was used.
The effects of prewhitening the combined last three sets of observations of HG-BLAP-1 near the dominant frequency. Panels are labelled with the number of frequencies near 431 d $^{-1}$
which have been prewhitened. Note the different vertical scales on different panels.
$^{-1}$
which have been prewhitened. Note the different vertical scales on different panels.

The top panel of Fig. 2 shows the amplitude spectrum of the combined last three runs. The three datasets are relatively long and were obtained on successive nights so that aliasing is reasonable—in fact, the 1 d $^{-1}$
aliasing is clearly visible. The second panel demonstrates the effect of subtracting the best-fitting sinusoid with frequency 431.33 d
$^{-1}$
aliasing is clearly visible. The second panel demonstrates the effect of subtracting the best-fitting sinusoid with frequency 431.33 d $^{-1}$
, corresponding to the maximum in the top panel. The outcomes of further rounds of prewhitening can be seen in the other two panels of the figure. It is clear that three sinusoids are required to fully describe the variability around 431 d
$^{-1}$
, corresponding to the maximum in the top panel. The outcomes of further rounds of prewhitening can be seen in the other two panels of the figure. It is clear that three sinusoids are required to fully describe the variability around 431 d $^{-1}$
.
$^{-1}$
.
Frequencies and amplitudes were also estimated from data from two other sources: ATLASFootnote a (‘Asteroid Terrestrial-impact Last Alert System’—Tonry et al. Reference Tonry2018) and ZTFFootnote b (‘Zwicky Transit Facility’—Bellm et al. Reference Bellm2019). Frequencies at which spectra have maxima were identified and then refined by least squares fitting of a sinusoid. Approximate error estimates for the latter procedure are given by:
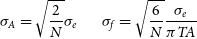 \begin{equation}\sigma_A=\sqrt{\frac{2}{N}} \sigma_e \;\;\;\;\;\;\;\;\sigma_f=\sqrt{\frac{6}{N}}\frac{\sigma_e}{\pi T A}\end{equation}
where $\sigma_A$
and
$\sigma_A$
and $\sigma_f$
are the standard errors on the amplitude A and frequency f, respectively, N and T are the number and the timespan of the observations, respectively, and
$\sigma_f$
are the standard errors on the amplitude A and frequency f, respectively, N and T are the number and the timespan of the observations, respectively, and $\sigma_e$
is the residual standard deviation (Montgomery & O’Donoghue Reference Montgomery and O’Donoghue1999).
$\sigma_e$
is the residual standard deviation (Montgomery & O’Donoghue Reference Montgomery and O’Donoghue1999).
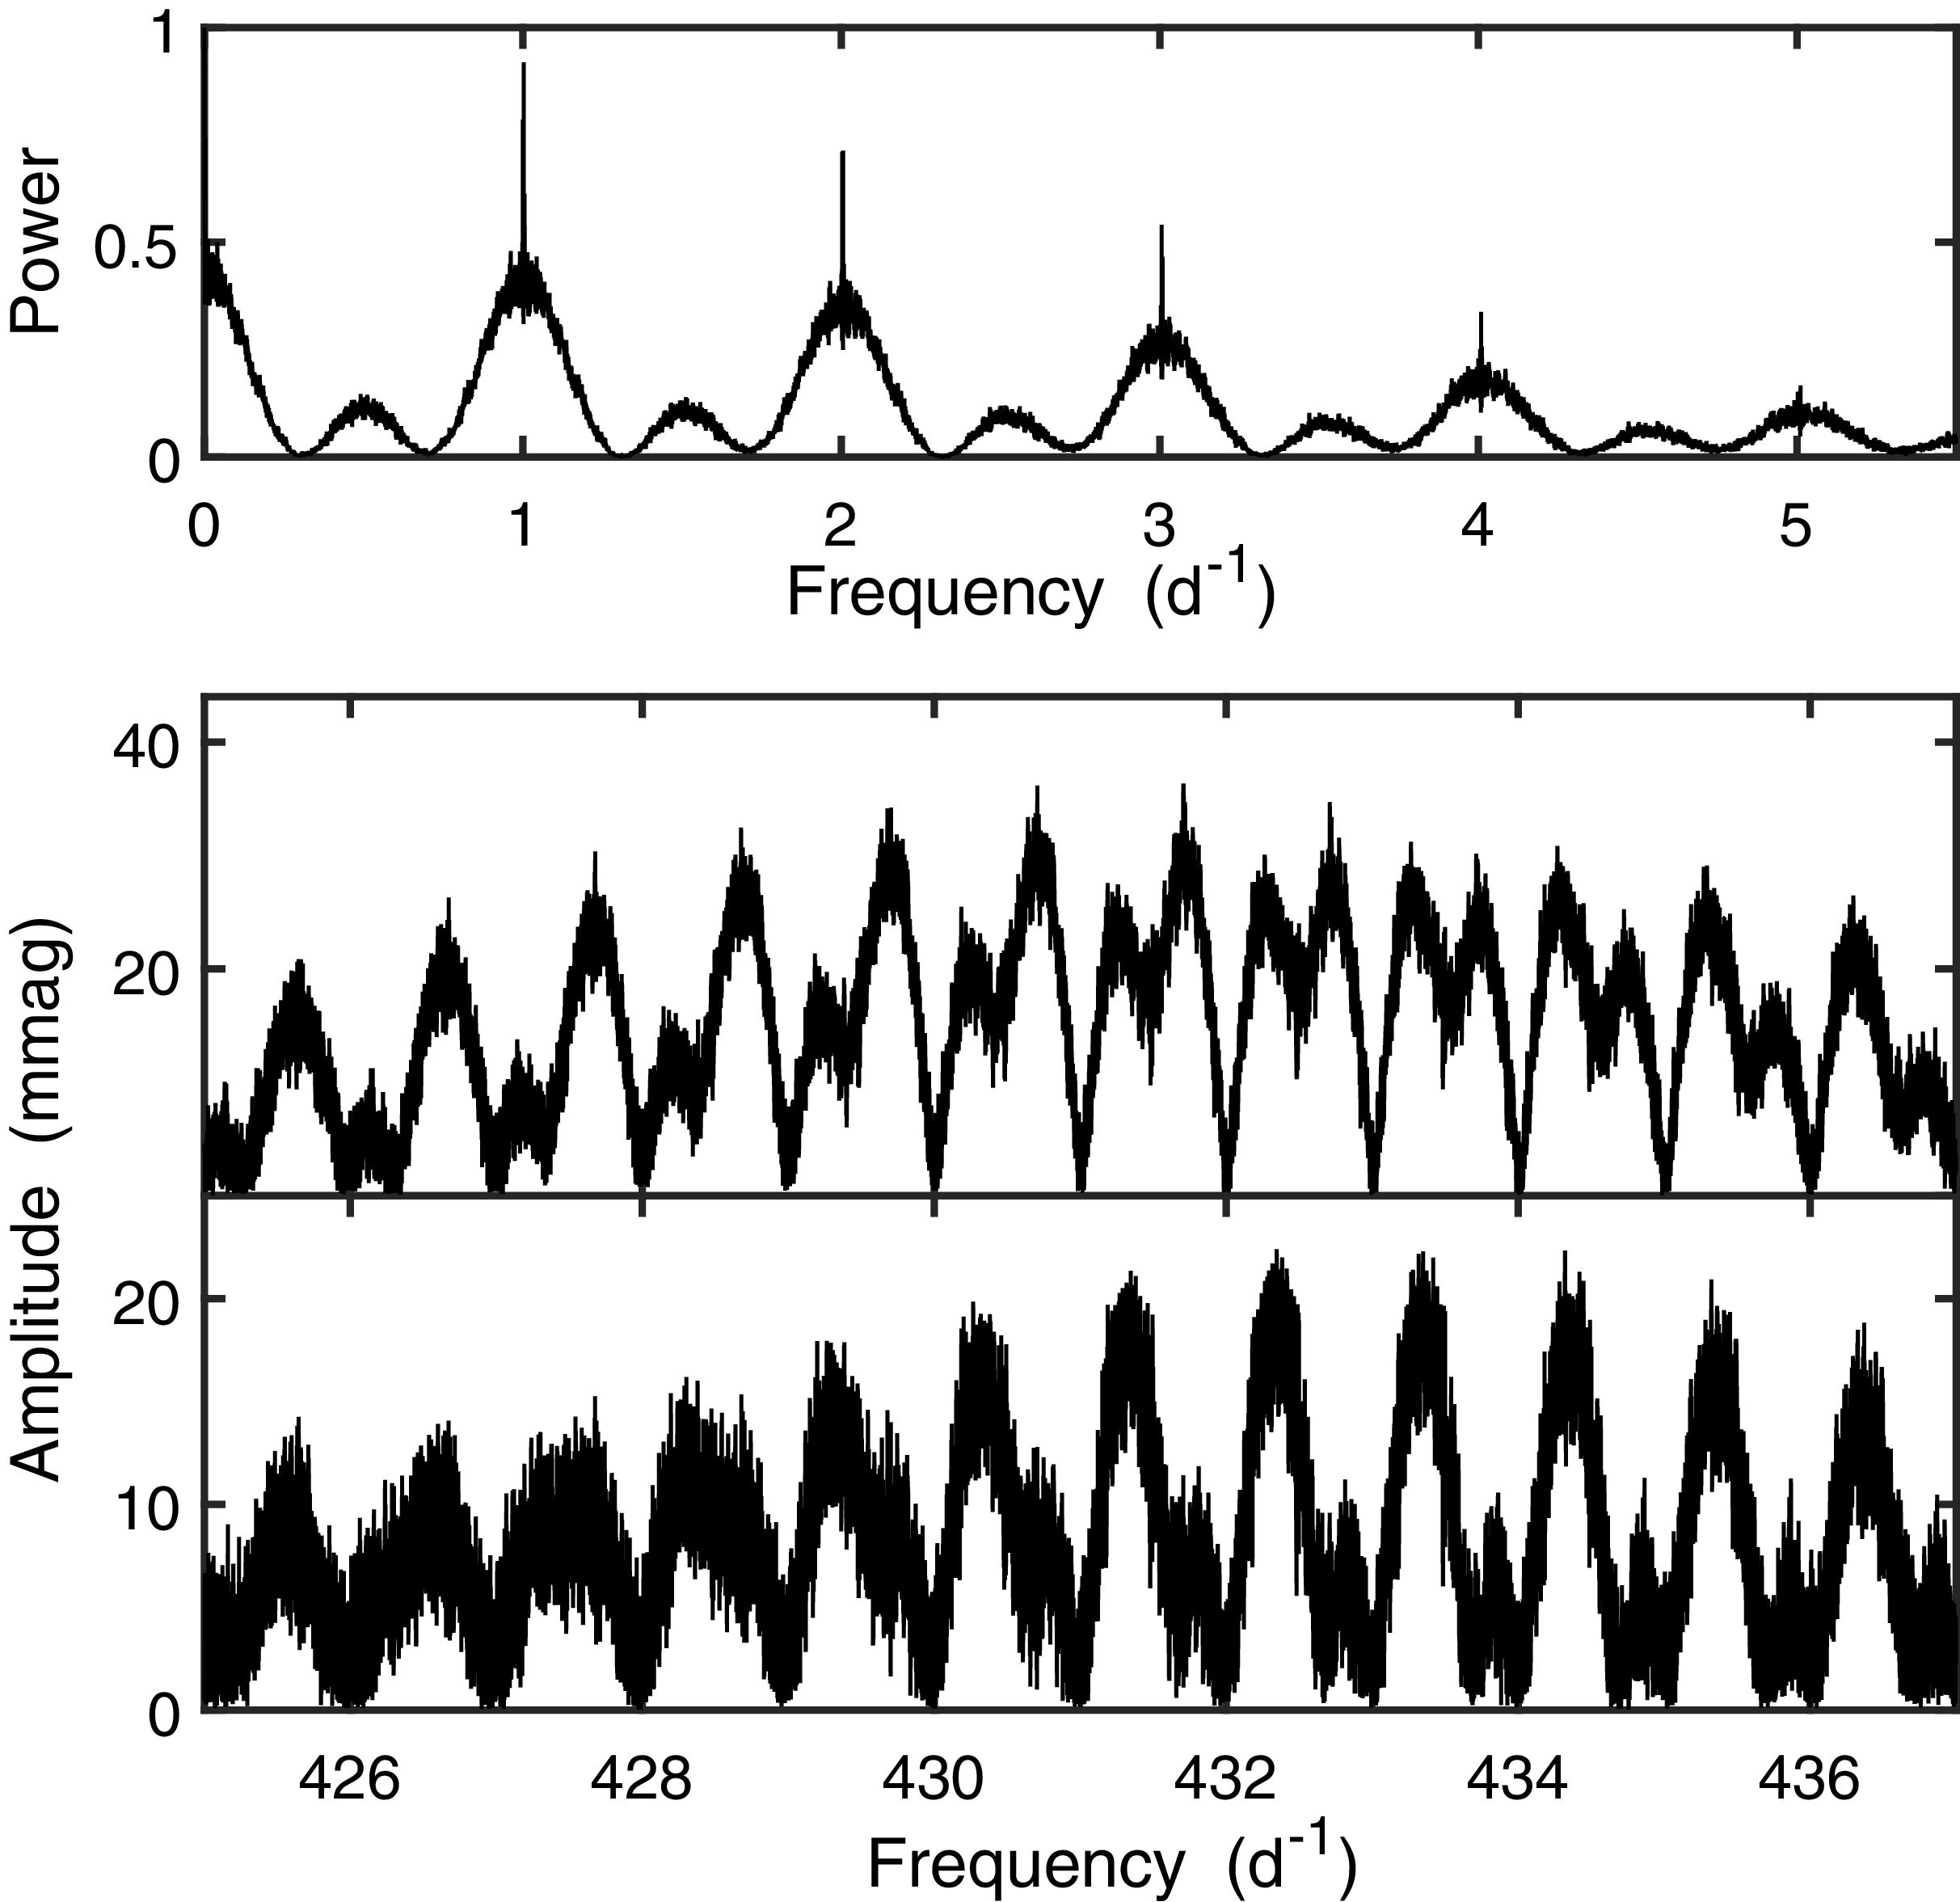
Amplitude spectra of the ATLAS c-filter data are plotted in Fig. 3. Note that after prewhitening the dominant frequency in the raw data, several peaks disappear from the spectrum in the middle panel—notably that at 430.7 d $^{-1}$
—confirming that these are aliases (cf. also the window function in the top panel). The two most prominent peaks in the residual spectrum in the bottom panel are at 431.46 d
$^{-1}$
—confirming that these are aliases (cf. also the window function in the top panel). The two most prominent peaks in the residual spectrum in the bottom panel are at 431.46 d $^{-1}$
and its 1 d
$^{-1}$
and its 1 d $^{-1}$
alias. As in the case of the SAAO data, there is no sign of a peak at the frequency 431.57 d
$^{-1}$
alias. As in the case of the SAAO data, there is no sign of a peak at the frequency 431.57 d $^{-1}$
found by Kupfer et al. (Reference Kupfer2019).
$^{-1}$
found by Kupfer et al. (Reference Kupfer2019).
The window function of the ATLAS c-filter photometry of HG-BLAP-1 (top panel). The middle panel shows the amplitude spectrum of the observations, and bottom panel the residuals after prewhitening the best-fitting sinusoid from the measurements.
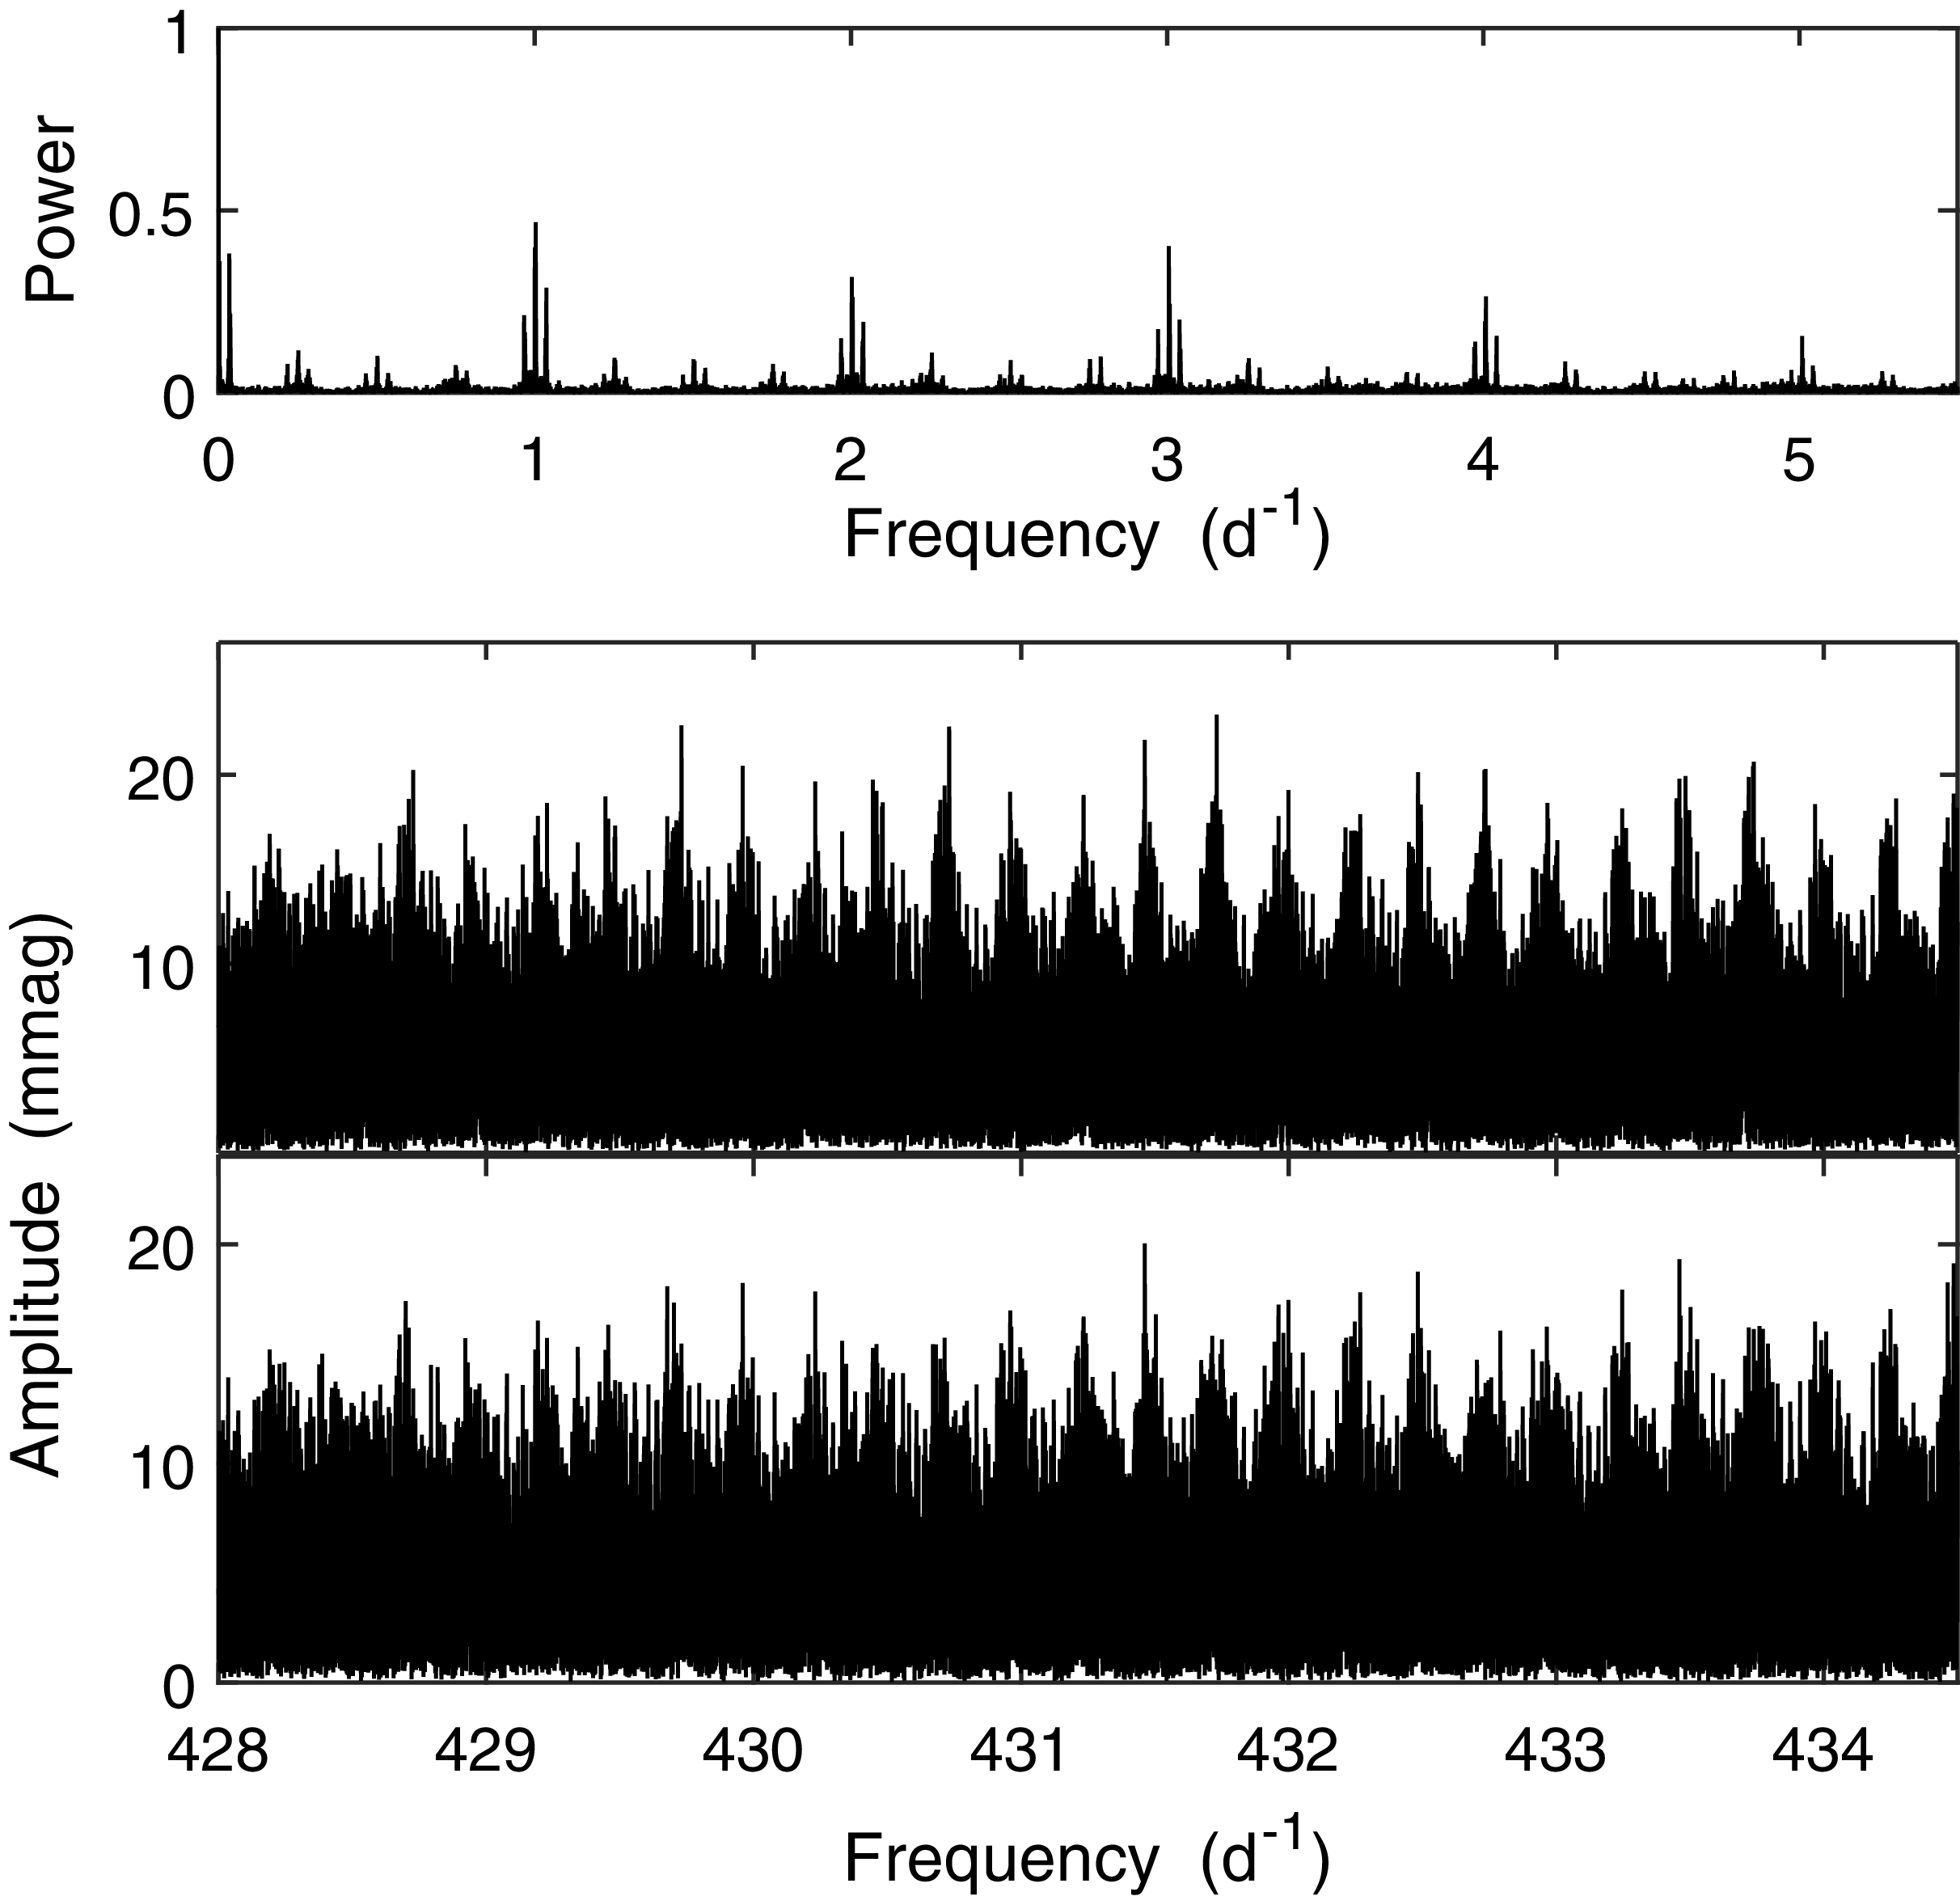
Fig. 4 shows the corresponding ZTF r-filter window function and spectra, which yield yet another set of most prominent frequencies. Spectra of the ATLAS o and ZTF g photometry were also calculated, but neither show a power excess over the region 400–500 d $^{-1}$
.
$^{-1}$
.
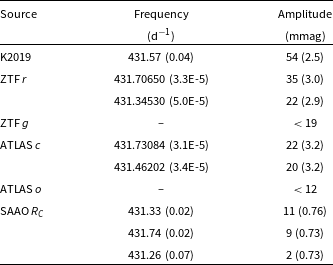
The outcomes of the frequency analyses are summarised in Table 2. The only agreement between results is $f=431.73$
d
$f=431.73$
d $^{-1}$
in the ATLAS c data and the second SAAO frequency of 431.74 d
$^{-1}$
in the ATLAS c data and the second SAAO frequency of 431.74 d $^{-1}$
. From this, it is perhaps more likely that there is no small fixed set of frequencies underlying the radial mode variability in HG-BLAP-1, but perhaps rather that the amplitude of one (or more) modes changes greatly over relatively short timescales.
$^{-1}$
. From this, it is perhaps more likely that there is no small fixed set of frequencies underlying the radial mode variability in HG-BLAP-1, but perhaps rather that the amplitude of one (or more) modes changes greatly over relatively short timescales.
Pulsation frequencies and amplitudes extracted from various datasets. Numbers in the first line (K2019) are from Kupfer et al. (Reference Kupfer2019). The ATLAS o (orange) and c (cyan) filters have bandpasses of 560–820 and 420–650 nm, respectively.
As for Fig. 3, but for the ZTF r-filter data. Note the different vertical scales on different panels.
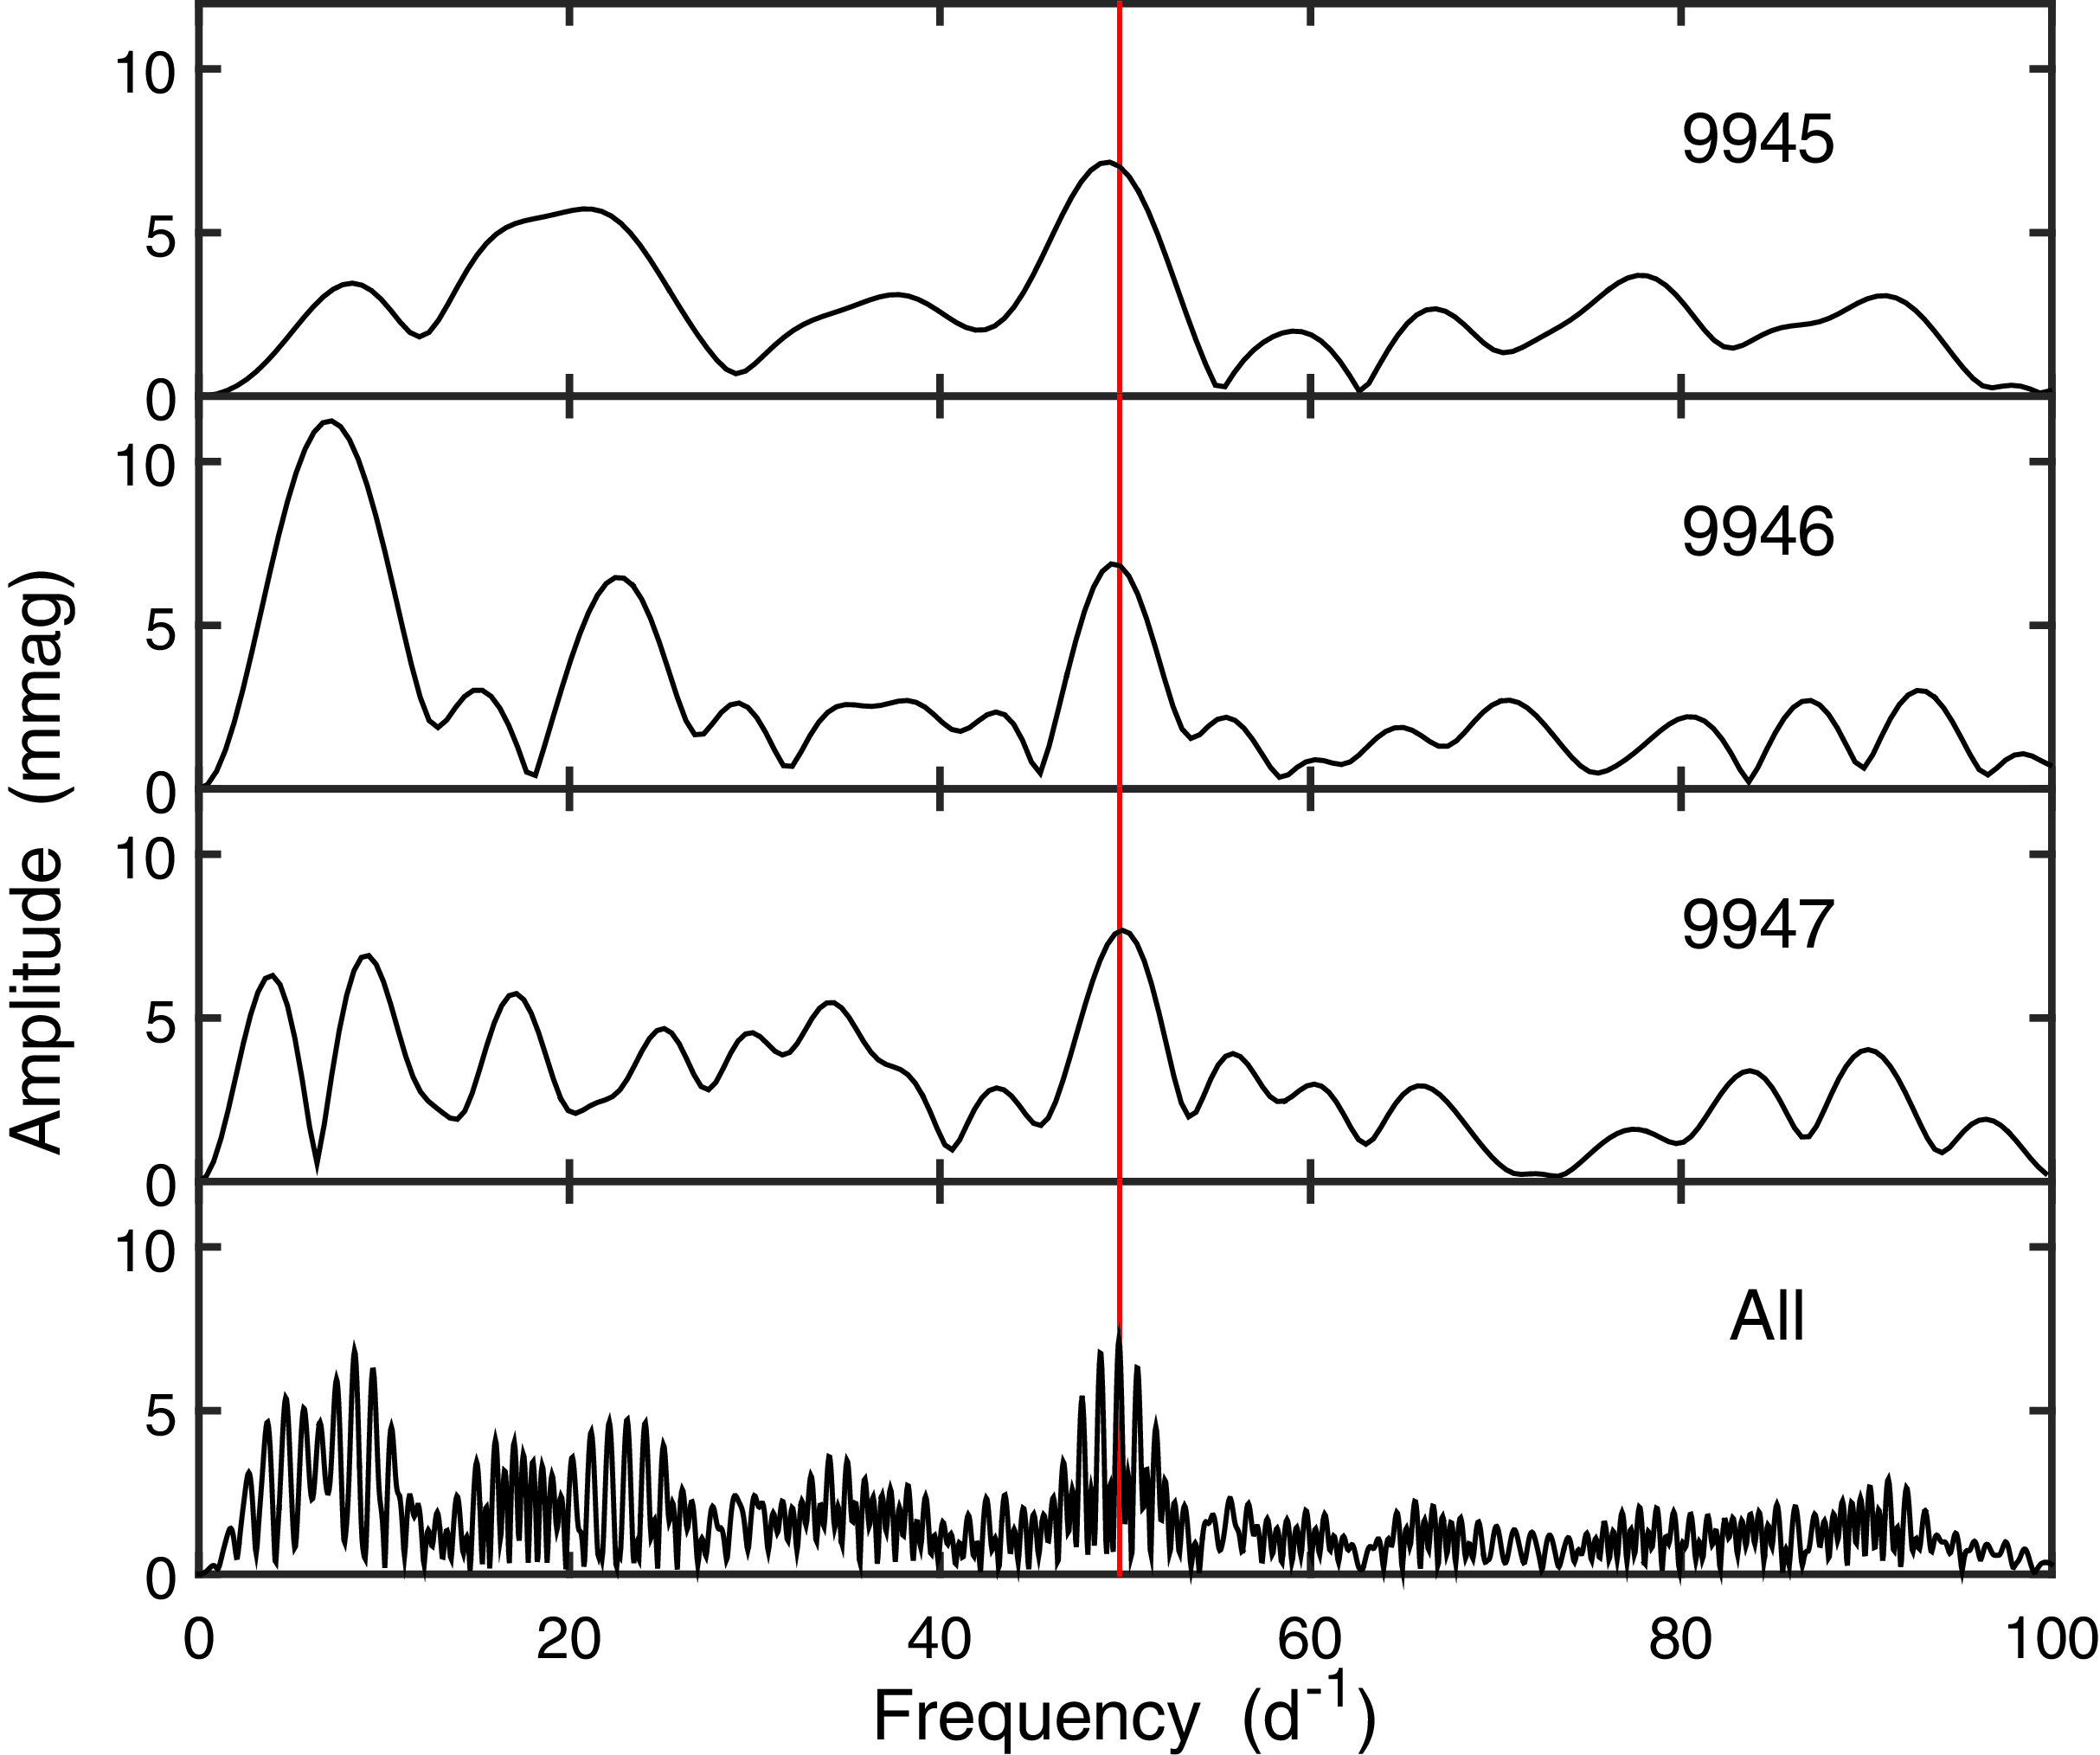
It is evident from a comparison of Figs. 1 and 2 on the one hand, with Figs. 3 and 4 on the other, that the noise levels of the SAAO photometry are far lower than those from the large surveys. This is exploited to study possible low-amplitude variability at low frequencies. Inspection of Fig. 1 reveals a weak feature near 50 d $^{-1}$
in all three of the top spectra. This is shown in more detail in the top three panels of Fig. 5. There is indeed very good agreement between the three spectra near this frequency: from top to bottom, maxima are at
$^{-1}$
in all three of the top spectra. This is shown in more detail in the top three panels of Fig. 5. There is indeed very good agreement between the three spectra near this frequency: from top to bottom, maxima are at $49.2\pm 0.5$
,
$49.2\pm 0.5$
, $49.5 \pm 0.5$
and
$49.5 \pm 0.5$
and $49.8 \pm 0.4$
d
$49.8 \pm 0.4$
d $^{-1}$
, where the errors are from Equation (1). The corresponding amplitudes are 7.1, 6.7, and 7.7 mmag, all with standard errors of 1.3 mmag. Combining the three datasets (bottom panel of Fig. 5) gives a best-fitting frequency of
$^{-1}$
, where the errors are from Equation (1). The corresponding amplitudes are 7.1, 6.7, and 7.7 mmag, all with standard errors of 1.3 mmag. Combining the three datasets (bottom panel of Fig. 5) gives a best-fitting frequency of $49.66 \pm 0.03$
d
$49.66 \pm 0.03$
d $^{-1}$
, with an amplitude of
$^{-1}$
, with an amplitude of $7.2 \pm 0.75$
millimag. Prewhitening this from the combined data leaves no trace of any power excess.
$7.2 \pm 0.75$
millimag. Prewhitening this from the combined data leaves no trace of any power excess.
Low-frequency amplitude spectra of the three longest runs, individually (top three panels) and combined (bottom panel). The data were preprocessed by removal of linear trends. The red vertical line is drawn at the frequency of maximum power in the combined data.
Although it is possible to formally test that the agreement between the dominant frequencies of the three spectra in Fig. 5 is not due to chance (Koen Reference Koen2020), this seems unnecessary given the excellent agreement between both frequencies and amplitudes. There is, however, some food for thought: if it is indeed a permanent feature of the variability of HG-BLAP-1, then it is surprising that there is no excess power near this frequency in the first $R_C$
run (amplitude spectrum in the second from bottom panel in Fig. 1). Interestingly, it does seem present in the B-filter data from the first night (frequency
$R_C$
run (amplitude spectrum in the second from bottom panel in Fig. 1). Interestingly, it does seem present in the B-filter data from the first night (frequency $46.1 \pm 3.8$
d
$46.1 \pm 3.8$
d $^{-1}$
), but at larger amplitude (
$^{-1}$
), but at larger amplitude ( $12 \pm 4$
mmag).
$12 \pm 4$
mmag).
Given the short duration of the runs on JD 2459935, the amplitude uncertainty is considerable, so it is conceivable that the non-detection is still consistent with the low amplitude seen in $R_C$
on other nights. Simulation experiments were conducted, assuming a sinusoid with frequency 49.7 d
$R_C$
on other nights. Simulation experiments were conducted, assuming a sinusoid with frequency 49.7 d $^{-1}$
and amplitude 7 mmag, with noise drawn randomly from the observed residuals from that night. The results are that 11% of the time the periodogram maximum is not in the frequency range 40–60 d
$^{-1}$
and amplitude 7 mmag, with noise drawn randomly from the observed residuals from that night. The results are that 11% of the time the periodogram maximum is not in the frequency range 40–60 d $^{-1}$
; 9% of simulated maxima were outside the range 35–65 d
$^{-1}$
; 9% of simulated maxima were outside the range 35–65 d $^{-1}$
.
$^{-1}$
.
The period ( $29.00 \pm 0.015$
min) falls in the range spanned by slowly pulsating, or V1093 Her type, sdB stars (e.g., Romero Reference Romero, Kraus and Torres2021). These generally have lower temperatures than the faster p-mode pulsators, but recently a number of hybrid (p-mode and g-mode) pulsating hot subdwarfs with high temperatures have been discovered (e.g., Baran et al. Reference Baran2023).
$29.00 \pm 0.015$
min) falls in the range spanned by slowly pulsating, or V1093 Her type, sdB stars (e.g., Romero Reference Romero, Kraus and Torres2021). These generally have lower temperatures than the faster p-mode pulsators, but recently a number of hybrid (p-mode and g-mode) pulsating hot subdwarfs with high temperatures have been discovered (e.g., Baran et al. Reference Baran2023).
4. Discussion
The only BLAP for which secondary periodicities have been described in the literature is HD 133729. Pigulski, Kotysz, & Kołaczek-Szymánski (Reference Pigulski and Kotysz2022) analysed TESS (Ricker et al. Reference Ricker2015) photometry of the star and found very low-amplitude variations with periods 0.4298, 0.4371,0.4458, and 0.4524 d in addition to the BLAP period of 32.37 min. Given that the star is a binary with a main sequence B star primary, it is conceivable that the secondary periodicities are associated with the latter star. Deliberate searches for additional periods have led to the conclusion that BLAPs are mono-periodic (McWhirter, Lam & Steele Reference McWhirter, Lam and Steele2020).
Two different models for BLAPs have been proposed—either a He-burning core with a mass $\sim$ $1\,{\rm M}_\odot$
or a
$1\,{\rm M}_\odot$
or a $\sim$ $0.3\,{\rm M}_\odot$
He core with a hydrogen burning burning shell (Pietrukowicz et al. Reference Pietrukowicz2017; Romero et al. Reference Romero, Córsico, Althaus, Pelisoli and Kepler2018; Byrne & Jeffery 2018; Xiong et al. Reference Xiong2022). Kupfer et al. (Reference Kupfer2019) favour the second of these for the HG-BLAP stars. The addition of the low-frequency variation described in the previous section, which could be due to gravity-driven pulsation, could place additional constraints on the nature of the HG-BLAP-1.
$0.3\,{\rm M}_\odot$
He core with a hydrogen burning burning shell (Pietrukowicz et al. Reference Pietrukowicz2017; Romero et al. Reference Romero, Córsico, Althaus, Pelisoli and Kepler2018; Byrne & Jeffery 2018; Xiong et al. Reference Xiong2022). Kupfer et al. (Reference Kupfer2019) favour the second of these for the HG-BLAP stars. The addition of the low-frequency variation described in the previous section, which could be due to gravity-driven pulsation, could place additional constraints on the nature of the HG-BLAP-1.
Two final remarks: first, a number of authors have derived period changes in BLAPs from photometry (Pietrukowicz et al. Reference Pietrukowicz2017; Lin et al. Reference Lin2023; Pigulski, Kotysz, & Kołaczek-Szymánski Reference Pigulski and Kotysz2022). Should other members of this class of variables also show changing frequency content in the brightness variations, such calculations will need to be done with caution. At the least, it will clearly be worthwhile to revisit known BLAPs with extended photometric runs in order to establish whether the discovery variability is stable. Second, the low amplitudes found here (particularly 8.6 mmag on JD 2459947) also implies that BLAPs may be much more common than has been surmised by, for example, Pietrukowicz et al. (Reference Pietrukowicz2017), McWhirter & Lam (Reference McWhirter and Lam2022), and Xiong et al. (Reference Xiong2022). At such low amplitudes, the distinction between high-gravity BLAPs and rapidly pulsating sdB stars (Kilkenny et al. Reference Kilkenny, Koen, O’Donoghue and Stobie1997) is blurred. Absent the observations presented by Kupfer et al. (Reference Kupfer2019), HG-BLAP-1 would probably have been classified as a hybrid pressure mode/gravity mode pulsating sdB star(e.g., Reed et al. Reference Reed, Slayton, Baran, Telting, Østensen, Jeffery, Uzundag and Sanjayan2021).
Of course, it is also possible that the star is unique, and that the observations presented here shed no further light on the class properties of BLAPs.
Acknowledgements
Allocation of telescope time by the South African Astronomical Observatory and the smooth operation of the equipment are gratefully acknowledged. This research has made use of the Simbad database at CDS, Strasbourg, France, and the NASA/IPAC general catalogue query engine. The author is grateful for the public availability of the ZTF and ATLAS photometry.
Data availability
SAAO photometry is available from the author of this paper; other observations were downloaded from the websites mentioned.


 Open access