


Introduction
Personal network analysis addresses the patterns of relationships established between social actors. A personal network is made up of the set of contacts or alters with which a focal actor, referred to as the ego, is connected, as well as the existing ties between ego and alters, and the ties among alters (McCarty et al., Reference McCarty, Lubbers, Vacca and Molina2019). Both individual attributes (Kalish & Robins, Reference Kalish and Robins2006; Maya-Jariego et al., Reference Maya-Jariego, Letina and González-Tinoco2020) and contextual factors such as culture and the various relational settings that people frequent (Grossetti, Reference Grossetti2005) shape unique personal networks. These networks can be described in terms of their composition and structure. Compositional measures typically capture information about who is in the network, such as the attributes of alters (e.g., gender, age, or place of residence). In contrast, structural measures focus on how these alters are interconnected and how ties are distributed within the network (McCarty et al., Reference McCarty, Lubbers, Vacca and Molina2019). For example, structural metrics include measures of tie density and centrality, which indicate the prominence of alters within the network. In his thorough examination of the social network literature, Kadushin (Reference Kadushin2011) emphasized the importance of integrating psychological and sociological perspectives to gain a deeper understanding of social networks. Building on this idea, previous research has primarily focused on the structure of personal networks and has examined how it relates to personality traits, locus of control, self-monitoring, and other psychological attributes (Kalish & Robins, Reference Kalish and Robins2006; Orchard et al., Reference Orchard, Fullwood, Galbraith and Morris2014).
In that line of research, the Big Five model is often used. It is a global benchmark for personality assessment (Costa & McCrae, Reference Costa and McCrae1985) and as such has often been used in research examining associations between personal or sociocentric network measures and individual psychological differences (Waqas et al., Reference Waqas, Zhang, Laghari, Almadhor, Petrinec, Iqbal and Khalil2025). According to this model, human personality can be described in terms of five major factors, forming patterns of thinking, feeling, and behavior that remain relatively stable over time and consistent across situations, contexts, and cultures. Importantly, these broad factors are hierarchically structured and can be further decomposed into more specific facets, which may provide a more fine-grained understanding of individual differences in social network structure and dynamics. These traits are (1) neuroticism or emotional instability, which is defined by a tendency to evaluate experiences negatively and a greater propensity for dysphoria; (2) extraversion, characterized by sociability as well as higher levels of activity, energy, and dynamism, and a tendency to seek social stimulation; (3) agreeableness, connected to prosociality; (4) openness to experience, defined by an orientation toward change and novelty; and (5) conscientiousness, characterized by an achievement and task orientation. In this sense, considering both the higher-order domains and their underlying facets may be particularly relevant when examining how personality relates to the size, composition, and quality of social ties. Numerous studies have indicated that individual differences are associated with the number and quality of friendly relationships (Asendorpf & Wilpers, Reference Asendorpf and Wilpers1998; Creed & Funder, Reference Creed and Funder1998; Doeven-Eggens et al., Reference Doeven-Eggens, De Fruyt, Jolijn Hendriks, Bosker and Van der Werf2008; Kang, Reference Kang2023; Körner & Altmann, Reference Körner and Altmann2023; Wagner et al., Reference Wagner, Lüdtke, Roberts and Trautwein2014; Wrzus et al., Reference Wrzus, Zimmermann, Mund, Neyer, Hojjat and Moyer2017; Zhu et al., Reference Zhu, Woo, Porter and Brzezinski2013). Specifically, previous research suggests that personality traits may be differentially associated with basic network properties (e.g., size), compositional aspects of personal networks (e.g., proportion of kin or friends), and structural properties (e.g., density, centrality, or clustering), with traits such as extraversion and agreeableness more consistently linked to larger and more socially active networks, and conscientiousness or neuroticism showing more nuanced associations with network structure (Kalish & Robins, Reference Kalish and Robins2006; Pollet et al., Reference Pollet, Roberts and Dunbar2011; Wrzus et al., Reference Wrzus, Zimmermann, Mund, Neyer, Hojjat and Moyer2017).
Despite extensive research on social networks, comparatively less attention has been given to individual differences that may be particularly relevant for network-related measures, such as the relationship between attachment styles and network structure (Bouchard & Maya-Jariego, Reference Bouchard and Maya-Jariego2019; Dizdari & Seiler, Reference Dizdari and Seiler2020; Gillath et al., Reference Gillath, Johnson, Selcuk and Teel2011, Reference Gillath, Karantzas and Selcuk2017, Reference Gillath, Karantzas and Lee2019; Gillath & Karantzas, Reference Gillath, Karantzas, Zayas and Hazan2015; Lee & Gillath, Reference Lee and Gillath2016; Webster et al., Reference Webster, Gesselman and Crosier2016). Attachment theory offers a robust framework for understanding human affectivity from a relational perspective. According to Bowlby (Reference Bowlby1969), attachment emerges from an instinctive system with a survival function, in which children internalize early interactions with caregivers as internal working models, that is, beliefs about the self and others. Sensitive caregiving fosters a secure base, enabling exploration and emotional regulation. Attachment styles established in infancy tend to remain stable across the lifespan, influencing emotion regulation and the formation of adult relationships (Cassidy & Shaver, Reference Cassidy and Shaver2017; Gillath et al., Reference Gillath, Karantzas and Fraley2016; Kafetsios & Nezlek, Reference Kafetsios and Nezlek2002; Kahn & Antonucci, Reference Kahn, Antonucci, Baltes and Brim1980; Mikulincer & Shaver, Reference Mikulincer and Shaver2016; Saltman, Reference Saltman2016). Integrating these insights with social network research, which examines relationships among social entities and, specifically, an individual’s personal network, provides a theoretically grounded framework for understanding tie formation and relational patterns.
Among the various frameworks developed for the assessment of adult attachment, the model proposed by Bartholomew and Horowitz (Reference Bartholomew and Horowitz1991) was historically significant for its integrative nature, bridging traditional typological perspective (Hazan & Shaver, Reference Hazan and Shaver1987; Ravitz et al., Reference Ravitz, Maunder, Hunter, Sthankiya and Lancee2010; Steele & Steele, Reference Steele, Steele, Thompson, Simpson and Berlin2021) and dimensional approaches (Fraley et al., Reference Fraley, Hudson, Heffernan and Segal2015; Fraley & Waller, Reference Fraley, Waller, Simpson and Rholes1998; Raby et al., Reference Raby, Fraley, Roisman, Thompson, Simpson and Berlin2021). However, contemporary research largely favours a two-dimensional approach to adult attachment (typically anxiety and avoidance) reflecting the resolution of the typological versus dimensional debate and the shift to continuous measures, mainly after the year 2000 (Fraley & Shaver, Reference Fraley, Shaver, John and Robins2021). Thus, while the four-category Bartholomew and Horowitz model remains conceptually influential, this study adopts a dimensional perspective compatible with current empirical practice.
Different adult attachment styles have been identified as a function of (a) positive or negative perceptions of self and others and (b) the levels of avoidance and anxiety present in interpersonal relationships (Bartholomew & Horowitz, Reference Bartholomew and Horowitz1991). Broadly, a distinction is made between secure attachment, which involves a positive model of self and others, and a sense of affective security and comfort in relationships, and three insecure attachment styles: (1) preoccupied attachment, characterized by a positive model of others but a negative view of oneself, emotional dependence, a need for approval, fear of rejection, high anxiety, and low social avoidance; (2) fearful attachment, defined by negative models of both self and others, coupled with a desire for but fear of emotional intimacy, high anxiety, and high social avoidance; and (3) avoidant (or distant) attachment, marked by a positive self-model but a negative view of others, excessive emotional self-sufficiency and discomfort with intimacy.
Previous research indicates that attachment styles are important predictors of how emotions are experienced in relationships (Gillath et al., Reference Gillath, Karantzas and Fraley2016; Kafetsios & Nezlek, Reference Kafetsios and Nezlek2002; Simpson et al., Reference Simpson, Rholes and Nelligan1992), the quality (Hazan & Shaver, Reference Hazan and Shaver1994) and stability (Gillath et al., Reference Gillath, Johnson, Selcuk and Teel2011; Gillath et al., Reference Gillath, Karantzas and Selcuk2017; Kirkpatrick & Davis, Reference Kirkpatrick and Davis1994; Lee & Gillath, Reference Lee and Gillath2016) of social ties, satisfaction with received social support (Collins & Feeney, Reference Collins and Feeney2004), an individual’s overall social functioning (Elicker et al., Reference Elicker, Englund, Sroufe, Parke and Ladd1992; Fraley & Shaver, Reference Fraley, Shaver, John and Robins2021; Gillath et al., Reference Gillath, Karantzas and Fraley2016), and even different profiles of interpersonal problems (Collins & Read, Reference Collins and Read1990; Kobak & Sceery, Reference Kobak and Sceery1988) and psychopathologies (Mikulincer & Shaver, Reference Mikulincer and Shaver2016; Rholes et al., Reference Rholes, Simpson, Kohn, Wilson, Martin, Tran and Kashy2011).
Different attachment styles may serve as one of the key mechanisms underlying individual differences in the structural characteristics of personal networks. Attachment theory aligns closely with the use of structural network measures, as both focus on the nature and dynamics of connections to others, rather than on the attributes or properties of the individuals within those networks.
Overview of this study
Previous literature shows that attachment style is a reliable predictor of the type of social expectations and experiences individuals develop in adulthood, playing a crucial role in the establishment of close, satisfying, and lasting relationships (Cassidy & Shaver, Reference Cassidy and Shaver2017; Mikulincer & Shaver, Reference Mikulincer and Shaver2016). On the other hand, some research points to a small-to-moderate contribution of the Big Five model to the way networks are structured, mostly based on cross-sectional studies (see review by Selden & Goodie, Reference Selden and Goodie2018).
In this paper, we explore the connection between the Big Five personality traits, adult attachment styles, and the structure of the individual interpersonal environment using personal network typologies. Personal network typologies can be defined as configurations or profiles of networks that group individuals according to shared patterns across multiple structural and compositional indicators and, consistent with previous studies (Maya-Jariego, Reference Maya-Jariego2021), are empirically derived from the data. Typologies enable us to systematically describe and compare personal networks by identifying covariations between sets of network characteristics based on a series of indicators or criterion variables (Maya-Jariego, Reference Maya-Jariego2021). This consideration of indicators in an aggregated view provides an advantage over the study of isolated indicators, as it allows for a more comprehensive investigation of the personal network structure rather than focusing on a few structural metrics (Maya-Jariego, Reference Maya-Jariego2022), which are also usually inherently interdependent.
Therefore, to investigate the relationship between personal network typology and psychological individual differences, firstly we need to address the clustering patterns of personal networks based on their network characteristics, represented by a range of network metrics. This initial analysis should provide valuable information about the inherent structural variations among personal networks. The proposal of typologies sheds light on the dimensions of interindividual variability that underlie the configuration of personal networks, making some types more frequent than others. Different configurations of personal networks correspond to the distinct ways people engage with and sustain relationships. Simultaneously, it facilitates an overview of the relational structure and its characteristics.
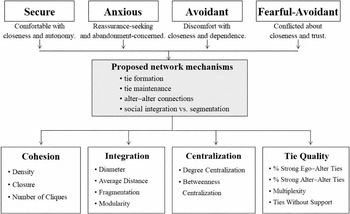
We hypothesize that attachment styles are more strongly associated with the typology of personal networks than the Big Five personality traits. This expectation is grounded in the idea that attachment orientations directly shape individuals’ relational goals, expectations, and emotion-regulation strategies in close relationships, which in turn influence how social ties are initiated, maintained, and organized over time. In contrast, the Big Five traits capture broad, decontextualized tendencies that are less directly linked to the formation and structuring of personal relationships. Accordingly, we expect attachment styles to explain a greater proportion of variance in personal network typologies than the Big Five personality traits. Furthermore, we anticipate that attachment styles will remain significant predictors of different personal network types even when controlling for the Big Five traits and sociodemographic variables. However, we treat the specific associations between individual attachment styles and particular structural properties of personal networks as exploratory and therefore do not advance precise predictions at this level. Figure 1 schematically presents the types of attachment analyzed and the relational mechanisms through which they may shape the structural properties of personal networks. The complete representation of the central hypothesis underlying this framework is provided in the Supplementary Appendix (Figure A.1).
Attachment types, relational mechanisms, and the structural properties of personal networks. We hypothesize that different attachment types shape relational mechanisms involved in relationship formation, tie maintenance, and processes of relational segregation and integration, among others. These mechanisms, in turn, are expected to be reflected in the structural properties of personal networks, as captured by indicators of structural cohesion, relational integration, centralization, and relationship quality.

Figure 1. Long description
The flowchart is organized into three vertical levels connected by downward-pointing arrows.
At the top level, four attachment types are listed from left to right:
* Secure: Comfortable with closeness and autonomy.
* Anxious: Reassurance-seeking and abandonment-concerned.
* Avoidant: Discomfort with closeness and dependence.
* Fearful-Avoidant: Conflicted about closeness and trust.
Arrows from these four boxes converge into a single central box titled Proposed network mechanisms, which contains a bulleted list:
* tie formation
* tie maintenance
* alter–alter connections
* social integration vs. segmentation
A single arrow from the central box branches out to four outcome categories at the bottom level, from left to right:
* Cohesion: includes Density, Closure, and Number of Cliques.
* Integration: includes Diameter, Average Distance, Fragmentation, and Modularity.
* Centralization: includes Degree Centralization and Betweenness Centralization.
* Tie Quality: includes percent Strong Ego–Alter Ties, percent Strong Alter–Alter Ties, Multiplexity, and Ties Without Support.
Method
Participants
A total of 305 individuals participated in the study, including 201 women and 104 men, with a mean age of 48.2 years (SD = 17.42). A detailed overview of the sample characteristics is provided in Table 1. Data were collected through interviewer-administered face-to-face surveys, each lasting approximately 90 minutes, conducted throughout 2022. The data were collected as part of a larger study on mobility and sense of community in adjacent urban neighborhoods (Maya-Jariego et al., Reference Maya-Jariego, González-Tinoco and Muñoz-Alvis2023). Information was obtained from four neighbourhoods in Seville (Spain) and one neighbourhood in Barranquilla (Colombia). In both contexts, respondents were selected using a quota-guided approach based on gender and age, with proportional allocation according to population data from the municipal census. Participants were recruited through informal interactions with passers-by in public spaces who were aged 18 years or older. Participation was voluntary, written informed consent was obtained prior to data collection, and confidentiality was strictly maintained. Participants were informed of their right to withdraw from the study at any time.
Descriptive statistics of the sociodemographic characteristics of the participants (N = 305)

Table 1. Long description
The table presents data for a sample size N = 305.
* Age: Mean M = 48.2, Standard Deviation S D = 17.4.
For the following categories, data is provided as Frequency F and Percentage %:
* Sex: Male (F = 104, 34.1%), Female (F = 201, 65.9%).
* Country of residence: Spain (F = 225, 73.8%), Colombia (F = 80, 26.2%).
* Educational formation: Non-tertiary education (F = 227, 74.4%), Tertiary education (F = 62, 20.3%), No studies (F = 16, 5.3%).
* Professional status: Active (F = 145, 47.7%), Unemployed (F = 74, 24.2%), Retired (F = 60, 19.8%), Students (F = 25, 8.3%).
Measures
Participants completed a personality inventory, an adult attachment scale, and a personal network instrument. Questions related to sociodemographic variables were also included. Personality traits were assessed using the Spanish adaptation of the NEO Five Factor Inventory (NEO-FFI; Aluja et al., Reference Aluja, Garcıa, Rossier and Garcıa2005; Costa & McCrae, Reference Costa and McCrae1999), a 60-item instrument rated on a 7-point Likert scale ranging from 1 (Strongly disagree) to 7 (Strongly agree) that assesses five personality dimensions: extraversion, agreeableness, openness to experience, neuroticism, and conscientiousness. Neuroticism reflects emotional instability and negative affect (e.g., “Sometimes things seem too bleak and hopeless to me”); extraversion captures sociability and positive emotionality (e.g., “I really enjoy talking with people”); openness to experience refers to intellectual curiosity and aesthetic sensitivity (e.g., “I have a wide variety of intellectual interests”); agreeableness assesses interpersonal trust and a forgiving disposition (e.g., “I tend to think the best of people”); and conscientiousness reflects self-discipline and goal orientation (e.g., “I work hard to achieve my goals”). In the present study, the internal consistency was acceptable, with reliability coefficients for the individual dimensions of .81 for extraversion, .67 for agreeableness, .65 for openness to experience, .79 for neuroticism, and .75 for conscientiousness.
Second, the Adult Attachment Questionnaire (Melero & Cantero, Reference Melero and Cantero2008) was used to assess adult attachment. This standardized instrument, validated for the Spanish population, has shown satisfactory psychometric properties in terms of reliability and validity. It evaluates attachment through four factors corresponding to classical attachment styles: preoccupied attachment, characterized by low self-esteem, need for approval, and fear of rejection (e.g., “Often, even when I am with people important to me, I feel lonely or unloved”); fearful attachment, associated with hostility in conflict resolution, resentment, and possessiveness (e.g., “I am very possessive in all my relationships”); secure attachment, reflecting emotional expressiveness and comfort with intimacy (e.g., “I find it easy to express my feelings and emotions”); and avoidant/dismissing attachment, characterized by emotional self-sufficiency and discomfort with closeness (e.g., “I value my independence above all”). The questionnaire consists of 40 items (10 per factor), rated on a 6-point Likert scale ranging from 1 (Strongly disagree) to 6 (Strongly agree). In the present study, the overall internal consistency of the attachment questionnaire was good (α = .80). Factor scores allow both the identification of discrete attachment profiles and the positioning of individuals along continuous dimensions, providing a hybrid approach consistent with recent dimensional models (Fraley et al., Reference Fraley, Hudson, Heffernan and Segal2015; Raby et al., Reference Raby, Fraley, Roisman, Thompson, Simpson and Berlin2021). Its validity has been supported by previous research in adult attachment (Benítez et al., Reference Benítez, Luque, Borda, Dorado and Rodríguez2017; Morales-Vives et al., Reference Morales-Vives, Ferré-Rey, Ferrando and Camps2021; Novo et al., Reference Novo, Herbón and Amado2016).
Third, a personal network analysis research design was employed. To obtain the personal network a name generator with a fixed number of alters was used with the aim to facilitate standardization, comparability, and data management (Maya Jariego, Reference Maya Jariego2018). Participants were asked to generate a list of 30 people with whom they interact most regularly throughout the week. Alters could be relatives, friends, colleagues, neighbors, or others. The strength of the tie between ego and alter was measured on a scale from 1 (acquaintances) to 4 (intimate), and among alters on a scale from 0 (do not know each other) to 4 (have a strong tie) based on the respondents’ self-reported perception. The use of a fixed number of alters facilitates standardization and comparison across personal networks (Maya Jariego, Reference Maya Jariego2018). Each respondent (ego) provided systematic information on alter-to-alter relationships, allowing for analysis of the structural properties of the interpersonal environment.
Finally, the multiplicity and types of support provided were investigated using the Arizona Social Support Interview Schedule (ASSIS) (Barrera, Reference Barrera1980). It consisted of 6 items which examine six categories of support: (1) intimate interaction, (2) material aid, (3) advice and information, (4) feedback, (5) behavioral assistance, and (6) positive social interaction. This instrument has been widely used in Spain with immigrant and general populations, with excellent validity and reliability results. The first application was conducted with African immigrants in Andalusia (Martínez et al., Reference Martínez, García, Maya, Rodríguez and Checa1996), and the Spanish version was subsequently validated with socially at-risk groups (López et al., Reference López, Menéndez, Lorence, Jiménez, Hidalgo and Sánchez2007). In addition to efficiently describing types of social support, it integrates well as a name generator for assessing personal networks (Maya-Jariego & Holgado, Reference Maya-Jariego and Holgado2015). In this study, we used the ASSIS to assess multiplicity and count the number of support providers, enabling the calculation of a multiplicity indicator based on the number of support types provided by each alter.
Data Analysis
Network and Statistical Analysis
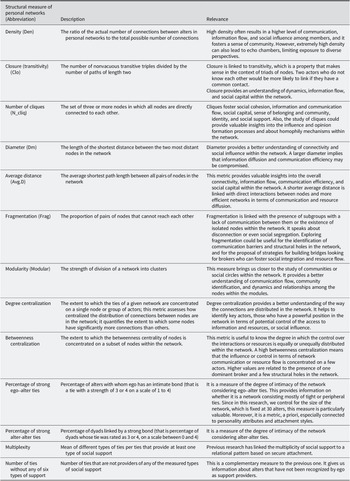
To gain insights into the structure of each personal network, we computed 13 structural indicators, as outlined in Table 2. Each personal network is inherently a network, offering a wide range of metrics to describe its structural properties. For this study, we selected the most relevant metrics based on previous research on individual differences in personal network structures, and expert knowledge. As described in Table 2, the selected indicators cover the main dimensions of variability in personal networks, such as structural cohesion, fragmentation, and relational integration (Maya-Jariego, Reference Maya-Jariego2021).
Structural personal network metrics used in the study

Table 2. Long description
The table consists of three columns: Structural measure of personal networks (Abbreviation), Description, and Relevance.
* Density (Den): Ratio of actual to possible connections. High density fosters community but can create echo chambers.
* Closure (transitivity) (Clo): Number of nonvacuous transitive triples over paths of length two. Relates to social capital and triadic dynamics.
* Number of cliques (N_cliq): Sets of three or more fully connected nodes. Indicates social cohesion and homophily.
* Diameter (Dm): Shortest distance between the two most distant nodes. Larger diameters may compromise communication efficiency.
* Average distance (Avg.D): Average shortest path length between all pairs. Shorter distances link to efficient resource diffusion.
* Fragmentation (Frag): Proportion of node pairs that cannot reach each other. Indicates social segregation or structural holes.
* Modularity (Modular): Strength of division into clusters. Used for community identification.
* Degree centralization: Concentration of ties on a single node or group. Identifies key actors with potential control over information.
* Betweenness centralization: Concentration of betweenness centrality on a subset. High values indicate dominant brokers.
* Percentage of strong ego-alter ties: Percentage of alters with an intimate bond (strength 3 or 4 on a 1 to 4 scale). Measures network intimacy.
* Percentage of strong alter-alter ties: Percentage of dyads linked by a strong bond (strength 3 or 4 on a 0 to 4 scale).
* Multiplexity: Mean of different tie types per tie providing social support. Linked to secure attachment patterns.
* Number of ties without any of six types of support: Number of ties not recognized as support providers.
We used R software (R version 4.0.3, R Core Team, 2020) and igraph package (Csardi & Nepusz, Reference Csardi and Nepusz2006). Based on previous research, we selected indicators of density, centralization, fragmentation, number of cliques, and number of components (Bidart et al., Reference Bidart, Degenne and Grossetti2018; Maya-Jariego, Reference Maya-Jariego2021; Maya-Jariego & González-Tinoco, Reference Maya-Jariego and González-Tinoco2023), as well as indicators of social support (Cheng et al., Reference Cheng, Lee, Chan, Leung and Lee2009; Fiori et al., Reference Fiori, Antonucci and Akiyama2008; Friedman & Kennedy, Reference Friedman and Kennedy2021; Li & Zhang, Reference Li and Zhang2015; Park et al, Reference Park, Kang and Chadiha2016, Reference Park, Jang, Lee, Chiriboga, Chang and Kim2018) and the proportion of intimate ties (Fiori et al., Reference Fiori, Antonucci and Akiyama2008; Litwin, Reference Litwin1995; Litwin & Landau, Reference Litwin and Landau2000). All metrics were computed excluding ego, except for the strength of ego–alter ties.
Firstly, we explored the connection between structural indicators and Big Five, attachment styles, and three sociodemographic variables (age, gender, and country of residence) using bivariate relationships based on Spearman’s correlations. The suitability of the nonparametric Spearman’s correlation test is justified by the nature of our data, which are not normally distributed but showing a high skewness typical for network-based measures. Out of the 13 indicators analyzed, only the measures of closure, degree centralization, and the percentage of strong alter–alter ties show p-values above .05 in the Kolmogorov–Smirnov test. Secondly, to uncover personal network typologies we performed latent profile analysis (LPA) (Van Lissa et al., Reference Van Lissa, Garnier-Villarreal and Anadria2024) with mclust R package (Fraley et al., Reference Fraley, Raftery, Murphy and Scrucca2012; Scrucca et al., Reference Scrucca, Fop, Murphy and Raftery2016). This package uses finite Gaussian mixture models to perform clustering and model-based classification by expectation-maximization algorithm.
Finally, we examined the influence of the Big Five, attachment styles, and sociodemographic variables (age, gender, and country of residence) on the clustering patterns of personal networks by running multinomial regressions, with assigned clusters as dependent variables. Gender and country residence had two possible values (male = 1, female = 2; Spain = 1, Colombia = 2, respectively) and were transformed to numerical indicators. See Supplementary Material for additional information on transformation of variables.
Power analysis
Previous research on associations between ego-network characteristics and psychological attributes typically reports effect sizes around r ≈ .30 (for a review, see Maya-Jariego et al., Reference Maya-Jariego, Letina and González-Tinoco2020). A priori, detecting a correlation of this magnitude with 80% power (two-tailed α = .05) would require approximately N = 85 participants (Fisher-z method). Our sample of N = 305 therefore provides >99% power to detect effects of this size and approximately 94% power for a smaller effect of r = .20. The smallest detectable correlation with 80% power is r ≈ .16, indicating that the study was well powered to identify theoretically meaningful associations.
The main analyses employed multinomial logistic regression with four outcome categories (ego-network types) and psychological traits, attachment styles, and some sociodemographic variables as predictors. To approximate power for this analysis, we used the effect size measure f2 = R 2/(1 – R 2) as implemented in multiple and multinomial regression contexts (Cohen, Reference Cohen2013). A medium effect of r = .30 corresponds to f2 ≈ 0.09, and a small effect of r = .20 corresponds to f 2 ≈ 0.04. Power analyses based on this range indicate that with N = 305, α = .05, and up to 8–10 predictors (Model 3 investigating the predictive power of Big Five personality traits and Attachment Styles contains nine predictors, while the final Model 4 additionally controlled for three sociodemographic variables), the study retains greater than .90 power to detect medium-sized effects and ≈ .80 power to detect small-to-moderate effects in a multinomial logistic model with four outcome categories (Cohen, Reference Cohen2013; Hsieh, Reference Hsieh1989). Thus, our sample size was sufficient to detect the magnitude of associations commonly reported between psychological attributes and ego-network characteristics.
Ethics and informed consent statement
This study was conducted in accordance with the ethical principles outlined in the Declaration of Helsinki. The activities were subject to Regulation (EU) 2016/679 on the protection of personal data, as well as to Organic Law 3/2018, of December 5, on the Protection of Personal Data and Guarantee of Digital Rights. Prior to participation, all participants were provided with detailed information about the study’s objectives, procedures, and their rights, including the right to withdraw at any time without any repercussions. Informed consent was obtained from all participants before the surveys were conducted. Confidentiality and anonymity were strictly maintained throughout the study, and the collected data were securely stored and used solely for research purposes. They were fully informed about the objectives and procedures of the research, the voluntary nature of their participation, and their right to withdraw at any time without any consequences.
Results
Correlations
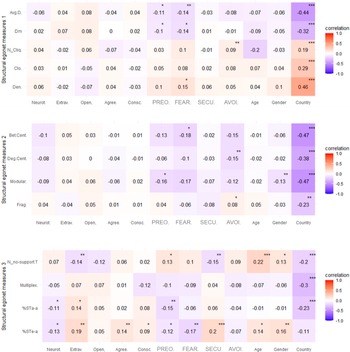
In Figure 2, we present the correlations between the personality variables, the attachment styles, the three sociodemographic variables—age, gender, and country of residence—and the 13 structural indicators of the personal networks for each participant. The results show that sociodemographic variables—especially country where respondents reside—were more associated with the structural properties of personal networks than attachment types, and in turn more so than personality variables. It also seems that anxious attachment styles (preoccupied and fearful types) were more associated than avoidant attachment style with personal networks.
Spearman’s correlation coefficients between 13 structural ego-network indicators and Big five personality traits, four attachment styles and age, gender (1 = male; 2 = female), and country (1 = Spain; 2 = Colombia). Abbreviations: X-axis: Neurot. = neuroticism; Extrav. = extraversion; Open. = openness; Agree. = Agreeableness; Consc. = conscientiousness; PREO = preoccupied attachment style; FEAR. = fearful attachment style; SECU. = secure attachment style; AVOI. = avoidant attachment style. Y-axis 1: Avg.D = average distance; Dm = diameter; N_cliq = number of cliques; Clo. = closure; Den. = density. Y-axis 2: Bet.Cent = betweenness centralization; Deg.Cent = degree centralization; Modular. = modularity; Frag. = fragmentation. Y-axis 3: N_no_support.T = number of ties without any of six types of support; Multiplex. = multiplexity; %STe-a = percentage of strong ties between ego and alters; %Sta-a = percentage of strong ties between alters.

Figure 2. Long description
The figure contains three panels labeled Structural egonet measures 1, 2, and 3. Each panel uses a color gradient from blue (negative correlation, -1.0) to red (positive correlation, 1.0), with white indicating zero correlation. Asterisks indicate statistical significance.
* Structural egonet measures 1 (Top Panel): Y-axis includes Avg.D., Dm, N_Cliq., Clo., and Den. The strongest correlations are found in the Country column, with negative values for Avg.D. (-0.44) and Dm (-0.32), and positive values for Clo. (0.29) and Den. (0.46). Fearful attachment (FEAR.) shows significant negative correlations with Avg.D. (-0.14) and Dm (-0.14).
* Structural egonet measures 2 (Middle Panel): Y-axis includes Bet.Cent., Deg.Cent., Modular., and Frag. The Country column shows strong negative correlations across all measures: Bet.Cent. (-0.47), Deg.Cent. (-0.38), Modular. (-0.47), and Frag. (-0.23). FEAR. attachment shows a significant negative correlation with Bet.Cent. (-0.18).
* Structural egonet measures 3 (Bottom Panel): Y-axis includes N_no-support.T, Multiplex., %STa-a, and %STe-a. Country shows negative correlations with Multiplex. (-0.3) and %STa-a (-0.23). Age shows a strong positive correlation with N_no-support.T (0.22). Extraversion (Extrav.) correlates positively with %STe-a (0.19) and %STa-a (0.14), but negatively with N_no-support.T (-0.14). Secure attachment (SECU.) correlates positively with %STe-a (0.2) and negatively with N_no-support.T (-0.15).
More specifically, while neuroticism and preoccupied attachment were negatively correlated with the proportion of close ties in the network—both in relation to ego and among alters—extraversion was positively correlated. On the other hand, while agreeableness, conscientiousness, and secure attachment were positively related to a higher percentage of close connections between ego and alters, fearful attachment was negatively related. Concerning the support related personal network measures, while higher scores on extraversion and secure attachment were related to a higher proportion of support providers in the network, preoccupied attachment style was related to a lower number of social support providers.
Latent Profile Analysis
Second, latent profile analysis based on the 13 structural indicators were run. We used multivariate mixture model “VEV,” which means that the parametrizations of within-group covariance matrix have ellipsoidal distribution, variable volume, equal shape, and variable orientation. Analysis started with one class, adding additional classes up to nine. The model fit was assessed for all solutions, and the four-class solution was the optimal based on the Bayesian information criterion (BIC) and the integrated complete-data likelihood (ICL) criterion. Summary of the model is N = 292 (df = 383); log-likelihood = −186.452; BIC = −2547.101, ICL = − 2547.64.
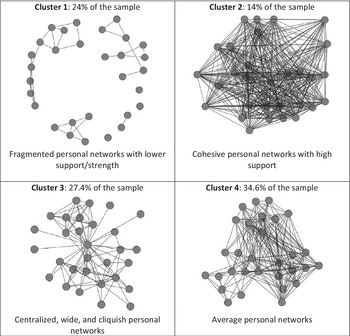
Table 3 and Figure 3 summarize the four clusters identified. Cluster 1 stands out as having the highest scores in fragmentation, modularity, and average distance, and the lowest ones in density, number of cliques, and number of support providers (about half of the network actors did not provide any support). This is the least cohesive type, with highly fragmented and modular personal networks, and the lowest number of support providers.
Distribution of cases and final cluster centres based on 13 structural indicators (N = 292)

Table 3. Long description
The table consists of three columns: Cluster, Description, and N (percentage).
* Cluster 1: Fragmented and modular networks with low support and strength. N equals 70 (24 percent).
* Cluster 2: Cohesive and not centralized networks with high support and strength. N equals 41 (14 percent).
* Cluster 3: Centralized, wide and cliquish networks. N equals 80 (27.4 percent).
* Cluster 4: Average networks. N equals 101 (34.6 percent).
Illustration of the clusters.

Figure 3. Long description
The diagram is divided into four quadrants, each representing a different social network structure.
* Top-left panel: Cluster 1 represents 24% of the sample. It shows fragmented personal networks with lower support or strength. The visualization features several small, isolated groups of nodes with very few connecting lines between the groups.
* Top-right panel: Cluster 2 represents 14% of the sample. It shows cohesive personal networks with high support. The visualization is a dense web where almost every node is interconnected by a thick mass of lines, forming a nearly solid block of connections.
* Bottom-left panel: Cluster 3 represents 27.4% of the sample. It shows centralized, wide, and cliquish personal networks. The visualization features a clear central hub node with many lines radiating outward to smaller, tightly-knit sub-groups or cliques.
* Bottom-right panel: Cluster 4 represents 34.6% of the sample. It shows average personal networks. The visualization displays a moderate level of connectivity, with more lines than Cluster 1 but significantly less density than Cluster 2, forming a loose but continuous network structure.
Cluster 2 was the least prevalent one in our sample. It hosts the densest personal networks, with the highest number of cliques, transitive triads, strong ego–alter ties, and support providers. They are also the least centralized networks (both in degree centralization and betweenness centralization), and with the lowest modularity, average distance, and diameter. It is the most cohesive, least centralized cluster with the highest proportion of support providers.
Cluster 3 is formed by slightly more centralized networks, both in terms of degree centralization and betweenness centralization, with the largest diameter, and the lowest transitivity. These networks are highly centralized, wide, and cliquish. Finally, Cluster 4, which is also the biggest cluster, is made of cohesive personal networks that tend to have medium average values in most network measures.
Comparing clusters, we found no differences regarding gender (χ2 = 5.94; df = 3, p = .11) although the lowest percentage of women are in Cluster 4 (59.4%) and highest in Cluster 2 (80.5%). There was also no difference regarding age (Kruskal–Wallis χ2 = 5.32; df = 3; p = .15). However, the clusters differed regarding the country of residence of the ego (χ2 = 66.61; df = 3, p < .001) with the highest percentage of individuals that are residents of Colombia in Cluster 2 (75.61%) and lowest in Cluster 1 (10%).
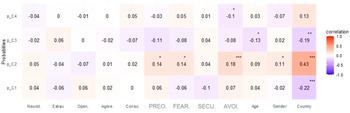
Figure 4 shows the association between probabilities to belong to each cluster and all ego attributes. All coefficients were of modest size (<0.2) for all attributes except for country of residence. Higher scores in all three insecure attachment styles were associated with a higher probability of being in Cluster 2 (most cohesive), while lower scores in avoidant attachment style were associated with being in Cluster 4 (average group). Age and the probability of being in Cluster 3 were inversely related, while gender (female) was associated with being in Cluster 2. Living in Spain was associated with Clusters 1 (most fragmented) and 3 (most centralized) and living in Colombia with Cluster 2.
Associations between probability of belonging to a cluster and attributes (Spearman’s correlation). Abbreviations: X-axis: Neurot. = neuroticism; Extrav. = extraversion; Open. = openness; Agree. = agreeableness; Consc. = conscientiousness; PREO. = preoccupied attachment style; FEAR. = fearful attachment style; SECU. = secure attachment style; AVOI. = avoidant attachment style. Y-axis 1: p_C4 = probability of belonging to the fourth cluster; p_C3 = probability of belonging to the third cluster; p_C2 = probability of belonging to the second cluster; p_C1 = probability of belonging to the first cluster.

Figure 4. Long description
A correlation heatmap with a vertical color scale on the right ranging from negative 1.0 (blue) to 1.0 (red), with 0.0 as white. The Y-axis represents Probabilities for four clusters: p sub C 4, p sub C 3, p sub C 2, and p sub C 1. The X-axis lists twelve attributes: Neurot., Extrav., Open., Agree., Consc., P R E O dot, F E A R dot, S E C U dot, A V O I dot, Age, Gender, and Country.
* Row p sub C 4: Values range from negative 0.1 (A V O I dot, marked with one asterisk) to 0.13 (Country). Most values are near zero.
* Row p sub C 3: Shows negative correlations for P R E O dot (negative 0.11), Age (negative 0.13, one asterisk), and Country (negative 0.19, two asterisks).
* Row p sub C 2: Displays positive correlations for P R E O dot (0.14, one asterisk), F E A R dot (0.14, one asterisk), A V O I dot (0.18, three asterisks), Gender (0.11, one asterisk), and a strong positive correlation for Country (0.43, three asterisks).
* Row p sub C 1: Features mostly low correlations, with the strongest being a negative correlation for Country (negative 0.22, three asterisks) and S E C U dot (negative 0.1).
Multinomial Regressions
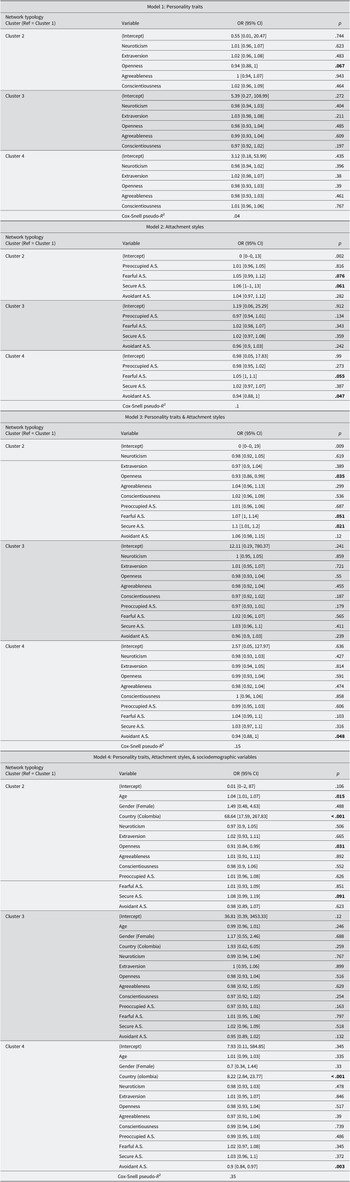
Table 4 displays the results from four multinomial regression models examining the relationship between clusters based on network metrics and predictor variables, including personality traits (Model 1), attachment styles (Model 2), both personality traits and attachment styles (Model 3) and one model controlling for sociodemographic factors (age, gender, and country of residence).
Nominal regressions for all models, dependent variable: Network type (cluster) based on network metrics

Table 4. Long description
The table presents results for four nominal regression models where the dependent variable is Network type (Cluster 1 as reference).
* Model 1: Personality traits. For Cluster 2, Openness shows a p-value of .067 (O R 0.94). Other traits (Neuroticism, Extraversion, Agreeableness, Conscientiousness) are not significant across Clusters 2, 3, or 4. Cox-Snell pseudo-R-squared is .04.
* Model 2: Attachment styles (A S). For Cluster 2, Fearful A S (p = .076) and Secure A S (p = .061) are significant. For Cluster 4, Fearful A S (p = .055) and Avoidant A S (p = .047) are significant. Cox-Snell pseudo-R-squared is .1.
* Model 3: Personality traits and Attachment styles. For Cluster 2, Openness (p = .035), Fearful A S (p = .051), and Secure A S (p = .021) are significant. For Cluster 4, Avoidant A S (p = .048) is significant. Cox-Snell pseudo-R-squared is .15.
* Model 4: Personality traits, Attachment styles, and sociodemographic variables. For Cluster 2, Age (p = .015), Country-Colombia (p < .001), Openness (p = .031), and Secure A S (p = .091) are significant. For Cluster 4, Country-Colombia (p < .001) and Avoidant A S (p = .003) are significant. Cox-Snell pseudo-R-squared is .35.
Reference groups are Gender (Male) and Country (Spain). Bolded p-values indicate significance below .1.
Abbreviations: OR = Odds Ratio, CI = Confidence Intervals, p = p value; A.S. = Attachment Style.
Note. Reference groups: Gender = male; Country = Spain.
Bold p-values = < .1
Individuals with higher levels of openness were less likely to belong to the most cohesive cluster (Cluster 2, p = .067). In contrast, neuroticism, extraversion, agreeableness, and conscientiousness did not show a significant association with cluster membership. Regarding attachment styles (Model 2), higher scores on fearful and secure types were associated with a greater probability of belonging to the most cohesive cluster (Cluster 2). When demographic variables were controlled, only secure attachment style remained significant. Higher scores on avoidant style implied a greater probability of belonging to Cluster 1, which was more fragmented.
According to Model 4, older participants were more likely to belong to the most cohesive cluster, while participants from Colombia were more likely to belong to the most cohesive cluster and the average cluster.
The Cox–Snell pseudo-R 2 values provide an indication of model fit. Model 1, which includes personality traits only, explained a small proportion (4%) of the variance in network typology, and the fit was not significantly better than the intercept-only model. Model 2, including attachment styles, explained approximately 10% of the variance and showed improved model fit compared to the intercept-only model. Model 3, with both personality traits and attachment styles, explained around 15% of the clustering variance. Finally, the comprehensive Model 4, including personality traits, attachment styles, age, gender, and country, accounted for an additional 20% of clustering variance, resulting in a total explained variance of 35%, indicating that the added demographic variables significantly contribute to explaining the clustering patterns.
Discussion
Over the past decade, there has been a noteworthy increase in the volume of research that integrate the exploration of individual differences with the analysis of the structural properties of personal networks. This reflects a shift in the approach to the phenomenon, which seems to move away from a more structuralist perspective to recognize that social actors have agency and play a leading role in the construction of their relational environment. It has been common to use the Big Five model to explore how the five traits predict the shape of the interpersonal environment, using personality as an antecedent of network structure. The Big Five framework offers a broad and straightforward approach to examining the role of individual psychological differences in social network research.
However, psychology as a field is rich in theories and measures of other individual differences that may provide a more suitable foundation for integrating psychological and social network research. Among these, attachment styles represent a particularly promising - yet still underutilized—framework for understanding social networks. Although a number of studies have examined this connection (e.g., Bouchard & Maya-Jariego, Reference Bouchard and Maya-Jariego2019; Dizdari & Seiler, Reference Dizdari and Seiler2020; Gillath et al., Reference Gillath, Johnson, Selcuk and Teel2011; Gillath et al., Reference Gillath, Karantzas and Selcuk2017; Gillath et al., Reference Gillath, Karantzas and Lee2019; Gillath & Karantzas, Reference Gillath, Karantzas, Zayas and Hazan2015; Lee & Gillath, Reference Lee and Gillath2016; Webster et al., Reference Webster, Gesselman and Crosier2016), their application remains relatively limited. This gap in the literature is quite striking given that attachment styles are explicitly relational constructs, directly shaping how individuals form, maintain, and perceive relationships. As such, they influence behaviors such as closeness, trust, and reliance on others, which are critical for understanding network features like density, centrality, and clustering. In contrast, the Big Five traits are broader and less specific to interpersonal relationships.
Our study combines social network methodology with insights into individual psychological differences. It represents a contribution to the body of knowledge that explores the dimensions of interindividual variability in socialization patterns by using individual differences in attachment styles that have inherently relational focus as social network approach. We therefore anticipated that attachment styles would have a greater predictive power than personality traits in shaping personal interaction patterns and, by extension, the type of personal network’s structure. This expectation is supported by the results of our research.
In the classification of personal networks, we observed that some indicators were more relevant to differentiate the types of networks. These are the measures of density, fragmentation, and centralization. These measures are related to how many alters know each other, how easily—in network terms—alters can reach each other, and the existence of alters that are disproportionately central in one’s network, respectively. Density and fragmentation measure the connectivity of the interpersonal environment and the ease with which information spreads. Centralization indicates that one or a few alters are more dominant in terms of connectivity. Different types of personal networks reflect the diverse ways in which individuals navigate, organize, and manage their interpersonal relationships. Our classification revealed four types: (1) fragmented and modular networks, with a comparatively lower number of support providers; (2) networks characterized by high density and low centralization, featuring a high proportion of support providers; (3) networks that display a relatively higher centralization; and (4) “typical” networks leaning towards average values.
These results are consistent with those of Bidart et al. (Reference Bidart, Degenne and Grossetti2018) and Maya-Jariego (Reference Maya-Jariego2021), who also obtained classifications that differentiated between highly cohesive networks; networks organized in groups, with some alters with high centrality and fragmented networks that typically have more components. In one of the cases, an intermediate cluster was also obtained, with average values in several structural indicators (Maya-Jariego, Reference Maya-Jariego2021). In our case, the latter could be related to the heterogeneity of the sample or the fact of having an extensive list of criterion variables.
Regression analyses revealed that individuals with secure attachment style were more likely to have cohesive-non centralized networks, with a high number of support providers. This is consistent with Bouchard and Maya-Jariego (Reference Bouchard and Maya-Jariego2019), who found the association of secure attachment style and dense networks, and with the foundations of attachment theory, which holds that those who have developed a security-based attachment are able to seek support in times of need, confident that others will be available to help them regulate their emotions (Ainsworth et al., Reference Ainsworth, Blehar, Waters and Wall1978; Brennan et al., Reference Brennan, Clark, Shaver, Simpson and Rholes1998; Fraley & Waller, Reference Fraley, Waller, Simpson and Rholes1998; Gillath et al., Reference Gillath, Karantzas and Fraley2016; Mikulincer & Shaver, Reference Mikulincer and Shaver2016; Seiffge-Krenke & Beyers, Reference Seiffge-Krenke and Beyers2005). On the opposite end, people with an avoidant attachment style showed a higher probability of fragmented and less supportive networks. This pattern may align with previous findings indicating that avoidant attachment is linked to a reduced tendency to maintain social ties (Gillath et al., Reference Gillath, Johnson, Selcuk and Teel2011) and lower levels of network density (Gillath et al., Reference Gillath, Karantzas and Selcuk2017; Zhao et al., Reference Zhao, Gillath, Alonso-Arbiol, Abubakar, Adams, Autin, Brassard, Carcedo, Catz, Cheng, Conner, Igarashi, Kafetsios, Kamble, Karantzas, Mendía-Monterroso, Moreira, Nolte, Ruch and Zhang2024). These associations suggest that individuals with higher levels of attachment avoidance may be more likely to form social networks characterized by weaker ties and less structural cohesion. This behavioral dynamic may be explained by their tendency to isolate themselves from potential sources of support (Anders & Tucker, Reference Anders and Tucker2000; Collins & Feeney, Reference Collins and Feeney2004; Gillath et al., Reference Gillath, Karantzas and Fraley2016) and to reject social contact due to the belief that others will be intrusive or unavailable in times of need (Brennan et al., Reference Brennan, Clark, Shaver, Simpson and Rholes1998; Feeney et al., Reference Feeney, Noller, Hanrahan, Sperling and Berman1994; Lee & Gillath, Reference Lee and Gillath2016). Furthermore, it should be noted that the trait of openness to experience is more prone to fragmented—less supportive networks. This is in line with the literature, which shows less stability of ties (Wagner et al., Reference Wagner, Lüdtke, Roberts and Trautwein2014; Wrzus et al., Reference Wrzus, Zimmermann, Mund, Neyer, Hojjat and Moyer2017) and greater variability in the social contexts of open-minded people (Fang et al., Reference Fang, Landis, Zhang, Anderson, Shaw and Kilduff2015; Landis, Reference Landis2016).
Our findings highlight the great importance of sociodemographic variables, aligning with the theoretical understanding that social networks are deeply context dependent. At the same time, they also underscore the significant role of individual psychological differences—particularly attachment styles—in shaping the structure of personal networks. This dual influence invites further reflection on the broader contextual and cultural factors in which psychological tendencies are embedded.
Emerging research indicates that the effects of attachment on social networks are not culturally neutral. Rather, cultural contexts shape both the development and behavioral consequences of attachment orientations (Kafetsios & Kateri, Reference Kafetsios and Kateri2020; Strand, Reference Strand2020). This perspective suggests that cultural contexts may amplify or attenuate the influence of attachment depending on their alignment with prevailing norms and values (Friedman et al., Reference Friedman, Rholes, Simpson, Bond, Diaz-Loving and Chan2010). For example, attachment avoidance may be more compatible with individualistic cultures that emphasize autonomy, whereas attachment anxiety may align more closely with collectivist cultures that value closeness and interdependence. Consistent with this view, Zhao et al. (Reference Zhao, Gillath, Alonso-Arbiol, Abubakar, Adams, Autin, Brassard, Carcedo, Catz, Cheng, Conner, Igarashi, Kafetsios, Kamble, Karantzas, Mendía-Monterroso, Moreira, Nolte, Ruch and Zhang2024) show that culture and attachment interact to predict key social network characteristics, including density, tie strength, and support. Together, these findings suggest that attachment and culture operate as interdependent systems that mutually shape and stabilize social behavior over time (Strand, Reference Strand2020).
The attachment behavioral system has evolved as an adaptive mechanism where distinct attachment patterns offer specific advantages depending on the developmental and cultural contexts. Variations in the cultural understanding of attachment security correspond to behavioral patterns that facilitate survival or adaptation to social life. These patterns emerge in response to the distinct adaptive demands that each cultural context places on individuals (Kafetsios & Kateri, Reference Kafetsios and Kateri2020; Mesman et al., Reference Mesman, van Ijzendoorn, Sagi-Schwartz, Cassidy and Shaver2016; Sakman & Sümer, Reference Sakman and Sümer2024; Strand, Reference Strand2020). These insights highlight the value of an integrative framework that considers both individual and contextual factors for understanding the dynamics of personal networks across diverse sociocultural environments.
This type of evidence can be useful in clinical intervention contexts, both for diagnostic purposes and for facilitating interpersonal environments that enhance subjective well-being. Indeed, network visualization strategies have recently been incorporated successfully into clinical practice, helping patients recognize the value of social support and the unique features of their interpersonal networks (Nicaise et al., Reference Nicaise, Garin, Smith, d’Oreye de Lantremange, Leleux, Wyngaerden and Lorant2022), and acting as a trigger for behavioral change (Kennedy et al., Reference Kennedy, Osilla and Tucker2022). As the results indicate, individuals with some forms of insecure attachment could constitute a risk group in the development of less supportive networks and therefore constitute a group for preferential intervention.
Limitations and Future Research
The sample used entails limitations in terms of generalizability, size, and heterogeneity. In particular, there are notable differences in gender distribution, country of origin, and sample composition (e.g., a higher proportion of unemployed participants in Colombia and retired individuals in Spain), which may introduce bias and limit the comparability of results across subsamples. It should also be considered that classifications often depend partly on the characteristics of the sample. Additionally, setting a fixed number of alters in the name generator when applying the personal networks instrument may influence the structure of the personal network. Furthermore, it is common to find an “average” category, which acts as a “catch-all.” In future research, it would be of interest to develop methodologies for classifying personal networks that address both the aforementioned limitations and test the robustness of our findings in different cultural contexts and in larger, more representative samples.
The effect sizes were not very large although they correspond to those typically observed in studies examining the relationship between personality variables and social network properties. Nevertheless, the results were examined using multiple analytical strategies (including latent class analysis and multinomial regressions) to strengthen the validity of the conclusions. In fact, it is worth noting that although the clusters may exhibit some imbalance in terms of gender or country of residence, the association between secure attachment and more cohesive networks remains significant in the regression models. Future research could extend these findings by employing larger and more diverse samples, longitudinal designs, or additional variables to further clarify the mechanisms linking personality and social network characteristics.
Conclusion
Understanding how people organize their social worlds is central to the study of personal relationships. This research shows that attachment styles, more than broad personality traits, shape the structural patterns of individuals’ personal networks. Secure attachment fosters cohesive and supportive relational environments whereas avoidant attachment relates to fragmented ones. These findings suggest that emotionally grounded, relational constructs such as attachment may better explain how personal networks take shape than traditional personality frameworks.
This study enhances our understanding of how individual differences relate to the structure of personal networks using typologies. Three structural personal network measures emerged as central in clustering solutions: density, fragmentation, and centralization. We approached the investigation of the associations between individual personality-related differences and network typologies based on their structural properties, revealing that attachment styles played a more important role in characterising personal networks than personality traits. Notably, the contribution of the country of residence surpassed other predictors, enhancing the predictive power of psychological attributes and suggesting the importance of cultural differences and context, well known to be among the pivotal factors affecting the structure of personal network (e.g., Chase et al., Reference Chase, Kamp-Whittaker and Peeples2024; Grossetti, Reference Grossetti2005; Kilonzi & Ota, Reference Kilonzi and Ota2019). Our study indicated that secure attachment style and living in Colombia were associated with dense, supportive, but not centralized, personal networks. In contrast, the avoidant attachment style, openness to experience, and living in Spain were linked to fragmented and less supportive networks. These findings highlight the importance of context and cultural norms in shaping their relational environment and have substantial potential for assessing social cohesion and community integration.
Supplementary material
To view supplementary material for this article, please visit http://doi.org/10.1017/SJP.2026.10048.
Data availability statement
Data will be made available on request.
Acknowledgements
The first author (Elena González Tinoco) carried out a research stay at the University of Glasgow (under the supervision of Srebrenka Letina) within the framework of the predoctoral contracts of the University of Seville’s Research Plan. We are grateful to the Mental Health and Wellbeing unit led by Professor Mark McCann, at the School of Health and Wellbeing, University of Glasgow, who made this possible. The authors extend their thanks to the Irish Centre for Maternal and Child Health Research (INFANT) at University College Cork (Elena González Tinoco); the Department of Psychology and the Centre for Social Issues Research at the University of Limerick (Srebrenka Letina); and the Department of Social Psychology at the University of Seville (Isidro Maya Jariego).
Author contribution
E. G.-T. and I. M.-J. developed the concept of the study. E. G.-T. collected data, and S. L. conducted statistical analyses. E. G.-T., S. L., and I. M.-J. wrote, edited, and provided critical revisions to the manuscript. All the authors have approved the final version of the manuscript for submission.
Funding statement
This research is part of the project “Multiple senses of community in adjacent neighbourhoods: an approach based on the analysis of personal networks” (PID2021–126230OB-I00), funded by the Spanish Ministerio de Ciencia e Innovación in the Call for Research Projects 2021–2023, led by Isidro Maya Jariego.
Competing interests
The authors declare no conflict of interest concerning the research, authorship, and publication of this article.




 Open access

