


1. Introduction
Japan has battled low-inflation levels since the combined stock and real estate markets crash of the late 1980s. The Bank of Japan (BOJ) struggled to meet its 2% target between 1990 and 2020, and the country spent much of the time in deflation. That pendulum has swung in the opposite direction following the COVID-19 pandemic. Global supply chain disruption and commodity price shocks drove Japanese inflation above 3%. Food prices grew significantly faster. Japanese inflation rose to its highest levels in over 30 years for reasons other than a concerted effort by the government and/or the BOJ to raise them. These dynamics put Japanese monetary policymakers in the novel position of having to convince the public that they can keep inflation down, following a generation of trying and mostly failing to bring it up.
This period in 2022–2023 allows for a unique opportunity to understand the public psychology of Japanese central banking similarly to how they are understood elsewhere. Who does a Japanese audience see as a credible ‘inflation fighter?’ When are Japanese central bankers understood as ‘conservative’ (Rogoff, Reference Rogoff1985) and able to ground public expectations in a low-inflation future? We approach that question through a gendered lens. Gender is typically overlooked in central banking-related questions, likely because there has not been much gender variation to analyse until recently. Women held 11% of Central Bank board seats globally as recently as 2000,Footnote 1 which lags women’s representation in national cabinets or parliaments.Footnote 2
There are good reasons to suspect female central bankers may be disadvantaged as public communicators. Successful central bankers must project traits—competence (Koenig and Eagly, Reference Koenig and Eagly2014; Correll and Ridgeway, Reference Correll and Ridgeway2006; Fiske et al., Reference Fiske, Cuddy, Glick and Xu2002), leadership (Koenig et al., Reference Koenig, Eagly, Mitchell and Ristikari2011) and counter-inflationary zeal—that social psychology and political science suggest are popularly associated with maleness (Scheve, Reference Scheve2004, Jayadev, Reference Jayadev2006, May et al., Reference May, McGarvey and Whaples2014).Footnote 3 When the public imagines a competent, inflation-fighting central banker, they likely imagine a man. Related work in the United States and Europe shows that the public perceives female central bankers as less trustworthy and less able to reduce inflation expectations, especially among male respondents (Bodea and Kerner, Reference Bodea and Kerner2022a, Bodea et al., Reference Bodea, Ferrara, Kerner and Sattler2021).
These themes are especially pertinent to Japan, where politics and society have long been male-dominated. According to the OECD, women make up 10% of the Japanese Diet, the lowest percentage among the OECD countries. The average OECD country’s parliament is approximately 33 percent female.Footnote 4 Women comprise 13.2 percent of management positions in Japanese firms, which is lower than Sweden (43 percent), the U.S. (41.4 percent), Italy (28.6 percent) and South Korea (16.3 percent) in 2021.Footnote 5 In central banking, the BOJ’s Policy Board has reserved a seat for a female central banker (except for 2019 and 2020), but the other seven board members and the chair have always been male. This puts the BOJ’s female representation (1 out of 9) in line with representation in other public leadership positions.
Women’s relative absence from electoral politics, central banking and business suggests that anti-woman bias may be more significant there than elsewhere. Especially to the extent that biases against women in central banking are tied to broader perceptions of women’s roles in the economy and society. But it is an interesting question in a country that for decades was more concerned with deflation than inflation. The typical association of central banking with inflation-fighting may be dulled in that context. Given that, the Japanese public may be particularly receptive to central bankers who do not fit the gender stereotype of an inflation fighter.
Does the Japanese public trust female central bankers? Do they take women seriously as potential inflation fighters? We answer those questions through a pre-registered online survey experiment implemented in September 2022. September 2022 is notable because rising prices brought an annual CPI inflation of 2.5% in 2022. That is low by global standards but considerably higher than it had been in Japan and higher than the BOJ target. Moreover, unlike prior inflationary episodes, this inflation was the product of post-COVID macroeconomic trends and not any purposeful attempt by the BOJ or the government to provoke inflation. For the first time in decades, the BOJ was tasked with controlling inflation, which it had not itself meant to create.
We recruited thousands of online Japanese survey takers to read identical informational vignettes about the Japanese economy, which we modelled on contemporaneous BOJ public communication. Our vignette used simplified languageFootnote 6 but otherwise mirrored the BOJ’s focus on acknowledging the inflation and assuring the audience of its resolve to pursue its mandate. We then asked respondents to report their beliefs about the economy’s likely trajectory and their confidence in the BOJ’s ability to manage it. Our key experimental intervention randomly attributed the informational vignette to male and female central bankers from the BOJ’s Policy Board. That allows us to compare reactions across survey takers whose only difference is the gender of the central banker to whom we attributed the communication.
Our results suggest a preference for male bankers, though one that is (a) limited to male survey takers and (b) smaller than the bias we previously found in the United States (Bodea and Kerner, Reference Bodea and Kerner2022b, Bodea and Kerner Reference Bodea and Kerner2023). Nonetheless, there is clear and statistically significant evidence of a male bias. Japanese men reported more trust in the BOJ and less concern for inflation when exposed to communications attributed to a male central banker. Notably, there was no such gender bias relating to concern for unemployment. That asymmetry suggests that men’s reactions to male and female central bankers are not purely due to a general bias towards men but at least partially to a more specific positive bias towards men’s ability to project themselves as inflation fighters.
2. Monetary policy, gender and institutional trust
Political economy models of monetary policy typically feature a generic central banker coordinating the economic expectations of workers, employers and debt holders. Doing so requires trust, which the academic literature normally ties to central bankers’ personal reputations and to institutional contexts that insulate decisions from electoral politics (Kydland and Prescott, Reference Kydland and Prescott1977, Rogoff, Reference Rogoff1985, Barro and Gordon, Reference Barro and Gordon1983, Bodea, Reference Bodea2010, Adolph, Reference Adolph2013, Bodea and Hicks, Reference Bodea and Hicks2015, Garriga, Reference Garriga2016, Ainsley, Reference Ainsley2017, Blinder et al., Reference Blinder, Ehrmann, de Haan and Jansen2022, Romelli, Reference Romelli2022). Central bankers’ personal backgrounds and reputations for inflation aversion should act as trust drivers for sophisticated audiences, including financial analysts, bankers, labour union leaders and others who plausibly know the central bankers’ identities, understand the tools at their disposal and appreciate their political and economic context. Career paths in the financial sector are considered especially strong signals of a central banker’s commitment to low inflation to this group.
However, central banks are increasingly cultivating ‘institutional trust’ (Angino and Secola, Reference Angino and Secola2022, p. 6)Footnote 7 through public communication. They do so through accessible web presences, financial education outreach, social media, listening events, public forums and speeches to reach lay audiences (Blinder et al., Reference Blinder, Ehrmann, de Haan and Jansen2022; Haldane, Reference Haldane2017; Binder, Reference Binder2017). That turns to ‘explain, engage and educate’ (Haldane et al., Reference Haldane, Macaulay and McMahon2020) necessarily engages members of the public with a limited understanding of central banking or monetary policy more broadly. The more commonly written-about trust drivers may not be as accessible or relevant. Such an audience is likelier to utilise more accessible heuristics for competence and credibility.
Gender could play a significant role here. Gender is a readily available, if crude, heuristic for the qualities central bankers typically want to exude.Footnote 8 People associate maleness with competence (Koenig and Eagly, Reference Koenig and Eagly2014; Correll and Ridgeway, Reference Correll and Ridgeway2006; Fiske et al., Reference Fiske, Cuddy, Glick and Xu2002), with capable leadership (Koenig et al., Reference Koenig, Eagly, Mitchell and Ristikari2011) and with economics more generally.Footnote 9 The conservative, inflation-averse brand of economics that defines modern central banking is especially male-coded. That male coding is evident in women being less concerned than men about inflation relative to employmentFootnote 10 and in the dovish way that the (American) media portrays female central bankers (Istrefi, Reference Istrefi2019). More broadly, progressive policy outcomes often accompany women’s political representation. Female political leadership, whether captured by parliamentary gender quotas, greater female participation in parliaments or political parties’ leadership, is associated with emphases on social justice, welfare expansion and higher health spending (Koenig et al., Reference Kittilson2011; Clayton and Zetterberg, Reference Clayton and Zetterberg2018). The mere fact of female enfranchisement has led to more public spending (Lott and Kenny, Reference Lott and Kenny1999), more social spending (Aidt and Dallal, Reference Aidt and Dallal2008) and higher family benefits (Ennser-Jedenestik, Reference Ennser-Jedenestik2017).
None of this implies that maleness makes an accurate heuristic for successful or conservative central banking. Even on the narrow issue of inflation aversion, evidence of gender differences across central bankers is mixed (Ainsley, Reference Ainsley2020).Footnote 11 And, of course, women can build countervailing personal reputations for competence and inflation aversion, though the success of such an effort requires an audience to pay close attention (Masciandaro et al., Reference Masciandaro, Profeta and Romelli2023). Our argument is not that women cannot successfully communicate economic policy to the general public but that being a man helps. For that audience, monetary policy is typically obscure, and broad heuristics like gender may be all they have to go on (Blinder et al., Reference Blinder, Ehrmann, de Haan and Jansen2022).Footnote 12 The public is not the only relevant audience, but it is an important one, particularly for the BOJ, as evidenced by extensive public opinion polling done very openly by the Bank.Footnote 13
This discussion leads to specific testable hypotheses:
H1. Communications attributed to female central bankers should be less able to elicit trust in the BOJ.
H2. Communications attributed to female central bankers should be less able to lessen concerns about inflation.
H3. Antiwoman bias should be stronger for inflation-related issues than for unemployment-related issues.
3. Data and research design
We tested our hypotheses using an online survey experiment. We recruited thousands of Japanese survey takers using Rakuten Insight, with quotas for respondent age, gender and prefecture. Our sample was nonetheless tilted toward male survey takers. 4,647 of our 5,567 completed surveys were from men, and 920 were from women. Due partly to that imbalance, we analysed male and female respondents separately. We fielded our survey experiment in September 2022.
Our experiment gives test subjects an informational vignette about the economy, which we randomly attribute to a male (Mr. Seiji Adachi) or female (Ms. Junko Nakagawa) central banker, along with an ungendered representation of the BOJ itself. Our design achieves realism by taking advantage of the fact that the BOJ’s Policy Board includes a female economist. Policy Board members give individual statements, but those statements are typically similar, such that the most salient difference is who is giving it and, in our context, their gender. We constructed our vignettes from statements given by Policy Board members and BOJ Statements on monetary policy in the months before we fielded our survey.
We intentionally do not include pictures of the central bankers to avoid contaminating our gender treatment with unintended treatments concerning attractiveness, age or other qualities discernible from pictures.Footnote 14 Ours is, therefore, an intentionally weak treatment, consisting of only female and male pronouns (she, his, etc.) and gendered titles (Mr., Ms., etc.).Footnote 15 When appointed, Mr. Seiji Adachi was perceived to be a dove on inflationFootnote 16, while Ms. Junko Nakagawa was perceived to be a moderate.Footnote 17 Both policymakers have acted dovishly on the BOJ’s Policy Board. In the unlikely event that survey takers were familiar with Mr. Adachi and Ms. Nakagawa, they have been portrayed similarly in the media.Footnote 18
We reproduced an English translation of the ungendered BOJ version of the treatment below. In the gendered versions of the treatment, ‘Bank of Japan’ is replaced with either Mr. Adachi or Ms. Nakagawa.
The Bank of Japan notes that the Japanese economy is recovering from the crisis of the new coronavirus. However, there remains uncertainty about the outlook for the year ahead, particularly with respect to employment and price stability.
According to the Bank, the unemployment rate has fallen to 2.7%, a very low level compared to the over 5% unemployment rate after the 2008 financial crisis. The inflation rate has risen to 1% and is expected to rise and approach the 2% target. Unlike other Western countries, Japan has not seen rapid wage growth linked to inflation.
Despite rising inflation, the BOJ supports continuing the Bank’s low interest rate policy. While that policy risks higher inflation, the BOJ maintains that it will stimulate the economy and promote wage growth and employment stability. The BOJ is confident that any further increase in inflation can be managed.
The Bank will continue to monitor the economy closely and take appropriate policy measures to achieve its goals of maximising employment and containing inflation.
Before the vignette, we collected the survey takers’ demographic information. We also asked questions about their political attitudes and their general trust in Japanese and international institutions. We also ascertained their financial sophistication, as assessed by their ability to answer two straightforward questions about inflation and interest rates.Footnote 19 Following the vignette, we asked survey takers a standard set of questions about their economic outlook, including concerns about inflation, unemployment and trust in the Central Bank.Footnote 20 Our questions asked respondents how concerned they were about unemployment and, separately, a price rise over the next 12 months. We also asked respondents how confident they were in the BOJ’s ability to manage national unemployment and inflation rates. Answers were given on a scale of 0 to 100, with 100 indicating the highest level of concern and confidence, respectively. We expect gender bias to manifest as a higher concern for inflation and lower levels of trust in the BOJ among survey takers we presented with information from the female central banker. We further expect that whatever anti-women bias we observe in inflation concerns should be muted in unemployment concerns, which is less ‘male coded’.
4. Analysis
We first analyse the data on an intention-to-treat (ITT) basis, relying on the randomisation process to generate balance in observable and unobservable survey-taker-specific characteristics.Footnote 21 Analysing these data on an ITT basis ignores the variation in treatment uptake, though we return to the potential non-random treatment uptake in subsequent analyses.
We report these results first as descriptive statistics, as shown in Table 1. We report these statistics and all subsequent estimates for the full sample and then separately for male and female survey takers. Doing so reflects the gender imbalance of the sample. It is also in keeping with our presumption of a ‘gender affinity effect’,Footnote 22 such that male and female survey takers react differently to male and female Central Bank representatives. The first three columns in Table 1 (from the left) show average levels of confidence in the BOJ, concern for inflation and concern for unemployment. We measured each on a 0–100 basis, with 0 indicating more confidence/concern.
Descriptive statistics
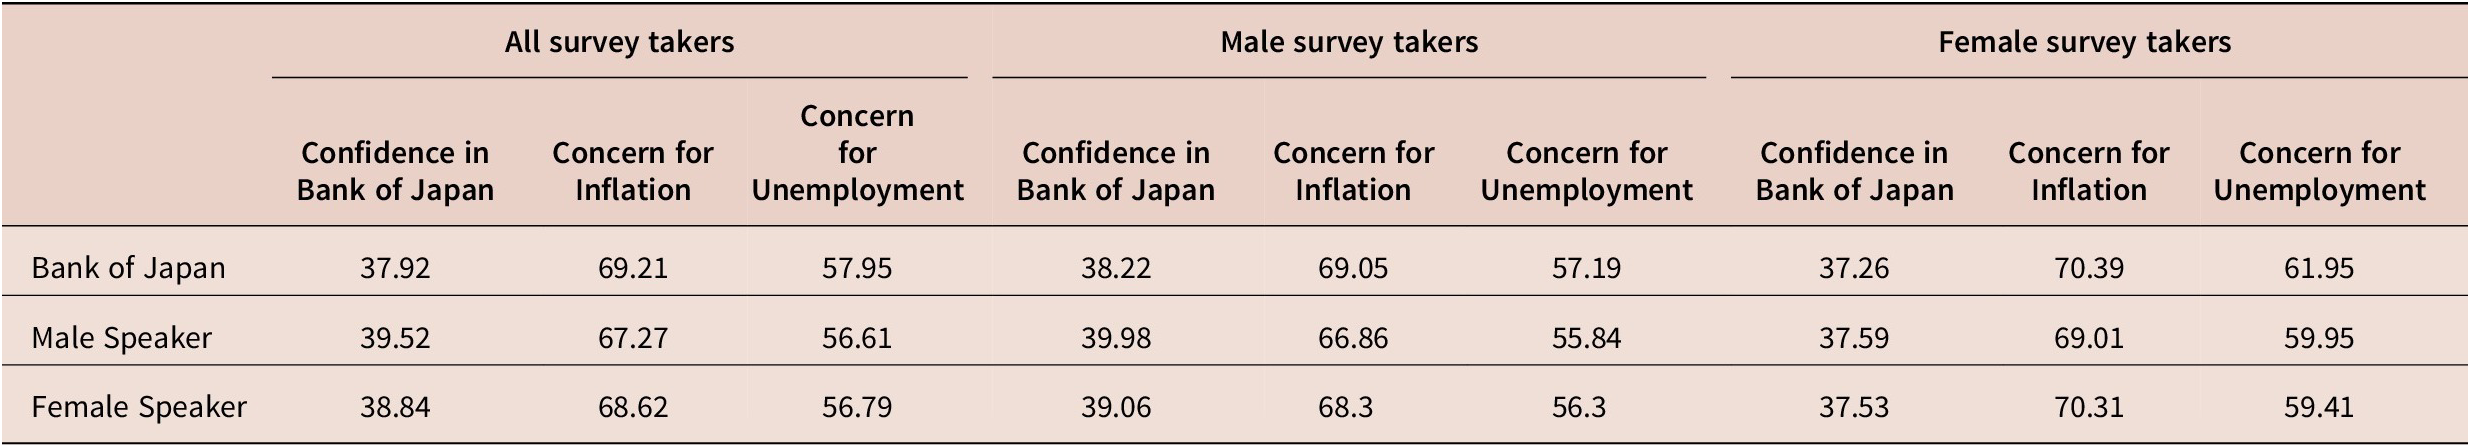
Average response to selected survey questions across treatment groups. The variables measured are: 1) How much trust the survey taker has in the Bank of Japan (0–100 scale); How concerned the survey taker is about inflation, respectively unemployment (0–100 scale).
Our theory suggests that the public should favour male speakers over female speakers, which appears to be the case. Both human speakers (male and female central bankers) produced better results than an ungendered institutional representation of the BOJ, but the male speaker performed better by a larger margin. For confidence in the BOJ and concern for inflation, women perform about 1 percentage point better than the BOJ, while men perform 2–2.5 percentage points better. There is less evidence of a gender gap in concern for unemployment. Male and female speakers performed almost identically on this measure, each performing about one percentage point better than the BOJ.
These differences are modest—a 2.5 percentage point gap between the male speaker and the BOJ representation represents roughly 1/10th of a standard deviation. It is also modest compared to the amount of gender bias in the United States we found in our other work.Footnote 23 But they are theory-consistent. Moreover, the lack of any analogous gender gap relating to peoples’ concerns about unemployment is consistent with the idea that the observed gender gap reflects a central banking-specific expression of gender bias rather than a more general preference for men in positions of authority. This, too, is consistent with our American findings.
The middle and rightmost three columns in Table 2 separately replicate the descriptive statistics noted above for male and female survey takers. The ‘gender affinity effect’ suggests that the anti-female bias in the full sample should be more pronounced in the male-only sample and potentially reversed in the female-only sample. These data indicate that gender bias is prominent in the male-only subgroup and virtually non-existent in the female-only subgroup. There is no indication in these data that Japanese women show any meaningful preference for female central bankers.
OLS regressions
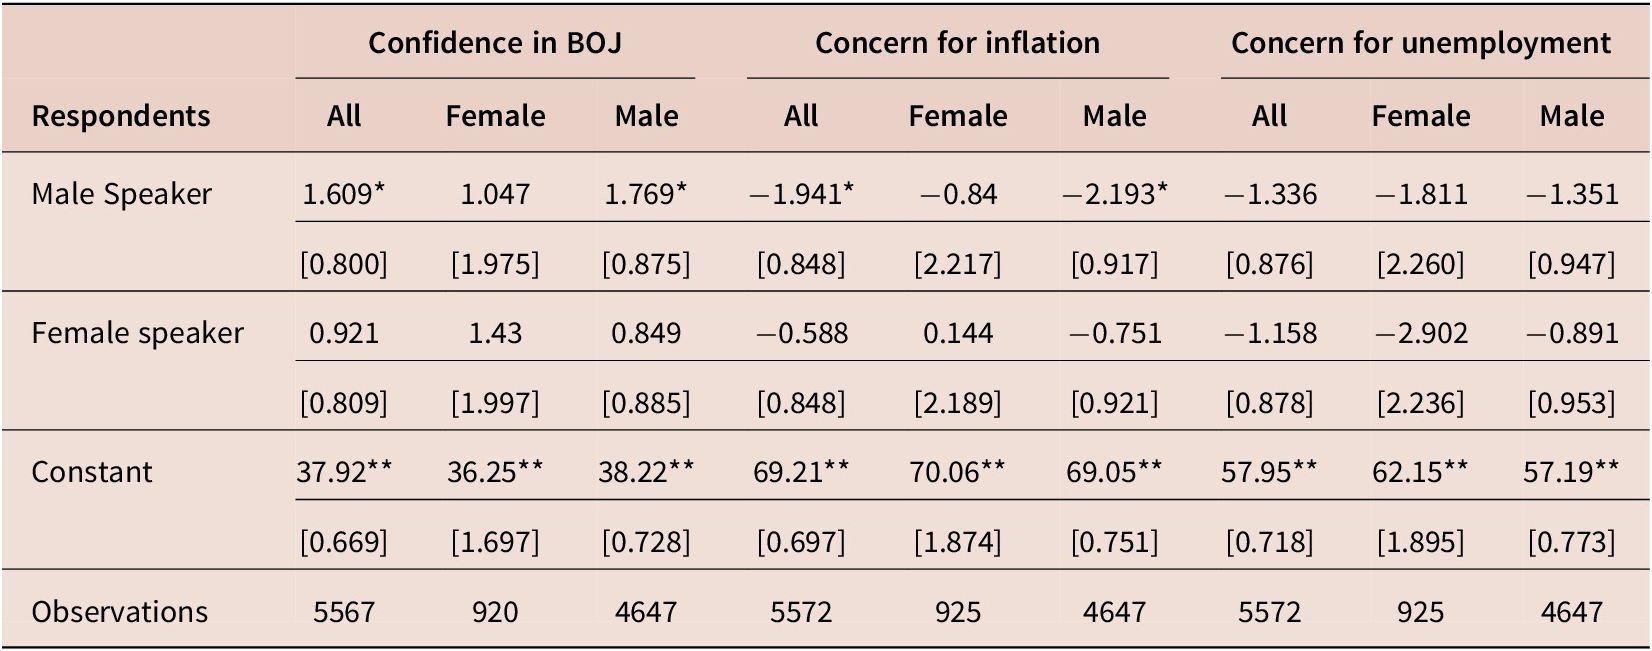
Standard errors in brackets.
+ p < 0.10, * p < 0.05, ** p < 0.01.
Reference category speaker is the Bank of Japan.
Table 2 analyses those same differences through simple OLS regressions. The dependent variables are the survey taker’s confidence in the BOJ, their concern for inflation and their concern for unemployment. The independent variable indicates which of the three treatment groups we assigned the survey taker to. We use the genderless BOJ category as our baseline, such that the coefficient on male speaker/female speaker indicates how much more or less concern is induced by attributing that information to a male /female speaker. Negative coefficients on female speaker suggest that women are disfavoured relative to a genderless baseline, and positive coefficients on male speaker indicate that male central bankers are favoured relative to a genderless baseline. Either or both would be consistent with the premise of gender bias in Central Bank communicative authority.
We report the results of these models in Table 2. These results corroborate the distinctions in the raw data. Moreover, they show that the increase in trust and decrease in inflation concern that accompanies a male central banker is statistically significant. The gap between the trust generated by a female central banker and a genderless representation of the BOJ is not statistically significant.Footnote 24 These patterns hold for the full sample and a male-only sample. They do not hold in a female-only sample, for whom none of the differences across treatment groups are statistically significant.
4.1. Gender bias and treatment uptake failure
Our next set of models considers the possible influence of non-random treatment uptake. Our particular concern is that survey takers with a strong presumption that central bankers are male disproportionately fail to notice that the female central banker was female. Table 3 characterises treatment uptake patterns. As can be seen, men were substantially less able to correctly identify the female central banker’s gender (68%) than they were male central banker’s gender (85%). Female survey takers were more equally able to identify male (72%) and female (75%) central banker’s gender.
Treatment uptake %, by treatment group
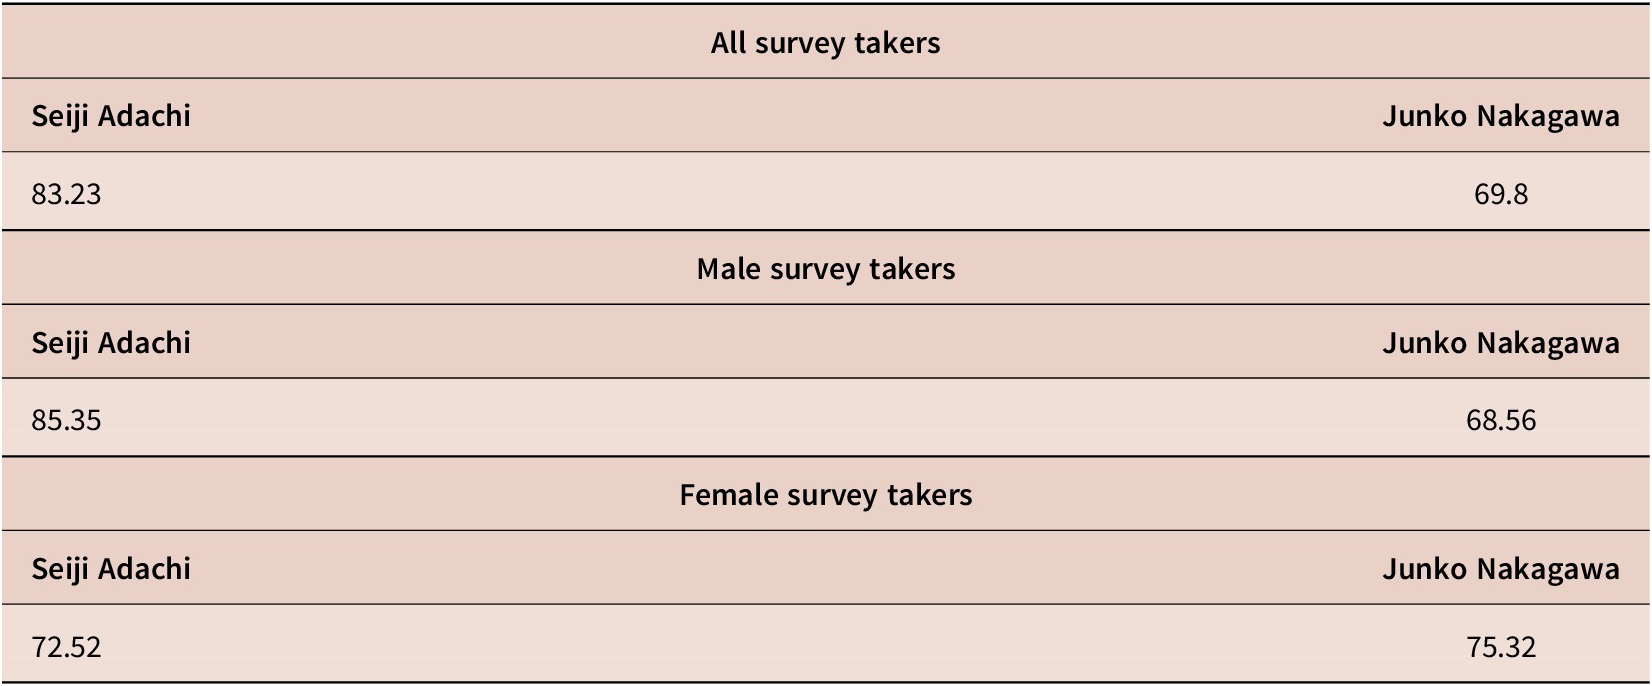
That frequent inability to correctly recall gender—particularly in the male respondent sample—may be important. Roughly a third (31%) of our survey takers in the female treatment groups did not realise that they were in the female treatment group. This suggests that estimates based on the ITT may substantially underestimate the effect of that treatment (whatever it may be) on the treated. A more pressing concern is that this failure to notice the treatment is almost certainly non-random. Men were much less likely to recognise female central bankers as female, and it is likely that failing to notice that a speaker was a woman correlates with qualities that might also shape how they react to women as central bankers. If sexist men were likelier to assume that a central banker is a man even if they were not—which the data support, based on a battery of sexism questions we asked based on Schafner’s latent sexism indexFootnote 25—it would suggest that the survey takers who were most likely to react better to male than female treatments are also less likely to be treated.
We account for that by re-estimating our models based on the average treatment effect on the treated (ATT) while adjusting for the likelihood of non-random treatment uptake. Analysing the data without adjusting for that would undermine randomisation across treatment groups. We adjust for the non-random treatment uptake with Cattaneo’s (Reference Cattaneo2010) inverse probability-weighted treatment effects estimator. This estimator—implemented in Stata using the teffects routine—estimates the ATT for a multivalued treatment when selection into treatment groups is only conditionally random and tied to a set of observed characteristics. ATT treatment effects are then derived via a weighted regression estimated in the second step.Footnote 26 Our selection equations include the survey taker’s age, how long it took them to complete their survey (logged, measured in seconds), financial literacy, self-identified political identification along a left–right continuum and their sexism, as determined by Schafner’s latent sexism index.
We report these regressions in Table 4. The results are similar to those in Table 2. Even accounting for non-random treatment uptake, men were biased toward male central bankers in our experiment. Women did not, as before. Accounting for non-random selection into treatment uptake suggests a slightly larger pro-male bias in confidence in the BOJ but a nearly identical (though somewhat less precisely estimated) pro-male bias related to confidence in inflation. There is no meaningful effect on women’s lack of gender bias.
Treatment effects regressions
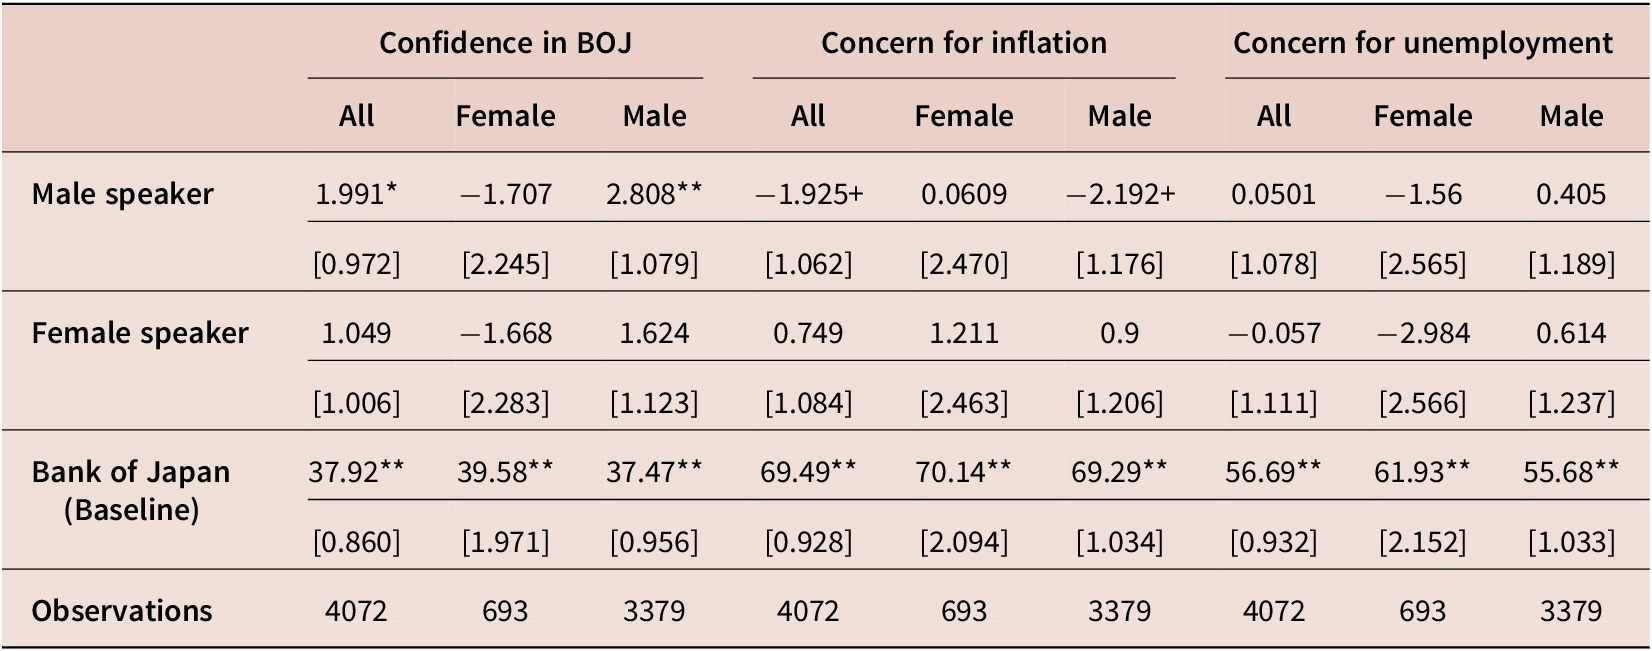
Standard errors in brackets.
+ p < 0.10, * p < 0.05, ** p < 0.01.
Selection equation includes: logged duration, ideological orientation, financial literacy, sexism.
5. Conclusion
Our research suggests that Japanese men react better to male central bankers than female central bankers. When the BOJ is represented by a man, Japanese men trust it more and are less concerned about its ability to fight inflation.
The scale of this bias is small, especially when compared to the analogous bias in the United States, but it is clearly present in our data. That relatively small bias is surprising, given Japan’s limited progress in increasing female representation in business, politics and at the BOJ. American women are far better represented in those arenas, but American survey takers were less likely to recognise female central bankers’ gender and had much higher levels of bias towards male central bankers. On average, Americans were about 10 points (out of 100) more confident in the Federal Reserve when it was represented by a male Central Bank versus a female Central Bank speaker.
Future research should consider why this gap is so large. Here, we can offer some speculations. Some of that difference may be due to relatively low levels of trust in the BOJ. Japanese survey takers had less trust in the BOJ than Americans did in the Federal Reserve.Footnote 27 Even relative to a Japanese baseline, the BOJ’s own surveys indicate trust in the institution was considerably lower in late 2022 (during its inflationary period) than before.Footnote 28 That low baseline level of trust may have muted gender differences by undermining the idea that people can trust male central bankers in that role. It may also be that Japanese women’s scarcity in powerful positions grants female leaders an ‘outsider status’ that limits their perceived responsibility for Japan’s problems. The lack of female leaders might reduce the public’s propensity to connect female leadership to negative outcomes.
Putting aside the question of ‘why’, our finding that a bias against women in central banking exists in Japan just as it does elsewhere is important and timely. Trends in central banking are moving towards more public communication and more female representation. Our findings show how closely the fate of those trends are tied together. Public-facing economic policymakers, including at the BOJ, often aim to establish trust with the public. A public that systematically withholds trust from female policymakers hampers the appointed female leaders and plausibly undermines others from making it through the selection process. If a policymaker’s job is to be trusted, popular perceptions that women will not be trusted can create enduring and consequential barriers. As the Financial Times recently suggested about women’s underrepresentation in central banking, ‘The struggle to recruit women [into central banking] may be linked to embedded stereotypes. The world of money has, historically, been the province of men’.Footnote 29 Overcoming those perceptions requires confronting the realities that underlie them. In the case of Japan, male respondents are less likely to recognise Ms. Junko Nakagawa as representing the BOJ, and they trust the BOJ slightly less when she does. Knowing that the bias in 2022 was small can help make the case to increase women’s representation in the traditionally male-dominated BOJ Policy Board.
Funding statement
Murata Foundation provided the funding used for our online survey experiment in Japan.


 Open access