


To some, charcoal may seem a dead or insignificant technology largely limited to backyard barbeques, but charcoal, as the primary fuel for iron production in the eighteenth and nineteenth centuries, powered the Industrial Revolution and the economic rise of the United States (e.g., Bonhage et al. Reference Bonhage, Hirsch, Raab, Schneider, Raab and Ouimet2020; Johnson and Ouimet Reference Johnson and Ouimet2018, Reference Johnson and Ouimet2021; Kemper Reference Kemper1941; Knowles Reference Knowles2012; Rolando Reference Rolando1992; Straka Reference Straka2014; Straka and Ramer Reference Straka and Ramer2010; Williams Reference Williams2020). Yet, the significance of charcoal production to history is not geographically limited to the United States (e.g., Bekele and Girmay Reference Bekele and Girmay2014; Carrari et al. Reference Carrari, Ampoorter, Bottalico, Chirici, Coppi, Travaglini, Verheyen and Selvi2017; Raab et al. Reference Raab, Bonhage, Schneider, Raab, Rösler, Heußner and Hirsch2019; Schneider et al. Reference Schneider, Takla, Nicolay, Raab and Raab2015; Werbrouck et al. Reference Werbrouck, Antrop, Van Eetvelde, Stal, De Maeyer, Bats and Bourgeois2011). Nor is charcoal production solely an industry of the past—it continues around the world today (e.g., Alfaro and Jones Reference Alfaro and Jones2018; Kato et al. Reference Kato, DeMarini, Carvalho, Rego, Andrade, Bonfim and Loomis2005; Rembold et al. Reference Rembold, Oduori, Gadain and Toselli2013; Rodrigues and Braghini Junior Reference Rodrigues and Junior2019). The Food and Agricultural Organization estimates that approximately 53 million tonnes (58 US tons) of charcoal were produced worldwide in both 2018 and 2019 (FAOSTAT 2021). Historical research on the charcoal industry helps to contextualize modern processes and may provide options that no longer exist but remain viable. Similarly, this research can aid our understanding of how past practices have impacted modern landscapes (e.g., Deforce et al. Reference Deforce, Groenewoudt and Haneca2020; Donovan et al. Reference Donovan, Ignatiadis, Ouimet, Dethier and Hren2021; Mikan and Abrams Reference Mikan and Abrams1995, Reference Mikan and Abrams1996; Schneider et al. Reference Schneider, Hirsch, Raab and Raab2019; Tolksdorf et al. Reference Tolksdorf, Elburg, Schröder, Knapp, Herbig, Westphal, Schneider, Fülling and Hemker2015). The following are the questions at the heart of this research:
(1) How was charcoal produced?
(2) What was the impact of charcoal production on the landscape?
(3) How do we recognize that impact?
(4) How do we better understand the social aspects of charcoal (and iron) production?
The answers to Question 1 are relatively well understood, and the Pennsylvania variant is described below. Although Question 2 is the proximate impetus behind this research, at this point, we primarily address Question 3. Our research focuses on identification of relict charcoal hearths (or RCHs) and ignores other components (such as transportation). RCHs are the relatively small (ca. 10–15 m in diameter) features that remain from the process of making charcoal that are distributed (ca. 80–150 m from each other) across the landscape. Similarly, through this research and that of others, we are slowly improving our ability to address the social aspects of charcoal. Because charcoal is produced deep in the woods, well away from society, it is often associated with strangeness, wildness, and difference. Though not addressed here, this is one of the central reasons why charcoal production played an important role in the Underground Railroad in the mid-1800s (LaRoche Reference LaRoche2017).
Given these questions, the primary goal of this research is to recognize the impact of charcoal production. First, we discuss ways that the impact of charcoal production has been considered. Second, we discuss the process of charcoal production and how a single instance of charcoal production leaves behind identifiable remains on the landscape. Then, we use lidar (light detection and ranging, also known as airborne laser scanning, or ALS) data openly provided by the state of Pennsylvania. Lidar is particularly useful because this remote sensing technique allows us to model the ground surface, especially in densely forested areas, across broad swaths of the landscape that are difficult to comprehend otherwise. Then, we utilize an array of open source tools that enable us to use a type of artificial intelligence known as “deep learning” to identify RCHs across the state of Pennsylvania.
Deep learning is a type of machine learning that employs user-provided identification (in this case, user-recognized RCHs in digital images) to create a generalized model. It then uses this abstraction to identify arrangements of pixels similar to the training data. Deep learning is particularly valuable in this situation because we are able to use it to identify additional RCHs that are generally like those in the training set but not precisely the same as any individual RCH in the training set. This also means that with the appropriate computer power, we are able to identify RCHs across large extents of area (in this case, 28% of the state of Pennsylvania).
In order to carry out this research, we employ open data, open tools, and open publishing. The original data are supplied by the state of Pennsylvania. All of the tools used to process the data are open, including QGIS (with plugins noted below), GeoPandas, GDAL, Mask R-CNN, Keras, and TensorFlow. All code constructed to use these tools has been published via Zenodo, as has the resultant data.Footnote 1
The project employed a computer with the following specifications: GPU: TITAN V / 5120 CUDA Cores / 12G; vCPU: 6; RAM: 24GB; Disk Space: 64GB; and O/S: Ubuntu 18.04. Although consumer-grade laptops and desktops have less power, training a deep learning model is possible but would take longer. A cloud-based service that offers GPU processing, such as Google Colaboratory, is another option. Although the free version has some limitations, the paid Pro version ($10/month) does not. With the setup described above, processing time varied by the number of epochs a model was trained for. The processing time for an individual epoch, with 663 training images, was approximately 3 minutes. Most models were trained in the range of 16–40 epochs, which equates to around 1–2 hours. These were often left to run overnight, hence the “dreaming” computers of the title.
ESTIMATING THE IMPACT OF CHARCOAL PRODUCTION
It is easy to realize that an industry that converted large numbers of trees into charcoal had a significant impact on the landscape. Yet, the full impact of charcoal production on the landscape is difficult to determine. It is clear that the amount of charcoal consumed varied by iron furnaces and forges, and their impact on forests and landscapes varied (Straka Reference Straka2014). Because little historical data was recorded specifically on charcoal production, iron production is often used as a proxy. This is reasonable because the primary—though not sole—purpose of charcoal was as fuel for smelting and forging iron. Care must be exercised because in the 1830s, some iron furnaces began using coal, so we must be able to differentiate between coal- (and coke-)fired furnaces and charcoal furnaces (e.g., Knowles Reference Knowles2012:Figure 10; Williams Reference Williams1989:Figure 10.5). However, even with the initial use of mineral coal in iron furnaces, charcoal continued to be used to fuel iron production—especially for certain components such as railcar wheels—into the early twentieth century. Although the overall production of charcoal furnaces varied, their contribution to the total iron production of the nation declined (Schallenberg Reference Schallenberg1975, Reference Schallenberg and Hindle1981; Williams Reference Williams1989:Figure 10.5). The last charcoal furnace “went out of blast” (i.e., was shut down) in 1945 (Schallenberg Reference Schallenberg1975:341).
We have a fairly good accounting for iron production (e.g., American Iron and Steel Association 1876, 1878, 1880, 1882, 1884, 1886, 1890, 1892, 1894, 1896; Lesley Reference Lesley1866), but how much charcoal was needed per unit (i.e., ton) of iron? Straka (Reference Straka2014) finds that estimates for the amount of charcoal needed per ton of iron range greatly, from approximately 25 bushels to 200 bushels (see also Whitney Reference Whitney1994:Table 9.4). This broad range is due to wide variation in a range of variables including wood type (e.g., pine vs. oak), ore composition, technology used (e.g., cold blast vs. hot blast), expertise of the iron master and the collier (the “charcoal burner”), the size of a “bushel” (Birkinbine Reference Birkinbine1879:150; Straka Reference Straka2017:60), and even the location of the furnace. Additionally, the size and efficiency of charcoal furnaces changed through time. Schallenberg and Ault (Reference Schallenberg and Ault1977:445; Williams Reference Williams1989:339) report that charcoal consumption at “advanced” iron furnaces from the Midwest in the late 1800s ranged from around 73 to 114 bushels of charcoal per ton of iron (Hillstrom and Hillstrom Reference Hillstrom and Hillstrom2006:165–166; Whitney Reference Whitney1994:Table 9.4). These increasingly efficient furnaces were significantly larger and often located in the Midwest (especially Michigan) and the South, replacing the older, smaller, and less efficient furnaces of the East (especially Ohio and Pennsylvania; Schallenberg and Ault Reference Schallenberg and Ault1977; Williams Reference Williams1989:339). Given this variation, using the amount of iron produced to determine the amount of charcoal required for its production would provide an estimate with a very wide range. Trying to understand the impact of that charcoal production on the landscape is even more difficult.
Assuming that we can estimate the amount of charcoal needed to produce a ton of iron, converting the number of bushels of charcoal used to acres of land is made difficult by a wide range of factors, such as the size/age of the trees, the expertise of the collier, the water content of the wood, and the species of the tree (Straka Reference Straka2014; Svedelius Reference Svedelius1875). Gordon (Reference Gordon1996:40) draws out an example of a calculation: a furnace that consumes approximately 356,000 bushels of charcoal annually requires approximately 600 acres of forest per year. Therefore, assuming reuse after 20 years, the furnace requires roughly 12,000 acres of land to be sustainable (see also Whitney Reference Whitney1994:222, Table 9.4). To understand the scale of forest depletion across the United States, Birkinbine (Reference Birkinbine1879:150) calculated that the production and forging of iron in 1877 resulted in the cutting of approximately 147,000 acres of woodland and, in 1879 (Birkinbine Reference Birkinbine1881:66), approximately 50,000–65,000 acres. Yet, it is unlikely that the production decreased threefold in two years. Williams (Reference Williams and Conzen1990:163) estimates that between 1855 and 1910, 3,000–4,800 square miles (ca. 2–3 million acres) of forests were converted into charcoal to feed iron furnaces, but he also reminds us that this is only about 0.8%–1.3% of the forest cleared at that time—most clearance was due to agricultural expansion (Whitney Reference Whitney1994:222). But because of the variables described above, these are all rough and divergent estimates that are difficult to apply.
The impact of charcoal production was also not equal across landscapes but focused on specific types. Until 1870, the majority of charcoal used in a charcoal iron furnace was from woodlands within 3–8 km (2–5 miles) of the furnace (Whitney Reference Whitney1994:224). This suggests that the preferred location of iron furnaces would be on landscapes with approximately 3–8 km (2–5 miles) of forest that were less than desirable for agriculture—what Bernhard Fernow (Reference Fernow1883:153–155; Rodgers Reference Rodgers1991:24–25) called “waste places.” The use of these “waste places” would be especially true for landscapes where the majority of arable land was already occupied. Throughout much of Pennsylvania, charcoal production centered on dry, nonarable lands such as rocky mountains (see Johnson and Ouimet Reference Johnson and Ouimet2021). Fernow observed that the Lehigh Furnace lands on the Blue Mountain, which he managed from 1879 to 1887, remained unsuitable for agriculture. This is not necessarily true for some of the earliest furnaces—such as Henry Furnace in Nazareth, Pennsylvania (Jones Reference Jones, May, Repsher, Saltern, Wilson and Toth1976)—where, when it was in operation, the landscape included limited agriculture along with charcoal lands. Today, most of the charcoal lands around the Henry Furnace have likely been converted into farmland and residential developments.
All in all, researchers have had limited success using iron production to quantify and clarify the impact of charcoal production on landscapes. The research reported in this article takes a different approach. We turn to the archaeological remains of charcoal production. In particular, we focus on “relict charcoal hearths” (RCHs), which represent past charcoal production. But to understand the impact of charcoal production on the landscape, the reader must understand how charcoal is produced.
CHARCOAL PRODUCTION
Charcoal production is a relatively simple technology that requires dirty, physical labor as well as a detailed knowledge of a wide range of variables that can be only partially controlled (Diderot and d'Alembert Reference Diderot and d'Alembert2010 [1765]; Kemper Reference Kemper1941; Overman Reference Overman1854; Straka Reference Straka2014; Straka and Ramer Reference Straka and Ramer2010; Svedelius Reference Svedelius1875). Until the late nineteenth century, the majority of charcoal was made by placing hearths close to the wood. Wood was cut during the winter when it contained less sap, allowing it to dry faster and more completely and when woodcutters, who were normally off-season farmers and colliers, were available. The wood was stacked in 1.2 m (4 ft.) lengths near where it was cut—often on the downhill side of the lot.
Then, a collier built a hearth near the wood. Hearths were flat, level circular areas cleared of stones and roots approximately 10–15 m in diameter (Kemper Reference Kemper1941:8; Straka Reference Straka2014:106; Walker Reference Walker1966:242). Hearths were flat, smooth, compacted surfaces to minimize moisture, ensure even burning throughout the mound, and avoid collecting soil and other contaminants when raking out the charcoal (Straka Reference Straka2014:106). On slopes, this often meant digging into the hillside and pitching the dirt downhill, which not only created the round, flat hearth but also resulted in steep banks on the uphill and downhill sides of the hearth (Figure 1a) (e.g., Donovan et al. Reference Donovan, Ignatiadis, Ouimet, Dethier and Hren2021).
(a) Two colliers removing charcoal from the meiler. The underlying flat, circular hearth can be seen excavated into the slope; Wayne National Forest, Ohio, May 1942 (National Archives, Record Group 95: Records of the Forest Service, 1870–2008, National Archives Identifier: 2129419; Local Identifier: 419985). (b) A simplified cross section of a meiler ready to be ignited (image by Jeff Blackadar).
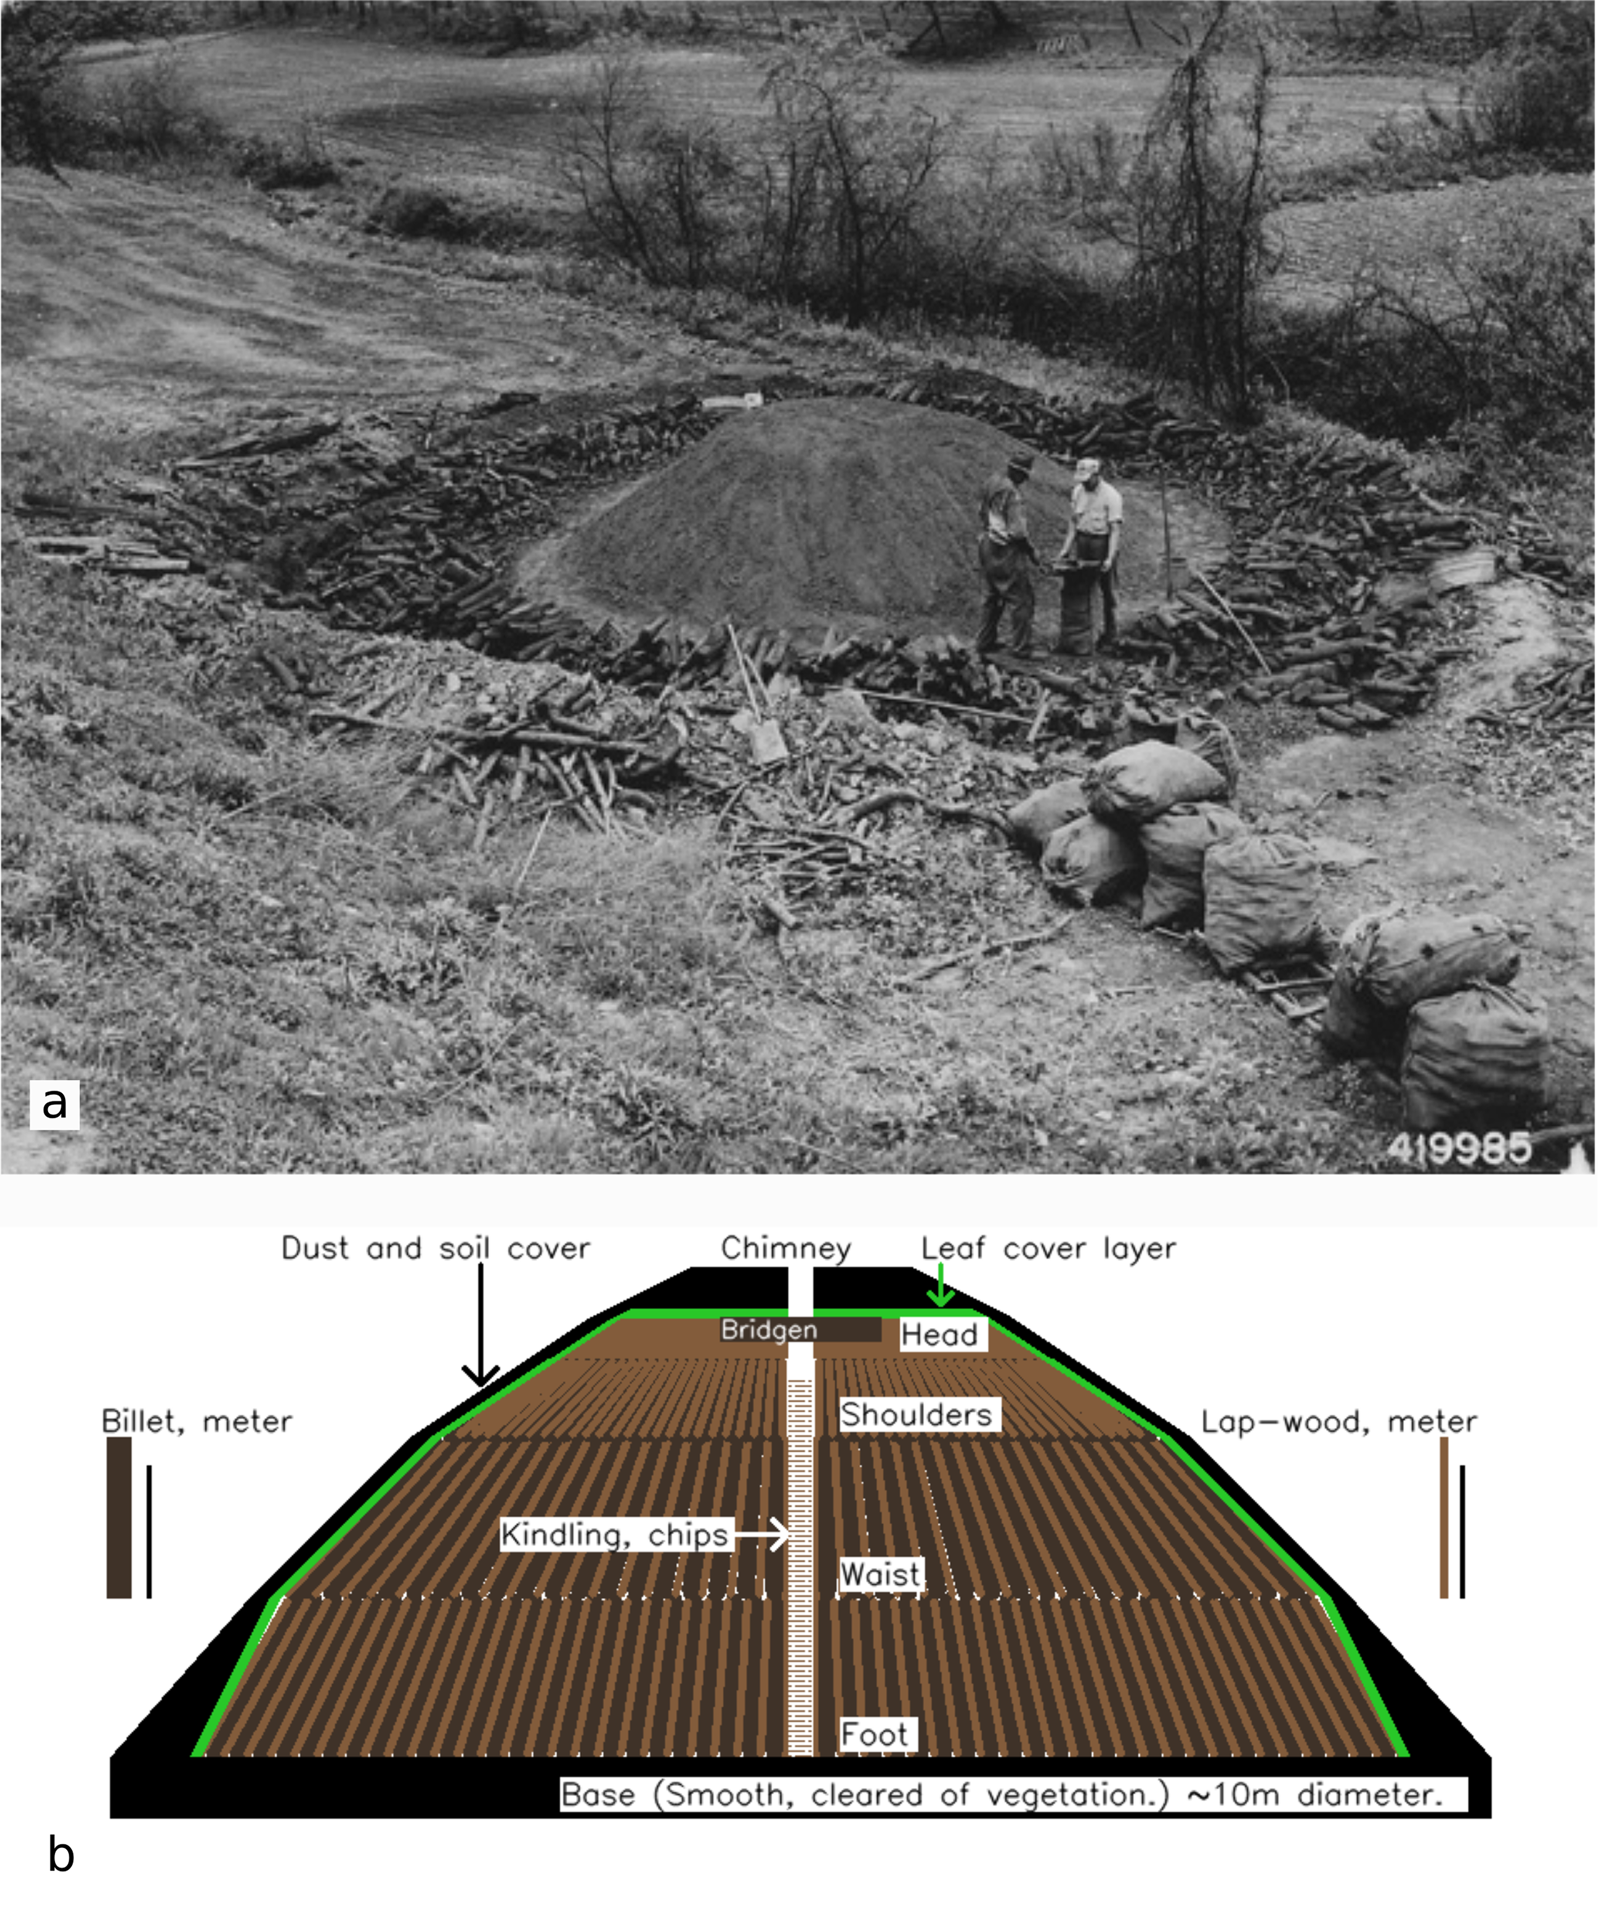
On the hearths, the collier created a mound of wood stacked in a very specific manner known as a “meiler.” First, the collier built a triangular chimney composed of overlapping lengths of wood with a central opening of approximately 20 cm (8 in.) in the center of the hearth. Three layers of densely packed wood was stacked vertically, leaning inward against and around the chimney and extending out to the edges of the hearth (Kemper Reference Kemper1941:10). The result was a large, dome-shaped pile of tightly packed wood, which was covered with a layer of leaves, hay, or pine needles. This was subsequently covered with a layer of earth (Figure 1b) and, ideally, charcoal dust from a previous use (Kemper Reference Kemper1941; Straka Reference Straka2014; Straka and Ramer Reference Straka and Ramer2010; Svedelius Reference Svedelius1875; Walker Reference Walker1966).
Once the meiler was constructed, it was fired. The goal, however, was not to burn the wood but to distill it by separating the solid carbon (as charcoal) from the water, sap, and volatile compounds (Overman Reference Overman1854:102–117). The resultant charcoal is relatively free of contaminants, is solid, and burns hot, making it ideal for iron furnaces. To distill the charcoal, the collier first ignites the pile through the chimney, but once the fire catches, it is also closed off. To keep the pile hot enough (between 270̊C [518̊F] and 400̊C [752̊F]; Straka Reference Straka2017:59), the collier opens and closes air holes near the base of the meiler. Although the meiler must be monitored and managed constantly for the first 24–48 hours, after that, the collier checks on it periodically over the next 10–14 days. Colliers frequently made charcoal eight months out of the year (with the exception of the winter), with up to eight meilers in process at any given time (Kemper Reference Kemper1941; Straka Reference Straka2014; Straka and Ramer Reference Straka and Ramer2010; Svedelius Reference Svedelius1875; Walker Reference Walker1966).
When the wood in the meiler was converted into charcoal, the charcoal was separated from the earth and debris using rakes with large wooden tines (Figure 1a). This is done carefully because the charcoal can easily catch fire, potentially destroying all of the charcoal. The earthen covering often ends up as a ring of earth around the edge of the hearth. Charcoal was then loaded onto specialized carts and transported to the furnace or forge (Kemper Reference Kemper1941; Straka Reference Straka2014; Straka and Ramer Reference Straka and Ramer2010; Svedelius Reference Svedelius1875; Walker Reference Walker1966).
Visible remains from the process described above are present on the modern landscape. Primary among these are RCHs, but others include the remains of roads and colliers’ huts. Importantly, RCHs have been recognized using derivatives of high-resolution lidar scanning (e.g., Bonhage et al. Reference Bonhage, Hirsch, Raab, Schneider, Raab and Ouimet2020, Reference Bonhage, Eltaher, Raab, Breuß, Raab and Schneider2021; Carter Reference Carter2019a; Donovan et al. Reference Donovan, Ignatiadis, Ouimet, Dethier and Hren2021; Hirsch et al. Reference Hirsch, Raab, Ouimet, Dethier, Schneider and Raab2017; Johnson and Ouimet Reference Johnson and Ouimet2018, Reference Johnson and Ouimet2021; Kazimi et al. Reference Kazimi, Thiemann, Sester, Vento and Percannella2019; Raab et al. Reference Raab, Takla, Raab, Nicolay, Schneider, Rösler, Heußner and Bönisch2015; Risbøl et al. Reference Risbøl, Bollandsås, Nesbakken, Ørka, Næsset and Gobakken2013; Schmidt et al. Reference Schmidt, Mölder, Schönfelder, Engel and Fortmann-Valtink2016; Schneider et al. Reference Schneider, Takla, Nicolay, Raab and Raab2015). To simplify, lidar is a technology that uses plane-mounted lasers to measure the altitude of the earth's surface and create a point cloud of the surface (for a detailed description, see Fernandez-Diaz et al. Reference Fernandez-Diaz, Carter, Shrestha and Glennie2014; Opitz Reference Opitz2013; see also Opitz and Hermann [Reference Opitz and Herrmann2018] for a review of remote sensing in archaeology). In Pennsylvania, the resolution of this scan is approximately one laser shot per 1.5 m2. The data can then be converted to a digital elevation model (DEM), which is similar to a digital photograph in that each pixel, instead of being associated with numbers that represent colors, is the altitude of that pixel. Two of the most common ways a DEM can be visualized is as a hill-shade (or shaded relief) and as a slope analysis. From these, RCHs can be manually recognized (e.g., Carter Reference Carter2019a, Reference Carter2019b; Raab et al. Reference Raab, Takla, Raab, Nicolay, Schneider, Rösler, Heußner and Bönisch2015).
A DEEP-LEARNING APPROACH TO RCH IDENTIFICATION
Our approach here employs these lidar derivatives on a large scale. The rich detail across a large region (ca. 37,000 km2) makes it difficult, if not impossible, to identify these RCHs manually. Visually scanning images for examples of RCHs is labor intensive (but see Bonhage et al. Reference Bonhage, Eltaher, Raab, Breuß, Raab and Schneider2021). Due to advances in deep learning, an automated scan of images is more feasible for large landscapes. Although our purpose is to assess charcoal production across Pennsylvania, rather than including the entire state of Pennsylvania in our sample, we focused our attention on State Game Lands (SGLs). The SGLs are a proxy for “waste lands” discussed above. It was clear that, like SGL 217 (Carter Reference Carter2019a, Reference Carter2019b; Conner Reference Conner2018), many of these lands were previously used for charcoal (and lumber), but when they became unproductive, they were acquired by the state. Additionally, because much of the area outside SGLs are developed, RCHs are difficult to identify. We included a 1 km buffer around all SGLs to both catch some undeveloped land not owned by the state and demonstrate whether or not we could identify RCHs in residential areas.
Deep learning is a type of artificial intelligence that can recognize similar patterns directly from data, such as images. Generally speaking, deep learning recognizes patterns using multiple processes that abstract and amplify common attributes in a set of images (LeCun et al. Reference LeCun, Bengio and Hinton2015). These multiple processes are known as “layers,” and they represent the depth of deep learning. An assembly of layers represents a Convolutional Neural Network. These are also known as ConvNets or CNNs, and they are computer representations of patterns.
As each layer of representation amplifies and abstracts aspects of an image, it builds a generalized model to recognize other similar patterns. With the composition of enough layers and repetitions of training, this computer model can learn to recognize complex patterns and objects. This is important, given that we want to generally recognize the features of RCH that vary due to topography or size, not just a particular RCH.
We structured our sample around available lidar data provided by Pennsylvania and the organization of that data. We used the vector file of SGLs provided by the state and added a 1 km buffer. We identified overlapping lidar data using the tile index vector. Because the tile index contained the download link for the lidar data within its attributes, this allowed us to automate downloading and organizing the data by SGL. The result was one file folder per SGL that contained all lidar tiles. Over 4,000 LAS files (the native format for lidar)—a total of about 350 gigabytes of data in zipped files—was downloaded and unzipped. Because there was some overlap in the tiles included between SGLs, 3,925 of these tiles were unique, representing 28.4% of the entire state (Figure 2).
Map indicating all Pennsylvania State Game Lands showing those included in training the model and the lidar tiles used for this study (image by Benjamin Carter and Weston Conner).

This data was organized and converted into the desired format. The goal was to produce a Digital Elevation Model (DEM), a hillshade, and a slope analysis for each SGL (all in TIFF format; see Carter [Reference Carter2019a] for a description on how to do this manually). This was automated with the assistance of Moritz “Moe” Schiesser who was able to process this data programmatically so that it was organized in folders by SGL and processed using LAStools (specifically las2las.exe, lastile.exe, BLAST2DEM.exe; and QGIS. Resolution of the resultant DEMs is 1.0 m2. It should be noted, because Pennsylvania is broken into North and South Tiles (based on different coordinate reference systems; State Plane 1983 PA South and North), some of the SGLs have two DEMs, two hillshades, and two slope analyses. In order to ensure that we had a complete set of images and that they loaded correctly, we wrote utility programs in QGIS to load each TIFF (Tag Image File Format) that corresponded to our list of SGLs.Footnote 2
The deep-learning process described below needs to be trained on known RCHs. Therefore, we reviewed and marked RCHs in 62 SGLs. To identify these RCHs, we primarily utilized the slope analysis over the Google Maps satellite photos. The latter helps identify non-RCHs, such as small buildings. In situations where identification was unclear, we also examined the hillshade. If we were still unsure of our identification, we also employed a QGIS plugin called Profile Tool, which allowed us to see the profile of the suspected RCHs in the DEM (Figure 3). In our review, we looked for features that represented two distinct but overlapping signatures (see also Bonhage et al. Reference Bonhage, Eltaher, Raab, Breuß, Raab and Schneider2021). RCHs on slopes were dug into the hillside and therefore have steep slopes above and below a flat, level area between 10 and 15 m in diameter. The flat area tends to be ovoid rather than circular likely because the collier used the portion level with the rest of the slope as a path and because the steep upper slope eroded over time, partially covering the circular RCH (Figures 3b, 3d, and 3f). RCHs on flat areas are more difficult to identify. These tend to be primarily identifiable through a very flat, round area around 10–15 m in diameter that normally has a circular berm around the outer edge that represents the earth from the top of the meiler that had been raked to the edges. They are also often associated with borrow pits (Figures 3a, 3c, and 3f). This process resulted in the manual identification of 4,376 RCHs to serve as our training data. We attempted to ground truth 174 RCHs identified in this manner. Of these, 170 (97.7%) were confirmed in the field to be true positives, and only four (2.3%) were identified as false positives. These features are quite distinctive on the landscape and easy to confirm by their shape (as described above), but all of these were also confirmed by digging an informal hole approximately 10 cm deep on the lower slope that revealed large quantities of charcoal. Most of those confirmed through fieldwork are located on slopes, so they are easier to identify in the slope analysis than those on flat areas. Conner (Reference Conner2018) utilized intensive survey on flat areas to identify charcoal RCHs. He identified potential hearths in the slope analysis using a confidence rating system (from 1 = highly confident to 3 = possible but unlikely). Approximately 50% (6/13) of the locations that he rated highly (1 or 2 in his system) were confirmed in the field, and none (out of 8) of the low-confidence-rated potential RCHs were confirmed. Using systematic field survey of 0.2445 km2, he was also able to identify three RCHs that had not been identified in the slope analysis (i.e., false negatives). Therefore, it is likely that our methods for identifying RCHs in the slope analysis are significantly more accurate for those on slopes compared to those on flat areas.
Comparison of relict charcoal hearths on level and sloped landscape in slope analysis, hillshade, and using the Profile Tool plugin for QGIS (image by Benjamin Carter).

DEEP-LEARNING OBJECT RECOGNITION USING MASK R-CNN
We selected Waleed Abdulla's Mask R-CNN as a deep-learning platform for object detection (see also Bonhage et al. Reference Bonhage, Eltaher, Raab, Breuß, Raab and Schneider2021). Mask R-CNN is suitable for identifying objects that appear only in a small part of an image (Brownlee Reference Brownlee2019a, Reference Brownlee2019b; He et al. Reference He, Gkioxari, Dollar and Girshick2020; Rosebrock Reference Rosebrock2019), such as RCHs in images of much larger landscapes. Additionally, a guiding principle for this project is to use accessible open source technology, such as Mask R-CNN, where possible to lower the barriers for other researchers so that they can build on our work.
Abdulla's Mask R-CNN uses Keras on TensorFlow, programmed in Python. We implemented Mask R-CNN on a virtual Ubuntu Linux computer GPU to allow for efficient processing. Anaconda Navigator was used to manage the required packages for Keras and TensorFlow and the compatible version of Python (Dombrowski et al. Reference Dombrowski, Gniady and Kloster2019). The use of Anaconda to manage the Python environment reduced complexity in the project.
Data Preparation
Each slope file (in TIFF format) for a SGL is large. For example, the file for SGL 33 is 1.5 GB in size. To make these images easier to process by Mask R-CNN, we wrote a programFootnote 3 to divide each TIFF into smaller 1024 × 768 pixel tiles that Mask R-CNN can consume efficiently. The program divided the TIFF into a grid of tiles and saved each tile as a JPEG image. Some tiles were empty due to the irregular shape of SGLs, and the program discarded these voids.
The shape file containing the points of the 4,376 manually recognized RCHs was used to identify tiles to be set aside for training, given that only a portion of tiles contained known RCHs. If a tile contained the point of a known RCH, the program copied the tile JPEG to a separate folder for training.
Next, we told Mask R-CNN where to look on each training image for examples of RCHs. This is done through annotation, which documents the x,y pixel boundaries (in xml format) that contain the region of interest (ROI)—in this case, an RCH. The program used the shapefile of known RCHs and expanded each point to a rectangular ROI bounding the RCH.Footnote 4 The size of the ROI was set to include all of a typically sized RCH (ca. 10–15 m in diameter) as well as several additional meters of surrounding land for a total size of 30 × 30 m (Figure 4). Experimentation showed that including the area surrounding the RCH was part of what distinguished it from other similar looking objects in the slope analysis. When the ROI was made smaller, and the boundary was close to the edge of a typical RCH, training results were less accurate.
Slope analysis of a portion of SGL 33 with manually recognized relict charcoal hearths (RCHs) in white numbered squares and Mask R-CNN–identified RCHs in light blue squares. RCHs with both blue and white were recognized by both methods. The number above the square is the confidence score (image by Benjamin Carter).

Training the Model
To train the model, the JPEG images mentioned above were split randomly into training (80%) and testing sets (20%). Inside each training tile is at least one 30 × 30 m ROI (Figures 4 and 5). The ROIs in these images allow Mask R-CNN to learn to find other objects like those in the ROI. Once the model has learned to identify RCHs based on known ROIs, it then runs the model to see how successfully it can also identify known RCHs in the smaller “testing” set of known ROIs. In this way, the model recognizes how well it is working (or not) and makes adjustments.
A close-up of six manually recognized RCHs shown in Figure 4 demonstrating similarities and variation (image courtesy of Jeff Blackadar).

Models are trained for a number of training/testing cycles called “epochs” as a way to improve accuracy with repetition. Models start with a random set of values known as weights that represent the model's recognition of a general pattern. The weights are adjusted as recognition improves with subsequent epochs. This improvement in learning reaches an optimal point. If a model is trained for too many epochs, it becomes “overfit” and is biased to recognize only data it was trained on rather than generally recognizing similar objects.
The process of training and deciding when an object detection model is at peak learning performance is iterative. Because initial models start out with random weights, outcomes vary. We adjusted parameters to tune how the model learns in order to get the best outcome. The learning rate parameter represents how much weights are adjusted between each epoch of training. The greater the learning rate, in theory, the faster a model can be trained. However, high learning rates can quickly lead to a model being overfit and consequently useless. We used a learning rate of 0.001 for 8 epochs and then reduced it to 0.0001 for epochs 9–18 (Khandelwal Reference Khandelwal2019; Rosebrock Reference Rosebrock2019).
We experimented with “detection min confidence,” a threshold value Mask R-CNN uses while it is training to decide if it has correctly detected an object. We tried values of 0.7 and 0.9, and we found that 0.9 produced a more accurate model.
We set a maximum limit of 46 on the number of RCHs detected in a 1024 × 768 jpg. Sampling showed that this was a reasonable upper limit of RCHs visible in an image that did not risk loss of true positives, but it also put a ceiling on possible false positive results. After each training run, the results were validated with a calculation known as “average precision” (AP)—a performance metric based on the model's ability to detect true positives and minimize false negatives (Bonhage et al. Reference Bonhage, Eltaher, Raab, Breuß, Raab and Schneider2021; Hui Reference Hui2018). Mask R-CNN uses mean average precision (mAP), which averages across multiple classes of objects as a quick way to judge a model. However, because this model employs only one class of object, mAP = AP. Models with higher mAP, which is expressed as a proportion (0–1; see Hui Reference Hui2018), suggest increased recognition of true positives and minimized inclusion of false positives.
We trained numerous models after adjusting learning rate and “detection min confidence.” We also adjusted the number of epochs used with different learning rates. For example, on the last training run, for epochs 19–28, we used a value that was 1% of the learning rate for epochs 1–8 noted above. In the end, this variant was not relevant because our model's accuracy peaked at epoch 16.
Once we trained a set of models, we graded it using a four-stage process in order to select the best. Models that had a peak mAP of <0.5 were discarded immediately. Models with a mAP of >0.5 were used to detect RCHs in 20 images. After visual inspection of the predictions on 20 images, models that failed to find RCHs or had excessive false positives were discarded. If a model passed the visual inspection of 20 images, it looked promising, and we formally scored it using a set of 100 randomly selected images. The score was analyzed for the model's predictive value (AP).Footnote 5 Finalist models were used for predictions on all images, and large samples of these predictions were manually examined to determine the model's value. For the final model, the mAP peaked at epoch 16 (Train mAP = 0.622 and Test mAP = 0.554) with the settings LEARNING_RATE = 0.001 and DETECTION_MIN_CONFIDENCE = 0.9.
Running Predictions
Once we determined appropriate settings, we ran the model on all JPEG tiles.Footnote 6 The resultant data comprised rectangles using the x,y pixel coordinates of the image stored in an XML file (Figures 4 and 5). The program converts the resulting predictions from pixel coordinates into geolocated 30 × 30 m rectangles stored in a shape file.
Due to the overlap of images from the two different coordinate reference systems used for the Pennsylvania SGLs, some RCHs appeared on two different images and showed up as duplicate predictions. These duplicates were programmatically eliminated.Footnote 7 The results also provided a predicted confidence for each RCH—that is, based on the model, how likely was the predicted RCH a true RCH (from 0–1). We set our lower limit at 0.7. The final result is a list of unique geographic points of 52,884 predicted RCHs.
ASSESSING THE MASK R-CNN PREDICTIONS
Once Mask R-CNN completed its predictions, a quick review helped us realize that, although lots of the predictions were true positives, many were not. We used the following methods to separate these.
For our first attempt, we chose eight SGLs (13, 33, 37, 39, 51, 76, 83, 217) distributed across the state and physiographic provinces. Rather than examining each predicted RCH, we first divided them into “confidence” bins (Table 1). We randomly selected four predicted RCHs from each bin for each SGL (except SGL 83, which only had two RCHs in the 0.75–0.80 bin; Table 1), for a total of 190 predicted RCHs. We used the methods for manually identifying RCHs in slope analyses described above to determine if the predicted RCH was a true positive or a false positive. This resulted in the recognition of 150 false positives (78.9%) and 40 true positives (21.1%, see Table 1). Although this initially seems to be an indication of poor results, this helped us realize that we needed alternative methods for assessing the predicted sample. For example, of this sample, two SGLs (13, 37) had no true positives. There was likely little or no historic charcoal production in these SGLs. On the other hand, the majority of the true positives were in the two upper “confidence” bins (27/40, or 67.5%; Table 1).
Manually Recognized True Positives at a Selected Set of SGLs by Confidence Bin.

Note: For example, in the 0.70–0.75 confidence bin, 0 out of 4 of the RCHs recognized by Mask R-CNN were visually confirmed to be true positives.
To better assess this, we used an alternative approach. In the field, RCHs tend to be clustered in groups. This makes sense because a collier frequently tends multiple charcoal hearths at one time. To limit travel time and facilitate working many hearths, hearths are often located near each other (ca. 80–150 m, but with great variation). Additionally, in our manual review, we noticed that many of the false positives were not near other predicted RCHs. Therefore, we employed cluster analysis as a way to separate true positives from false positives. We employed the DBSCAN plugin in QGIS (for the use of DBSCAN in archaeology, see Argote-Espino et al. Reference Argote-Espino, Solé, López-García and Sterpone2012; Caspari and Jendryke Reference Caspari and Jendryke2017; Maddison Reference Maddison, Gillings, Hacıgüzeller and Lock2020; Maddison and Schmidt Reference Maddison and Schmidt2020). Density-based spatial clustering of applications with noise, or DBSCAN, creates clusters based on two variables: the maximum distance and the minimum number of individuals in a cluster. Starting with a random RCH, the plugin determines if there are other points within the maximum distance. If so, that point is included in a cluster, as long as that cluster reaches or exceeds the minimum number of RCHs. Anything not within a cluster is described as “noise.” To start, we experimented with a variety of variables and observed the results by visualizing the clusters in QGIS. We learned that there is no combination of DBSCAN settings that reliably distinguishes individual true positives from false positives. For example, an RCH on the edge of a cluster may be identified as noise if it is not close enough to another RCH. Alternatively, false positives will be included in a cluster if they are within the parameters. Therefore, we could not use clustering to determine if an individual predicted RCH was a true or false positive, but we could use it to get a much better idea of where clusters were located. Consequently, we used three different combinations of variables (minimum number / maximum distance = 5 / 300 m, 10 / 500 m, 20 / 1,000 m) to visualize these clusters.
The results of the DBSCAN analyses allow us to distinguish likely true clusters from “noise” (i.e., false positives) even if a determination cannot be made for each RCH. A total of 26,873 RCHs (50.8% of all predicted RCHs) were placed in a cluster based on at least one of the three variable combinations. A total of 18,202 predicted RCHs (34.4%) were organized into all three cluster variants. It is likely that most of these predicted RCHs are true positives. Predicted RCHs not included in these clusters are more likely to be false positives. For example, none of the predicted RCHs in SGL 13 and 37 (Table 1), where we failed to manually recognize any RCHs in the slope analysis and therefore know that they are all definitively false positives (see above), are included in the three clusters.
In order to address how well DBSCAN effectively distinguished true and false positives, we reviewed the predicted RCHs in and around SGL 43 using the methods discussed above. We chose this area because it is located near Hopewell Furnace, a National Historic Site as well as one of the best-known and well-researched iron furnaces in the country (e.g., Kemper Reference Kemper1941; Straka and Ramer Reference Straka and Ramer2010; Walker Reference Walker1966), and we have begun to conduct fieldwork there. Table 2 demonstrates that 832 (out of 1,019, or 82.6%) of the predicted RCHs that fall within one, two, or all three of the clusters were identified as true positives—187 (18.4%) were false positives. Of those RCHs that were not placed into any clusters, the majority (33/44, or 75.0%) were manually recognized as false positives, and 25.0% (11/44) were true positives. Figure 6 shows the contexts of these RCHs. Most of the RCHs not included in a DBSCAN cluster (Figure 6; red squares) were not confirmed by manual evaluation and are in residential areas outside of preserved areas. Most of the RCHs included in all three clusters were confirmed and were located within local preserved space, including SGL 43, French Creek State Park, Hopewell National Historic Site, Thomas P. Bentley Nature Preserve (the location of Warwick Furnace), Coventry Woods Park, Crow's Nest Preserve, and Warwick County Park. Therefore, cluster analysis can, with reasonably high probability, indicate that a single predicted RCH is a true or false positive.
Map showing predicted RCHs and their inclusion in the three DBSCAN cluster analyses compared to a manual review that identified true positives in and around SGL 43. Base map is the hillshade created using methods described herein. See Figure 7 for preserved land labels (image by Benjamin Carter).

Map showing true positives and false negatives for RCHs in and around SGL 43. Note that both are concentrated in preserved areas. Base map is the hillshade create using methods described herein (image by Benjamin Carter).

DBSCAN Clusters of Mask R-CNN–Identified RCHs Compared to Manual Recognition at SGL 43.

Note: The total number of predicted hearths that fell into at least one cluster is 1,019 (901 + 60 + 58), of which 832 (778 + 33 + 21) were identified as true positives and 187 (123 + 27 + 37) were false positives.
Consequently, clustering provides us with a broader-scale understanding of charcoal “fields”—areas of the landscape densely dotted with RCHs. Figure 8 shows a comparison between predicted RCHs that fall into all three DBSCAN clusters and the lidar tiles employed in this analysis. If one drew a line from the southwest to the northeast of the state, the southeastern half would have the vast majority of charcoal fields. This includes a near continuous line of “fields” along the 250-mile stretch of Blue Mountain, along with numerous fields to the north and south of it. Fields are notably absent across much of the northern portion of the state where there were fewer charcoal furnaces and forges. Small fields are located in the northwest, where the lifespan of charcoal furnaces was relatively short (ca. 10 years; Knowles Reference Knowles2012:49; see also Williams Reference Williams2020).
Map showing a heat map of predicted RCHs included in all three DBSCAN analyses compared to tiles included in the sample. Darker red indicates lower density, and lighter red indicates higher density (image by Benjamin Carter).

DBSCAN clustering also allows us to examine how well the Mask R-CNN was able to predict the same RCHs that were used to construct the model. Of the 4,376 RCHs used to train the model fully, 4,174 (95.4%) were predicted by the model, demonstrating both the effectiveness of Mask R-CNN and how the abstraction created by Mask R-CNN does not automatically detect each of the individual training RCHs. Of the 4,174 training RCHs included in the predicted RCHs, 4,004 (96.0%) were placed in at least one of the DBSCAN clusters, and 3,523 (84.4%) were placed in all three clusters. Although most individual SGLs mirror these proportions, localized patterns also exist. For example, the majority of the training RCHs that were also recognized by Mask R-CNN in SGL 45 and SGL 51 were not placed into any of the clusters (28/36, or 78%; 14/16 or 87.5%, respectively).
The DBSCAN of the results of the Mask R-CNN provides a much broader view of the immense impact of charcoal production on the landscape of Pennsylvania. It also allows us to differentiate where in the state the majority (if not all) of the impact was located and where it was unlikely. In particular, charcoal production focused on the 400 km (250-mile) long Blue Mountain and the hilly areas within approximately 100 km (60 miles) to the north and west, as well as on the hills to south. This more fully addresses the impact of charcoal production on the landscape of Pennsylvania. There are some limitations, however. First, this is only a partial sample of the entire state—other undeveloped lands (e.g., state parks, county parks, private preserves) could also be examined. Second, the combined use of Mask R-CNN and DBSCAN is more appropriate for identifying individual charcoal hearths that collectively form “fields.” This means that individual (or small clusters of) RCHs will be missed. Third, additional work may be able to demonstrate additional variables—such as proximity to furnaces, water, et cetera—that impact both the construction of hearths and the recognition of those hearths in lidar derivatives. These variables may be employed to increase our ability to separate true positives from false. Fourth, we have limited our conversation about false negatives. Though the comparison between the training data and the examination of SGL 43 suggests that false negatives are rare (ca. 5% or less), more work needs to be done. Last, in order to better understand charcoal production and consumption, these fields of RCHs should be reconnected with the forges and furnaces that consumed the charcoal to make iron.
We also reviewed SGL 43 to identify false negatives—those RCHs missed by the Mask R-CNN model but identifiable in the slope analysis. Two of the authors (WC, BC) scanned the slope analysis of SGL 43 at a scale of 1:1000 looking for the features discussed above—flat, round areas approximately 10–15 m in diameter that either had clear steep uphill and downhill slopes on sloped terrain or circular berms on flat terrain. Any identifications on which the reviewers disagreed were reassessed, and a final collaborative determination was made. A total of 46 potential RCHs were identified (Figure 7)—in comparison to the 843 RCHs detected by Mask R-CNN and confirmed as true positives. Although we have only confirmed a few of the RCHs in the field at SGL 43, the ground truthing discussed above suggests that these methods are likely quite accurate on slopes, although we are less confident in our identification of RCHs on flat terrain. This is particularly important because Williams (Reference Williams2020) has identified 279 colliers in the 1850 census for Clarion County (in the northwest of Pennsylvania). In our own preliminary analysis, we believe this to be an incredibly high number of colliers. Yet, although the heat map does indicate RCH “fields” in Clarion county, this would seem to underrepresent the number of colliers. We are not arguing, therefore, that the techniques described herein are able to identify all RCH fields—only that, compared to previous attempts, they move us significantly in the right direction.
CONCLUSION
This research demonstrates how the impact of charcoal production in Pennsylvania can be understood by using deep learning (Mask R-CNN) and cluster analysis (DBSCAN in QGIS) to analyze lidar derivatives. Charcoal production is a relatively poorly known industry that has left extensive modifications of the landscape across hundreds of square kilometers of terrain. Whereas a recent spike in research on RCHs (largely due to the availability of lidar) has demonstrated the prevalence and impact of charcoal production, this research is able to show the presence of hundreds of kilometers of “fields'‘ of RCHs, as well as large swaths of the state where RCHs are absent, although we may underrepresent the size of these fields. As Bernhard Fernow suggested, based on our research, charcoal production appears to be associated with “waste places,” particularly the arid tops of long ridges, such as the Blue Mountain.
Acknowledgments
The authors thank Moritz “Moe” Schiesser for his assistance organizing and processing the lidar data, and John Clark of Lafayette College, who pointed out the relevance of cluster analysis. We would like to acknowledge the support of the Social Sciences and Humanities Research Council of Canada. We thank the Provost's Office and the Department of Sociology and Anthropology of Muhlenberg College for financial and logistical support. No permits were required in the completion of this work. A special thank you to Stefan Bohorquez Gerardy for his assistance with the Spanish abstract. Last, we greatly appreciate the feedback from three anonymous reviewers.
Data Availability Statement
One of the goals of this research is to provide all of the code/data employed herein in order to both ensure replicability and encourage additional use of our work. The data used for this research originated in open repositories (primarily through the state of Pennsylvania). We plan to further publish both code and data constructed in this research. Until then, links for these are provided through an archived document located at https://zenodo.org/record/4766351.


 Open access