


In many Western democracies, pronounced cleavages in voting patterns have emerged between more and less populous communities (Cracked.com 2017; Niskanen Center 2019; Rodden Reference Rodden2019). Voters in more populous communities often favour greater governmental involvement across a broad spectrum of policy domains. Conversely, less populous communities are regularly associated with preferences for limited government engagement.Footnote 1 This paper explores whether community size influences voting behaviour related to citizens’ preferences for government involvement in society – considering predominantly rural, small communities in post-Second World War Southwest Germany.
Theories conflict regarding the relationship between community size and citizens' preferences for government involvement. At the country level, populous societies may be able to afford smaller governments in per capita terms, since some public services require fixed setup costs (Alesina Reference Alesina2003; Alesina and Wacziarg Reference Alesina and Wacziarg1998). Larger polities, however, are also often characterized by (i) greater ‘administrative and congestion costs’ (Alesina Reference Alesina2003, 304; Oakland Reference Oakland1972), (ii) stiffer competition over scarce resources, and (iii) more heterogeneous citizen preferences, which can complicate the coordination of everyday life (Blom-Hansen, Houlberg, and Serritzlew Reference Blom-Hansen, Houlberg and Serritzlew2014; Charnysh Reference Charnysh2019; Hansen Reference Hansen2015; Krieger and Meierrieks Reference Krieger and Meierrieks2020; Lassen and Serritzlew Reference Lassen and Serritzlew2011).
Empirically, identifying the causal effects of community size on citizens' predilections for government proves particularly challenging. First, individuals of varying characteristics are typically mobile and have substantial freedom to select the communities they choose to live and work in (Banzhaf and Walsh Reference Banzhaf and Walsh2008; Tiebout Reference Tiebout1956). Unobservable individual-level characteristics may correlate simultaneously with migration decisions and voting preferences. Second, political institutions can influence community size by, for example, determining the conditions and incentives for movements in and out of the community or by influencing fertility decisions (for example, child support, school quality, and parental leave).
To address these challenegs, we exploit a natural experiment in post-Second World War occupied Baden-Württemberg (located in Southwest Germany). Between 1945 and 1949, some 500,000 German expellees (Vertriebene) fled from the eastern parts of the former German territories to the area occupied by French and US forces, eventually becoming Baden-Württemberg. While the Americans permitted expellees to settle in the lands they occupied, the French prevented them from entering. Consequently, those municipalities on the US side experienced large expellee influxes, whereas those on the French side, just a few kilometres away, did not.Footnote 2 As opposed to virtually every other migration wave in modern history, the expellees spoke the same language as the natives while sharing the same ethnic heritage and broad cultural background (Braun and Mahmoud Reference Braun and Mahmoud2014; Connor Reference Connor2007; Judt Reference Judt2006; Moersch and Weber Reference Moersch and Weber2008; Wyrwich Reference Wyrwich2020). While they were not identical to the natives in their demographic and socio-economic characteristics, they were closely comparable, especially when conditioning on a rich set of municipality-level observables (see Ciccone and Nimczik Reference Ciccone and Nimczik2022; Schumann Reference Schumann2014, and references therein; more details can be found in Section ‘Identifying assumptions’).
This natural experiment yields plausibly exogenous variation in the size of communities across those 824 municipalities along the border of the French and American-occupied zones. Notably, the agreed-upon border between the occupation zones was decided on grounds that were plausibly orthogonal to the expellees’ and natives’ preferences, as well as local cultural, economic, geographical and political characteristics (Capoccia and Pop-Eleches Reference Capoccia and Pop-Eleches2020; Ciccone and Nimczik Reference Ciccone and Nimczik2022; Mosely Reference Mosely1949; Schumann Reference Schumann2014; see Section ‘Identifying assumptions’). Detailed historical accounts illustrate that what became the border has never constituted a barrier along cultural, economic, geographical, or political lines (for example, see Ciccone and Nimczik Reference Ciccone and Nimczik2022 and Schumann Reference Schumann2014; more details in Section ‘Historical background’). Nevertheless, the study controls for several variables that capture demographic, economic and religious characteristics, pre-Second World War vote shares, location-fixed effects, and distances to the regional highway and the state capital Stuttgart.
The main analysis studies the effect of community size on municipalities' revealed preferences for government by examining voting outcomes of the 1949 national elections. We first explore vote shares of the Sozialdemokratische Partei Deutschlands (SPD), the social democratic party that advocated greater government involvement across virtually all policy domains (see Section ‘Political landscape’). Our results suggest more populous communities are systematically associated with higher SPD vote shares. Conversely, when examining vote shares for the Christlich-Demokratische Union (CDU) – which instead championed individual freedoms, small-government, and free-market policies while warning against the SPD's intended ‘socialization’ – we uncover large negative effects of community size. A 10 per cent increase in population size is suggested to raise SPD votes by 1.2 percentage points while decreasing CDU votes by 3.8 percentage points.
These findings are consistent when accounting for (i) pre-Second World War vote shares, (ii) detailed housing and demographic characteristics, (iii) unemployment rates, (iv) sex ratios, (v) religious denominations, (vi) land holdings, (vii) time-invariant geographical aspects, (viii) time-specific developments that apply to municipalities on either side of the border, (ix) distances to the regional highway and the state capital Stuttgart, and (x) each municipality's share of expellees. Employing population density or population growth rates as the main independent variable yields consistent results. Results are also robust to: (i) excluding the largest counties, (ii) widening or narrowing the sample of municipalities along the dimension of distances to the French-US border, and (iii) estimating average partial effects obtained from fractional response regressions. So, too, do our results remain consistent when analyzing the1952 state-level elections.
Finally, we turn to two alternative explanations of our results pertaining to (i) expellee voting patterns and (ii) a potential backlash effect from natives. Detailed theoretical explorations and simulations show that their voting patterns cannot explain the results regarding expellee voting. For example, mathematically negative CDU vote shares by expellees in 273 of the 824 municipalities would be required to produce the estimates, even under the most conservative assumptions about turnout and voting eligibility rates. In addition, historical evidence on the expellees' political preferences and the major political parties' political priorities do not suggest expellees decisively favoured the SPD (see Section ‘Expellee voting’ and Appendix C).
Concerning the natives' stance towards the expellees, it is possible that many voted for the SPD to counter the socio-economic and ideological threats the expellees may have posed. While historical accounts of the expellees' reception differ somewhat and often vary by locality, one concern is that expellees may have been perceived as less anti-Nazi – and natives may have felt compelled to swing left politically to counter right-leaning influences by the new arrivals. Empirically, however, the share of expellees in a municipality cannot explain away the importance of population size in predicting voting patterns. In addition, the 1949 election campaign centred almost exclusively on economic (as opposed to ideological) topics – for example, see the campaign posters in the Section on ‘Political landscape’ and the discussion in the Section on ‘An anti-expellee backlash?’. Finally, the underlying political philosophies of the occupying governments would, if anything, suggest the opposite dynamics since the US government strongly favoured Germany's free-market, small-government direction.
This paper contributes to the literatures pertaining to (i) preferences for government size (see Shelton Reference Shelton2007) and (ii) the formation of voting preferences.Footnote 3 Some studies document a negative correlation between national population size and government size (Alesina and Wacziarg Reference Alesina and Wacziarg1998; Jetter and Parmeter Reference Jetter and Parmeter2015; Shelton Reference Shelton2007), while others suggest a positive relationship (Krieger and Meierrieks Reference Krieger and Meierrieks2020; Ram Reference Ram2009). Subnational studies on the topic, however, remain scarce. Jetter and Parmeter (Reference Jetter and Parmeter2018) find World Values Survey respondents of more populated towns systematically prefer greater government involvement. Nevertheless, we are not aware of a study that employs an identification strategy to circumvent the latent endogeneity concerns associated with community size when predicting expressed preferences for government involvement – a gap this paper aims to fill.
Ostensibly, this study nestles at the intersection of several closely related literatures. First is the branch of research that explores the consequences of forced migration episodes (Becker and Ferrara Reference Becker and Ferrara2019; Charnysh Reference Charnysh2019; Charnysh and Peisakhin Reference Charnysh and Peisakhin2022). Second is the literature linking voting behaviour to migrant and refugee intake, with recent evidence exploring votes for anti-immigration parties (Alesina, Murard, and Rapoport Reference Alesina, Murard and Rapoport2019; Dustmann, Vasiljeva, and Piil Damm Reference Dustmann, Vasiljeva and Piil Damm2018; Edo et al. Reference Edo2019; Halla, Wagner, and Zweimüller Reference Halla, Wagner and Zweimüller2017; Lonsky Reference Lonsky2021; Mayda, Peri, and Steingress Reference Mayda, Peri and Steingress2020). With few exceptions, these studies document increases in vote shares of parties that oppose inward migration. Contrary to our research question, which aims to understand citizens' preferences for government, these studies usually (i) focus specifically on anti-immigration attitudes and (ii) consider inflows of individuals that differ notably from the natives in terms of culture, ethnicity, language, and/or religious denomination.
Historical Background
Expellees in Post-Second World War Baden-Württemberg
Following the cessation of the Second World War, approximately eight million ethnic Germans from the eastern parts of the former German territories migrated westward to ultimately settle in one of four occupied zones in post-Second World War Germany. In this unprecedented migration episode, the German population increased by almost 20 per cent relative to pre-war levels (see, for example, Peters Reference Peters2021 or Ciccone and Nimczik Reference Ciccone and Nimczik2022). While few arrived before the Allies' establishment of occupation zones, the majority arrived between the summer of 1945 and the end of 1946 (see Ciccone and Nimczik Reference Ciccone and Nimczik2022).
In the aftermath of the Second World War, the area that ultimately became the German state of Baden-Württemberg was split between the French and US occupying forces.Footnote 4 Approximately 2.6 million expellees travelled to the US-occupied zone by the end of 1946, equivalent to an 18 per cent population increase (Schumann Reference Schumann2014, 192–3). In the subsequent three years, 500,000 additional expellees arrived in the US zone. In 1950, expellee shares in the 824 municipalities that comprise our main database averaged 15.3 per cent, ranging from 0.9 per cent (Westerheim on the French side) to 24.6 per cent (Halzhausen on the US side). The Statistisches Landesamt Baden-Württemberg (1950) provided data, see Table B2.
The French-US Border
Our identification strategy, paralleling Schumann's (Reference Schumann2014), exploits the fact that expellees were prohibited from entering the French-occupied zone until the spring of 1949 (also see Ciccone and Nimczik Reference Ciccone and Nimczik2022; Schumann Reference Schumann2014, 192). France ‘refused to admit any expellees in its occupation zone but allowed all refugees that had arrived prior to July 1945 to stay’ (see Benz Reference Benz1999; Schumann Reference Schumann2014, 193). Braun and Mahmoud (Reference Braun and Mahmoud2014, 70) note ‘[a]ttempts to rebalance the regional distribution of expellees were frustrated by deficient administrative structures and the French refusal to admit any expellees into their occupation zone.’Footnote 5 Consequently, many expellees who wanted to enter the French zone, often because friends and family resided there (Chevalier et al. Reference Chevalier2019), settled close to the French-US border on the US side. Schumann (Reference Schumann2014) documents how this population shock persisted for decades, leaving the municipalities on the US side significantly more populous than their counterparts – sometimes just a few kilometres away on the French side. Ciccone and Nimczik (Reference Ciccone and Nimczik2022) explore the long-run economic consequences of that population shock until today.
Figure 1 replicates Schumann's (Reference Schumann2014) Figure 3 to illustrate the stark geographical differences in population growth rates from 1939 to 1950 in the 824 municipalities that comprise the primary sample. Following Schumann (Reference Schumann2014), the main analysis studies municipalities located at least partly within 5 km of the border. While the population of the average municipality on the French side grew by 15 per cent relative to pre-war levels, the US side recorded average growth rates of 39 per cent – a differential largely attributable to expellees. Municipality-level data on the population share of expellees averages only 10 per cent on the French side, compared with 22 per cent on the US side.
Population growth from 1939 to 1950 ((pop 1950 − pop 1939)/pop 1939). The black line constitutes the border between the US (northeast) and the French occupation zone (southwest).
Source: Based on Schumann (Reference Schumann2014).

These substantial increases in populations on the American side, relative to the contiguous French side, are in many ways unique to the post-Second World War period. For example, Schumann (Reference Schumann2014, 196–8) provides detailed falsification tests in that regard, showing that what would become the US side did not experience differential population growth rates between 1910 and 1939. These insights also apply to population size and municipality land area.
Identifying Assumptions
Two elements make this setting attractive for studying the relationship between community size and governmental preferences: (i) the quasi-random imposition of the French-US border and (ii) the unusually high degree of homogeneity between the incumbent population and the new arrivals. The first assumption emerges from rich historical sources which indicate that the French-US border was largely exogenous to cultural, economic, geographical, and institutional conditions. Schumann (Reference Schumann2014, 191) notes ‘…[t]he occupation zone border in Germany runs through territory that is topographically and climatically fairly homogenous.’ Further, ‘[t]here are no reasons to suspect any pre-existing discontinuities along the border. It had never represented a political border, nor does it coincide with geographical features such as a river or a mountain range, which would otherwise have yielded a naturally occurring discontinuity.’ Mosely (Reference Mosely1949) describes the negotiation process between the French and US occupiers to highlight that ‘[a]dministrative and traditional divisions were disregarded completely [in the drawing of the border].’ Capoccia and Pop-Eleches (Reference Capoccia and Pop-Eleches2020, 408) write that ‘[c]onvergent historical accounts show that the zones’ boundaries were based on considerations that were largely indifferent to the preferences of the German citizenry.’
Nevertheless, the US side was undoubtedly dominant in drawing the border. It was particularly interested in securing uninterrupted access to the highway that connected Frankfurt to Munich via Stuttgart (see Ciccone and Nimczik Reference Ciccone and Nimczik2022 and Mosely Reference Mosely1949). In our Section on ‘Robustness checks’, the distances to both the highway and the state capital Stuttgart (both linear and squared) are addressed, and we find these aspects to be qualitatively inconsequential for the results. The same section also reports results from narrowing and widening the sample geographically, yielding consistent conclusions.
The second assumption concerns the comparability of natives and expellees. The expellees' cultural, economic, ethnic, language, and religious traits were remarkably similar, although not entirely identical to the natives'. Braun and Mahmoud (Reference Braun and Mahmoud2014, 71) document that ‘[e]xpellees were not selected on the basis of skills or labor market prospects and, as ethnic Germans, were close substitutes to native West Germans.’ Wyrwich (Reference Wyrwich2020, 483) summarizes that ‘expellees and indigenous population in the remaining parts of Germany spoke the same language and were exposed to the same formal education system before WWII’. Many expellees arrived with agriculturally relevant skills and technical or other training, quickly leading to their involvement in post-World Second World War industries (Moersch and Weber Reference Moersch and Weber2008). Ciccone and Nimczik (Reference Ciccone and Nimczik2022) conclude, ‘[i]n terms of human capital, WWII refugees in (South-West) Germany were similar to the local population (Bauer, Braun, and Kvasnicka Reference Bauer, Braun and Kvasnicka2013; Grosser Reference Grosser2006)’. Studying German microcensus data from 1971, Grosser (Reference Grosser2006) documents how expellees in the area of interest in South-West Germany ‘had similar education levels, pre-WWII employment, and occupational status compared to the local population’ (also see Bauer, Braun, and Kvasnicka Reference Bauer, Braun and Kvasnicka2013, 10; Table C1 of Ciccone and Nimczik Reference Ciccone and Nimczik2022). Judt (Reference Judt2006, 26) notes that, overall, ‘the 13 million expellees were settled and integrated into West German society with remarkable success.’
Nevertheless, expellees were of course not fully identical to natives. To account for any remaining discrepancies and potential selection issues, the analysis controls for municipality-level differences in housing, unemployment rates, sex ratios, religious distributions, agricultural land holdings, and pre-Second World War voting patterns. It is possible, for example, that expellees selected their destinations based on socio-economic and demographic characteristics or that the arrival of expellees systematically influenced these aspects. In the Section on ‘Expellee voting’, the potential effects of the expellees' voting patterns are considered, but we find their political preferences alone cannot explain the results. Finally, the Section on ‘An anti-expellee backlash?’ explores whether an explanation consistent with a backlash by the natives against the expellees could drive the estimates.
Empirical Literature on the Post-Second World War French-US Border
This is not the first attempt to exploit the extraordinary historical setting of the French-US post-Second World War border. Schumann (Reference Schumann2014) provides the first systematic empirical analysis to understand whether these population shocks experienced by the municipalities on the US side persisted over the long run. Employing a regression discontinuity approach (see Section ‘Empirical strategy’), Schumann finds sizeable differences in population levels across the French-US border prevailed until the 1970s.
More recently, Ciccone and Nimczik (Reference Ciccone and Nimczik2022) also consider this post-Second World War setting along the French-US border, studying the long-run economic effects of this immigration wave. Their main findings indicate that the increased population density on the US side (relative to the French side) ‘persists entirely in 2020 and coincides with higher rents as well as higher productivity, wages, and education levels.’ While our study focuses on contemporaneous political preferences as outcome variables, Ciccone and Nimczik (Reference Ciccone and Nimczik2022) are concerned with the long-term economic effects.
Beyond this particular setting on the French-US border, the overall westward migration of the post-Second World War German expellees has been the subject of much scientific inquiry. While interesting in its own historical right, the associated dynamics become relevant when trying to understand the general long-term effects of population movements on taxation patterns (Chevalier et al. Reference Chevalier2019), political ideology (Menon Reference Menon2020), economic development (Braun and Kvasnicka Reference Braun and Kvasnicka2014; Peters Reference Peters2021), local labour markets (Braun and Mahmoud Reference Braun and Mahmoud2014), and human capital formation (Becker et al. Reference Becker2020). Further, Bauer, Braun, and Kvasnicka (Reference Bauer, Braun and Kvasnicka2013) study the economic integration of expellees and their offspring.
In general, the differences between these analyses and the present paper come from (i) their geographical scope of studying the entire country, (ii) their interest in long-term consequences over several decades, and (iii) economic outcomes versus political preferences. We are interested in the immediate effects of population size on political preferences pertaining to the organization of societies.
Political Landscape
To do so, we leverage municipality-level voting data in the first two major post-Second World War elections: the national elections held on 14 August 1949 and the state-level elections of 9 March 1952. The two major parties still dominating German politics today are the SPD and the CDU. Since its official foundation in 1890, the SPD – often referred to as ‘the Social Democrats’ – has been characterized by advocating for workers and ‘a long struggle for freedom and justice’ (also see Faulenbach Reference Faulenbach2012; SPD.de 2022).
The CDU has a shorter history, founded between 1945 and 1949 (see Bösch Reference Bösch2002 and CDU.de 2022). This ‘Christian-Democratic Union’ is often described as the continuation of a pre-Second World War party (Das Zentrum or The Centre), although the CDU's description emphasizes it cannot be directly traced to any one individual pre-Second World War party alone (CDU.de 2022). While an exact foundation date is difficult to pin down, the party's historical description states the period from 1945 to 1947 (CDU.de 2022). During that period, important conceptual events included the ‘Godesberger Reichstreffen’ (December 1945) and the publication of the ‘Düsseldorfer Leitsätze’ in July 1949, which formed the CDU's campaign programme for the 1949 elections. At this time, the party officially committed itself to a social market economy.
Following an election campaign spanning four weeks, those aged twenty-one and over were eligible to vote in 1949, resulting in a nationwide average turnout of 78.5 per cent (Bundeszentrale für Politische Bildung 2014a). The SPD received 29.2 per cent of all votes, while the CDU received 31 per cent of the overall vote. The smaller FDP (Freie Demokratische Partei, the Free Democratic Party), which advocated free-market policies, received 11.9 per cent. A coalition between the CDU and the FDP eventually emerged triumphant, forming an alliance that dominated West German politics until the mid-1960s (with minor coalition partners in between). Table B9 considers the relationship between population size and FDP voting. Predicting the combined vote shares for the CDU and the FDP produces results consistent with those from predicting CDU shares alone (see Table B4).
Next, the ideological differences between the two main German parties, as manifested by their respective campaigns (see Appendix A), are considered. Economic policy dominated both parties' election manifestos (for example, see Koch-Wegener Reference Koch-Wegener2007), while ethnic, racial, and religious characteristics remained largely absent during the campaign. The Konrad Adenauer Stiftung (2019), a conservative German think tank, frames the 1949 electoral choice as one pitting a social market economy and genuine competition (referring to the CDU) against socialization and a planned economy (referring to the SPD). The main SPD slogans included (Bundeszentrale für Politische Bildung, 2014b; Konrad Adenauer Stiftung, 2019):
• Now certainly: Socialization! SPD (original German: Nun erst recht: Sozialisierung! SPD)
• All millionaires vote CDU-FDP. All other millions of Germans [vote] SPD. (Alle Millionäre wählen CDU-FDP. Alle übrigen Millionen Deutsche die SPD.)
In turn, the CDU's campaign posters read:
• Freedom – Justice – Peace (Freiheit – Gerechtigkeit – Frieden)
• 1947 – Hunger! Distress! Misery! 1949 – Forward! Upwards! The success of the CDU! (1947 – Hunger! Not! Elend! 1949 – Vorwärts! Aufwärts! Der Erfolg der CDU!)
Therefore, the SPD represented a clear choice for voters who desired greater government involvement, whereas those favouring a smaller government would likely side with the CDU.
Data and Empirical Strategy
Data
Overview
Most of the data for the 824 municipalities of interest (from sixteen counties or Landkreise) were scraped from the Land BW (2020) webpage.Footnote 6 Information on population levels, vote shares, and control variables was merged with Schumann's (Reference Schumann2014) geographic distance variables. The database captures all municipalities partly or wholly located within 5 km of the French-US border (Schumann Reference Schumann2014, 193).
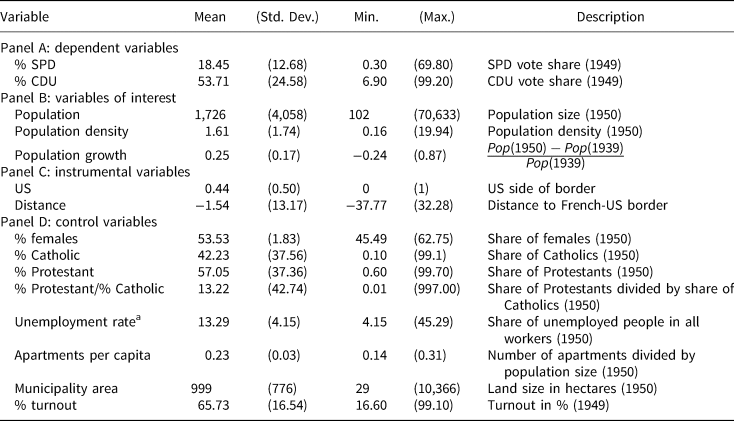
Table 1 documents summary statistics for all main variables of the 1949 national elections. Since population sizes were recorded after the election took place, it is possible that some people moved from low-SPD to high-SPD municipalities after the election, resulting in selection issues. In response, Schumann (Reference Schumann2014) shows that few people migrated in the following decades (also see Ciccone and Nimczik Reference Ciccone and Nimczik2022). Therefore, it seems even less likely that a sizable share of the population moved between August 1949 and 1950. Braun and Mahmoud (Reference Braun and Mahmoud2014, 71) report that ‘their [the expellees’] geographic mobility was severely restricted by law’ and ‘the geographic distribution of expellee[s] changed little before 1950’. Migration was prohibited at first and even in the late 1940s, it was only possible with a special permit (Braun and Mahmoud Reference Braun and Mahmoud2014). Further, our paper's results are consistent when analyzing state-level elections from 1952; that is, voting data taken after population size was measured in 1950 (see Section ‘State-level elections of 1952’).
Main summary statistics (n = 824)

Note: Variables in Panels A, B, and D come from Land BW (2020), while variables in Panel C are derived from Schumann (Reference Schumann2014) (with initial data from Statistisches Landesamt Baden-Württemberg, 1950).
a The unemployment rate is calculated by dividing the sum of people working in agriculture, manufacturing, trade, and other industries by the total population.
In general, the CDU was more popular in southwest Germany, with 53.8 per cent of votes, compared to the national average of 31 per cent. This pattern is consistent with longstanding, pre-Second World War preferences for conservative parties in the Southwestern part of Baden-Württemberg that eventually became the French administration zone. For example, in 1932, the Zentrum, often considered the CDU's predecessor, achieved significantly better outcomes in those municipalities than in the municipalities that eventually formed part of the US administration zone.Footnote 7 In 1949, the SPD averaged 18.5 per cent of votes across the 824 municipalities, compared to 29.2 per cent nationwide.
Panel B presents our independent variables of interest: population size, population density, and population growth from 1939 to 1950. The benchmark model considers the natural logarithm of population size, following the corresponding literature (see, for example, Alesina and Wacziarg Reference Alesina and Wacziarg1998; Krieger and Meierrieks Reference Krieger and Meierrieks2020; and Ram Reference Ram2009). For example, one would intuitively expect a rise from, say, 2,000 to 3,000 people to matter more than an increase from 20,000 to 21,000. Nevertheless, results are consistent when employing population density or population growth rates (see Section on ‘Robustness checks’). The average (median) municipality registered 1,726 (834) inhabitants, highlighting that the setting mainly concerned small villages and towns. The largest municipality (Esslingen am Neckar, on the US side) was home to just 70,633 inhabitants.
Panel C summarizes the key instrumental variables (IVs) with a binary indicator for municipalities on the American side (44 per cent or 365 out of 824 municipalities) and distance to the border.Footnote 8 Consistent with Schumann (Reference Schumann2014), communities on the US (French) side are treated with a positive (negative) distance value. Panel D comprises summary statistics for demographic and economic characteristics that could independently affect voting outcomes. Available variables include the shares of women, Catholics and Protestants, unemployment rates, apartments per capita, land area, and turnout rates. (In additional specifications, several variables unavailable for all 824 municipalities are accounted for to further address the role of potential confounders.)
These characteristics have, sometimes in slightly modified forms, been suggested to affect voting preferences, especially in post-Second World War Germany. Men and women have, for example, been shown to exhibit differential voting preferences (Abendschön and Steinmetz Reference Abendschön and Steinmetz2014). Religious affiliations have also been highlighted (Spenkuch and Tillmann Reference Spenkuch and Tillmann2018; Stegmueller Reference Stegmueller2013). Since the shares of Protestants and Catholics usually add up to almost 100 per cent while concurrently being strongly correlated (ρ = −0.99), we employ a variable that divides the share of Protestants by the share of Catholics. Higher unemployment rates may have led citizens to prefer the SPD's emphasis on full employment and larger transfers. Housing shortages (Vonyó Reference Vonyó2012) may have persuaded citizens to favour more government intervention. Conversely, municipality areas captured by agricultural land and farming measures were identified as negative correlates of SPD voting (Falter Reference Falter1981).Footnote 9
Compositional Differences
Central to the analysis is the assumption that expellees were comparable to natives regarding culture, ethnicity, and language. If this assumption is violated, expellee inflows may alter important characteristics of the receiving municipalities, which could affect voting outcomes. In that case, any link between community size and voting may not have been driven by population size but by population composition. The share of Protestants, for example, who traditionally voted in favour of the SPD (Scholz Reference Scholz2015), could undergird such a compositional change.Footnote 10 Expellees may also have been more likely to be female, while men were shown to lean towards the SPD, on average, in the 1949 elections (Falter Reference Falter1981). Therefore, the absence of suitable controls may introduce a bias in any estimated relationship between population size and voting outcomes.
To address these issues, we first explore the role of observable factors and pre-Second World War vote shares. Appendix Table B1 compares means of the observable characteristics between municipalities on the French and American sides, illustrating how those on the US side were more (less) likely to vote SPD (CDU) than those on the French side. While no statistical heterogeneity in sex ratios or municipality area emerges, religious shares, unemployment rates, apartments per capita, and voter turnout differed across administration zones. Communities on the French side featured an almost even share of Catholics and Protestants, while almost two-thirds of the average population on the American side identified as Protestant. Unemployment was marginally more prevalent on the American side (p-value of 0.055), although Ciccone and Nimczik (Reference Ciccone and Nimczik2022, 4) conclude that ‘in 1950, there was no significant difference in GDP per capita across the former occupation-zone border in South-West Germany’. Similarly, housing shortages could have motivated voters to favour the SPD's redistributive policies. Therefore, economic characteristics of employment opportunities and real estate constitute important covariates in the analysis.
Further, subsequent specifications incorporate additional variables, including: (i) SPD voting data from 1932 (to account for pre-existing political preferences), (ii) the share of land used for agriculture, (iii) households per capita, (iv) the share of single-family households, (v) the real estate tax rate multiplier (to capture the post-Second World War housing situation better), and (vi) linear and quadratic distances to the highway and the capital Stuttgart. Table B2 documents the corresponding summary statistics. These are partly excluded from the baseline analysis due to the paucity of data. Nevertheless, their inclusion does not alter the conclusions (Tables 2 and B4).
Main results, predicting vote shares in the 1949 national elections

Notes: Robust standard errors are displayed in parentheses. *p < 0.10, **p < 0.05, ***p < 0.01.
a Includes percentage of females, Protestants/Catholics, percentage unemployed, apartments per capita, municipality area, and percentage turnout.
b Includes the 1932 SPD vote share, the share of the municipality area used to grow forage crops, the share of single-people households, households per capita and the municipal real estate tax rate multiplier while excluding apartments per capita.
c Applying Cinelli and Hazlett's (Reference Cinelli and Hazlett2020) sensitivity test.
d Applying Oster's (Reference Oster2019) test, assuming a maximum R 2 of one.
e We perform Wooldridge's (Reference Wooldridge1995) robust score test with Stata's post-estimation command estat endogenous after the ivregress 2sls command.
f First-stage effective F-statistics are computed using a robust F-test procedure for weak instruments (Olea and Pflueger Reference Olea and Pflueger2013; Pflueger and Wang Reference Pflueger and Wang2015).
g Following Magnusson's (Reference Magnusson2010) and Finlay, Magnusson, and Schaffer's (Reference Finlay, Magnusson and Schaffer2013) weak instrument tests.
h We implement the estat overid command after the ivregress 2sls command.
In addition to accounting for these covariates, alternative explanations of these estimates are possible: these would emphasize compositional effects rather than population size effects. In particular, two alternative narratives appear possible from historical and descriptive accounts: voting patterns of expellees themselves and a potential backlash effect by native voters. Sections ‘Expellee voting’ and ‘An anti-expellee Backlash?’ explore these hypotheses in detail.
Empirical Strategy
We estimate a level-log regression predicting the SPD vote share of municipality i in the 1949 elections:

In alternative settings, we also predict CDU vote shares (Table 2), the combined CDU-FDP vote shares (Table B4), and the 1952 state-level election outcomes (Section ‘State-level elections of 1952’). ln (population)i represents the natural logarithm of the municipality's populace, measured in 1950. In alternative specifications, population density and population growth rates from 1939 as alternative variables of interest are employed (see Section ‘Robustness checks’). The vector Xi includes the above covariates, which may independently affect voting preferences, while $\varepsilon _i$ captures the error term. Robust standard errors are calculated throughout.
Endogeneity concerns, particularly related to omitted variables, threaten the causal interpretation of β 1 in equation (1). To alleviate such concerns, we instrument ln (population)i with several variables that capture municipality i‘s location with respect to the French-US border. This benchmark regression follows Schumann (Reference Schumann2014) by including a binary indicator for the US side, linear and squared border distance measures in tandem with interaction terms, as well as the product of the binary US variable and both distance measures:

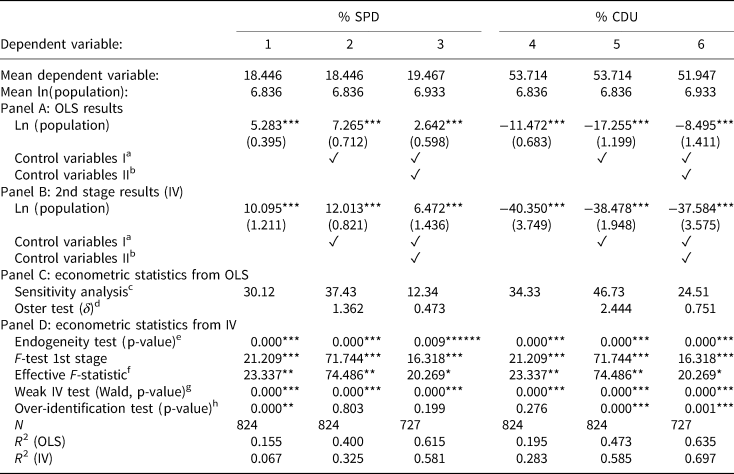
Equation (1) is estimated using two-stage least squares (2SLS), and Section 4.2 discusses a variety of robustness checks. Put differently, in the first stage, this identification makes full use of Schumann's (Reference Schumann2014) empirical strategy to isolate plausibly exogenous variation in a municipality's population size based on its relative geographical location with respect to the French-US border. From there, we employ the predicted value of population size in the second-stage to understand potential causal links between population size and SPD voting. Figure 2 illustrates the identification strategy.
Exploring effects of population size on SPD voting, exploiting the identification strategy of population size from Schumann (Reference Schumann2014) in the first stage.

Empirical Findings
National Elections of 1949
Graphical illustration
Figure 3 plots population size against SPD and CDU vote shares. The observed patterns document how more populous municipalities were more likely to favour the SPD, whereas smaller communities gravitated towards the CDU. However, these graphical illustrations incorporate neither covariates nor address concerns of endogeneity.
Correlation between population size (x-axis) and vote shares (y-axes).

OLS results
Table 2 reports the main results, with Panel A documenting OLS estimates and Panel B turning to the corresponding instrumental variable (IV) estimates. Panels C and D display various test statistics. Columns (1)–(3) consider SPD voting as the outcome variable, subsequently introducing control variables, while columns (4)–(6) follow the same sequence to predict CDU voting. As the estimated coefficients of control variables are not the main focus here, Table B3 reports these in detail.
Beginning with OLS estimates, Panel A shows a strong positive (negative) and statistically significant correlation between population size and SPD (CDU) vote shares. Bivariate model estimates in columns (1) and (4) associate a 10 per cent increase in population size with a 0.53 percentage point increase in SPD votes and a 1.1 percentage point decrease in CDU votes. In both cases, the estimated coefficients yield p-values below 0.001, highlighting the robust correlation between community size and voting patterns observed in Fig. 3.
Columns (2) and (5) turn to the benchmark specification, including the main covariates outlined above. The corresponding magnitudes strengthen with the initially suggested signs prevailing. Columns (3) and (6) add further regressors with the SPD vote shares from the 1932 Reichstag elections to capture historical voting patterns, the share of the municipality area used for agriculture, the share of single-people households, households per capita, and the real estate tax rate multiplier. Because the CDU was founded in 1945, column (6) controls for SPD (rather than CDU) vote shares in 1932. Note that ninety-seven observations were lost because of data availability when incorporating these additional control variables.
In this final set of OLS regressions, population size remains a positive (negative) and statistically powerful predictor of SPD (CDU) voting, with p-values below 0.001. The corresponding magnitudes diminish, mainly due to accounting for SPD votes in 1932. Re-estimating column (3) without SPD vote shares in 1932 (yet still using the corresponding 727 observations) produces a population size coefficient of 6.725 (not displayed). In column (6), such a specification produces a coefficient of −13.666 (not displayed).
Panel C documents the results from two tests to explore how influential unobservable confounders would have to be to explain the coefficient associated with population size fully. First, we implement Cinelli and Hazlett's (Reference Cinelli and Hazlett2020) sensitivity test, which calculates the percentage value of the residual variance (related to both the treatment and the outcome) that would be necessary to render the population coefficient statistically insignificant at conventional levels (labelled RV_qa in Cinelli and Hazlett Reference Cinelli and Hazlett2020). The complete specification produces a value of 12.34 per cent when predicting SPD votes and 24.51 per cent when predicting CDU votes. Given R 2 values of 0.615 and 0.635, such dimensions are certainly feasible, although the corresponding omitted variables would have to be powerful predictors of voting behaviour.
Second, and closely related, Oster's (Reference Oster2019) test allows the researcher to quantify the degree of selection on unobservables relative to observables that would be necessary to explain away the population result (δ), given a maximum R 2 of 1 (see Oster Reference Oster2019, 5). We derive a δ value below 0.5 for SPD voting and 0.75 for CDU voting; that is, it is possible for unobservables to meaningfully influence the respective OLS estimates since the commonly suggested threshold of δ lies at 1. These results advise caution in interpreting the OLS results as causal.
IV results
To address potential violations of the exogeneity condition, Panel B presents estimates from IV regressions following the same modelling sequence. Predicting SPD voting, we observe positive and statistically significant estimates (p-values below 0.001 in all three regressions). Column (2) constitutes the benchmark with the basic set of covariates included, while column (3) further includes additional observable confounders. Predicting CDU voting also confirms the correlational insights from OLS regressions: municipalities are systematically less likely to vote CDU as populations increase.
The corresponding magnitudes are higher in absolute terms than OLS estimates throughout columns (1)–(6). For example, column (2) suggests a 10 per cent increase in population size would translate into the SPD gaining 1.2 percentage points in vote shares, on average, rather than 0.7 percentage points in the respective OLS regression. Such a 10 per cent rise in community size would correspond to as much as a 3.8 percentage point drop in CDU votes.
Several potential reasons exist for these quantitative differences between the IV and OLS estimates. First, as with any IV estimation, we identify a local average treatment effect (LATE; Angrist and Pischke Reference Angrist and Pischke2008); that is, the identification builds on the statistical variation in population size that stems from the IVs pertaining to the French-US border. Second, IV estimates correct for a potential attenuation bias in the measurement of the endogenous variable. Although there is faith in the veracity of the population numbers, the documentation of exact head counts may have been imprecise in the aftermath of the Second World War. Third, omitted variables may introduce a downward (an upward) bias into conventional OLS estimates in the case of SPD (CDU) voting. Intuitively, unobservable factors may correlate with larger populations in tandem with weaker preferences for larger governments. Although it lies beyond the scope of this paper to comprehensively delineate between such narratives, their combination likely explains the OLS-IV differences in magnitudes.
Finally, Panel D reports various test statistics associated with the IV estimates. The first stage models comfortably pass the traditional rule-of-thumb F-test threshold level of 10 (Staiger and Stock Reference Staiger and Stock1997), with the estimated coefficients closely in line with Schumann's (Reference Schumann2014). Applying more recent tests for weak instruments, developed by Olea and Pflueger (Reference Olea and Pflueger2013) and Magnusson (Reference Magnusson2010), engenders further confidence in their validity.
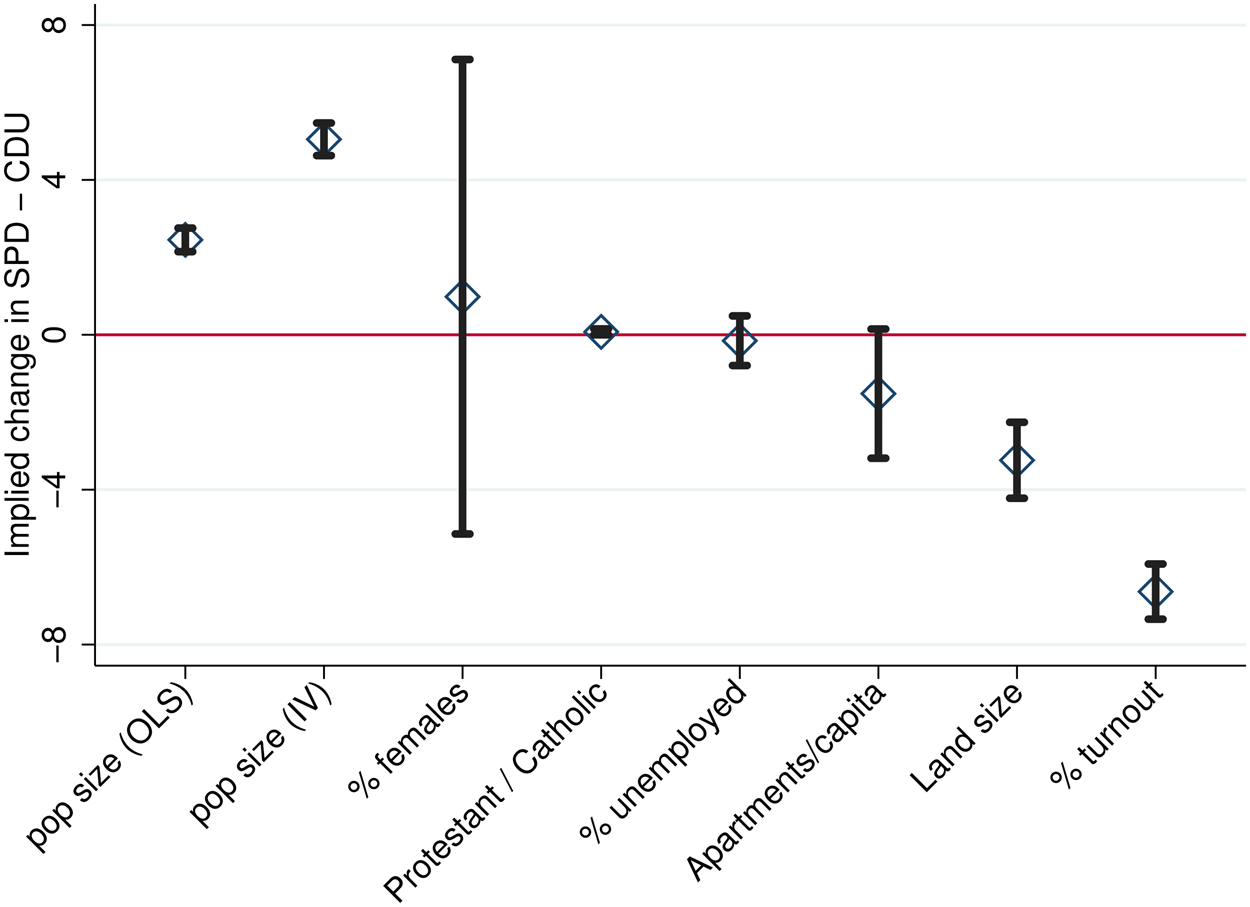
To better compare quantitative interpretations in one visual, Fig. 4 plots estimated coefficients from predicting the difference between SPD and CDU vote shares; that is, the outcome variable measures SPD minus CDU vote shares. To illustrate realistic changes, we assume a 10 per cent change for the logarithmic value of population size and, for the other variables, we muliply the corresponding coefficient with a value equivalent to 10 per cent of their mean.
Visualizing coefficients from OLS (left) and IV regression results (all remaining coefficients) to predict the difference between SPD and CDU vote shares (% SPD–% CDU). We assume a 10 per cent change in population size, and each remaining coefficient is multiplied by 10 per cent of its respective mean. All models include the standard set of control variables from columns (2) and (5) of Table 2. Ninety-five per cent confidence intervals are displayed.

OLS estimates imply a 10 per cent population increase closes the gap between both parties by 2.5 percentage points in the SPD's favour. IV estimates are twice as large at 5 percentage points. The magnitudes of both estimates are large compared to the remaining covariates. Sex ratios, religious shares, the unemployment rate, and apartments per capita remain statistically indistinguishable from zero, while land size and voter turnout produce negative coefficients.
Robustness Checks
Border distance, alternative population measures, and IV definition
Appendix Table B4 documents results from several alternative specifications, building on columns (2) and (5) of Table B4. In those: we (i) focus on municipalities with centroids located within 10 km of the border (as opposed to those located at least partly within 5 km), (ii) exclude municipalities located in the two largest counties (Calw and Biberach),Footnote 11 (iii) implement alternative identification strategies based on a binary US side measure or only use the linear variables from equation (2), (iv) expand the sample to comprise all of Baden-Württemberg, while using a simple binary indicator for being located on the US side as an IV (Table B6 provides summary statistics), (v) employ population density and population growth rates from 1939 as alternative variables of interest, and (vi) predict the combined vote shares of the CDU and the FDP (in Panel B). The corresponding conclusions are consistent as population size is positively (negatively) and statistically significantly predictive of SPD (CDU) voting. This is the case whether or not OLS or IV estimates are considered.
Column (9) of Table B4 considers the 1932 and 1949 election results of the SPD. To exploit the fact that only municipalities on what was to become the US side of the border experienced a quasi-exogenous influx of population – only in 1949 – we estimate the following first stage for municipality i in election year t:

where After i,t takes on the value of one (zero) for observations in 1949 (1932). Ωi,t incorporates After i,t, U.S.i, and Distance i, as well as sex ratios, religious shares and land area since those variables are available for 1932 and 1949. We therefore employ the linear instruments from the cross-sectional setting interacted with the After i,t variable as IVs while controlling for the respective location variables. This estimation filters out any remaining statistical variation from location- and time-period-specific unobservables that might otherwise be related to both population size and voting patterns. The second stage becomes:

where $\widehat{{\ln {( {population} ) }_{i, t}}}$ captures the predicted population value from equation (3). The corresponding results, both from estimating equation (4) in an OLS framework and when following the identification strategy laid out in equation (3), again produce positive and statistically significant coefficients associated with population size. Note: such an estimation for CDU voting could not be conducted since that party was only founded in 1945.
Finally, column (10) of Table B4 reports results from incorporating linear and squared distance variables to the highway and the state capital Stuttgart. Again, the OLS and IV estimates related to population size retain their signs and statistical significance levels, showing that these geographical factors remain inconsequential to the main results.
Fractional response regressions
Fractional response regressions (Papke and Wooldridge Reference Papke and Wooldridge1996; Papke and Wooldridge Reference Papke and Wooldridge2008; Ramalho and Ramalho Reference Ramalho and Ramalho2017) are considered next, which allows the modelling of a bounded response with heterogeneous and diminishing effects as covariates vary. Linear models are not well suited to fractional responses because imposing a positive yet bounded effect for each covariate is difficult.Footnote 12 Table B7 reports the corresponding results from predicting SPD and CDU vote shares.Footnote 13 The estimated average partial effect of community size on SPD voting remains positive and statistically significant. We also obtain a negative and statistically significant estimate when predicting CDU voting that rises once endogeneity is accounted for.Footnote 14
State-Level Elections of 1952
Table B8 presents results from focusing on the 1952 state-level elections, following the same analytical sequence as Table 2. In these elections, the CDU received 36 per cent of all votes, while 28 per cent of the electorate favoured the SPD. The corresponding insights once again indicate a pronounced effect of population size. Across all OLS and IV estimates, we find positive (negative) coefficients predicting SPD (CDU) voting with levels of statistical significance that comfortably clear all conventional threshold levels. Magnitudes are comparable to those in Table 2 and, if anything, become larger in absolute magnitude.
Alternative Explanations
Expellee Voting
One concern associated with our findings relates to the expellees' own voting behaviour. If expellees strongly favoured the SPD, the estimated coefficient could be spuriously driven by the voting preferences of expellees as opposed to those of the wider population. Historically, there are no clear indications that expellees favoured one party more than the natives in 1949. Nationally, a larger share of expellees per county correlated with worse SPD results (Falter Reference Falter1981). Nevertheless, Falter (Reference Falter1981, 255) also reports the expellees’ share negatively correlates with CDU voting. Other studies suggest left-leaning inhabitants of the Sudetenland, an area of emerging Czechoslovakia from which many expellees coming to Baden-Württemberg originated, did not leave because the Red Army did not force them to leave (sometimes because of collaboration against the Nazis) or because they did not feel threatened by a communist regime (Grossmann et al. Reference Grossmann, Jurajda and Roesel2021). Such narratives would suggest that expellees' political preferences were, if anything, skewed towards smaller, anti-communist governments. For example, studying district-level data, Menon (Reference Menon2020) suggests larger population shares of expellees are related to more right-wing attitudes in the long run.
Two additional attributes mitigate underlying concerns. First, our analysis accounts for a comprehensive list of observable characteristics that have been associated with expellees and voting behaviour, such as the local housing situation, religious compositions, unemployment rates, and sex ratios. Second, the CDU, rather than the SPD, explicitly promised the alleviation of housing shortages (Falter Reference Falter1981). With significantly fewer apartments per capita being available on the US side (Table B1), this should, if anything, elicit preferences for the CDU among the expellees. In addition, the CDU, rather than the SPD, demanded an explicit compensation scheme for the expellees. Further, the expellee party of the ‘League of Expellees and Disenfranchised’ (Block der Heimatvertriebenen und Entrechteten, BHE) that formed around the time (but did not appear in the elections of interest in Baden-Württemberg) closely aligned with the CDU (Bösch Reference Bösch2016). Appendix C provides further discussion on expellees' party membership in post-Second World War Germany.
Empirically, we can calculate the expellee voting behaviour that would be necessary to produce our quantitatively sizeable estimates. This is because expellee shares of each municipality's population, averaging 15.2 per cent across the sample, are known (21.6 per cent on the US side; 10.2 per cent on the French side). Appendix D lays out the associated steps. The corresponding results imply that, in an average municipality, expellees would have had to be almost ten times more likely to vote SPD than the natives. For example, if 10 per cent of the natives voted SPD, then almost 100 per cent of the local expellees would have had to select the SPD to explain the observed estimates. Considering the CDU results, we derive yet more unrealistic numbers. Mathematically, in 273 of the 824 municipalities, local expellees would have had to produce negative CDU vote shares to yield the estimates shown in Table 2.
Importantly, these back-of-the-envelope calculations even assume the most favourable parameters related to turnout and voting eligibility rates among the expellee population. Even then, an explanation of the results consistent with expellee voting behaviour remains unlikely, if not impossible. Appendix D provides additional discussion on this mathematical exercise and more historical background along the lines of expellee voting patterns.
An Anti-Expellee Backlash?
A second alternative explanation of the results relates to the natives' voting behaviour. Specifically, if the arriving expellees were primarily considered an out-group and were met with prejudice, some natives may have explicitly voted against the expellees' interests. For example, some historical accounts associate the expellees with more pro-Nazi sentiments – and if locals wanted to resist right-wing tendencies, they might have moved left of the political spectrum for that reason.Footnote 15
This alternative narrative is countered in several independent avenues. First, suppose expellees really posed a systematic political threat to the natives. In that case, we should expect the share of expellees in the local population to act as a meaningful confounder in the main specifications, potentially driving some of the main results in Table 2. We re-estimate Table 2 to explore this possibility, including the share of expellees in the local population as an additional covariate.Footnote 16 The corresponding results are available in Table B5, documenting that the main coefficients pertaining to population size remain qualitatively unchanged, retaining statistical significance levels at the 1 per cent level throughout and quantitatively sizeable.
Second, assuming that expellees were perceived as a threatening out-group, the existing literature would suggest that a community should exhibit reduced preferences for substantial government involvement and redistribution (Alesina, Murard, and Rapoport Reference Alesina, Murard and Rapoport2019). Intuitively, expellees would likely have benefitted relatively more than the natives from the redistribution policies advocated by the SPD – in which case, natives should, theoretically, choose to avoid the SPD to prevent such redistribution.Footnote 17
Third, if expellees held more pro-Nazi ideological sentiments when compared to natives, then the 1949 election would have needed to be contested, at least to some degree, at ideological levels (for example, related to ethnic, racial, or even religious characteristics) in order to explain the estimates of interest. However, virtually all accounts of that election illustrate how economic development was the primary focus of the time – a racial ideology resembling a distant similarity to the Nazis cannot be found in the SPD or the CDU campaign programmes. This becomes clear when considering campaign posters (see Sections ‘Political landscape’ and Appendix A).
Taken together, an alternative explanation related to a backlash by the natives would be inconsistent with the estimates posited. If anything, voting for the SPD was associated with a more centralized understanding of society and, therefore, a more unified philosophy of seeing the German post-Second World War population as a singular entity. That pattern would not be observed if the natives were unwilling to share the post-Second World War burden of reconstruction with the expellees that now formed part of their communities.
Conclusion
This paper asks whether community size affects preferences for government involvement, exploiting a plausibly exogenous population shock in post-Second World War Southwest Germany. The corresponding results are remarkably consistent across an array of OLS and IV specifications. More populous municipalities systematically exhibited larger SPD vote shares (the party favouring more government involvement) while exhibiting weaker preferences for the CDU in the 1949 national elections. The results are consistent when accounting for several potentially confounding factors, such as municipality-level demographics, economic and religious factors, location- and time-specific attributes, and pre-Second World War vote shares. We find consistent results when studying the 1952 state-level elections.
This study is not free of limitations and we briefly want to discuss those we deem most salient. First, the setting is specific in terms of community size, geography, and time frame, with relatively small municipalities in post-Second World War Southwest Germany, so we heed caution in generalizing the empirical insights. Second, although expellees were (likely) closely comparable along cultural, ethnic, language, and religious dimensions (at least conditional on the list of covariates), it is still possible that they were seen as ‘intruders’, at least by some locals. If that were the case, comparable settings would predict that locals prefer parties advocating less government involvement and redistribution, however (Alesina, Murard, and Rapoport Reference Alesina, Murard and Rapoport2019). Third, the French and US administrative zones and their philosophies about government may have variously influenced German voters. If anything, however, this would mean that the US influence should generate less support for extended government involvement, given the Americans' overt preferences for smaller government. For example, historical records show that the US administration openly supported the free market structures advanced by the CDU (Koch-Wegener Reference Koch-Wegener2005; Koch-Wegener Reference Koch-Wegener2007). These estimates and historical accords mean that expellee voting cannot explain the results. Fourth, an open question remaining asks why community size would systematically affect voting preferences. While this setting does not permit a detailed study of delineating potential mechanisms, we want to offer what we believe to be the most probable explanation. As a community expands, interpersonal relationships become less informal – simply because it is impossible to foster close connections with too many people (for example, see ‘Dunbar's number’; Dunbar Reference Dunbar1992). Such a development can be addressed by more formalized rules and regulations that structure societal coexistence and more government involvement. Similarly, as a population grows, tasks previously resolved on a private, case-by-case basis benefit from centrally organized planning that improves efficiency. For example, public transport, education, and infrastructure systems only become viable with sufficient population numbers. While these potential narratives do not form a full list of potential mechanisms, we hope they stimulate further research along those lines.
Overall, what are the practical implications of these results beyond improving our understanding of historical developments? If the suggested positive, causal relationship between population size and government preferences is confirmed in other settings, this could provide powerful lessons for policymakers. Anticipating changes in preferences might help polities plan and transform government programmes, especially in areas experiencing rapid population growth. This paper highlights the salience of community size as a potential driver of such preferences, which, we hope, will catalyze further scientific inquiry in this field.
Supplementary material
The supplementary material for this article can be found at https://doi.org/10.1017/S0007123423000327.
Data availability statement
Replication Data for this article can be found in Harvard Dataverse at: https://doi.org/10.7910/DVN/ZJBOFQ.
Acknowledgements
We are grateful to Abel Schumann for generously providing us with data and to Eva Indinger-Gissel and Christina Hackl (Statistisches Landesamt Baden-Württemberg) for sharing data. We are thankful to Raphael Boleslavsky, Jon H. Fiva, Niklas Potrafke, Daniel Reck, Fabian Ruthardt, Eik Swee, Fabian Wahl, Michael Wyrwich, seminar participants at the University of Miami, the University of Melbourne, and the Southern Methodist University, as well as conference participants at the CESifo Area Conference on Public Economics, for providing valuable comments on earlier drafts. Ahmad Tohari provided invaluable research assistance. Any remaining errors are our own.
Author contributions
Authors are listed in alphabetical order. All authors contributed equally to the completion of this paper.
Financial support
None.
Competing interests
None.


 Open access