


Significant Outcomes
-
Individuals diagnosed with borderline personality disorder (BPD) differed significantly from healthy controls (HCs) in overall rejection rates of monetary offers.
-
Contrary to our hypothesis based on clinical theory, people diagnosed with BPD did not demonstrate different behaviour compared to healthy individuals in response to norm shifts in ultimatum game offer size.
-
Ultimatum game behaviour was not associated with differences in either reinforcement learning models or functional magnetic resonance imaging BOLD activation in people with a diagnosis of BPD compared to HC.
Limitations
-
Though the overall sample was large, there were only 25 participants within each group and condition, limiting statistical power to detect small effects.
-
Many participants diagnosed with borderline personality disorder (BPD) were taking psychotropic medications that could directly or indirectly influence dopaminergic signalling during decision-making, and given the recruitment from clinical services, many participants likely engaged in psychotherapy tailored to BPD, potentially influencing their responses toward societal norms.
-
Consistent with many BPD studies, our sample was predominantly female, and although we matched by gender ratio in the control group, this limits generalisability beyond the female population.
Introduction
Background
Individuals diagnosed with borderline personality disorder (BPD) exhibit patterns of instability across interpersonal relationships, self-image, and affect. These characteristics of BPD are thought to involve hyper-responsive amygdala and insula, and ineffective control by the prefrontal cortex when processing negative emotions (Ruocco et al., Reference Ruocco, Amirthavasagam, Choi-Kain and McMain2013; Schulze et al., Reference Schulze, Schmahl and Niedtfeld2016). However, the neurobiological approach cannot independently capture the social and relational consequences of these impairments.
Game theory has emerged as a useful frame for examining how social impairments underlying psychiatric illness manifest in interpersonal exchanges. Neuroeconomic tasks such as the trust game, dictator game, and ultimatum game allow for the study of dynamic interpersonal behaviours – such as trust, cooperation, and responsiveness to social cues – that may underlie relationship ruptures. These tasks have been applied successfully to study interpersonal dynamics in BPD: BPD symptoms have been associated with inability to recognise and repair relationship ruptures (King-Casas et al., Reference King-Casas, Sharp, Lomax-Bream, Lohrenz, Fonagy and Montague2008), higher sensitivity to unfairness (Franzen et al., Reference Franzen, Hagenhoff, Baer, Schmidt, Mier, Sammer, Gallhofer, Kirsch and Lis2011), different inference of idealisation and devaluation of others (Story et al., Reference Story, Ereira, Valle, Chamberlain, Grant and Dolan2024), social learning (Barnby et al., Reference Barnby, Nguyen, Griem, Wloszek, Burgess, Richards, Kingston, Cooper, Montague and Dayan2025), and decreased cooperation (Saunders et al., Reference Saunders, Goodwin and Rogers2015). Still, several neuroeconomic studies have found no (or very small effect size) pathology-related impairments in game behaviour, providing examples of preserved aspects of social function in BPD (Unoka et al., Reference Unoka, Seres, Aspán, Bódi and Kéri2009; Bartz et al., Reference Bartz, Simeon, Hamilton, Kim, Crystal, Braun, Vicens and Hollander2011; Polgár et al., Reference Polgár, Fogd, Unoka, Sirály and Csukly2014).
This paper focuses specifically on one neuroeconomic paradigm, the ultimatum game. The ultimatum game has been intensively studied experimentally for over four decades (Güth et al., Reference Güth, Schmittberger and Schwarze1982) because it provides a simple example of how humans sometimes violate standard, normative economic accounts of behaviour. The ultimatum game is a multi-round task where in each round, a new proposer presents a respondent with a monetary offer (a take-it-or-leave-it split of some total sum). The respondent may either accept the split or reject (and both leave empty-handed). A normative account of behaviour in this game is given by the following. The responder should accept any non-zero offer (they prefer something to nothing) and are indifferent to zero offers. Assuming a smallest positive offer size and that the responder rejects a zero offer, the proposer should offer the smallest amount possible (Fehr & Schmidt, Reference Fehr and Schmidt1999); this is a subgame perfect Nash equilibrium (SPNE; if the responder accepts the zero offer, the proposer offering zero is also a SPNE) (Fudenberg & Tirole, Reference Fudenberg and Tirole1991; Fehr & Schmidt, Reference Fehr and Schmidt1999). However, this is not what is observed in human behaviour. Across many experiments, humans reject nonzero offers; offers < ∼20% endowment are in fact rejected about half the time (Camerer, Reference Camerer2003). An influential approach taken to explain this behaviour is to appeal to fairness: people value fairness in addition to monetary considerations (Fehr & Schmidt, Reference Fehr and Schmidt1999). Fairness, in turn, can then be more broadly situated in the framework of social norms (Bicchieri, Reference Bicchieri2005; Montague & Lohrenz, Reference Montague and Lohrenz2007). Concretely, the utility or value of an offer can be modified by deviations from a fairness norm (Fehr & Schmidt, Reference Fehr and Schmidt1999). An important focus of neuroeconomics has been on the neural substrates of value (Rangel et al., Reference Rangel, Camerer and Montague2008), and so naturally there has been interest in the neural substrates of these modifications of the normative economic accounts of value (Sanfey et al., Reference Sanfey, Rilling, Aronson, Nystrom and Cohen2003; Xiang et al., Xiang et al., Reference Xiang, Lohrenz and Montague2013; Gu et al., Reference Gu, Wang, Hula, Wang, Xu, Lohrenz, Knight, Gao, Dayan and Montague2015).
Previous studies with the ultimatum game have found modest significant differences in rejection rates between respondents with a BPD diagnosis and healthy controls (HCs). In one study, individuals diagnosed with BPD rejected offers less than HC respondents (Polgár et al., Reference Polgár, Fogd, Unoka, Sirály and Csukly2014). Conversely, another study found that people with higher BPD features rejected more offers (Thielmann et al., Reference Thielmann, Hilbig and Niedtfeld2014). This disagreement may be attributable to inter-study variation in cohort sizes, offer amounts ($0.03–0.14 in Polgár et al., Reference Polgár, Fogd, Unoka, Sirály and Csukly2014; $54–70 in Thielmann et al., Reference Thielmann, Hilbig and Niedtfeld2014), and task conditions in addition to the differences in cohort definition (one group of people meeting criteria for diagnosis, another assessing differences in trait intensity). Still other studies have found no pathology-specific differences in ultimatum game rejection or cooperation behaviours, suggesting further investigation to reconcile these findings may be needed (Doppelhofer et al., Reference Doppelhofer, Löloff, Neukel, Herpertz and Korn2025).
Here, we aim to extend previous work with data from two versions of a sixty-round, three-phase ultimatum game played during functional magnetic resonance imaging (fMRI). Reward magnitudes (i.e., offer norms) changed between phases. The first and third phases presented moderate offer sizes, while the second phase introduced a version-dependent norm shift (to either advantageous/high offers or disadvantageous/low offers). These iterations of the ultimatum game, which involve moderate offer sizes, social provocation in the form of norm violations, and a large cohort, may provide a step toward consensus about BPD behaviour in this context.
Past analyses of the ultimatum game explored general sensitivity to offer size, offering insight into participants’ internal norms on fairness under stable social conditions. Norm violations extend these concepts to a dynamic social context and allow us to examine recognition of and response to enduring social change. This experimental social provocation might better model the complexity of real-world interpersonal interaction, as prior expectations are dynamically updated in the face of changing social cues.
Hypotheses
We applied computational models to study the affective, behavioural, and neural responses to the game. We tested several a priori hypotheses for this analysis:
-
H1: We expected individuals diagnosed with BPD to be more reactive to reward magnitude than HCs, such that:
-
H1a: Individuals with BPD would demonstrate greater rejection rates across the three phases of the task.
-
H1b: Rejection rates would be differentially higher in BPD in response to low offers.
-
H1c: Individuals with BPD would respond to the first norm shift (phase one to two) with a greater change in rejection behaviour.
-
H1d: Responses to the second norm shift (phases two to three) would diverge: HCs would recover initial phase one rejection rates faster than individuals with BPD.
-
-
H2: We expected higher magnitudes for computational parameters of envy (alpha) and guilt (beta) in BPD compared to HC, demonstrating increased sensitivity to norm shifts.
-
H3: We expected fMRI analyses would reveal group-wise correlations in valence and salience processing of norm prediction errors and task behaviour.
Materials and methods
Ethics
The authors assert that all procedures contributing to this work comply with the ethical standards of the relevant national and institutional committees on human experimentation and with the Helsinki Declaration of 1975, as revised in 2008. Written informed consent was obtained from each participant using procedures approved by Research Ethics Committee for Wales, 12/WA/0283.
Recruitment and assessment
Patients diagnosed with BPD were recruited from a research program involving specialist personality disorder services of seven London NHS Mental Health Trusts across five London boroughs (Wendt et al., Reference Wendt, Wright, Pilkonis, Nolte, Fonagy, Montague, Benecke, Krieger and Zimmermann2019; Huang et al., Reference Huang, Fonagy, Feigenbaum, Montague and Nolte2020; Euler et al., Reference Euler, Nolte, Constantinou, Griem, Montague and Fonagy2021; Michael et al., Reference Michael, Chennells, Nolte, Ooi, Griem, Network, Christensen, Feigenbaum, King-Casas and Fonagy2021; Rifkin-Zybutz et al., Reference Rifkin-Zybutz, Moran, Nolte, Feigenbaum, King-Casas, Personality, Consortium, Fonagy and Montague2021; Stagaki et al., Reference Stagaki, Nolte, Feigenbaum, King-Casas, Lohrenz, Fonagy and Montague2022; Wendt et al., Reference Wendt, Jankowsky, Schroeders, Fonagy, Montague, Zimmermann and Olaru2023). BPD diagnoses were confirmed by psychologist-administered clinical interviews, including the Structured Interview for DSM-IV Personality (Pfohl et al., Reference Pfohl, Blum and Zimmerman1997). Healthy participants were recruited from community settings (Internet, notice boards, universities, and job centers) and screened using the Standard Assessment of Personality, Abbreviated Scale (SAPAS), a brief, reliable screen with 94% sensitivity and 85% specificity for personality disorder in clinical settings (Fok et al., Reference Fok, Seegobin, Frissa, Hatch, Hotopf, Hayes and Moran2015). Individuals with a SAPAS score of 3 or higher were excluded from the control group.
The clinical symptoms of all participants were assessed with two scales: the Personality Assessment Inventory – Borderline Features (PAI-BOR), a self-report of BPD symptomatology with four subscales scored 0–18 and the Brief Symptom Inventory (BSI), a self-report of psychological distress scored 30–120 (Boulet & Boss, Reference Boulet and Boss1991; Kim et al., Reference Kim, Kim, Oh, Lim and Hong2001). BSI scores have previously been demonstrated to correlate with psychopathology (Boulet & Boss, Reference Boulet and Boss1991; Piersma et al., Reference Piersma, Reaume and Boes1994; Kellett et al., Reference Kellett, Beail, Newman and Frankish2003). In the present sample, BSI scores were substantially lower in the healthy participant group compared to the BPD group, consistent with the assessment of low overall psychopathology in this group. General intelligence of all participants was assessed using the Raven’s progressive matrices (RPM) test. Participants with an RPM score at or below the 5th percentile were excluded due to intellectual impairment.
Experimental paradigm
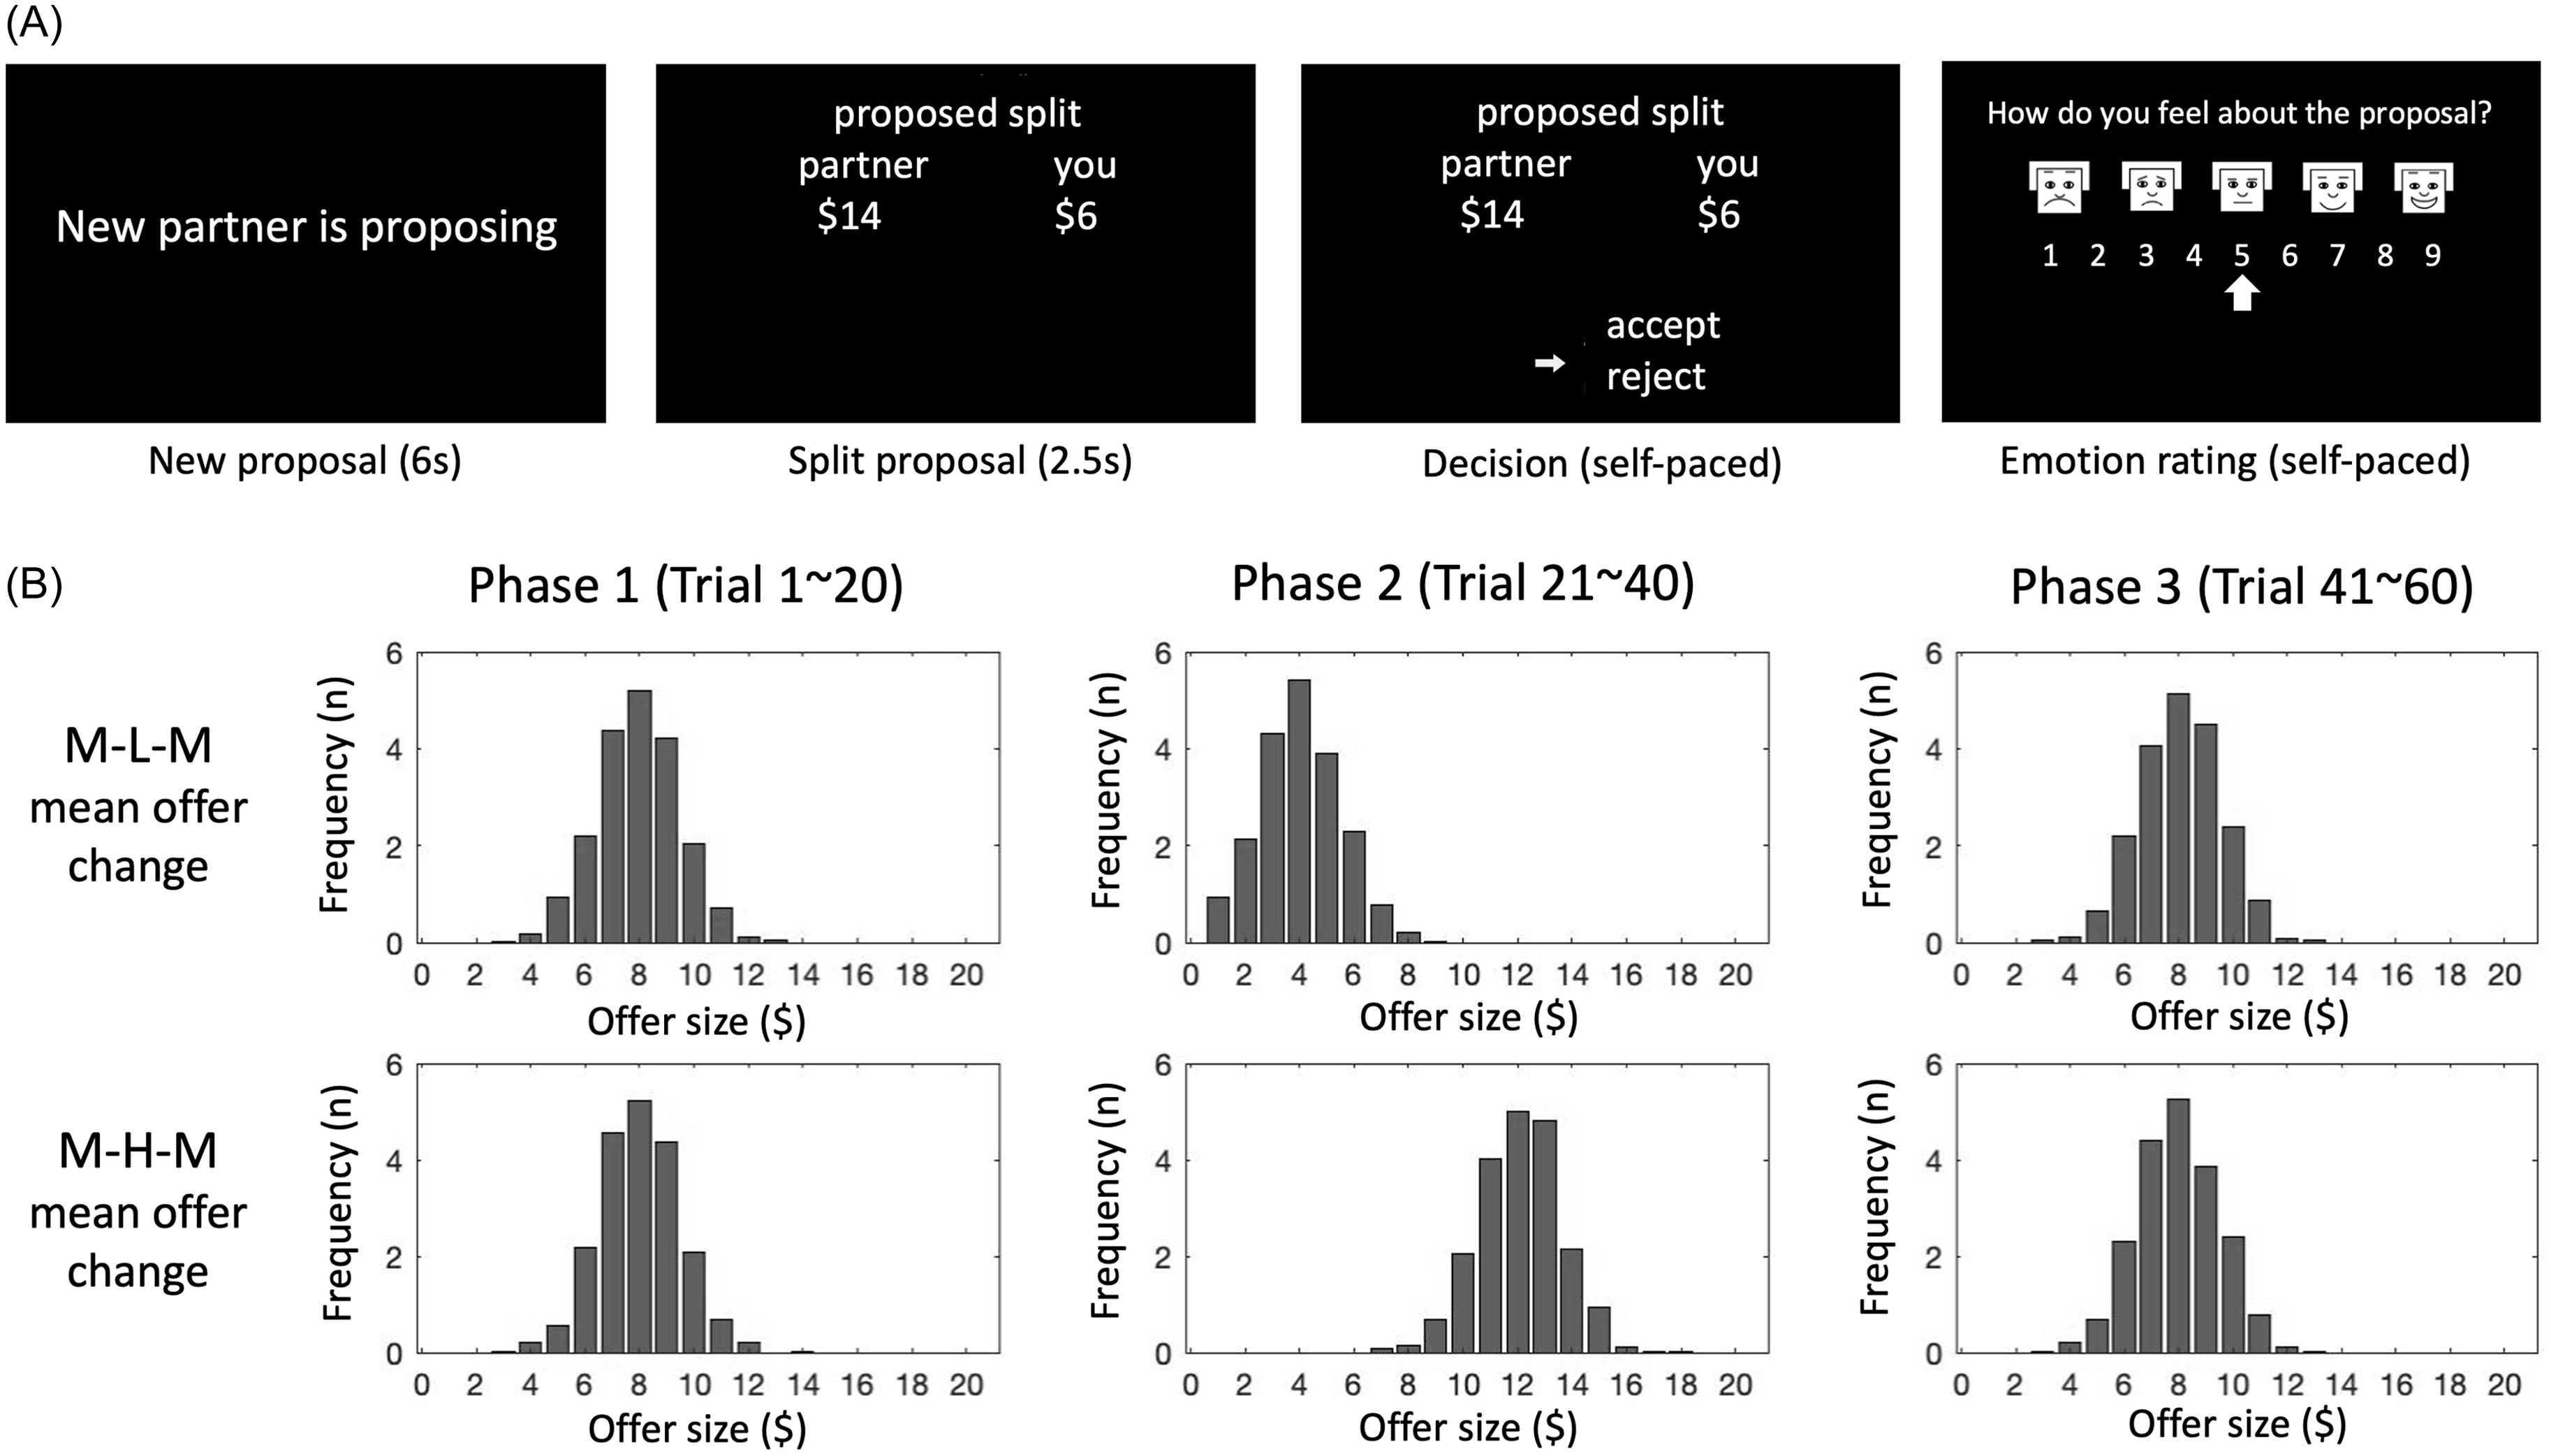
Participants diagnosed with BPD and controls played a sixty-round, three-phase ultimatum game during fMRI scanning. In each round, the respondent received a proposed split of a $20 endowment from a virtual proposer. If they accepted, they and their partner received their share of the proposed split. If they rejected, neither received any of the endowment. Participants were told that each round’s offer was made by a different proposer. Participants were also asked to rate how they felt about the proposal on an emotion scale of 1–9, pseudo-randomly every 1–3 rounds (Figure 1A). To motivate engagement, participants received GBP 10 for participation and a bonus of up to 5 GBP dependent on performance.
Ultimatum game and game versions. A. Within each trial, participants see four screens: introduction of new partner, partner’s proposed split, participant’s response, and every 1–3 trials, an emotion rating. B. The two task versions differ by direction of phase 1 to phase 2 norm violation (i.e., medium to low in MLM; medium to high in MHM); offers in each trial were sampled from a Gaussian distribution. Top row shows distributions for each phase in MLM (see shift toward lower offers in phase 2 and back toward higher offers in phase 3), and bottom row shows distributions for each phase in MHM (rightward shift towards higher offers in phase 2 and return to medium offers in phase 3).

Participants were randomly assigned to play one of two versions of the game, medium-low–medium (MLM) or medium-high-medium (MHM), named according to the offer norms in each phase. The MLM game, for example, involved twenty rounds of medium-sized offers (phase one, the initial norm), twenty rounds of low offers (phase two, a disadvantageous norm shift), and twenty rounds of medium offers (phase three). For both game types, we refer to the phase two offers as the “norm violation,” the twenty rounds in which the offer magnitudes differ (either advantageously or disadvantageously) from the norm established across the first twenty rounds of the game (phase one).
Offer sizes at each round were sampled from a Gaussian distribution for which the mean offer (the “offer norm”) changed every 20 rounds (i.e., every phase; Figure 1B). In the MLM condition, the offer norm was $8 in phase one, $4 in phase two, and $8 in phase three. In the MHM condition, the offer norm was $8 in phase one, $12 in phase two, and $8 in phase three.
Behavioural analysis
To track rejection behaviour across the task, we calculated cumulative rejection rates, the average rejection rate at each successive trial across the task (Supplementary Figure 1).
To examine whether adaptation to the offer norm occurred across the game, we averaged rejection rates over every ten consecutive rounds, the early and late halves of each phase, to make six bins (i.e., the first bin is the average for rounds 1–10, the early half of phase one). We then compared these bin-rejection rates by conducting a robust heteroscedastic repeated measurement ANOVA based on the trimmed means and post hoc tests using Hochberg’s approach to control for the family-wise error (FWE). The robust statistical analyses were conducted using the R package WRS2 (Mair & Wilcox, Reference Mair and Wilcox2020).
The structure of the task – two medium phases with either a high or low phase in between – allowed us to determine whether the norm violation led to a change in medium offer rejection rates. To this end, we conducted paired t-tests between mean phase-rejection rates using Bonferroni correction for multiple comparisons. We compared this metric between and within groups using a two-way repeated measures ANOVA. Greenhouse-Geisser correction was used for adjusting lack of sphericity.
We also investigated whether groups differed affectively in their behavioural and affective responses to offer size. To compare affective sensitivity to offer size, we computed a linear regression using offer size and diagnostic group to predict emotion rating after receiving offers (Supplementary Figure 2). We also regressed rejection on group and first offer size to examine initial offer norms (Supplementary Figure 3).
Computational modelling
We represented decision-making in the ultimatum game using the inequality aversion model and the norm-based utility function (Fehr & Schmidt, Reference Fehr and Schmidt1999; Bicchieri, Reference Bicchieri2005). The inequality aversion model assumes that social violations (disadvantageous or advantageous offers) reduce offer value depending on how much and in which direction the offer diverges from the internal norm (i.e., norm prediction error; NPE). This divergence is quantified by two sensitivity factors: alpha (i.e., “envy”) for disadvantageous inequality and beta (i.e., “guilt”) for advantageous inequality (Xiang et al., Xiang et al., Reference Xiang, Lohrenz and Montague2013). Prior studies investigating norm violation and adaptation in the ultimatum game used the ideal Bayesian observer model (BO) and the Rescorla-Wagner model (RW) to simulate social norm adaptation in the inequality aversion model (Xiang et al., Xiang et al., Reference Xiang, Lohrenz and Montague2013; Gu et al., Reference Gu, Wang, Hula, Wang, Xu, Lohrenz, Knight, Gao, Dayan and Montague2015). In the BO model, the offer norm is adjusted by updating the prior offer distribution (Xiang et al., Xiang et al., Reference Xiang, Lohrenz and Montague2013). In the RW model, the expected norm is adjusted by the immediately preceding offer and determined through the norm adaptation rate, lambda (Rescorla, Reference Rescorla1972; Gu et al., Reference Gu, Wang, Hula, Wang, Xu, Lohrenz, Knight, Gao, Dayan and Montague2015; Sutton & Barto, Reference Sutton and Barto2018). To elucidate the process of cooperative decision-making in individuals with BPD, we compared the inequality aversion model without norm adaptation (i.e., fixed norm, FN), with norm adaptation by the BO and the RW model (Supplementary Methods).
To estimate model parameters, identify individually responsible models, and perform a group-level model comparison, we employed the hierarchical Bayesian inference (HBI) (Piray et al., Reference Piray, Dezfouli, Heskes, Frank, Daw and Berry2019). First, each model was fit to individual subject data using Laplace approximations. Then, we used HBI to estimate model parameters and to compare the relative goodness-of-fit between models by generating model frequency and protected exceedance probability. Model frequency is an estimate of how much each model is expressed across the group, and protected exceedance probability (Ppx) is the probability that each model is the most likely across the group while considering the null hypothesis that any difference between model frequencies is due to chance. To assess the absolute goodness-of-fit, we performed two posterior predictive checks using simulation. First, we simulated data from the fitted parameters and binned the rejection rates for the actual and simulated data by offer sizes. We then plotted the means by subject of these rates in aggregate and by diagnosis group in Supplementary Figure 4. We subjected these data to ANOVA with factors group, bin, and type (actual/sim) with subject as a random effect. The main effects of group and type, as well as the group × type interaction were all insignificant at the p = 0.05 level. We also by generating a simulated dataset of 1000 per game conditions using the fitted parameters from the model and comparing them with the real data by trial number. The Bayesian p values were computed from the simulated data and the observed data from the whole population, controls and individuals with BPD. The values falling within the range from 0.05 to 0.95 were considered to indicate an acceptable (good) fit. Wilcoxon test was conducted to compare the estimated model parameters between groups.
Imaging data acquisition and analysis
All MRI images were obtained using 3T SIEMENS Trio Tim scanners at three different locations. A high-resolution structural T1-weighted image (0.5 × 0.5 × 1.0 mm) was acquired using a 3D magnetisation-prepared rapid acquisition gradient echo (MP-RAGE) sequence. The functional MRI images were acquired using a T2*-weighted single-shot echo-planar imaging (EPI) sequence with the following parameters: voxel size = 3.4 × 3.4 × 4.0 mm, the number of slices = 37, slice gap = 4 mm, TR = 2000 ms, TE = 25 ms, flip angle = 90°.
We used SPM12 for image data preprocessing and analyses (Ashburner et al., Reference Ashburner, Barnes, Chen, Daunizeau, Flandin, Friston, Gitelman, Glauche, Henson, Hutton, Jafarian, Kiebel, Kilner, Litvak, Mattout, Moran, Penny, Phillips, Razi, Stephan, Tak, Tyrer and Zeidman2021). All image volumes were temporally and spatially aligned by slice timing correction and motion correction. Motion artefacts were identified and adjusted by de-spiking and repairing using ArtRepair (Mazaika et al., Reference Mazaika, Whitfield-Gabrieli, Reiss and Glover2007). Corrected images were co-registered to individual structural images, spatially normalised to the Montreal Neurological Institute template, and then smoothed with an 8 mm isotropic Gaussian kernel high-pass filter.
Given that the split proposal does not serve as feedback on a prior action and is unpredictable, we hypothesised that prediction error signals would emerge during the decision-making phase as the offer’s normative value is evaluated. Therefore, we constructed individual General Linear Models (GLM) by modelling the decision onset and the NPE as its parametric modulation regressor. The design matrix was then convolved with the canonical haemodynamic response function. In prior studies of value-based decision-making, arousal (salience) and positive effects (valence) were linked to distinct brain regions (ventromedial prefrontal cortex (PFC) for valence and dorsomedial PFC and dorsolateral PFC for salience) (Bartra et al., Reference Bartra, McGuire and Kable2013; Abram & DeYoung, Reference Abram and DeYoung2017). Valence signals the desirability of a stimulus linearly from negative (punishment) to positive (reward). By contrast, salience signals the importance of the stimulus and increases with both magnitudes of reward and punishment in a U-shaped pattern (Matsumoto & Hikosaka, Reference Matsumoto and Hikosaka2009; Bromberg-Martin et al., Reference Bromberg-Martin, Matsumoto and Hikosaka2010; Litt et al., Reference Litt, Plassmann, Shiv and Rangel2011). As the split offer is devalued by the size of positive and negative NPEs in the FS model, we assumed that the absolute value of the NPE would be represented in a quadratic function in the valuation system. Thus, we used the 2nd-order polynomial function for modelling parametric modulation to segregate brain regions showing linear (to model valence) and quadratic (to model salience) relationships with the NPEs. Group-level analyses of the NPE-modulated decision GLM were conducted using a factorial design consisting of the group (i.e., controls and BPDs) and task version (i.e., MLM and MHM). The height(peak) level uncorrected p < 0.001 and the extent(cluster) size of 10 voxels were applied to threshold the image map of the factorial analysis results for the effects of overall modulation by NPE, group, task type, and the group*task interaction. Clusters with cluster-level FWE-corrected p < 0.05 were considered statistically significant.
To identify brain regional activities associated with alpha and beta parameters, correlation analyses were conducted between the alpha or beta parameters and the mean BOLD signal values in the NPE-modulated regional clusters. To calculate the mean BOLD signal values, the NPE-modulated regions were defined by the clusters identified by factorial design analysis with a height of FWE-corrected p < 0.05 with an extent of at least 10 voxels. Then, the beta images from the first-level analysis were used to calculate the average effect size for each decision phase within the voxels of these clusters. Correlation analysis results between the effect sizes of each clusters and the two parameters were considered statistically significant at Bonferroni-corrected p < 0.05 (i.e. 2 × p). The cluster BOLD signal values were obtained using MarsBaR 0.45 (Brett et al., Reference Brett, Anton, Valabregue and Poline2002).
Results
Participant characteristics
Initially, 142 individuals with BPD and 114 healthy control individuals participated in the neuroimaging study as part of the large-scale research programme employing a series of social exchange games. A total of 196 participants (106 BPD and 90 controls) completed the ultimatum game. Data from 60 participants were excluded from analysis. These include participants who were assessed as having intellectual impairment by Raven’s Progressive Matrices (9 BPD and 8 HC) and having missing/distorted image data, including excessive head motion (9 BPD and 5 HC). Additionally, 11% of participants (29 of 256) were excluded due to highly biased responding, defined as all accept or all reject, in the UG task (17 BPD and 12 HC). Prior ultimatum game studies have found similar minority rates of non-standard, monotonic behaviour (33% in Wallace et al., Reference Wallace, Cesarini, Lichtenstein and Johannesson2007, 12.5% in Andreoni et al., Reference Andreoni, Castillo and Petrie2004). Sensitivity analyses confirmed that the 17 excluded individuals with BPD, who had highly biased choices, did not significantly differ from the included BPD participants. In contrast, the 12 excluded HCs had lower PAI-BOR total scores and BSI phobia scores than the included controls. Data from 77 individuals with BPD (48 MLM and 29 MHM) and 60 HCs (35 MLM and 25 MHM) remained for statistical analyses.
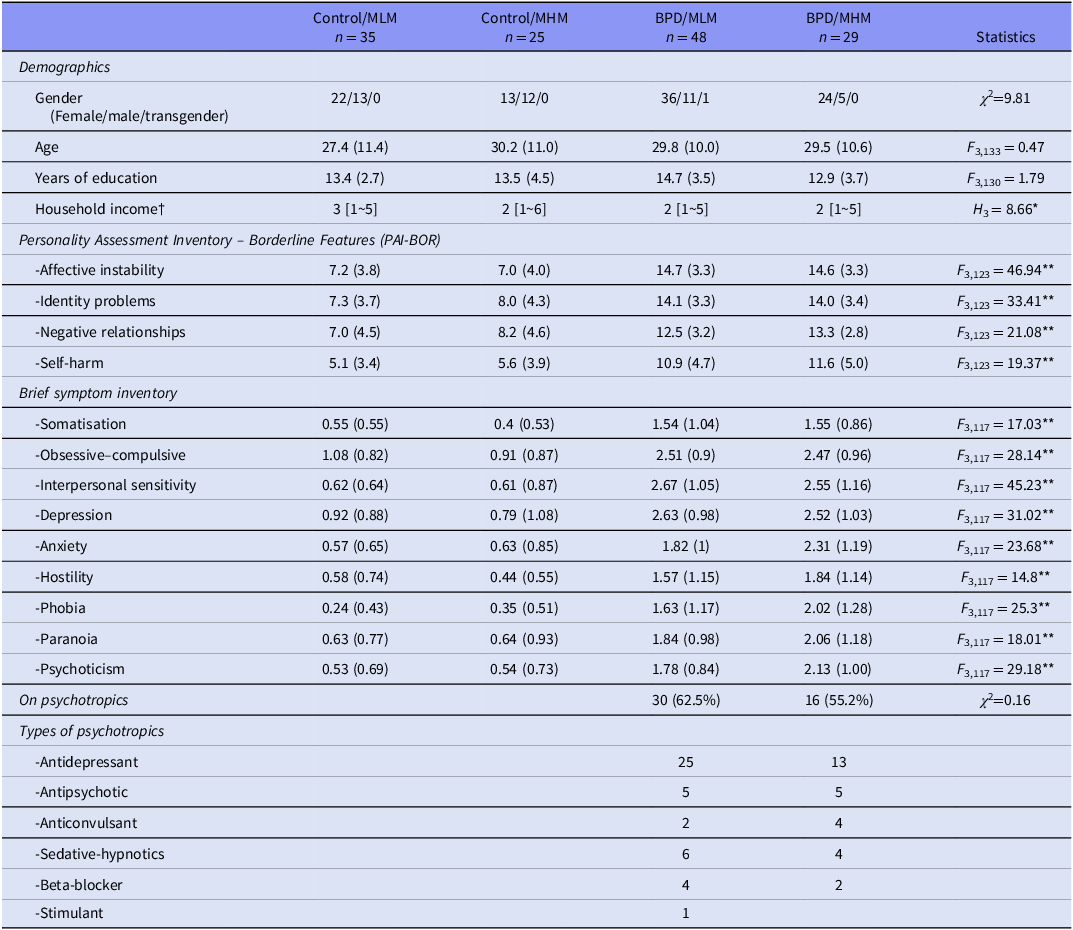
Significant differences in clinical scores on the PAI-BOR and BSI were observed in included participants between diagnostic groups (BPD and HC) but not between game types (MLM and MHM). Forty-six individuals diagnosed with BPD (59.7%) were on psychotropic medications, including antidepressants, antipsychotics, anticonvulsants, benzodiazepines, beta-blockers, and hypnotics (Table 1).
Demographic and clinical characteristics

BPD, borderline personality, disorder; MLM, medium-low-medium; MHM, medium-high-medium type ultimatum game.
Means and standard deviations or number of samples are presented. Frequency of medications by class is listed for the BPD group participants.
† The income ranges are represented by values 1∼7: 1 = Less than £10 000, 2 = £10 000–20 000, 3 = £20 000–35 000, 4 = £35 000–50 000, 5 = £50 000–75 000, 6 = £75 000–10 0000, 7 = Over £100 000; medians and ranges are presented.
* p < 0.05, Control/MCM > BPD/MHM; **p < 0.001, Control/MLM | Control/MLM < BPD/MLM | BPD/MHM.
PAIBOR scores are sums of all 24 items.
There were no significant differences in gender, age, or education between the diagnostic groups assigned to each game type (i.e., Control/MLM, Control/MHM, BPD/MLM, BPD/MHM). However, the Control/MLM group had significantly higher household income than the BPD/MHM group.
To determine whether differences in socio-economic status impacted decision-making, we conducted a Wilcoxon signed rank test between household income level and phase rejection rates and norm shift-related rejection rate changes and found no significant correlations.
Average rejection rates (across three phases of task)
We first examined the trajectories of cumulative rejection rates in each task by group. BPD group participants consistently rejected offers less in the MLM game and more in the MHM game compared to the HC group (Supplementary Figure 1; significant main effect of group in the MLM task (F(1) = 5.79, p = 0.02, mean BPD = 0.39, mean HC = 0.47)).
Next, we examined the effect of offer size on group behaviour. Though we observed the expected significant relationship between first offer size and rejection (p < 0.01), there was no significant interaction between group and offer size (p = 0.54; Supplementary Figure 3). Offer size also strongly predicted emotion ratings in that larger offer sizes were associated with more positive valence ratings (p < 0.001), but the effects of group and the group and offer size interaction were not significant (p = 0.876 and p = 0.963, respectively; Supplementary Figure 2).
Norm-shift-related rejection rate changes (between phases)
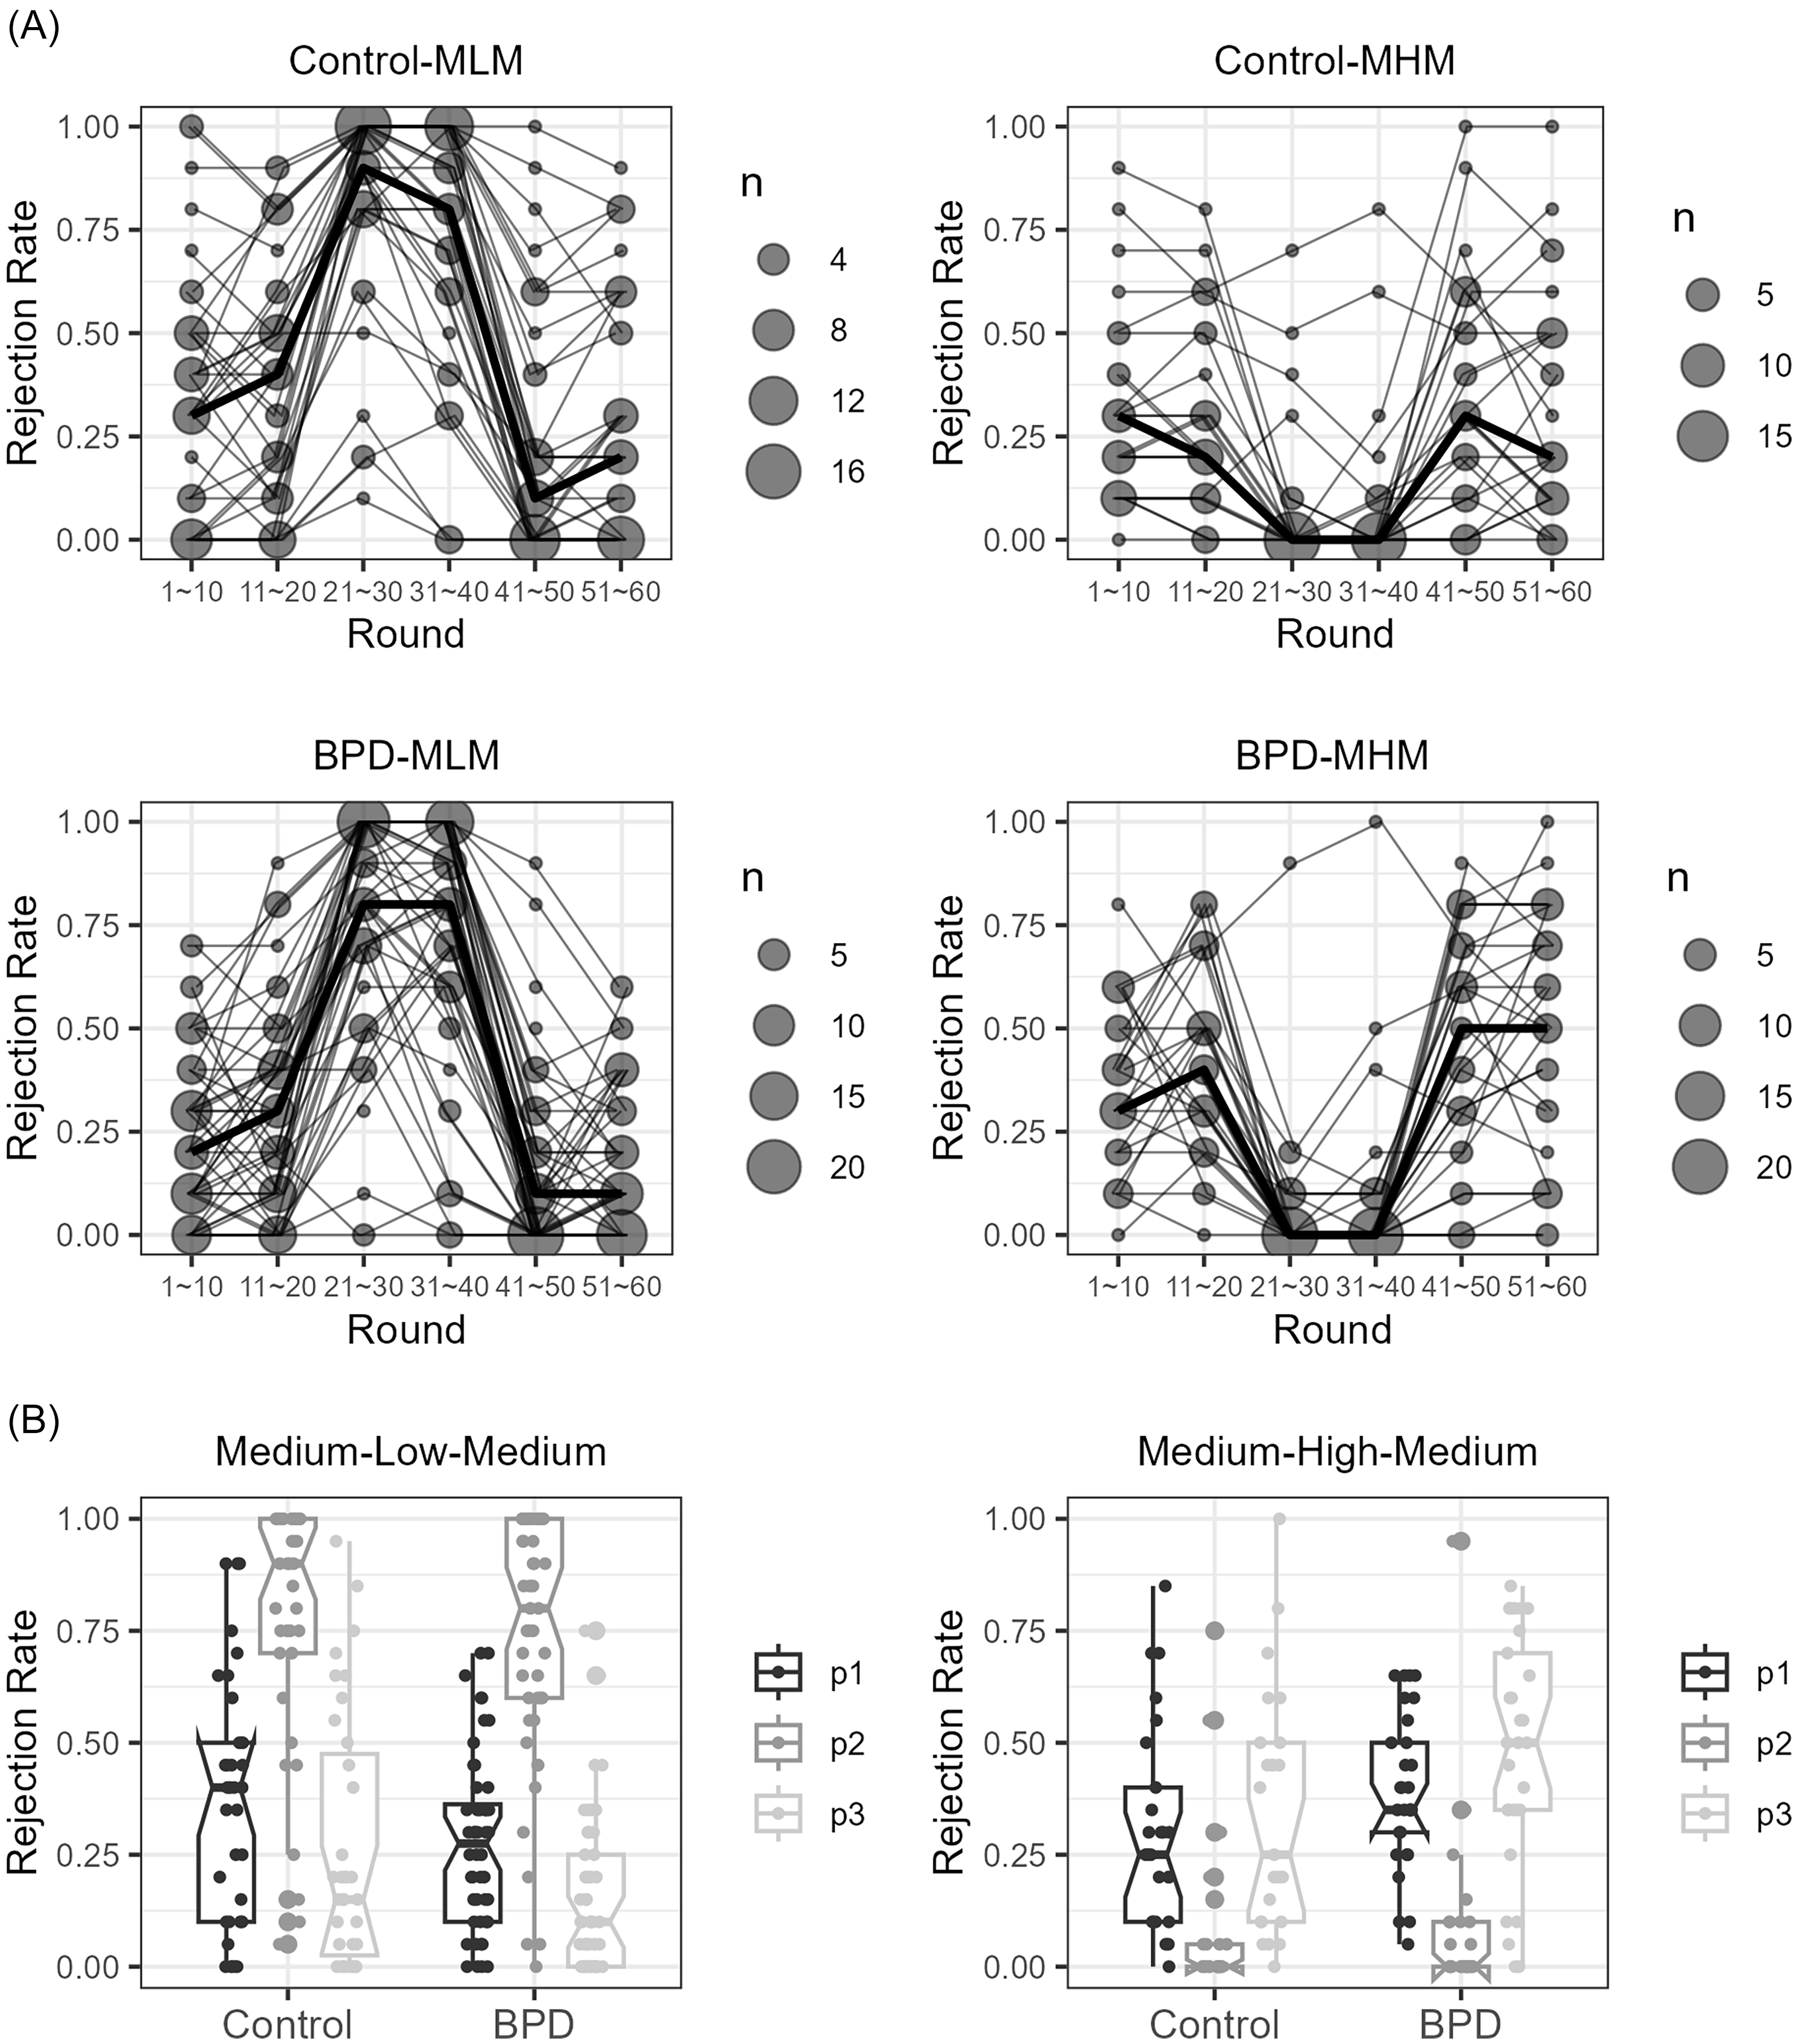
As a task manipulation check, we assessed rejection rates for each of the three phases of the MLM and MHM games (Figure 2A, B). For both groups, rejection rates shifted as expected from phase 1 to phase 2 (as offers fell in MLM and rose in MHM) and from phase 2 to phase 3 (as offers returned to initial medium level). For both the MLM and MHM games, there was a main effect of phase (for MLM, F (1.66, 134.29) = 292.34, p < 0.001; for MHM, F (1.63, 84.52) = 61.59, p < 0.001). For both tasks, post-hoc t-tests for phases 1 to 2 and phases 2 to 3 contrasts were significant at p < 0.001. There were no significant differences by group within each task type (p > 0.05).
The scatter count and line graphs showing the 10-trial bin rejection rates of the low (panels A, C) and high offer phase shifts (panels B, D) demonstrate that players responded as expected to the tasks. The median rejection rate trajectories over time in the task in the control (panels A, B) and borderline personality disorder (BPD, panels C, D) groups are represented as bold lines in panels A–D. Summarised median rejection rates for each group and task are shown as the three-phase boxplots in panel E (MLM task) and F (MHM task). Participant behaviour change from phases 1 to 3 in MLM but not MHM task demonstrates task-specific norm shift. Group significantly alters choice in MLM but not MHM (A, B), but there was no group × phase interaction.

To test whether rejection rates changed following the norm violation in phase two, we compared rejection rates of medium offer norm in phases one and three (Figure 2B). In the MLM task, the medium offer norm rejection rates were significantly reduced from phase one to phase three (t (82) = 6.48, Bonferroni-corrected p < 0.001). We did not observe a significant phase 1 to phase 3 difference in the MHM task. There were no significant interactions between groups and phases in either task. For all subjects taken together, this suggests that rejection rates of medium offers changed after the MLM disadvantageous offer norm shift.
Closer examination within MLM phase three revealed that the rejection rate in the late half of phase three was significantly higher than in the early half, reflecting a gradual recovery toward the initial medium offer rejection rates (41–50th vs. 51–60th round, ψ = −0.031, p = 0.001, p-criteria = 0.025). In fact, the rejection rates in the late half of phase three did not differ significantly from the overall rejection rates in phase one (11–20th vs. 51–60th round, ψ = −0.09, p = 0.03, p-criteria = 0.02). These results suggest that the low norm-shift-related rejection rate changes may not endure.
Computational models
We calculated a minimal detectable effect size for our actual group sizes, (HC = 60, BPD = 77). For power = 0.80, we found a minimal standardised detectable effect size in the latent space of the parameters envy and guilt of 0.59, which corresponds to a Wilcoxon effect size of 0.66, a medium/large effect size (Vargha & Delaney, Reference Vargha and Delaney2000). The Wilcoxon effect sizes for the estimated parameters are 0.51 for envy, and 0.61 for guilt, which are considered small (0.56) and small/medium (0.67).
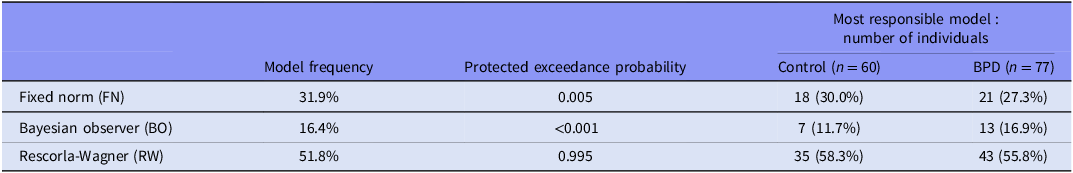
Our comparison of three norm adaptation models of participant behaviour in the task (fixed norm (FN), Bayesian observer (BO), and Rescorla Wagner (RW)) found that the RW model was the most likely model across all subjects (Ppx = 0.995) and was the most frequently responsible model within each group (Table 2).
The norm adaptation model comparison results at the whole population level (n = 137)

Across both the medium-low–medium and medium-high-medium offer conditions, the medians of the observed data for the whole population and the individual groups (controls and individuals with BPD) all fell within the interquartile ranges of the 10-trial bin and 3-phase rejection rates (Supplementary Figure 5). Furthermore, the Bayesian p values for the 10-trial bin and 3-phase rejection rates indicated a good fit (Supplementary Table 3).
We also addressed model fit across the two groups using McFadden’s R 2 (McFadden, Reference McFadden1972). We computed McFadden’s R 2 by subject and compared the two distributions of R 2s across the groups using the Kolmogorov–Smirnov test (Supplementary Figure 6). The two distributions were not significantly different at the p < 0.05 level. We also computed a t-test of the means across the groups and the difference was not significant at the p < 0.05 level (two-tailed).
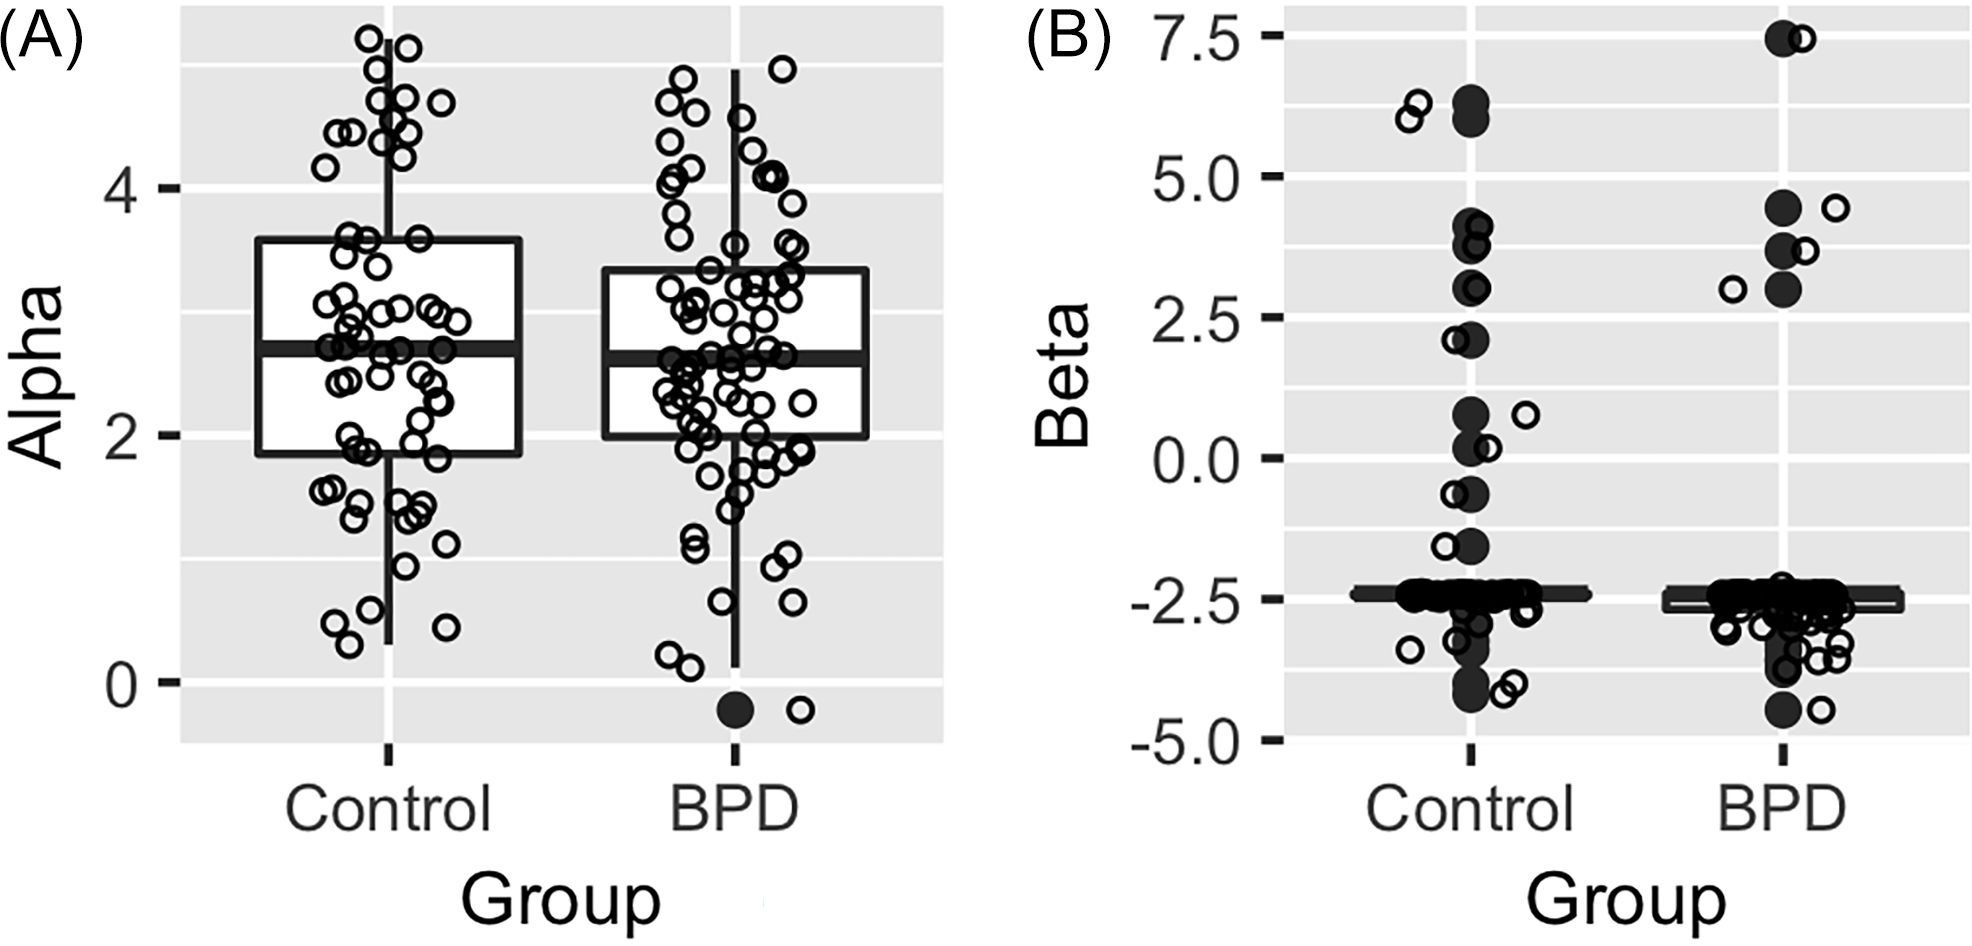
We compared the estimated parameter values from the RW model using Hierarchical Bayesian Inference (HBI; Figure 3). The comparison of parameter values from HBI group estimation for the HCs and individuals with BPD did not reveal meaningful differences between groups.
The medians and interquartile ranges of estimated parameter values from the RW model by hierarchical Bayesian inference at whole population level. A. The alpha parameter represents sensitivity to disadvantageous offers (“envy”). B. Beta (sensitivity to advantageous offer) did not show diagnostic group difference; the corrected threshold for significance is p = 0.01.

Imaging results
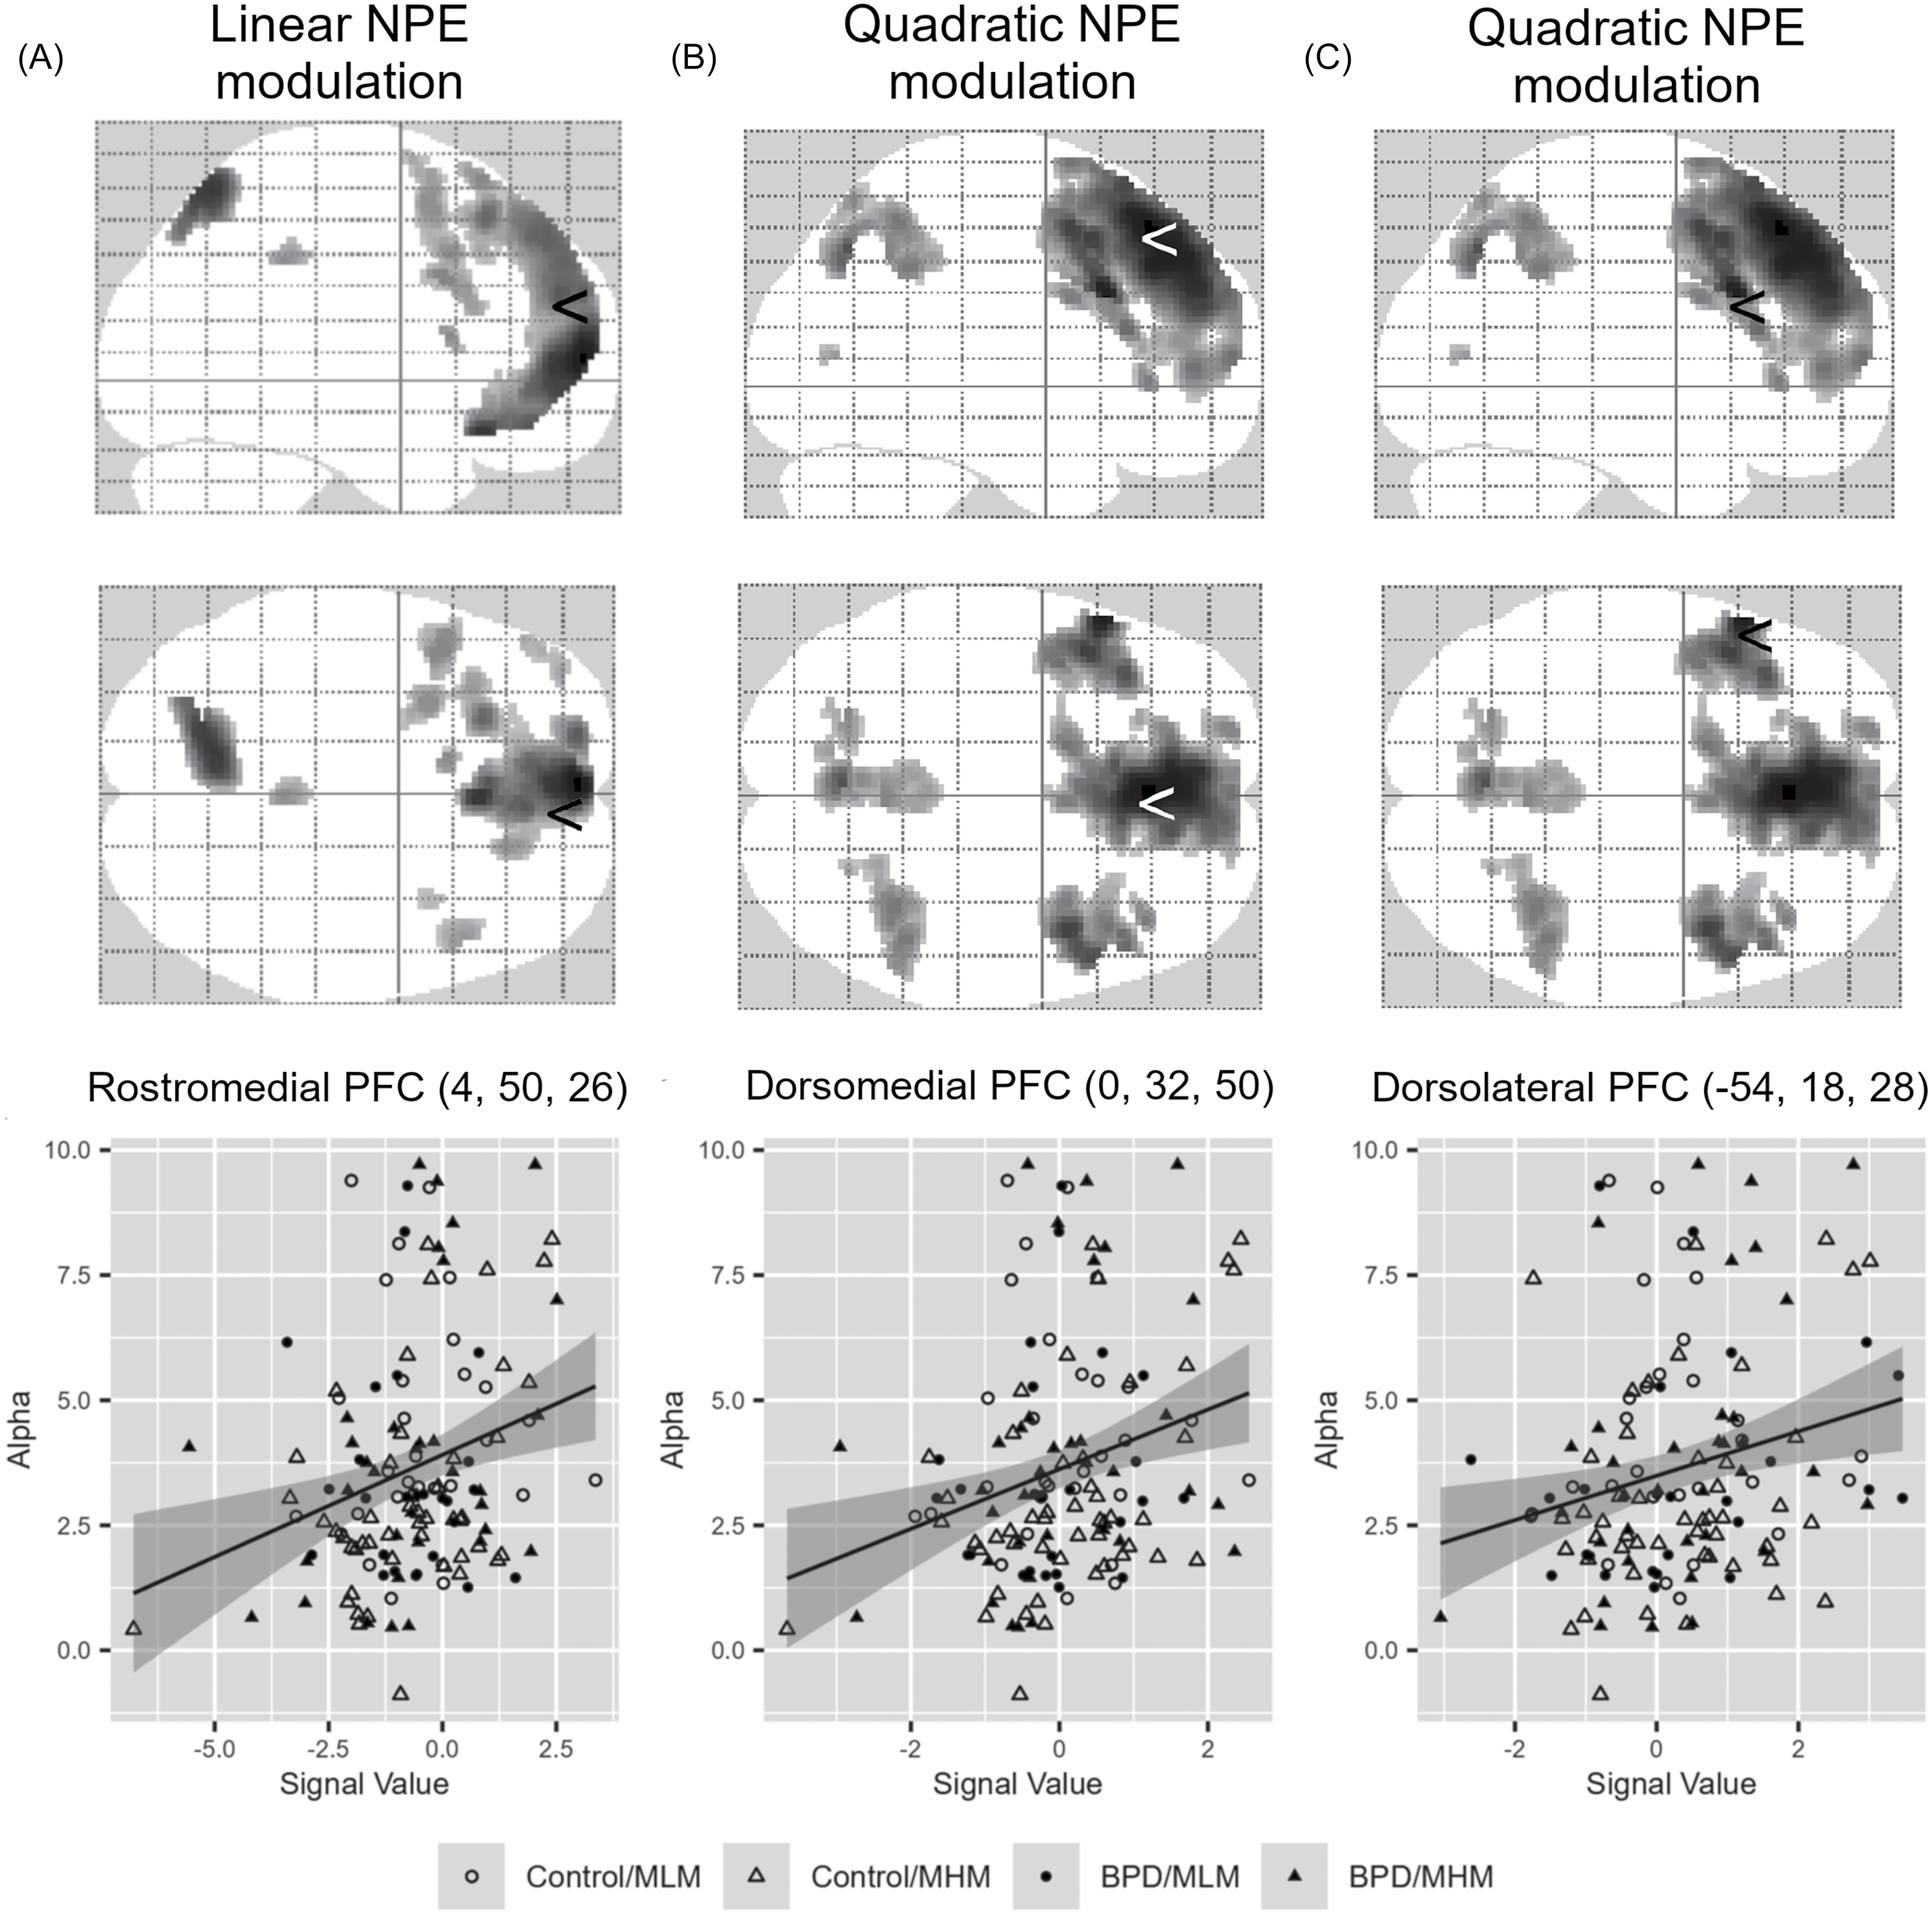
Overall, NPE-related decision-making brain activities were observed in the medial prefrontal cortex (MPFC). The rostral and ventral MPFC regions were associated with more linear (valence-related) modulations (Figure 4A, Supplementary Table 1), whereas the dorsal MPFC regions showed quadratic (salience-related) modulations of the NPE (Figure 4B, Supplementary Table 2). However, there were no significant effects of the diagnostic group (BPD vs. healthy control) or task version (MHM and MLM) on NPE-related activations. Among the two inequality sensitivity factors, only the alpha parameter (disadvantageous inequality) significantly correlated with the linearly modulated rostral MPFC region and the quadratically modulated dorsal MPFC by NPE (Figure 4).
The glass image of the brain regions modulated by norm prediction error (NPE) during choice selection and the scatter plots showing correlation between the NPE-modulated brain regional activities and the model parameters. Linearly modulated rostro-medial prefrontal cortex (PFC) activities (A), quadratically modulated dorso-medial PFC activities (B) and left dorso-lateral PFC (C) show positive association with the alpha parameter (disadvantageous inequality sensitivity) (A. R = 0.267, Bonferroni-corrected p = 0.026; B. R = 0.270, Bonferroni-corrected p = 0.022; C. R = 0.236, Bonferroni-corrected p = 0.086). In the glass brain image, the ‘<’ symbol represents the locations corresponding to the MNI coordinates (provided in parentheses).

Discussion
In this project, we examined behavioural and fMRI neuroimaging data collected during a modified ultimatum game to identify potential differences in decision-making (specifically inequality aversion and social norm adaptation) between individuals diagnosed with BPD and those without psychiatric disorders.
Both groups responded to the task as expected, showing transient norm adaptation after a period of increased or decreased mean offer size. People with BPD were less likely to reject offers across the MLM task and more likely to reject offers across the MHM task (though the second difference did not rise to statistical significance, p = 0.05). The Rescorla Wagner model, assuming a fixed prior, performed best in representing game behaviour across both groups, and neither learning models nor fMRI activation analyses revealed group differences.
Our results suggest that individuals with BPD recognise and respond to norm violations in a similar manner to healthy individuals. For both groups, medium offer rejection rates were transiently affected by norm shifts that were “unfair” to either self or others, but initial medium offer rejection rates were recovering by the end of the game.
We found that NPEs during decision-making are encoded by two distinct value functions in the prefrontal cortex: a linear valence signal in the ventromedial PFC (vmPFC) and a quadratic salience signal in the dorsomedial PFC (dmPFC) and dorsolateral PFC (dlPFC). This dissociation provides new insight into how fairness valuation is processed in social decision-making, highlighting distinct functional contributions of mPFC subregions.
The vmPFC’s role in social behaviour has been extensively examined, particularly through studies using the Ultimatum Game, as damage to this region disrupts normative social conduct. Lesion studies consistently show that patients with vmPFC damage display reduced sensitivity to unfair offers, implicating this region in evaluating social exchanges (Shamay-Tsoory et al., Reference Shamay-Tsoory, Tibi-Elhanany and Aharon-Peretz2007; Gu et al., Reference Gu, Wang, Hula, Wang, Xu, Lohrenz, Knight, Gao, Dayan and Montague2015). Our findings extend this literature by directly linking vmPFC activity to the disadvantageous inequality sensitivity factor (alpha). This result aligns with the vmPFC’s established role in representing subjective value and personal significance (Kim & Johnson, Reference Kim and Johnson2015). We therefore suggest that the linear encoding of NPEs in the vmPFC reflects an egocentric valuation of fairness. Within the vmPFC, we further identified the frontal pole as specifically engaged in translating this unfairness signal into choice behaviour.
By contrast, the quadratic encoding observed in the dmPFC and dlPFC points to a different mode of processing. The dmPFC has been implicated in resolving cognitive control demands across competing options and in modulating social influence during learning (Venkatraman et al., Reference Venkatraman, Rosati, Taren and Huettel2009; Su et al., Reference Su, Garvert, Zhang, Vogel, Cutler, Husain, Manohar, Lockwood and Kaplan2025). The quadratic salience response, which tracks unsigned deviations from social norms, may therefore reflect the higher cognitive effort required to evaluate fairness in complex social contexts. This interpretation is consistent with dual-system models of fairness-related decision-making. As proposed in prior work, an intuitive System 1 (involving the vmPFC) generates rapid responses to norm violations, whereas a reflective System 2 (involving the dmPFC and dlPFC) resolves the resulting conflict (Feng et al., Reference Feng, Luo and Krueger2015).
Extending this framework to prediction error signalling, recent work has reported a comparable U-shaped response to NPEs in midbrain SN/VTA activity (Hetu et al., Reference Hetu, Luo, D’Ardenne, Lohrenz and Montague2017). We speculate that such dopaminergic NPE signals may be relayed to the dmPFC and dlPFC, where they support the deliberative computations characteristic of System 2.
While individuals with BPD may initially exhibit a predisposition toward higher or lower rejection behaviour, this does not necessarily indicate heightened momentary sensitivity or volatility in response to norm violations (Polgár et al., Reference Polgár, Fogd, Unoka, Sirály and Csukly2014; Thielmann et al., Reference Thielmann, Hilbig and Niedtfeld2014). Indeed, cumulative rejection rates evolved along nearly identical trajectories for both diagnostic groups, suggesting that individuals with BPD identify and respond to norm violations comparably to HCs. This interpretation is further supported by affective data: emotion ratings assigned to low, medium, and high offers, as well as measures of alpha (envy) and beta (guilt), were similar across groups. Perhaps most importantly, both groups demonstrated resilience by exhibiting short-lived emotional and behavioural responses to norm violations before reverting to baseline behaviour. Such resilience in BPD is consistent with previous findings; when social variables (e.g., partner appearance or emotion) are held constant, individuals with BPD maintain substantial functional preservation (Unoka et al., Reference Unoka, Seres, Aspán, Bódi and Kéri2009; Bartz et al., Reference Bartz, Simeon, Hamilton, Kim, Crystal, Braun, Vicens and Hollander2011; Polgár et al., Reference Polgár, Fogd, Unoka, Sirály and Csukly2014).
Thus, social impairments in BPD may be context-dependent rather than pervasive across social decision-making scenarios. Difficulties in social interactions among individuals with BPD likely emerge predominantly under conditions of stress, particularly involving interpersonal discord. It is plausible that behavioural and neural differences between BPD and HCs might become more pronounced under disorder-relevant stressful contexts.
Several limitations should be considered when interpreting our findings. First, our study included approximately 25 participants per group and condition, limiting statistical power to detect small effects (see Section 3.4). Second, our findings may not generalise fully to the broader BPD population, as many participants with BPD were taking psychotropic medications that could directly or indirectly influence dopaminergic signalling during decision-making. Additionally, although we did not record specific details, many participants likely engaged in psychotherapy tailored to BPD, potentially influencing their responses toward societal norms. Lastly, consistent with many BPD studies, our sample was predominantly female, though matched by gender ratio in the control group.
Conclusion
Using a modified inequality aversion model, we demonstrated that despite differences in baseline rejection behaviour (specifically, lower rejection rates in the MLM task), individuals with BPD do not exhibit deficits in recognising and adapting to social norm violations. Both groups responded to the task structure by adjusting their rejection behaviour in accordance with the phase-two norm shift, and rejection rates recovered to initial levels by the end of phase three, indicating short-lived impacts of norm violations. This preservation of function was consistently observed across four behavioural measures: computational parameters of norm sensitivity (alpha and beta), affective task responses (emotion ratings), rejection behaviour, and neural analyses of fairness valuation.
Future studies could manipulate task design to clarify why overall differences in rejection behaviour occur while responses to norm violations remain intact. Stronger social provocations (e.g., interaction with real or imagined partners) might elicit the predicted divergence in norm-shift responsiveness (Liebke et al., Reference Liebke, Koppe, Bungert, Thome, Hauschild, Defiebre, Izurieta Hidalgo, Schmahl, Bohus and Lis2018). Additionally, future research should investigate whether the observed patterns – differential rejection rates alongside preserved norm-adaptive responses – are transdiagnostic or uniquely associated with BPD. Studies examining interventions aimed at enhancing valence-based processes to influence salience-driven decision-making could also elucidate psychotherapeutic mechanisms and inform novel treatment strategies for interpersonal difficulties involving cooperation.
Supplementary material
The supplementary material for this article can be found at https://doi.org/10.1017/neu.2025.10052.
Author contributions
(https://www.elsevier.com/authors/policies-and-guidelines/credit-author-statement):
Ilho Park was involved in conceptualisation and methodology. He took the lead on formal analysis, data curation, writing of the original draft of the manuscript, and data visualisation.
Nicole Campbell was involved in validation of analyses, and significant revisions to writing and data visualisations.
Tobias Nolte was involved in project conceptualisation and supervision for all data collection and initial data curation. He worked on revision and editing of the manuscript.
Sarah K. Fineberg was involved in planning and validation of data analyses and provided supervision for interpretation of data analysis results and significant revisions to writing and data visualisations.
Terry Lohrenz was in involved in conceptualisation, he took the lead on methodology, and provided supervision for formal analysis and data visualisation. He was involved in validation of analyses and writing at the review and editing stage.
Brooks Casas was involved in project conceptualisation and methodology, especially for planning of data collection and group design, and in project administration and funding acquisition.
Peter Fonagy was responsible for oversight of all data collection and overall supervision of clinical data collection and was involved in conceptualisation of the overall project and was involved in manuscript revisions.
Janet Feigenbaum was involved in data acquisition.
London Personality and Mood Disorder Research Consortium was responsible for data collection and overall project administration in London.
P. Read Montague was involved all aspects of conceptualisation, methodology planning and he was responsible for overall project supervision at all stages (data collection, data analysis, manuscript writing) and he acquired funding for this project.
Funding statement
Nicole Campbell was supported by the Dwight Hall Community Mental Health Fellowship and the Dr Peter R. Muehrer ’82 Fund. Professor Peter Fonagy received support from the National Institute for Health and Care Excellence Research ARC North Thames. This study was also supported by the Wellcome Trust Principal Research Fellowship, the Kane Family Foundation (to Dr Montague), the National Science Foundation, and Virginia Tech. Research reported in this publication was also supported by the National Institute of Mental Health (NIMH) of the National Institutes of Health under award number K23MH123760, which provided support for Dr Fineberg’s research-focused effort toward training in clinical research focused on computational psychiatry and BPD and award number R01MH115221 to Dr King-Casas for studying the neural basis of social dysfunction in people suffering from BPD. This project was also funded in part by the State of Connecticut, the Department of Mental Health and Addiction Services, and the Yale University Department of Psychiatry. The contents of this publication are solely the responsibility of the authors and do not necessarily represent the official view of the National Institute for Health and Care Research, the Department of Health and Social Care, NIH, Yale University, the Connecticut Department of Mental Health and Addiction Services, or the State of Connecticut.
Competing interests
Sarah Fineberg serves as an ad hoc consultant to Boehringer Ingelheim and atai Life Sciences and serves on a Scientific Advisory Board for Oryzon. The other authors have no competing interests to declare.


 Open access