

Introduction
Phosgenite, with ideal chemical formula Pb2(CO3)Cl2 (ideal composition: Pb 75.99, C 2.20, Cl 13.00, and O 8.80 wt.%), is a mineral usually formed in the oxidation zone of lead ore deposits, in particular where a source of chlorine is available (e.g. from sea water, brines and related evaporite deposits, etc.). In their manuscript on the paragenetic modes of minerals, Hazen and Morrison (Reference Hazen and Morrison2022) ascribed phosgenite to the “Stage 7: Great Oxidation Event” (47c, 47g and 47h). This mineral was discovered in 1841, and its name derived from the gas ‘phosgene’, the organic chemical compound COCl2 (carbonyl dichloride), which consists of the same chemical elements (i.e. carbon, oxygen and chlorine) of the mineral. In Nature, phosgenite usually occurs in association with cerussite (PbCO3), anglesite (PbSO4), matlockite (PbFCl), and laurionite (PbCl(OH)), in transparent to translucent, colourless prismatic crystals; white, yellowish, greenish, or pinkish crystals also occur. Crystals usually have high adamantine lustre, due to their lead content. Crystal symmetry is tetragonal (point group: 4/m 2/m 2/m), so that crystals are usually prismatic [001], commonly terminated by {001} or with large {111} faces. Due to the large size of naturally-occurring crystals (sometimes up to 30 cm in length), phosgenite has even been cut as a gemstone (especially crystals with very minor inclusions and champagne hue), more often cut into cabochons. Currently, faceted gemstones range from $20 to $270 per carat; cabochons, in particular, between $200–300 per carat. The best source for phosgenite gemstone material is Sardinia, Italy, followed by Morocco, Namibia and Australia. However, the limiting factor for the use of phosgenite in the gemstone market is due to its relatively low hardness: 2–3 Mohs.
After the first crystallographic studies of phosgenite by Onorato (Reference Onorato1934), Oftedal (Reference Oftedal1944) and Sillén and Pettersson (Reference Sillén and Pettersson1946), the seminal paper on the crystal structure of phosgenite is that of Giuseppetti and Tadini (Reference Giuseppetti and Tadini1974), based on single-crystal X-ray diffraction (XRD) data collected with a 4-circle diffractometer. The crystal structure was solved in the space group P4/mbm, with a = 8.160(4) and c = 8.883(6) Å (Z = 4), by 3-dimentional Patterson synthesis. The final structure model was provided with Pb and Cl sites (i.e. Pb, Cl1, Cl2) refined with anisotropic displacement parameters, whereas the other atomic sites (i.e. O1, O2, C) were refined as isotropic. The building unit of the crystal structure of phosgenite is represented by a Pb-polyhedron, in which Pb is coordinated by 5Cl + 4O (coordination number CN = 9), forming a monocapped square antiprism, as shown in Fig. 1. The combination of face-sharing Pb-polyhedra generates dense layers parallel to (001), which are connected by (edge-sharing) CO3-groups to form the crystalline edifice shown in Fig. 1. To the best of our knowledge, the structure refinement of Giuseppetti and Tadini (Reference Giuseppetti and Tadini1974) is the last reported in the literature. The model is internally consistent, in terms of bond distances and angles, and reflects the standard of that time. However, the unusual shape of the unique CO3-group (lying on a plan parallel to (110) and with difference in the C–O distances of ca. 0.071 Å) and the lack of anisotropic displacement parameters of the C and O sites, prompt a re-investigation of the structural model.
Two views of the structure of phosgenite, (a) down [001] and (b) [010], and (c) details about the configuration of the PbCl5O4-polyhedron and the connected CO3-groups. Structure model based on the neutron structure refinement of this study; intensity data collected at 293 K (space group P4/mbm). Thermal probability factor of the atomic sites: 70%.

More recently, Frost et al. (Reference Frost, Williams and Martens2003) performed a Raman spectroscopy study of a series of Pb-bearing minerals, including phosgenite. A list of Raman active bands was reported and assigned, showing the absence of bands ascribable to the hydroxyl-stretching modes in phosgenite spectrum. Bohatý et al. (Reference Bohatý, Becker, Rhee, Kaltenbach, Eichler, Yoneda, Shirakawa, Ueda and Kaminskii2013) discovered that phosgenite shows Stimulated Raman Scattering (SRS) activity, already observed for other carbonates (e.g. aragonite, cerussite) but never reported before for this lead oxychloride. Additional studies on the topotaxy relationships in the transformation phosgenite–cerussite and on the dissolution–crystallization reaction of phosgenite-to-cerussite, in aqueous solution, have been performed by Pina et al. (Reference Pina, Fernández-Díaz and Prieto1996, Reference Pina, Fernández-Dı́az, Prieto and Putnis2000).
It is surprising that the most important studies on phosgenite, published in the last 50 years, do not report any chemical characterization of the samples investigated: the chemical composition was assumed, even in the manuscripts of Giuseppetti and Tadini (Reference Giuseppetti and Tadini1974), Frost et al. (Reference Frost, Williams and Martens2003) and Bohatý et al. (Reference Bohatý, Becker, Rhee, Kaltenbach, Eichler, Yoneda, Shirakawa, Ueda and Kaminskii2013). The most recent manuscript (in the open literature) in which we found evidence of a full chemical characterization is that of Midgley (Reference Midgley1958), but where only a general sentence is reported about the chemical composition of the sample: “Chemical analysis by R.S. Gillett gave: PbO 81.2, Cl 12.6, CO2 8.0 %, equivalent to Pb2(CO3)Cl2”.
A further lack of data pertains to the thermal behaviour of phosgenite and its phase stability with temperature (T), which has not been investigated so far (or, at least, never reported). A CO3-bearing material is expected to decompose with increasing temperature, releasing CO2; however, the presence of Cl within structures can make decomposition processes more complex, and is worthy of investigation. The T-induced release of phosgene, for example, cannot be ruled out.
In this light, the aim of this study was the reinvestigation of the crystal chemistry of phosgenite adopting a multi-methodological approach, based on single-crystal X-ray (at 293 K) and neutron (at 293 and 20 K) diffraction, in situ high-temperature powder XRD and thermogravimetry along with a series of chemical analytical techniques. This approach allowed us to: (1) reinvestigate the crystal structure of phosgenite, on the basis of modern protocols, and its phase stability at high temperature; (2) provide a full chemical description of this mineral, with major, minor and trace elements, unveiling the presence of potential industrially-relevant elements; and (3) describe any potential substituents at the Pb- and Cl-sites. Materials with the same crystal structure of phosgenite have been successfully synthesized, for example Pb2(CO3)Br2, and the potential solid solution between Pb2(CO3)Cl2 and Pb2(CO3)Br2 was even considered in one of the first crystallographic studies of phosgenite by Oftedal (Reference Oftedal1944).
Experimental methods
A large transparent and colourless crystal of phosgenite (∼ 3.2 × 3.2 × 3.5 cm) from the well-known Monteponi Mine, Iglesias, Sardinia, Italy, was used in this study. Monteponi was a Pb-Zn mine, in which sphalerite and galena were extracted until the 1984. Since the nineteenth century, large phosgenite crystals from Monteponi have been subject of scientific investigations (e.g. Goldschmidt, Reference Goldschmidt1893; Coda, Reference Coda1899).
The crystal was optically free of inclusions; only a few micro-fractures were visible. Fragments of the crystal were used for the single-crystal X-ray and neutron diffraction experiments, in situ high-temperature powder XRD, thermogravimetric investigation (TG/DTA), and wet chemical characterization.
Chemical analysis
A total mass of ∼2.5 grams of phosgenite was used for entire chemical characterization. Weight determination was carried out by means of an analytical balance GENIUS-Sartorius ME235P.
Gravimetric method for the determination of Pb as PbMoO4
A mass of 200 mg of phosgenite was placed in a 400 ml beaker, acidified with 50 ml of nitric acid 1:25. After complete dissolution, 2 g of ammonium chloride + 4 g of ammonium acetate were added. Lead was precipitated by adding (dropwise) 80 ml of an ammonium molybdate solution (4 g/l of ammonium molybdate + 10 ml of acetic acid). The solution was then heated to boiling for 2–3 minutes, allowing the suspension to settle down. After a few minutes, a white precipitate was collected on a pre-weight 30 ml porcelain filtering crucible (porosity n. 4) (m1), washed a few times with 5 ml of hot water containing 2% of ammonium nitrate. The porcelain crucible was then heated at 700°C in a muffle furnace, until a constant weight was reached (m2). From the difference of weight (m2 – m1), it was possible to calculate the total Pb concentration in phosgenite, precipitated as PbMoO4, that was 75.8(3) wt.%. Therefore, the resulting PbO concentration was: 81.7(3) wt.%.
Gravimetric method for the determination of Cl as AgCl
A mass of 500 mg of the mineral was placed in a 400 ml beaker, acidified with 100 ml of nitric acid 1:25. After complete dissolution, 0.2 M silver nitrate solution was added, slowly and with constant stirring until slight excess. The suspension was heated nearly to boiling, and it was maintained at this temperature until the coagulation of the precipitate was completed and the supernatant liquid was clear (time: a few minutes). The beaker was then set aside in the dark. After 1 hour, a white precipitate was collected on a preweight 30 ml sintered-glass filtering crucible (porosity n. 4) (m1), washed three times with 10 ml of 5:1000 nitric acid solution, and then 3 times with 3 ml of 1:1000 nitric acid solution. The crucible and the content were then dried at 130°C, until a constant weight (m2) was obtained (time: ∼4 hours). From the difference of weight (m2 – m1), it was possible to calculate the total Cl concentration in phosgenite, precipitated as AgCl, that was: 13.1(1) wt.%.
Determination of F by ion selective electrode
A mass of 20 mg of phosgenite powder was placed in a 50 ml plastic test tube; then, 15 ml of water and 0.5 ml of nitric acid 1M were added. 2–3 ml of Total Ionic Strength Adjustment Buffer (commercial solution TISAB III) were added to the clear solution, along with 20 ml of water. The fluorine concentration was measured using a fluoride selective electrode (perfectION™ Combination Fluoride Ion Selective Electrode - Mettler Toledo), following the standard addition methods and using a certified reference solution of fluorine from 0.1 to 5 mg/l. The concentration of F in phosgenite was proved to be < 0.01 wt.% (e.s.d. not determined).
Determination of adsorbed water content by heating
A mass of 500 mg of phosgenite powder was placed in a quartz crucible with lid and heated in an oven from ambient temperature up to 105°C (heating rate: 10°C/min). The mass variation proved that the adsorbed H2O content in phosgenite was < 0.05 wt.% (e.s.d. not determined).
Determination of minor elements concentration by ICP-OES and ICP-MS
All determinations (excluding Cs) were performed by both inductively coupled plasma optical emission spectroscopy (ICP-OES, Perkin Elmer Optima 7000DV) and inductively coupled plasma mass spectroscopy (ICP-MS, Thermo Scientific iCAP TQe). Caesium concentration was measured by ICP-MS only.
Common and rare earth elements – A mass of 5–50 mg of phosgenite powder was placed in a 50 ml plastic test tube, and 2 ml of concentrated nitric acid solution were added. The resulting solutions were diluted with water and then filtered with 0.45 μm PTFE filters. A calibration protocol was applied with a blank solution and a series of ad hoc solutions (prepared using certified reference solutions and multi-elemental standard mix for ICP), with concentration from 0.0001 to 0.01 mg/l for each element in ICP-MS and from 0.01 to 1 mg/l in ICP-OES. The concentrations of the following elements were measured: Li, Na, K, Rb, Be, Mg, Sr, Ba, Ti, Zr, V, Cr, Mo, Mn, Fe, Co, Ni, Zn, Cd, Ag, Cu, Al, Tl, Si, P, As, Sb, Bi, B, Cs, Sn, Se, Nb, W, Se, Hf, Hg, Ga, Ge, In, Ta, Sc, Y, La, Ce, Pr, Nd, Sm, Eu, Gd, Tb, Dy, Ho, Er, Tm, Yb, Lu, U and Th.
Precious metals – A mass of 5–50 mg of phosgenite powder was placed in a 50 ml plastic test tube, and 5 ml of concentrated hydrochloric acid were added. The solutions were then diluted with water and filtered with 0.45 μm PTFE filters. Also in this case, a calibration protocol was applied with a blank solution and a series of ad hoc solutions (prepared using certified reference solutions and multi-elemental standard mix for ICP), with concentration from 0.0001 to 0.01 mg/l in ICP-MS and from 0.01 to 1 mg/l in ICP-OES for each of the following elements: Ru, Rh, Pd, Pt, Au, Os, Ir.
Concentrations of minor elements in phosgenite, as obtained by ICP-OES and ICP-MS, are given in Table 1.
Concentration of minor elements in phosgenite, as obtained by ICP-OES and ICP-MS

Notes: The measured concentrations of Li, Be, Mg, Rb, Cs, Cd, Ag, Cu, Sr, Ba, Zr, V, Cr, Mo, Mn, Fe, Co, Ni, Zn, Al, P, As, Sb, Bi, B, Sn, Se, Nb, W, Se, Hf, Hg, Ga, Ge, In, Ta, Tl, Sc, Y, La, Ce, Pr, Nd, Sm, Eu, Gd, Tb, Dy, Ho, Er, Tm, Yb, Lu, U, Th, Ru, Rh, Pd, Pt, Au, Os and Ir, expressed as oxide, are all < 0.01 %m/m.
Determination of C, N and H by thermal decomposition and detection by infrared absorption (C,H) and thermal conductivity (N)
Samples of 200–300 mg of phosgenite were decomposed at 950°C in the elementary analyser LECO Truspec CHN, in excess of oxygen for 90 seconds. The products of decomposition were passed through a second furnace (Afterburner) at 850°C, for a further oxidation and particulate removal. The gas, after collection and homogenization in a container of 4.5 litres at 50°C, was sent to the infrared absorption detectors for the measurement of CO2 and H2O contents; C was measured in the form of CO2 and H in the form of H2O. A fraction of the gas was instead transferred in a stream of helium and passed through a (warm) copper catalyst and filters, in order to convert NOX to N2 and to remove oxygen, carbon dioxide and water. A thermal conductivity detector was then used to measure the nitrogen content. As standards for the calibration protocols, EDTA and calcium carbonate were used. The measured concentrations were: C 2.22(3) (as CO2 8.15) %m/m, N < 0.02 %m/m (e.s.d. not determined) and H < 0.02 %m/m (e.s.d. not determined).
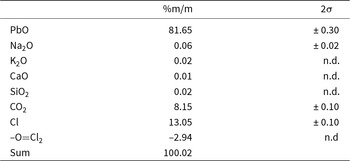
The concentration of the major and minor elements in phosgenite, as obtained by the multi-methodological approach of this study, and the resulting chemical formula are given in Table 2.
Concentration of the (significant) elements in phosgenite, as obtained by the multi-methodological approach of this study, and the resulting chemical formula

Notes: Empirical formula: (Na0.010K0.002Ca0.001)Σ0.013Si0.002Pb1.983C1.004O3.004Cl1.996. Ideal formula: Pb2(CO3)Cl2. n.d. – not detected
Thermo-gravimetric analysis and in situ powder XRD at high temperature
Thermogravimetric analysis (TG-DTG) of a sample of phosgenite was performed between 313–1180 K, under a N2 flow (100 mL min–1) and at a heating rate of 5 K min–1, with an EXSTAR Thermo Gravimetric Analyzer Seiko 6200. Data are shown in supplementary Fig. S1.
In situ XRD diffraction data were collected from 298 to 698 K (increasing T every 25 K), with an Anton Paar HTK 1200N hot chamber (Anton Paar, Graz, Austria) mounted on an X’Pert PRO diffractometer, with CuKα radiation and a Pixel 1D silicon-strip detector. Data were collected in the 2θ range: 10–90°, with step-size 0.026° and counting time per step of 47.9 s. A series of representative X-ray diffraction patterns is shown in supplementary Fig. S2.
Single-crystal neutron and X-ray diffraction experiments, and structure refinements
Neutron diffraction
Neutron diffraction data on a phosgenite crystal (size 3.5 × 2.0 × 1.5 mm) were collected at 293(1) and 20(1) K on the SXD single-crystal diffractometer at the ISIS Neutron and Muon Source (UK) (Keen et al., Reference Keen, Gutmann and Wilson2006), using the Laue method in Time of Flight. The instrument is equipped with an array of eleven 2D position-sensitive detectors statically placed around the sample position providing a large coverage of reciprocal space, and uses polychromatic radiation in the range 0.3–6 Å. For data collection at both temperatures, five discrete orientations of the sample around the vertical axis of the instrument were used, with a counting time of ∼ 2 h each. Data were indexed initially with the unit cell available from the X-ray measurement, and integrated intensities were extracted for both datasets using the 3D-profile fitting method as implemented in the SXD2001 software (Gutmann, Reference Gutmann2017), corrected for the Lorentz effect. Absorption correction of the intensity values was applied with an in-house software package, which reconstructs the 3D shape of the crystal (via image-processing of a 360° panoramic) and models the path-length of neutrons through the crystal for characteristic diffraction shape nodes (de Meulenaer and Tompa, Reference de Meulenaer and Tompa1965). The transmission factor was calculated via analytical solution of the integral of diffraction centres across the whole crystal volume, considering the diffraction angles and neutron wavelengths (Leonardi and Capelli, Reference Leonardi and Capelli2021). Final unit-cell parameters were refined against the fitted positions of the Bragg diffraction peaks, after the 3D profile integration.
The structural refinement of phosgenite was performed first on the basis of the intensity data collected at 293(1) K, and starting from the X-ray model reported by Giuseppetti and Tadini (Reference Giuseppetti and Tadini1974); reflection conditions were consistent with the previously reported P4/mbm space group. A total of 8613 reflections were collected, with d min ≈ 0.34 Å (–20 ≤ h ≤ +19, –20 ≤ k ≤ +21 and –12 ≤ l ≤ +21), all with I o>2σ(I o). The refinement was conducted using the SHELXL-2018/3 software (Sheldrick, Reference Sheldrick2015), by full matrix least squares on F 2. The secondary isotropic extinction effect was corrected according to the Larson formalism (Larson, Reference Larson1967), as implemented in SHELXL-2018/3. The neutron scattering lengths of Pb, C, Cl and O were taken from Sears (Reference Sears, Sköld and Price1986). The first cycles of refinement were conducted with isotropic displacement parameters for all the atomic sites. Convergence was rapidly achieved, without significant residuals in the Fourier-difference maps of the nuclear density function, so that no additional site, for example populated by H (in response to a potential OH vs. Cl substitution), was observed. In the last cycles of refinement, all atomic sites were modelled with anisotropic displacement parameters, with a significant improvement of the figures of merit. At the end of the refinement, the variance–covariance matrix showed no significant correlations among the refined variables, all the principal mean-square atomic displacement parameters were positive and without significant residuals in the difference-Fourier maps of the nuclear density function. The final R 1(F) was 0.0713, for 8613 unique reflections/33 refined parameters.
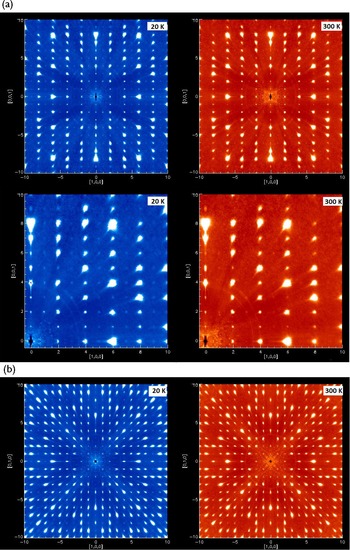
A further refinement was conducted with the intensity data collected at 20(1) K, adopting the same strategy described for the refinement at 293(1) K. However, the structure refinement performed in the space group P4/mbm revealed more than 90 violating reflections with I o>3σ(I o). A careful inspection of the reciprocal space sections showed families of new Bragg reflections at 20(1) K, which were absent at 293(1) K (Fig. 2). Their hkl values suggested that the space group of phosgenite at 20(1) K is probably P  $\bar 4$, a subgroup of P4/mbm. Two tentative refinements were then performed with the data collected at 20(1) K: one in the space group P4/mbm and the second in P $\bar 4$, but with the structure model refined in the space group P $\bar 4$ considered as most probable, and therefore used for the comparative analysis with the model at room temperature.
Reconstruction of the reciprocal space based on the neutron data collections at low and room temperature: (a) section h0l (with magnification of a restricted area below) and (b) section hk0.

Details pertaining to the structural refinements at 293(1) and 20(1) K are given in Supplementary Table S1. Atomic coordinates and displacement parameters are listed in Tables S2 and S3; selected interatomic distances and angles are given in Table 3. A crystallographic information file (cif) is available as supplementary material.
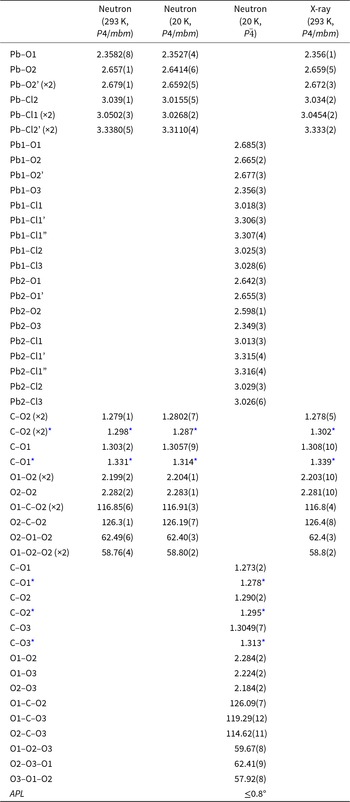
Relevant bond distances (Å) and angles (°) based on the neutron (at 20 K and 293 K) and X-ray structure refinement (at 293 K) of phosgenite

* Bond distance corrected for ‘non-correlated motion’ effect, following Busing and Levy (Reference Busing and Levy1964). APL is the aplanarity of the CO3-group, here calculated as the average angle (°) described by the plan on which the 3-oxygen sites lie and each of the three independent C–On vectors.
X-ray diffraction
A prismatic crystal (ca. 0.140 × 0.130 × 0.090 mm) of phosgenite was selected for the X-ray intensity data collection, conducted at room temperature (293(1) K). Diffraction data were collected with a Rigaku XtaLABSynergy-i X-ray diffractometer, equipped with a PhotonJet-i MoKα microfocus source and a HyPix-6000HE HPC detector, at the University of Milan – Earth Sciences Department. An ad hoc collection routine was optimised by the CrysAlisPro suite (Rigaku Oxford Diffraction, 2019), aimed to maximize the reciprocal space coverage and the quality of the intensity data, with an ω-scan strategy, 0.5° step size and 1 s/frame as exposure time. A total number of 7361 reflections was collected, with d min ≈ 0.63 Å (θmax of 34.3°, and –12 ≤ h ≤ +12, –12 ≤ k ≤ +12 and –13 ≤ l ≤ +13). The data reduction provided a metrically tetragonal unit-cell, with a = b = 8.1544(1) and c = 8.8740(2) Å. 683 reflections were found to be unique for symmetry (R int = 0.0511, Laue class 4mm) and 637 with I o>2σ(I o). The reflection conditions were consistent with the space group P4/mbm, as previously reported in the literature. Integrated intensity data were corrected for the Lorentz-polarization effects and for absorption, using the ABSPACK routine (with a semi-empirical protocol), as implemented in the CrysAlisPro package (Rigaku Oxford Diffraction, 2019). Intensity data were processed with the E-STATISTICS program (implemented in the WinGX package, Farrugia, Reference Farrugia1999), and the Wilson plot and the statistics of distributions of the normalized structure factors suggested that the structure of phosgenite is centrosymmetric at >82% likelihood.
The structural refinement of phosgenite, based on the X-ray data, was performed starting from the model reported by Giuseppetti and Tadini (Reference Giuseppetti and Tadini1974), using the SHELXL-2018/3 software on F 2 (Sheldrick, Reference Sheldrick2015). The secondary isotropic extinction effect was corrected according to the Larson formalism (Larson, Reference Larson1967). The X-ray neutral scattering lengths of Pb, C, Cl and O were taken from the International Tables of X-ray Crystallography Vol. C – Tables 4.2.6.8 and 6.1.1.4. The first cycles of refinement were conducted with isotropic displacement parameters for all the atomic sites, and then with anisotropic displacement parameters until convergence was achieved. At the end of the refinement, all the principal mean-square atomic displacement parameters were positive, and no significant correlations were observed in the variance–covariance matrix. The final residuals were +1.3/–1.5 e -/Å3, near the Pb site. The final R 1(F) was 0.0313, for 637 unique reflections/29 refined parameters. Additional details pertaining to the structural refinements for these experiments are also given in Table S1. Atomic site coordinates and displacement parameters are listed in Tables S2 and S3; selected interatomic distances and angles are given in Table 3. A crystallographic information file (cif) is available as supplementary material.
Results
The chemical analyses of the phosgenite sample from Monteponi Mine, Iglesias, Sardinia, Italy, based on a multi-methodological approach, confirm the general chemical formula of this mineral as previously reported in the literature, and reveal no potential substituents, at a significant level, for Pb, Cl and the CO3-group. It is probable that the minor Na+K+Ca+Si content measured here, which accounts for ca. 0.015 atoms per formula unit (or less than 0.11 wt.% expressed as oxides, Tables 1 and 2), represents minor contamination of the analysed material due to the presence of other minerals (probably clay minerals) filling the observed micro-fractures in the large crystal sample of phosgenite. No industrially-relevant elements, potentially replacing Pb or C, are contained in phosgenite (Table 1). The high chemical selectivity of this mineral, which nucleates and grows in an environment that is rich in other potential substituents, will be discussed in the next section.
The general structure model of phosgenite obtained in this study, on the basis of X-ray and neutron diffraction data at room temperature, is consistent with that previously reported by Giuseppetti and Tadini (Reference Giuseppetti and Tadini1974). The building unit of the structure is given by a complex Pb-polyhedron, formed by a monocapped square antiprism, in which Pb is coordinated by 5Cl + 4O (coordination number: 9, Fig. 1). The shortest distances pertain to the Pb–O bonds (i.e. between ∼2.36 and ∼2.68 Å, Table 3 – neutron data), whereas the longest ones pertain to the Pb–Cl bonds (i.e. between ∼3.04 and ∼3.34 Å, Table 3 – neutron data). Dense layers parallel to (001) are generated by the combination of face-sharing Pb-polyhedra, mutually connected by (edge-sharing) CO3-groups, giving the crystalline edifice shown in Fig. 1. The CO3-group in the structure of phosgenite, stable at room conditions, shows no aplanarity, but does exhibit notably different C–O distances: the two symmetry-related C–O2 distances are ∼1.298 Å, whereas the C–O1 distance (the third one) is ∼1.331 Å (neutron data, distances corrected for ‘non-correlated motion’ effect, Table 3). In addition, the O–C–O angles deviated significantly from the ideal value, being O1–C–O2 (×2) ≈ 116.8° and O2–C–O2 ≈ 126.3°.
The low-temperature neutron diffraction data, collected at 20 K, show evidence of a phase transition of phosgenite to a lower symmetry. The metrical parameters of the unit-cell prove that the crystal system is preserved, but the reflection conditions of the intensity data are consistent with the P  $\bar 4$ space group. The lack of diffraction data collected between 293 and 20 K, in the form of a low-T ramp, does not allow us to determine the temperature at which the P $\bar 4$ to P4/mbm phase transition occurs, or the character of the phase transition. However, the preservation of the metrical and the group–subgroup relationships between the two polymorphs indicates that the building units of the structure underwent only slight deformation during the transition:
Two independent Pb sites occur in the low-T structure of phosgenite, with two relative Pb-polyhedra with slightly different geometry (Tables S2 and 3). The general configuration of the low-T Pb-polyhedra recalls that of the room-T structure, in terms of coordination number, shortest Pb–O distances and longest Pb–Cl bond lengths.
One independent CO3-group occurs in the low-T polymorph of phosgenite, but with three unique O sites (i.e. O1, O2 and O3, Tables S2 and 3). In this case, the group’s aplanarity is modest, but not null (≤ 0.8°, Table 3). The three C–O distances differ significantly (i.e. ∼1.278, 1.295 and 1.313 Å, Table 3) and the O–C–O angles are markedly different (i.e. ∼114.6, 119.3 and 126.1°, Table 3), but not far away from the values observed at room-T: the Δ(C–O)max at room-T is ∼0.033 Å and at 20 K is ∼0.035 Å, the Δ(O–C–O)max is ∼9.4° at room-T and ∼11.5° at 20 K (Table 3).
The high-T behaviour of phosgenite, here described by in situ powder XRD data, proves that this mineral is stable at least up to 523 K (Fig. S2). At this temperature, we observed the first evidence of transformation (with the coexistence of phosgenite + Pb2O2Cl, and probably an amorphous phase). The XRD pattern at 548 K unveils a more complex scenario, with coexisting: phosgenite (dominant) + Pb2O2Cl (minor) + mendipite [Pb3O2Cl2] (minor) + Pb5O2Cl6 (subordinate) (+ amorphous phase).
This phase composition is preserved up to 648 K, where phosgenite is not observed anymore and the stable compounds are: Pb2O2Cl (subordinate) + mendipite [Pb3O2Cl2] (dominant) + Pb5O2Cl6 (subordinate) + kutnohorite-type [Ca(Mn,Mg,Fe2+)(CO3)2] (likely, very minor) (+ amorphous phase).
The same assemblage is observed up to 698 and back to 298 K after T-decrease, showing an irreversible transformation of the pristine material. Therefore, the irreversible T-induced degradation of phosgenite is substantially governed by a decarbonation process, and the reaction products are a series of crystalline and amorphous phases. The experimental findings of the in situ powder XRD are consistent with the thermal analysis pattern, which shows that the first evidence of phosgenite destabilization takes place at ca. 520 K, but the major transformation occurs between 650–690 K, above which phosgenite is not stable anymore (Figs S1 and S2).
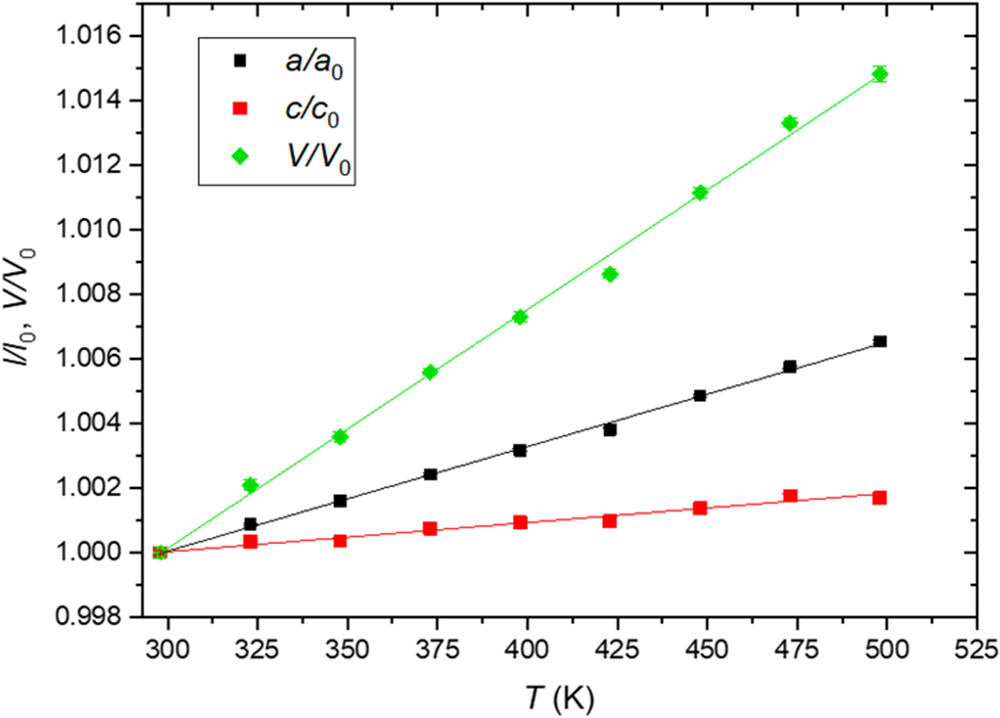
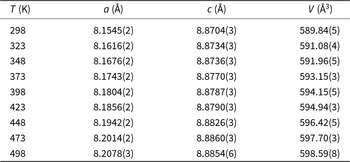
The evolution of the unit-cell parameters of phosgenite with T are listed in Table 4, and shown in Fig. 3. There is a monotonic expansion of the unit-cell volume with increasing T, with a linear pattern (R 2 = 0.995). The volume thermal expansion coefficient α, defined as α = 1/V·(∂V/∂T)P0 and obtained by the linear fit of the equation V T = V T0 (1 + αΔT) to the experimental data, is 7.4(2)·10–5 K–1 (T-range: 298–498 K). In the same T-range, the linear thermal expansion coefficients along the main crystallographic directions are: α(a) = 1/la·(∂la/∂T)P0 = 3.24(5)·10–5 K–1 (R 2 0.998) and α(c) = 1/lc·(∂lc/∂T)P0 = 9.0(6)·10–6 K–1 (R 2 0.962), with the anisotropic scheme: α(a) : α(c) = 3.6:1.
Evolution of the unit-cell parameters of phosgenite with T, as derived by the Rietveld full-profile fit to the in situ powder XRD patterns. Estimated standard deviations are smaller than the symbols; linear fits are shown.

Unit-cell parameters of phosgenite with T, as derived by the Rietveld full-profile fit to the in situ powder XRD patterns

Discussion
The experimental findings of this study prove that the phosgenite structure is chemically highly selective, with non-fundamental elements consisting of less than 0.11 wt.% (sum of Na2O+K2O+CaO+SiO2 wt.%, Tables 1 and 2). In addition, it is very likely that Na, K, Ca and Si are contaminants, and not substituting elements of those nominally present in the phosgenite structure, probably due to minerals filling the micro-fractures of the large crystal fragment of phosgenite used for the wet chemical analysis. The unusual purity of phosgenite cannot be ascribed to the lack of potential substituting elements in the geological environment in which the mineral formed, but is more likely due to a high selectivity dictated by its crystal chemistry. Phosgenite occurs, in fact, in the oxidation zone of lead ore deposits, where a source of chlorine is available (e.g. from sea water or brines), usually found in association with cerussite (PbCO3), anglesite (PbSO4), matlockite (PbFCl), or laurionite (PbCl(OH)), but even with galena (PbS), diaboleite (Pb2CuCl2(OH)4), cumengeite (Pb21Cu20Cl42(OH)40·6H2O), nealite (Pb4Fe2+(As3+O3)2Cl4·2H2O) or boleite ((K,Ca,Na,Rb,Cs)Pb26Ag9Cu24Cl62(OH)48). As such, elements which can substitute for Cl–, for example by F– or OH–, are readily available. However, our chemical and crystallographic findings do not show evidence of Cl substitution. Raman spectra reported by Frost et al. (Reference Frost, Williams and Martens2003) also rule out the Cl– vs. OH– substitution in phosgenite. It is more difficult to infer which other ions, among those naturally available, can replace the CO32– group: at least in part, CO32– would be replaced by SO32– or SO42– groups, as SOx-ions are probably available. One further question remains open and refers to which other elements, among those available, can replace Pb in the observed coordination configuration of phosgenite, and with minimal structural re-arrangement. The crystalline edifice of phosgenite, with its atomic bonding scheme, is probably key in explaining the chemical purity of this mineral. We have tried to reconstruct a structure model of an OH-bearing phosgenite, but the Cl– vs. OH– substitution would require an energetically unfavourable H-bonding scheme. Probably, it is not accidental that Oftedal (Reference Oftedal1944) synthesized the compound Pb2(CO3)Br2, isostructural with phosgenite, inferring potential solid solution between Pb2(CO3)Cl2 and Pb2(CO3)Br2, but not with Pb2(CO3)F2 or Pb2(CO3)(OH)2. SO32– or SO42– groups, potentially replacing the CO32– group, with their sp 3 hybridization and bond lengths would imply a chemical strain with a significant distortion of the structure at the local scale, and therefore energetically unlikely. Ca, measured as one of the elements not included in the nominal composition of phosgenite (i.e. 0.01 wt.%, Tables 1 and 2), would be a potential candidate to replace Pb, though the geometry of the Pb-coordination configuration in the phosgenite structure is not ideal for this alkaline earth element. In a recent article on boleite, which forms in the same environment and can coexist with phosgenite, we demonstrated that Pb, Ag, Cu, Cl and OH do not show any significant substitution, and Cl and OH are located at independent sites and not affected by any mutual disorder (Gatta et al., Reference Gatta, Guastella, Malizia, Battiston, Merlini, Bromiley and Fabelo2025). It appears, therefore, that lead oxychlorides tend to hinder replacement of dominant structural elements.
The volume thermal expansion coefficient of phosgenite in its P4/mbm form, here derived (i.e. α = 7.4(2)·10–5 K–1), is of the same order of magnitude of those of other lead oxides (or oxychlorides); for example, the coefficient of massicot (PbO) is α ≈ 6.9·10–5 K–1 (between 25–600°C; Sorrell, Reference Sorrell1970). The anisotropic scheme of phosgenite thermal expansion is pronounced, being α(a) : α(c) = 3.6:1. In other words, the structure reacts with a lower expansion along [001] if compared to [100] (or [010]). The bonding configuration in the crystalline edifice of phosgenite suggests that the CO3-group can play an important role on the anisotropic expansion of this mineral. The plane on which the triangular CO3-group lies (i.e. //(110)) is parallel to [001], and the carbonate-group acts as a bridging unit between the dense layers of face-sharing Pb-polyhedra parallel to (001) (Fig. 1). The Pb–Cl and Pb–O bonds are more expandable than the C–O bonds, so that the CO3-group is the limiting factor of the overall expansion. Therefore, the orientation of the CO3-group, with the O2–O2 vector parallel to [001] (Fig. 1), probably governs the less pronounced expansion of the structure along [001] than on (001).
The thermal stability of phosgenite observed in this study is consistent with the genetic conditions of this mineral. We can expect that, in Nature, phosgenite nucleates and grows at temperature mostly below 520 K, at which our data show the first evidence of structure destabilization and transformation (with the coexistence of phosgenite + Pb2O2Cl, and likely an amorphous Pb–O–Cl-bearing phase). If we consider the dwell time of the in situ high-temperature XRD and TG experiments, along with the nature of the reaction products, we are inclined to believe that the high-temperature reactions of phosgenite, observed in this study, represent equilibrium conditions (e.g. progressive incongruent breakdown, perhaps with a melt phase), rather than the result of a kinetic control on observed phase assemblages.
An open question remains the driving force of the low-T phase transition observed in this study. In the low-T polymorph, one unique Pb-polyhedron transforms into two independent Pb-polyhedra, as the effect of a slight distortion, with a consequent lowering of the symmetry of the whole structure from space group P4/mbm to P  $\bar 4$ (Tables S2 and 3). However, although the lower symmetry allows more degrees of freedom, in terms of deformation, the polyhedra are almost indistinguishable from the parental one: in the high-T polymorph, the CN of the unique Pb-polyhedron is 9 (with 5Cl + 4O sites), and this configuration is maintained for two independent Pb-polyhedra of the low-T form. The maximum and minimum Pb–(O,Cl) bond distances of the high-T polymorph are ca. 2.36–3.34 Å, whereas in the low-T form are: ca. 2.36–3.31 Å and ca. 2.35–3.32 Å. One unique CO3-group is preserved at low-T, but with three independent O sites (i.e. O1, O2 and O3), if compared to the two independent O sites of the high-T polymorph (i.e. O1, O2 ×2; Tables S2 and 3). Nevertheless, the geometry is not pronouncedly changed at low-T, in terms of C–O bond lengths or O–C–O and O–O–O angles, though the aplanarity of the anionic group at low-T is not null, as it is at room T, but rises to ≤0.8° (Table 3). Hence, we cannot exclude that the low-T induced ‘compression’ of the structure, with a shortening of ca. 0.06 Å along [100] (or [010]) and ca. 0.03 Å along [001] (from 293 to 20 K, Table S1), leads to a deformation of the CO3-group in order to reach a configuration energetically more favourable, requiring, as a net effect, a lowering of the symmetry of the crystalline edifice.
Supplementary material
The supplementary material for this article can be found at https://doi.org/10.1180/mgm.2025.10131
Acknowledgements
The authors thank the ISIS Neutron and Muon Source at the UKRI-STFC Rutherford Appleton Laboratory (UK) for the allocation of beamtime. The support of the Italian Ministry of Education (MIUR) through the projects “Dipartimenti di Eccellenza 2023-2027” is also acknowledged. S. Mills, G. Bromiley and an anonymous reviewer are warmly thanked for the revision of this manuscript.




 Open access

