





1. Introduction
Geodetic glacier mass balance approaches have become increasingly common due to advances in global glacier inventories (Pfeffer and others, Reference Pfeffer2014) and elevation data availability (Farr and others, Reference Farr2007; European Space Agency, 2010, 2022; Porter and others, Reference Porter2018; Wessel and others, Reference Wessel2018; Neumann and others, Reference Neumann2019; U.S. ASTER Science Team, 2022). Hydrologically meaningful glacier mass balance estimates require accounting for the changing glacier area. Previous research elucidates the differences between glaciological and modeling techniques that use a fixed (reference) vs evolving (conventional) glacier surface (Elsberg and others, Reference Elsberg, Harrison, Echelmeyer and Krimmel2001; Cogley and others, Reference Cogley2011; Huss and others, Reference Huss, Bauder and Funk2012). However, the evaluation of fixed vs time-varying glacier area treatment for geodetic methods is relatively underdeveloped.
Reanalysis studies have emphasized the importance of consistent area treatment between geodetic and glaciological balances (e.g. Zemp and others, Reference Zemp2013). Geodetic glacier mass balances account for the changing glacier area where such glacier area data are available (Fischer and others, Reference Fischer, Huss and Hoelzle2015; Magnússon and others, Reference Magnússon, Belart, Pálsson, Ágústsson and Crochet2016; Dussaillant and others, Reference Dussaillant and Brun2018; Florentine and others, Reference Florentine, Harper, Fagre, Moore and Peitzsch2018; Belart and others, Reference Belart2019; Falaschi and others, Reference Falaschi, Lenzano, Villalba and Bolch2019; Zemp and others, Reference Zemp2019; Kapitsa and others, Reference Kapitsa, Shahgedanova, Severskiy and Kasatkin2020; Hugonnet and others, Reference Hugonnet2021; Mukherjee and others, Reference Mukherjee, Menounos, Shea and Mortezapour2022). However, in many standalone remote sensing studies, the specific geodetic glacier mass balances reflect a fixed glacier area (Brun and others, Reference Brun, Berthier, Wagnon, Kääb and Treichler2017; Menounos and others, Reference Menounos2018; Dussaillant and others, Reference Dussaillant2019; Shean and others, Reference Shean2020; Jakob and others, Reference Jakob, Gourmelen, Ewart and Plummer2021). This is due to the dearth of time-varying glacier area data that correspond to the timing of elevation data acquisition. Whereas photogrammetry routines have automated the generation of DEMs from stereoscopic aerial or satellite imagery (Shean and others, Reference Shean2016; Knuth and others, Reference Knuth2023) the automatic generation of glacier outlines has advanced (Roberts-Pierel and others, Reference Roberts-Pierel, Kirchner, Kilbride and Kennedy2022) but is not as widespread or reliable.
Previous studies concluded that fixed area treatment had minor effects on regional mass balance rates (1–3%), but considerable effects (10%) for fast-retreating glaciers (Fischer and others, Reference Fischer, Huss and Hoelzle2015; Falaschi and others, Reference Falaschi2017). Studies in the European Alps have shown that fixed area treatment can underestimate glacier mass change rates by 14% (Sommer and others, Reference Sommer2020). Fixed area treatment is thus a potentially impactful source of systematic bias on specific geodetic mass balance where glacier area is rapidly changing.
Geodetic glacier mass balance uncertainties rarely if ever formally incorporate the effects of fixed area treatment. Uncertainties account for random error associated with the mass to density conversion, elevation error and/or error in temporally discrete glacier area data associated with glacier margin delineation (Brun and others, Reference Brun, Berthier, Wagnon, Kääb and Treichler2017; Florentine and others, Reference Florentine, Harper, Fagre, Moore and Peitzsch2018; O'Neel and others, Reference O'Neel S2019; McNeil and others, Reference McNeil2020; Shean and others, Reference Shean2020; Mukherjee and others, Reference Mukherjee, Menounos, Shea and Mortezapour2022). Occasionally, geodetic mass balance error budgets account for other sources of systematic uncertainty associated with elevation change including imperfect sensor geometry and coregistration, but not glacier area change (Brun and others, Reference Brun, Berthier, Wagnon, Kääb and Treichler2017; Menounos and others, Reference Menounos2018; McNeil and others, Reference McNeil2020).
Here we assess the bias introduced by treating glacier area as fixed at the maximum during specific geodetic glacier mass balance calculation. First, we define the systematic bias introduced by the fixed (maximum) area treatment in general terms. Then, we quantify the bias for geodetic mass balance results for U.S. Geological Survey Benchmark Glaciers, which employ 36 digital elevation models (DEMs) and coincident glacier area data dating from 1948 to 2021 (McNeil and others, Reference McNeil2019).
2. Methods
2.1. Time-varying glacier area treatment
Geodetic mass balance accounting for real-world changes in glacier area (Zemp and others, Reference Zemp2019) is given by:

here ΔV is the glacier volume change, $\bar{S}$ is the average glacier area over the period of measurement, $\bar{\rho }$
 is the average material density, ρ w is the density of water (1000 kg m−3), and Δt is the measurement period. The $\bar{\rho }/\rho _w$
 term constitutes a density conversion factor, which is routinely assigned as 0.850 when the time interval is longer than five years and the glacier mass balance rate exceeds 0.2 m water equivalent per year (m w.e. a−1) (Huss, Reference Huss2013). The geodetic mass balance B is intercomparable with conventional glaciological balances and can be used to calibrate glaciological time series. The time-varying area treatment in Eqn (1) reflects the real-world, changing glacier area.
2.2. Fixed glacier area treatment
Time-varying glacier area data are not always available. Therefore, in many standalone remote sensing studies, glacier area is treated as fixed. This fixed area is commonly assumed to be the maximum glacier area, S max, giving:
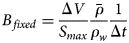
Equation (2) estimates the overall glacier mass change associated with changes in surface elevation, averaged across the fixed maximum glacier area. Relative to Eqn (1), such solutions poorly represent real-world physical processes, including area change, and are difficult to compare with glaciological balances that account for changing glacier area. It does not enable intercomparison across glaciers experiencing varying rates of area change.
2.3. Systematic bias and relative area change
The bias (δ, m w.e. a−1) introduced by using a fixed, maximum glacier area is:

The ΔV, $\bar{\rho }$ , ρ w and Δt are identical for B and B fixed, therefore Eqn (2) can be expressed in terms of the geodetic balance, and the bias is:
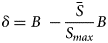
For inter-method comparison, the average glacier area $( {\bar{S}} )$ is calculated from the same area time series used in the glaciological mass balances. If the rate of area change is linear, then $\bar{S}$
 can be approximated as the average of the maximum and minimum glacier areas ((S max + S min)/2). Note that area change is not linear in cases of glacier surging or other irregular patterns of glacier area change during the geodetic measurement interval. Substituting into Eqn (4) yields:

This defines the bias in terms of relative glacier area change (ΔS/S max) = ((S max − S min)/S max) = 1 − (S min/S max). Hence the fixed, maximum area bias is predictable as a function of the relative glacier area change and glacier mass balance:

2.4. Application to benchmark glaciers
Next, we illustrate and quantify the bias introduced by the fixed, maximum area treatment using applied cases from the tested geodetic mass balance time series. We employ geodetic data collected on the U.S. Geological Survey Benchmark Glaciers. These five glaciers span the climate zones that support glacierized mountains in Alaska and the contiguous U.S. including midlatitude continental (Sperry Glacier), midlatitude maritime (South Cascade Glacier), high-latitude maritime (Wolverine and Lemon Creek Glaciers), and high-latitude continental (Gulkana Glacier). The U.S. Geological Survey started an ongoing program of glaciological research in 1957 for the International Geophysical Year. South Cascade, Wolverine and Gulkana Glaciers are World Glacier Monitoring Service reference glaciers with more than 30 years of uninterrupted seasonal glaciological mass balance measurements.
Glacier area is known at multiple times throughout the observational period. The rate of glacier area change from each start date to end date in this tested dataset is approximated as linear. The mean difference between average areas computed using multiple glacier area timestamps, i.e. every available glacier area (S e, Table 1) and the $\bar{S} = ( ( S_{max} + S_{min}) /2)$ approximation is 2.01% and the std dev. is 2.38% (Table 1). In the benchmark glacier dataset, the maximum area corresponds to the start of the geodetic interval, and the minimum area corresponds to the end.
Geodetic results. S max is the maximum and S min is the minimum glacier area between the start and end dates of the geodetic measurement period. $\bar{S}_e$ is the average area computed using every available area, and $\bar{S}$
 is the average area assuming linear area change computed using only the maximum and minimum. Geodetic mass balance (B) and interval length (dt) are listed.

In this study, the fixed area bias is calculated for every geodetic time interval (e.g. 1967 to 2016, 1974 to 2016, etc.). The time interval is defined by the acquisition date and the date of the reference DEM used for coregistration. We used DEMs and glacier outlines covering the benchmark glaciers between 1948 and 2021 derived from aerial and satellite stereo image pairs (n = 33), historic topographic maps (n = 2), and Shuttle Radar Topography Mission data (n = 1) (McNeil and others, Reference McNeil2019). Glacier area data and DEMs were derived from the same source imagery, therefore glacier area dates coincide with elevation data timing. Geodetic mass balance results reflect Eqn (1) and details outlined in O'Neel and others (Reference O'Neel S2019), except that here DEM alignment was executed using automated coregistration (Shean and others, Reference Shean2016), geodetic intervals are all longer than five years, and geodetic balance rates exceed 0.2 m w.e. a−1.
Glacier volume change (ΔV) and geodetic mass balance (B) results presented in this study were executed using DEM pair differencing. Universal coregistration (Nuth and Kääb, Reference Nuth and Kääb2011) was used to align DEMs by minimizing offsets in snow-free, off-glacier, stable bedrock terrain. Voids in the DEMs were filled using a regression between elevation and surface elevation change (McNabb and others, Reference McNabb, Nuth, Kääb and Girod2019). DEM dates are listed in Table 1 and were selected to correspond with the timing of annual glacier mass minimum at the end of the summer melt season. Geodetic glacier mass balance uncertainties account for error on the elevation change signal and uncertainty in the volume to mass conversion associated with material density assumptions (Florentine and others, Reference Florentine, Harper, Fagre, Moore and Peitzsch2018; O'Neel and others, Reference O'Neel S2019).
3. Results
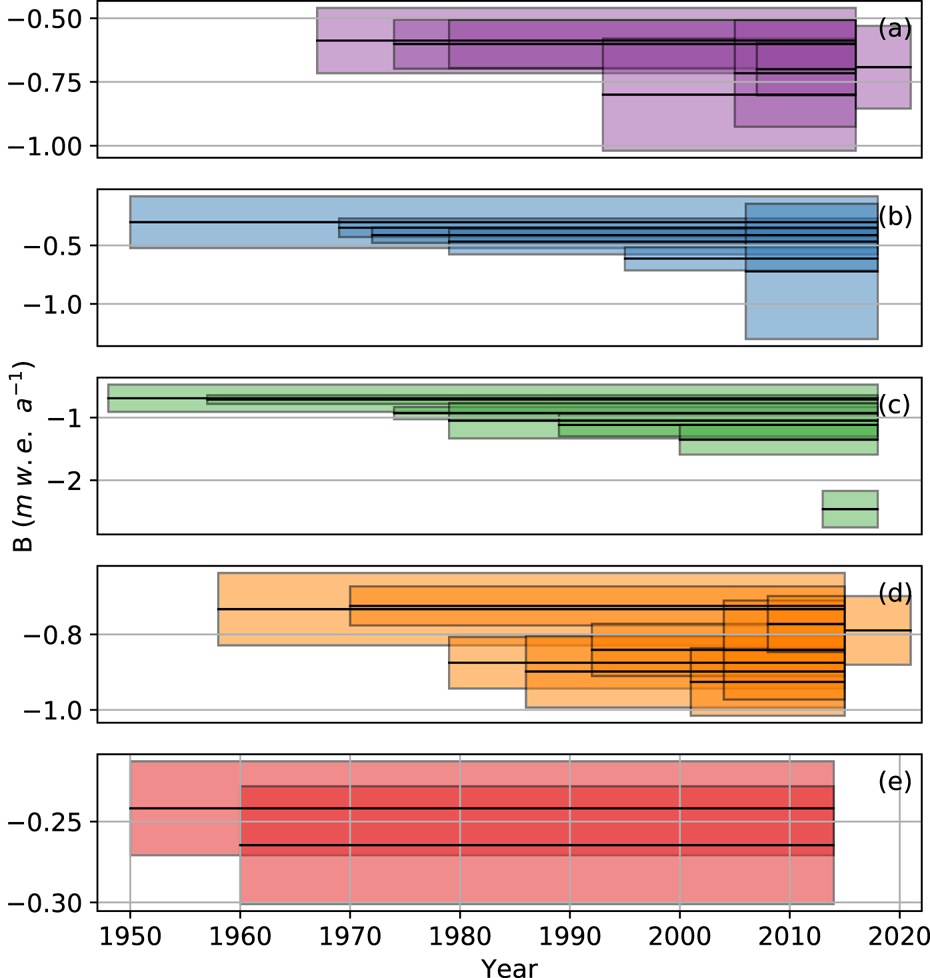
Benchmark glacier geodetic balances range from −0.24 to −2.46 m w.e. a−1, relative area changes range from 1 to 38%, and the biases range from −0.01 to −0.14 m w.e. a−1 (Figs 1, 2, Table 1). The largest bias was found for South Cascade Glacier in the 1958 to 2015 period, which had a geodetic balance of −0.73 m w.e. a−1 and relative area change of 38%.
Geodetic mass balance (black) with error (color) for (a) Gulkana, (b) Wolverine, (c) Lemon Creek, (d) South Cascade and (e) Sperry Glaciers.
Bias introduced by the fixed, maximum area treatment, expressed as a function of relative area change. Hypothetical balances (B) are shown by solid grayscale lines. Results for this study are shown by colored squares for Gulkana (purple), Wolverine (blue), Lemon Creek (green), South Cascade (orange) and Sperry (red) Glaciers. Orange and green lines show that the maximum bias does not correspond to the maximum balance.
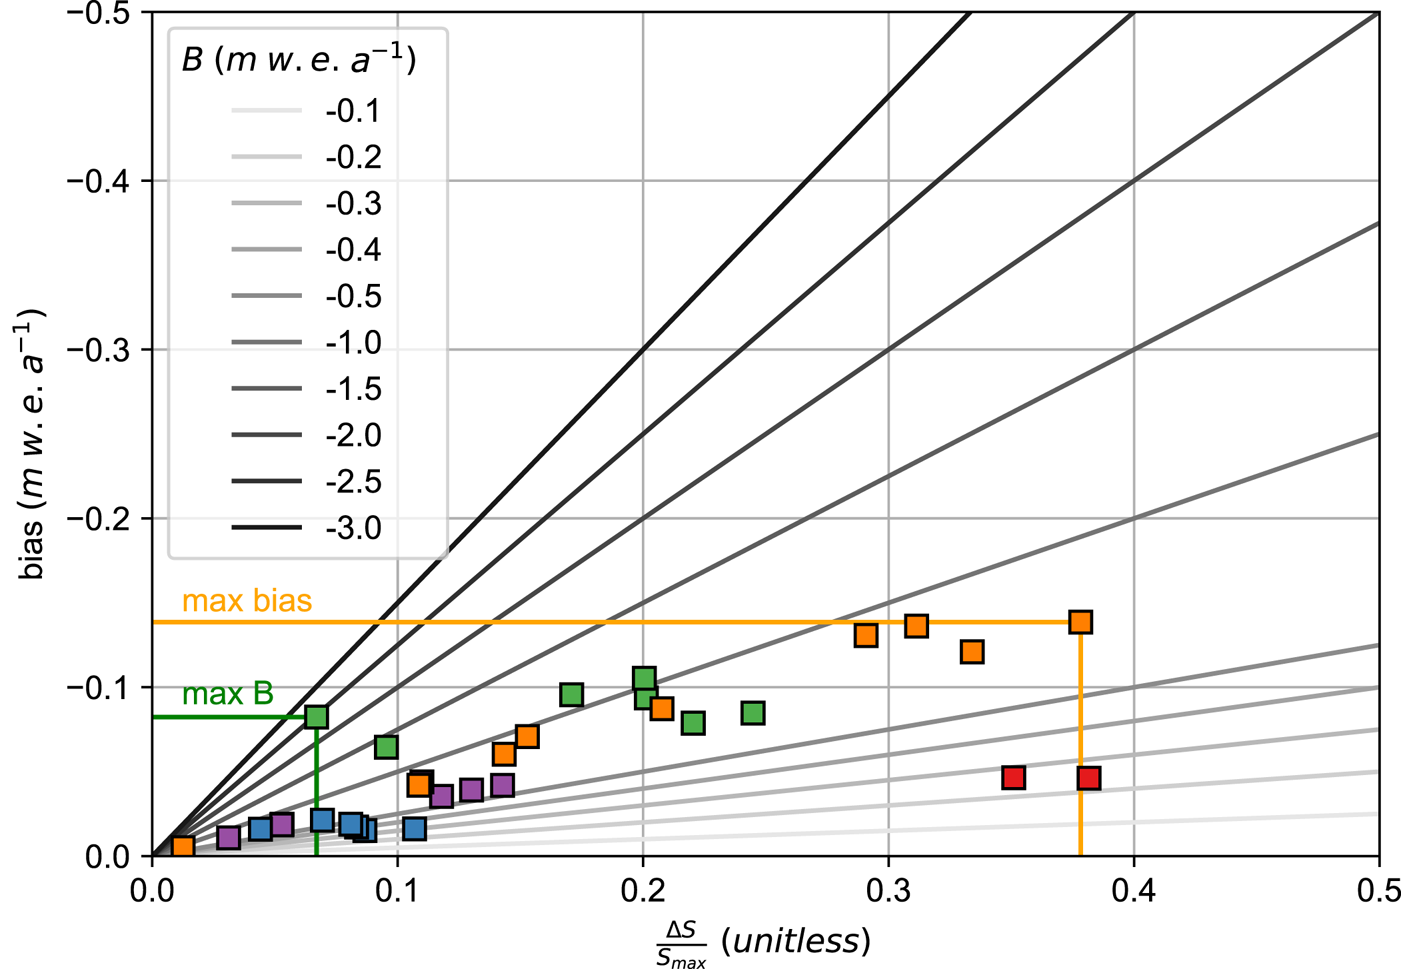
Big relative area change for the benchmark glaciers generally corresponds to larger bias (Fig. 2). Similarly, small relative area change for benchmark glaciers can correspond to smaller bias, but not necessarily, because the bias is driven by both the relative area change and the magnitude of the geodetic mass balance (Eqn (6)). For example, the bias for Wolverine Glacier is 0.016 m w.e. a−1 for both the 2006 to 2018 and 1950 to 2018 intervals, though the relative area change was 4 and 11% respectively. The smaller relative area change in the 2006 to 2018 interval is offset by larger geodetic mass balance (−0.72 m w.e. a−1), and the larger relative area change in the 1950–2018 interval is offset by smaller geodetic mass balance (−0.30 m w.e. a−1).
Figure 2 illustrates this concept, showing, for example, that the −0.1 m w.e. a−1 fixed (maximum) area bias is possible for a range of relative area change and mass balance scenarios. Hence bias is not necessarily biggest for the fastest mass change rates or most relative area change. Rather the combination of fast retreating, fast thinning glaciers show the greatest bias between area treatments.
Fixed maximum glacier area handling subdues the m w.e. a−1 signal, but to varying degrees, in proportion to the geodetic results particular to each measurement interval. The biases tested here ranged from 0.01 to 0.19 as a fraction of the mass balance (Fig. 3). The fixed area treatment therefore underestimates mass balance by 1 to 19% for these test cases.
The fixed (maximum) area treatment underestimates mass balance by a fractional bias that is half the relative area change. The x-axis shows the relative area change (ΔS/S max) and the y-axis shows (1/2)(ΔS/S max) which, as shown by Eqn (6), is equivalent to the bias over the specific geodetic mass balance, i.e. (δ/B) the fractional bias. Results for this study are shown by colored squares for (a) Gulkana, (b) Wolverine, (c) Lemon Creek, (d) South Cascade and (e) Sperry Glaciers. Glacier area change is shown by glacier maps. North arrow and scale bar shown on inset of (e). First (left) and last (right) dates of the measurement period are indicated.
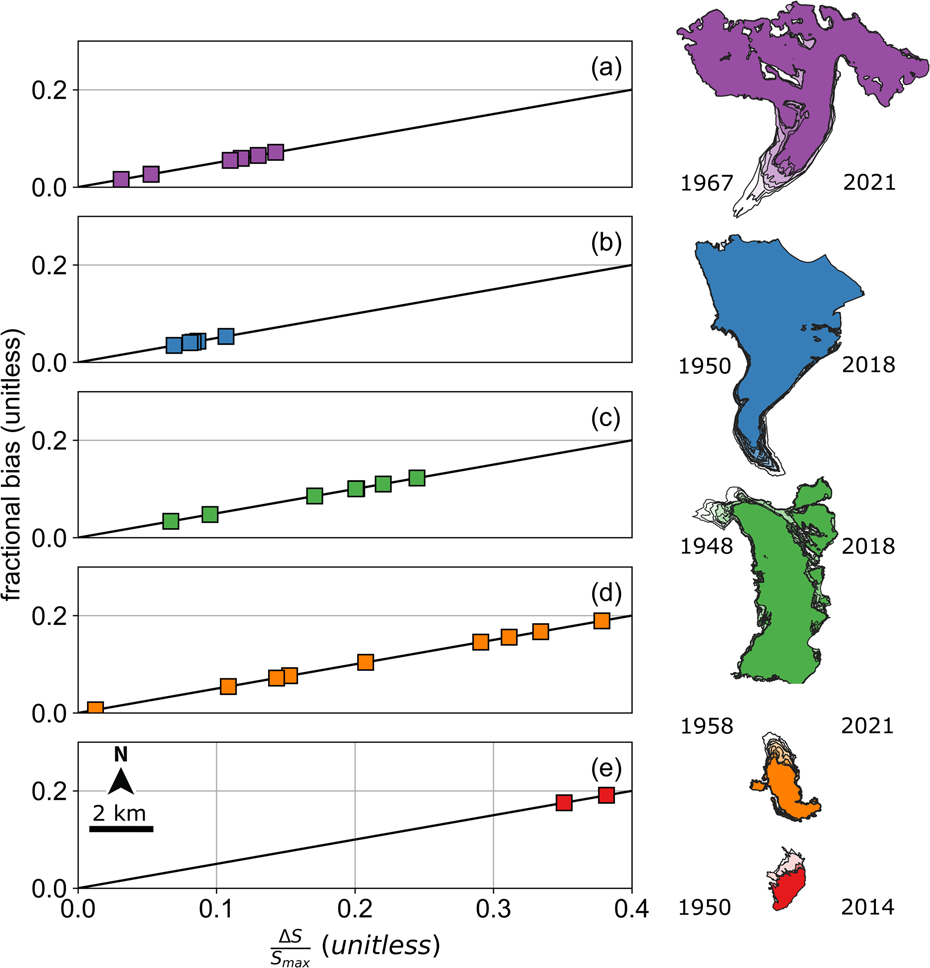
Our results illustrate how the fixed (maximum) area handling bias is predictable when glacier area dates correspond to DEM dates and the relative area change over the geodetic measurement interval is known. Figure 3 shows the linear relationship between relative area change and relative bias, where area change is expressed relative to the maximum area (ΔS/S max) and bias is expressed relative to the specific geodetic mass balance (δ/B). This fractional bias is one half the relative area change, as shown by Eqn (6) ((δ/B) = (1/2)(ΔS/S max)). Thus 38% relative area change results in 19% fixed area treatment bias.
4. Discussion
4.1. Toward clarity in area handling
Previous researchers have explored the effects of using a single glacier area on select geodetic mass balance results, but have not described the area handling bias beyond discrete sensitivity tests (Fischer and others, Reference Fischer, Huss and Hoelzle2015; Brun and others, Reference Brun, Berthier, Wagnon, Kääb and Treichler2017; Falaschi and others, Reference Falaschi2017; Dussaillant and others, Reference Dussaillant2019; Sommer and others, Reference Sommer2020). Here we described the fixed-area bias in general terms and present a method to correct the bias that can be applied to any glacier study where the maximum and minimum glacier areas during the measurement period are known, and the rate of glacier area change can be approximated as linear. These conditions are likely not met in glacier surge situations or where there is mismatch between the glacier area date and the elevation change measurement.
Furthermore, the bias definition asserts that the fixed area is the maximum, but the known area may not always represent the maximum area. Not only will the bias not be predictable when the true maximum glacier area is not used, the glacier volume change will have unknown error. The use of a smaller area crops the total glacier, consequently underestimating the total volume change. Depending on the rate of change within the omitted area this could lead to either an underestimate or an overestimate of average thinning rates. Hence the error that is introduced by using fixed glacier area that does not align with the maximum has an unknown effect.
Global studies of glacier change approach glacier area assuming a linear change through time, calibrated to available data that capture relative glacier area change for glacierized regions worldwide (Zemp and others, Reference Zemp2019; Hugonnet and others, Reference Hugonnet2021). These studies use the available estimates presented in IPCC AR5 (chapter 4, figure 4.10, table 4.SM.1) (Vaughan and others, Reference Vaughan2013). However, these data reflect variable dates and measurement intervals, and do not encompass the comprehensive population of global glaciers. It is assumed that the available dataset on glacier relative area change is spatially and temporally representative. Future studies could explore the impact of these assumptions by comparing this baseline dataset against regionally complete inventories of glacier area change.
4.2. Need for temporally varying area
The fixed area treatment yields results that are biased compared with glaciological balances that incorporate glacier hypsometry and surface area change over time (Sommer and others, Reference Sommer2020). Averaging the glacier mass change signal across the average glacier area yields results that are comparable to conventional balances (Elsberg and others, Reference Elsberg, Harrison, Echelmeyer and Krimmel2001; Cogley and others, Reference Cogley2011; Huss and others, Reference Huss, Bauder and Funk2012). In contrast, we show that averaging the glacier mass change signal across the fixed, maximum glacier area without resolving the time-evolving glacier footprint underestimates the mass change signal. Our results therefore underscore the importance of precise glacier area time series for calculating geodetic mass balance.
Temporal bias between the acquisition date of the glacier outline and the elevation change observations will yield unpredictable bias. Fixing the glacier area to an outline that does not represent the maximum glacier extent biases the glacier height change, volume change and geodetic mass balance. The Randolph Glacier Inventory (RGI; Pfeffer and others, Reference Pfeffer2014) provides a globally complete inventory of glacier area for one snapshot in time. Comparing benchmark glacier area data to the RGI suggest that pairing historic elevation data with RGI glacier area dates can alter geodetic mass balance results in variable ways (Table 2). The RGI 6.0 time stamps are up to 57 years past and 59 years before our geodetic measurement dates. The RGI 6.0 areas are up to 26% smaller or 63% bigger than our geodetic observations of glacier area for each measurement date (Table 2) due to the temporal mismatch between source imagery used to delineate glacier outlines. Additional sources of uncertainty affect glacier outlines due to inadvertent inclusion of seasonal snow or differences in manual tracing (Paul and others, Reference Paul2013).
Glacier areas and geodetic measurement dates used in this study (S, t) compared to RGI 6.0 glacier areas and dates (S RGI, t RGI). Percent difference between areas (S and S RGI) is reported in the last column. Negative indicates that the RGI 6.0 area is smaller than the observed area.

Using the RGI area with the benchmark glacier DEM data in this study would introduce variable and unpredictable bias to the specific geodetic mass balance. To explore this effect, we computed the average height change across the RGI area and compared it to the average height change across the glacier area at each time step. We did not interpolate the DEM or convert glacier height change to mass change, to consider strictly the raw elevation differences between co-registered DEM data. These differences ranged from −10 to +35%, with median value of +2% and std dev. of 11%. This exercise illustrates the variable and nontrivial error introduced by using glacier areas that are not necessarily contemporaneous with the DEM acquisition date.
Using the RGI 6.0 glacier area footprint in our study would either sample bare ground and thereby dampen the volume change signal or exclude glacier ice and thereby yield results for some unknown portion of the glacier mass change. Including nonglacierized terrain may incorporate elevation change signals caused by changing proglacial area, e.g. outlet stream meandering, moraine erosion and hillslope instability, and attribute them inaccurately to glacier change. Similarly, excluding glacierized terrain misses some portion of the glacier elevation change signal. Depending on how fast the excluded portion of glacier is thinning (or thickening) compared to the measured portion of the glacier this can result in either larger or smaller estimates of specific geodetic mass balance.
4.3. Implications for calibrating glaciological measurements
We find that calibrating glaciological measurements with specific geodetic balances that have not handled changing glacier area biases the cumulative mass balance trend. Glaciological data capture interannual variability in mass balance, but do not reliably capture the mass balance trend, and therefore cannot independently validate the cumulative glacier mass balance (Zemp and others, Reference Zemp2013). Therefore, geodetic mass balance results are used to calibrate the glaciological balances, to reduce systematic bias caused by stake placement (O'Neel and others, Reference O'Neel S2019). For example, geodetic calibration executed in the O'Neel and others (Reference O'Neel S2019) mass balance reanalysis of the benchmark glaciers showed that uncalibrated glaciological measurements at Wolverine Glacier for the 1980 to 2006 interval yield a positive trend in mass balance and net mass gain, which is inconsistent with observations of glacier retreat during this interval. The geodetic results yield a negative trend, indicating that the glaciological data underestimate ablation or overestimate accumulation. The glaciological data required nearly one meter per year (−0.98 m w.e. a−1) calibration.
The benchmark glacier uncalibrated, conventional glaciological measurements reflect a time-varying glacier surface, wherein glacier hypsometry is updated annually and the m w.e. a−1 time series corresponds to smaller and smaller glacier areas over the time interval. In contrast, geodetic balances computed using the fixed (maximum) area treatment do not evolve the glacier area. This dampens the specific geodetic mass balance signal. Thus, even though the fixed (maximum) area treatment on the geodetic balance is biased, it reduces the mismatch with the positive uncalibrated glaciological trend. Indeed, fixed (maximum) area treatment on specific geodetic balances reduces the mismatch for all benchmark glaciers and every time interval (n = 31). The mismatch with uncalibrated glaciological data using fixed (maximum) area treatment on the geodetic mass balance is −0.51 m w.e. a−1, whereas the mismatch using the time-varying area treatment is −0.55 m w.e. a−1.
Correcting the area handling bias does not necessarily close the gap between uncalibrated, conventional glaciological measurements and the geodetic balance. However, it ensures that both measurements reflect time-varying glacier area. It furthermore ensures geodetic mass balances accurately capture the long-term mass balance trend.
5. Conclusions
We quantified the bias introduced by fixed (maximum) glacier area handling in geodetic glacier mass balance. We described this bias in general terms and presented a means to correct the bias that can be applied to any glacier study where the maximum and minimum glacier areas during the measurement period are known, and the rate of glacier area change can be approximated as linear. However, we caution that the bias will be unpredictable if the fixed area treatment does not use the maximum glacier area. The bias scales with relative glacier area change and mass balance rate. Therefore, the fixed area bias is likely most problematic in regions where glaciers are retreating and thinning fast. This motivates improved glacier area data availability and clear reporting of the area-averaging treatment used in geodetic mass balance studies
Our analysis of five North American glaciers over various time intervals ranging from the mid-20th to early 21st century, showed that fixed (maximum) area handling consistently underestimates geodetic mass balance results by up to 19%, with the biggest discrepancy arising at South Cascade Glacier where large relative area changes are coupled with substantial elevation change.
Using fixed area treatment introduces a bias that systematically underestimates glacier mass balance. Whereas averaging across the maximum glacier area dampens the mass change signal, time-varying glacier area treatment yields geodetic balances that are comparable to glaciological and modeled conventional balances and translate to physical process insight.
If geodetic mass balance calculations do not account for glacier area change, then the m w.e. a−1 result cannot be compared across populations of glaciers with varying rates of area change. We suggest that geodetic mass balance calculations use time-evolving glacier area to reflect the dynamic glacier response to climate forcing whenever possible. In the absence of precise glacier area time series, studies will benefit from clear reporting of the glacier area treatment, to ensure inter-method comparisons are well understood.
Data
Glacier area data and digital elevation models for the five U.S. Geological Survey benchmark glaciers are available for download (https://doi.org/10.5066/P9R8BP3K), as part of the larger comprehensive USGS Benchmark Glacier data collection (https://doi.org/10.5066/P9AGXQSR). Randolph Glacier Inventory glacier area data are publicly available at (https://doi.org/10.7265/4m1f-gd79).
Acknowledgements
We appreciate the International Association of Cryospheric Sciences Regional Assessments of Glacier Mass Change working group for connecting us to the global community of researchers, which enhanced the idea development. This research was supported by the U.S. Geological Survey Ecosystems Mission Area Climate Research and Development Program. Any use of trade, firm or product names is for descriptive purposes only and does not imply endorsement by the U.S. Government.
Author's contributions
All authors contributed to the conceptualization of this work. CF executed formal analysis, developed methodology and visualized data. EB and CM provided data curation. CF, LS and SO secured funding and provided project administration. CF wrote the original draft. All authors reviewed and edited.


 Open access

