


Although the lumbering industry was part of the South American economy from the earliest settlement, the development of a modern pulp and paper industry occurred only in the late twentieth century. It was in the 1960s that Brazil and Chile had sufficient production to begin exporting small quantities of chemical wood pulp, and Uruguay entered the market in 2008. Yet by 2019, these three countries had become the largest region of cellulose exports in the world.Footnote 1 That South America now accounts for well over a third of world timber exports is an extraordinary achievement given the numerous economic crises the region has suffered in the past decades.
How this industry evolved in Brazil, Chile, and Uruguay is the object of this study. There is little question that this agro-industrial sector could emerge only with direct government support to the private sector to two major areas: the planting of new forests with new nonnative tree varieties and the construction of complex and costly processing factories. Governments in all three countries enacted new forestry laws designed to promote the industry through subsidization of tree plantations, and in some cases, they even created state-owned forests. Governments provided scientific research support and developed forestry programs at state universities, and they invested massively in mill development alone or along with private capital. In one case, the government even gave up its taxing rights to promote the industry based exclusively on foreign capital. This was a classic example of successful state-sponsored industrialization.
That these efforts succeeded had a great deal to do with local scientific research and the climate. The science required the adoption of adequate trees to local soils and the introduction of nonnative trees that would produce the requisite type of pulp. Once the scientific research was complete and funding made available, massive forests were planted that produced mature trees many years earlier than in northern climates. This fact, together with abundant land for establishing forests, made South America an ideal place to produce cellulose, the crucial input for papermaking. Finally, changing paper demand in other more established production areas and the rise of Asian consumers all helped promote South America’s entry into a market previously dominated by Europeans and North Americans.
The development of wood-based papermaking
Until the mid-nineteenth century, paper was primarily made from rags of cotton or flax (Erhardt and Tumosa Reference Erhardt and Tumosa2005). But from the 1840s, wood began to replace rags as the primary source of paper. By the 1850s, wood pulp was being made by special machines that ground wood to produce the fibers, with one of the first such mills established in Sweden in 1857. This was soon followed by such groundwood mills in the United States, which used water to extract individual fibers from the wood pulp. But chemicals were soon shown to be a more efficient way to extract the pulp, and by the 1870s and 1880s, the first chemical pulp factories were established using sulfite. With this transition, wood pulp became the predominant source of paper, especially newsprint. The sulfite process, which used acid to remove nonresinous wood, was more efficient than groundwood pulp and required relatively little energy. Finally, in the early twentieth century sulfate was introduced to extract wood fibers (Järvinen et al. Reference Järvinen, Ojala, Melander, Lamberg, Lamberg, Ojala, Peltoniemi and Särkkä2012; Toivanen Reference Toivanen2012). The transition to the new system was rapid. Mechanically produced pulp, which accounted for a third of world production in 1961, steadily declined each decade thereafter, reaching 20% of world production in 2010 and just 1% in 2019. Chemically created pulp was already appearing on the international market in the late 1960s, and by 1970 it accounted for over two-thirds of all pulp exported to the world market; by 2019, it represented 99% of the volume all world pulp exports. Of this chemically created cellulose, bleached sulfate pulp dominated the world market. By 2019, it accounted for 96% of the volume and value of chemically produced wood pulp.Footnote 2
Why this change occurred is due to the costs and efficiencies of each process. The sulfite processes led to poor-quality cellulose with weaker fibers, and mechanical pulping could not extract most of the lignin (a complex organic polymer deposited in trees’ cell walls) that formed the basis of the cellulose. In contrast, the sulfate process successfully removed most lignin from the original wood, thus creating stronger and longer-lasting fibers. Mechanically generated pulp produced a relatively inexpensive but poor-quality paper that could be used for newsprint and catalogs. The new chemicals—first sulfite and then sulfate (also known as the kraft process) worked with precut wood chips that were then subject to high temperature and pressure. Of the three processes, it was the sulfate—or kraft process—that created the strongest paper and allowed for use of a wide variety of wood species (Cohen Reference Cohen1987).
Regional development of the industry
Despite the late start in papermaking of Brazil, Chile, and Uruguay, forestry production is actually one of the oldest agricultural activities in South America. The fine woods of the continent have been exported to Europe for decades. Shipbuilding yards in colonial times were found in both Pacific and Atlantic ports, and wood for construction was produced everywhere. Specialty woods were exported to Europe from the sixteenth century, especially brazilwood (pau brasil), and used to create the famous red dyes much beloved in Europe (Miller Reference Miller2000). But the modern cellulose industry based on planted forests and pulp and paper factories is a quite recent development going back to only the mid-twentieth century. Given the costs involved, the industry was developed only with major support from government subsidies. Seeing the potential for this to become a serious export industry, each country’s government encouraged local private producers to expand production so as to become competitive in international markets. Each government also provided the funds for the scientific research needed to adopt nonnative species to the local climate. Finally, all three major producers wrote new forestry laws and offered incentives to develop tree plantations, to provide the industry’s crucial input. Planted forests of imported and modified pine and eucalyptus trees have since formed the basis for this industry. Although other countries in the region could have developed this agro-industrial sector, only Brazil, Chile, and Uruguay have so far provided the resources and consistent support needed to develop significant production of chemical cellulose, the current industry standard technique. Moreover, once established, several private Brazilian and Chilean producers have become multinational corporations.
When South American producers entered the world market in the late twentieth century, both the mechanical wood pulp and the sulfite process were in decline, and the chemical wood pulp production using sulfate was increasingly gaining market share. Thus the new South American pulp and paper industries quickly concentrated their efforts on producing two types of kraft papers. While initially they produced unbleached cellulose, eventually all South American factories concentrate their production in bleached cellulose for making white paper which today is their primary output. The bleaching process increases the so-called brightness of the resulting paper from 70% to about 92%—for reference, newsprint is about 60% bright; white printer paper, 75%; and high-grade bond, 85% (Biermann Reference Biermann1996). In the South American industry two types of bleached cellulose produced are produced, depending in whether the trees used were hardwood or softwood. The softwood pine trees produced long fibers and used the process known as bleached softwood kraft pulp (BSKP). The process for hardwood trees, above all eucalyptus, was bleached eucalyptus kraft pulp (BEKP), and this produced short-fiber cellulose (Luraschi Reference Luraschi2005). In Brazil, Chile, and Uruguay, each produces a different mix of BSKP and BEKP, depending on the variety of dominant trees and local climatic conditions.
Changing world trends
While papermaking began in Europe in the twelfth century, it was only from the nineteenth century that North America, with its extensive forests and land, become a major producer and exporter capable of competing with Europe (Hunter Reference Hunter1947). As late as 1996 the United States and Canada accounted for 50% of world exports of cellulose while South American producers accounted for only 12%. By 2019, North America’s position fell to 24% of the volume of exports and South America’s increased to 38%.Footnote 3 This trend was influenced by the decline in demand in the United States, which began in the 1990s and in Europe a decade later. This decline of paper and packaging papers was due to the growth of electronic media, which reduced the market for paper, and to the shift in basic manufacturing to Asia and the reduced need for packaging paper. At the same time there has been a major shift to using eucalyptus pulp for fine papers, and in this the South American producers had significant comparative advantage, which also led to the decline of North American producers. Thus North American and European cellulose production has stagnated in the past few decades, just as demand was increasing in Asia, and as the volume and quality of the South America factories have become highly valued in the world market (Hetemäki et al. Reference Hetemäki, Hänninen, Moiseyev, Hansen, Panwar and Vlosky2013; Hujala et al. Reference Hujala, Arminen, Hill and Puumalainen2013). Chemical wood pulp production grew at 6% per annum between 1990 and 2019 in South America, compared to a steady decline of −0.2% in North America and 0.7% for European producers. South American production went from 18% of North American output in the 2000–2004 period to 51% of North American production in 2015–2019. At the same time the volume of South American cellulose exports went from 43% of US exports in 2000–2004 to 147% of North American exports by 2015–2019 (FAOSTAT, 2021).
By the end of the second decade of the twenty-first century, the three leading South American producers of Brazil, Chile, and Uruguay had close to 13.3 million hectares of planted trees under production, and they were the most productive forestry producers of cellulose in the world; Brazil led the world in forest utility per hectare, with Chile close behind. These South American producers went from manufacturing 21 million tons of cellulose in 2000 to 27 million tons in 2019. By 2019, they accounted for 18% of world cellulose production. Unlike other big regional producers, they exported more than they consumed. Of the 27 million tons produced in 2019, 22 million were exported, representing 38% of world exports. Thus, despite their importance as exporters, the three nations contained only 13% of the world’s forests and 4% of the world’s planted forests, and they accounted for only 18% of the world production of chemical wood pulp; however, they accounted for 82% of South America’s forests (FAO 2016).
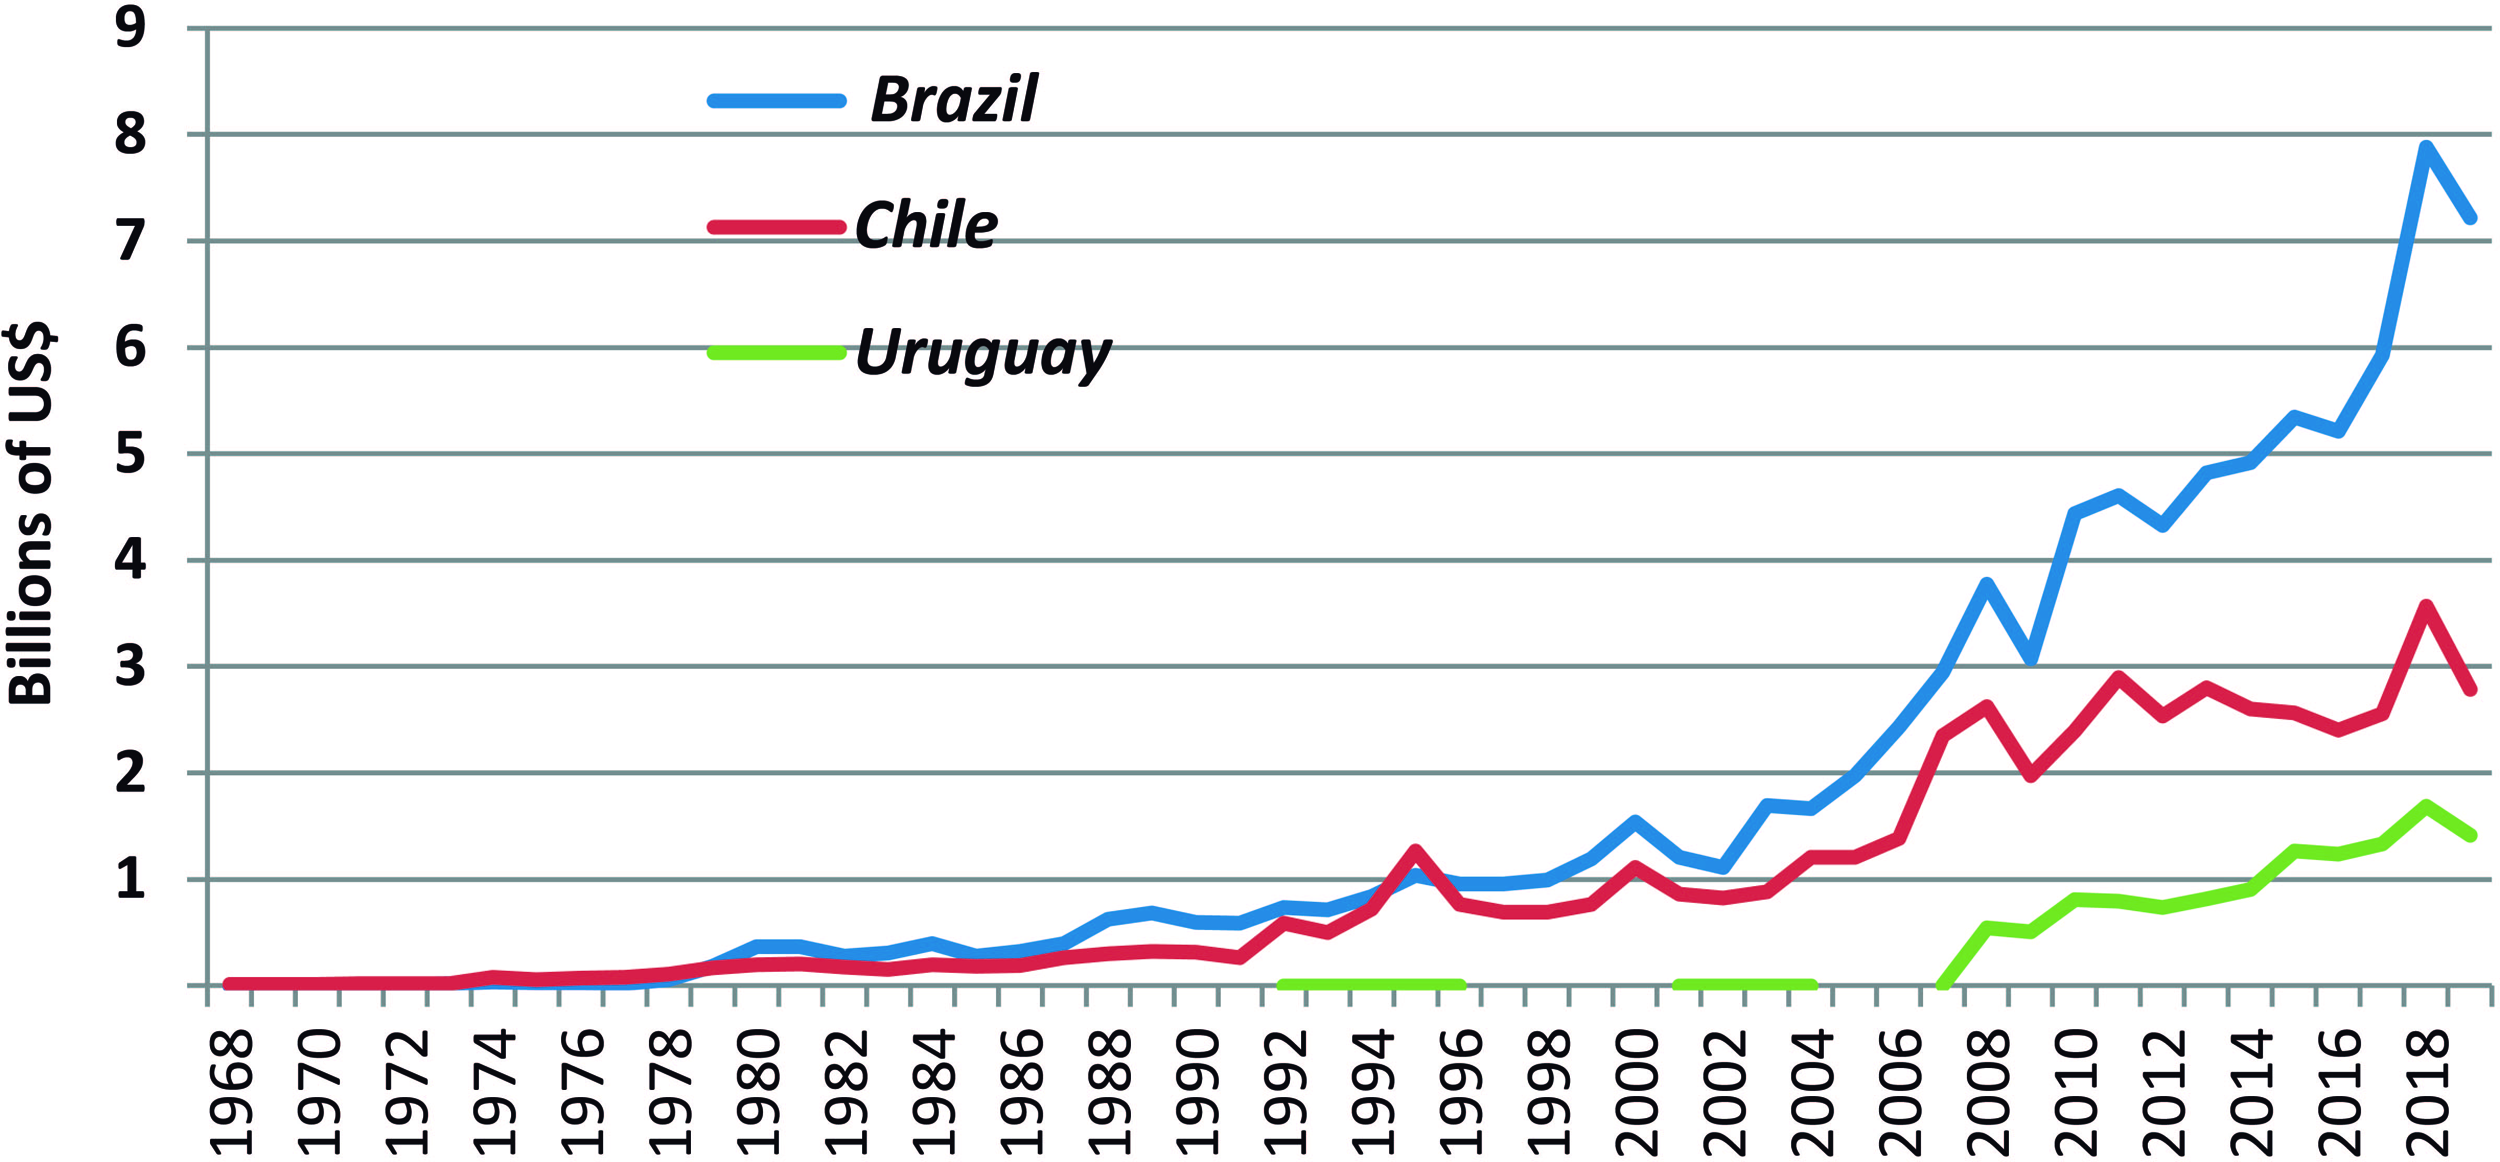
Currently, each country is among the top eight exporters of cellulose in the world. Brazil is ranked first, Chile fourth (behind Canada and the United States), and Uruguay eighth (behind Sweden, Finland, and Indonesia). In terms of national production, Brazil is ranked second (after the United States), Chile is tenth, and Uruguay is twelfth in the world. Yet in 1980, Uruguay produced and exported nothing; Chile was insignificant in the world market; and Brazil, though highly ranked, accounted for only 4% of world exports. By the 1990s, Chile, like Brazil, was finally exporting over US$1 million in cellulose, but still accounting for less than half of Brazilian exports in that decade. Together Chile and Brazil accounted for 8% of world exports, whereas Uruguay did not arrive at this level of importance until two decades later (Figure 1).
Value of chemical wood pulp exports of Brazil, Chile, and Uruguay, 1968–2019. FAOSTAT, http://www.fao.org/faostat/en/#data/FO.
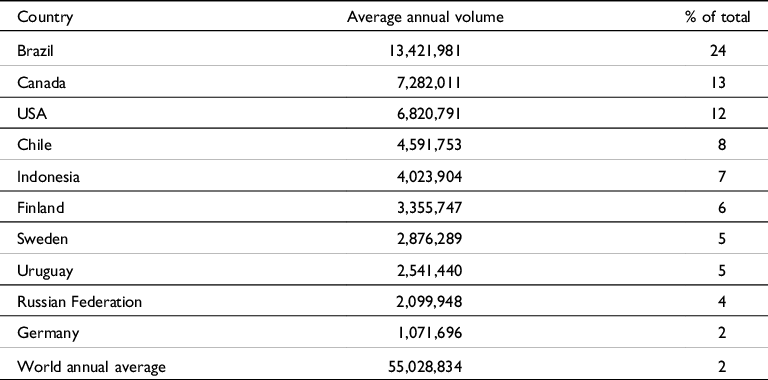
Given its late start, the modern cellulose industry in these three countries quickly concentrated on bleached sulfate-produced cellulose as their primary products based on two trees nonnative to the region: pines and eucalyptus adapted to local conditions. Each nation entered the market at a different time, but all came into full production at the end of the 2010s. By 2015 the three countries became the leading world region in cellulose production in terms of exports, and by 2019, they accounted for 38% of world exports, with Brazil alone accounting for 23% of the world export market. Chile was the fourth-largest exporter and late-entering Uruguay already the seventh largest, even though it began exports only in 2008 (Table 1).
Average annual chemical wood pulp exports by major world producers, 2015–2019 (in metric tons).
Source: FAOSTAT, http://www.fao.org/faostat/en/#data/FO.
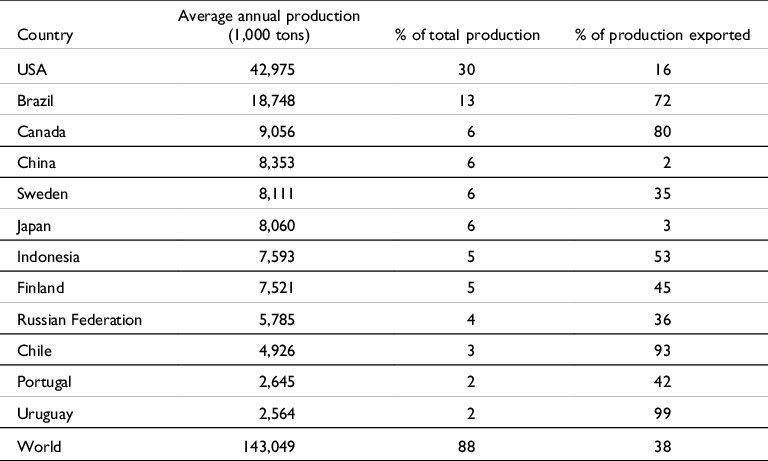
Their export success was due to unusual conditions in their home markets. Chile and Uruguay had limited internal demand for cellulose and exported almost all their production, and even Brazil consumed only a relatively small part of its cellulose. Thus, all three could export far more of their production than mature market economies could. They were also able to expand production quickly with major investments in new factories and processes that adopted the latest technology. In contrast, Japan and China are major producers that export almost nothing, and the United States exports only 30% of its national production. In the 2015–2019 period, Brazil exported 72% of its national production; Chile, 93%; and Uruguay, 99% (Table 2).
Average annual chemical wood pulp production by major producers and share of production exported, 2015–2019.
Source: FAOSTAT and FAO Forest Products, 2018, pp. 254–255, https://www.fao.org/forestry/statistics/80570/en/.
Brazil
Brazil was the first of the South American countries to develop a sophisticated pulp and paper industry. Limited paper production began in Brazil in the late nineteenth century. One of the earliest producers was founded in 1883, the Companhia Melhoramentos de São Paulo, which used rags as primary material. The first major wood-based paper production factory was Fábrica de Papel Paulista, founded in 1889. Then in 1908 the Klabin brothers imported modern machinery to produce paper from imported pulp. In 1912 the Anglo Brazilian Pulp and Paper Mills used pine from Paraná to create cellulose. Up to World War I, the principal paper products were nonbleached wrapping and carton paper, and during this time, Brazil had the most advanced pulp and paper industry in South America. Although chemically produced pulp was produced nationally by the 1920s, until well into the 1930s, the industry relied primarily on imported cellulose. At the end of the 1930s, just over half of the 128,000 tons of cellulose used to make local paper was imported, but that share soon declined as paper production expanded rapidly so that imports were down to a quarter of cellulose needs in the next decade. Directly supported by the Vargas government, Klabin SA established a factory in 1934 that used its vast Paraná plantation of softwood araucaria trees to create long fibers for cellulose. The industrialization plan of President Kubitschek in the 1950s put great emphasis on creating a national paper industry. However, the use of softwood and the sulfite process, common in the Northern Hemisphere, limited Brazil’s potential The big change in cellulose production came when Brazil adopted use of sulfates to extract the pulp and shifted its source of woods to the new modified eucalyptus trees locally developed in Brazil. Already by the late 1960s, Brazil was self-sufficient in cellulose production, and eucalyptus wood was beginning to replace bagasse, straw, grasses, and even the pine of Paraná as the primary national source for cellulose (Hilgemberg and Bacha Reference Hilgemberg and Bacha2001; Toivanen and Lima-Toivanen Reference Toivanen and Lima-Toivanen2011).
It was also in this decade that Brazil adopted a modern forestry law that promoted tree plantations. The Forestry Code of 1965 became a major stimulus for forest replanting, aided by a 1966 tax code that permitted tax exemptions for investments in forest plantations. This led to the progressive decline in cutting native woods and the transition to forest plantations for cellulose production. Even sawmilled lumber for furniture and other uses became more dependent on plantations rather than native trees (Mendonça Reference Mendonça, Katz and Bercovich2003; Bacha Reference Bacha2008). This reforestation to replace the trees used for cellulose was accompanied by the progressive reorganization of the industry into ever fewer and larger units of production tied closely to the new tree farms. Initially only Klabin (with 22,000 hectares of replanted trees) and the Champion Paper Company (with 17,000 hectares) had integrated reforested plantations close to pulp and paper production. Plantations went from 500,000 hectares in 1965 to 4.5 million hectares by 1985, and reached 9 million hectares of all types of trees by 2019 (IBA 2021). Of these totals, a quarter were planted in American pine and three-fourths in eucalyptus, a species native to Oceania first planted in Brazil in the 1860s by the railroads, which used the hardwood for railroad ties (Campos and Foelkel Reference Campos and Foelkel2016). This enabled the industry to integrate tree plantations with pulp and paper mills everywhere after 1970, with major capital support from the Brazilian Development Bank (Campos and Foelkel Reference Campos and Foelkel2016; Belik Reference Belik1992). The 1970s and 1980s saw the construction of numerous modern mills in joint public-private enterprises (Juvenal and Mattos Reference Juvenal, Mattos and Kalache Filho2002). There was also a major push to produce modern technicians and scientists in this field and to carry out basic research on tree cloning and hybridization. In the 1960s, at the federal universities of Viçosa and Paraná, the first forestry schools were established, and in 1968 a major research institute, the Instituto de Pesquisas Forestais (IPEF), was created with the support of the Universidade de São Paulo and major companies to help develop both new tree varieties and new industrial methods to produce cellulose from short-fiber trees (Morator Reference Morator2008). Companies also invested heavily in research and development, and soon Brazil became a world leader in technology for short-fiber production (Figueiredo Reference Figueiredo2016).
Significant deforestation of Brazilian softwoods and the need to develop fast-growing trees adapted to local climate conditions led to major government and private research. Constant experimentation and adaptation by researchers led to the creation of new species of pine and eucalyptus trees adapted to tropical and semitropical climates. In the late 1970s, IPEF sent an expedition to Australia to collect seeds from extant varieties of eucalyptus and extensively modified original seeds and the subsequent trees (Pichelli Reference Pichelli2008). Brazilian eucalyptus adopted from the original Australian varieties reached a productivity of 39 cubic meters per hectare per year by 2019, the highest in the world, compared to Sweden at 6 cubic meters and Finland at 4 cubic meters. Even Chile had better results with eucalyptus trees, at 20 cubic meters per annum. Brazil also led the world in pine output, reaching 31 cubic meters per hectare; Chile was at 18 cubic meters and Sweden and Finland at just 4 cubic meters per hectare (BRADESCO 2019). This extraordinary productivity was due to both the adoption of new species by EMBRAPA, the Brazilian agricultural research center founded in the 1970s, and to climate (EMBRAPA 2014). By 2019, Brazilian eucalyptus trees could be cut in seven years and an average tree could be cut three times (Ramos et al. Reference Ramos, Serpa, dos Santos and Cardoso Farias2006), compared to twelve to fifteen years to make the first cut in the Iberian Peninsula. Even with pines Brazil could begin cutting in fifteen years, compared to twenty-five years in Chile and seventy to eighty in Sweden and Finland (BRADESCO 2019). This unusual productivity explains the comparative advantage of Brazil as a cellulose producer over other major world exporters (Rossato et al. Reference Rossato, Susaeta, Adams, Hidalgo, de Araujo and de Queiroz2018). In 2000–2002 it was estimated that Brazil’s actual production costs were US$157 per ton of cellulose, compared to an average cost for North American and Iberian producers of US$283 per ton. Labor of in Brazil was the cheapest among these five producers, but so, too, was the cost of the wood input, which was $63 per ton for Brazil compared to the others which averaged US$130 per ton. Even chemical input costs were the lowest in Brazil (Radicchi Reference Radicchi2004; Videira Reference Videira2004).
The best method for extracting pulp from these eucalyptus trees proved to be a chemical extraction using sulfate (in a process similar to the kraft process) that used larger amounts of caustic soda and a longer cook time for short-fiber hardwood (Montenegro Reference Montenegro2018). These technological and biotechnological advances using eucalyptus pulp and the sulfate system were combined with changes in the source of wood and power, and with new ecologically beneficial changes in the production process. Almost all pulp and paper produced in Brazil now comes from planted forests. There is a close integration of forest plantations and mills, with factories located close to their forest sources. The chemicals used in extracting the fiber and bleaching the pulp are recycled, the resulting black water is treated, and all waste products are used to produce energy for the plant. There has also been a major effort to control emissions and convert wastewater to useful products, as well as to generate electricity (Mieli Reference Mieli2007; Juliani Reference Juliani2015; Nunes Reference Nunes2007). But despite all the efforts to control negative effects of the milling process, there remain some environmental concerns. Obviously, native forests are more diverse than planted ones. Eucalyptus plantations are also considered among the least favorable to other flora and fauna. The trees lack broad leaves and tend to suppress ground vegetation. Their oil is insect repellant, and they are highly flammable. But most plantations leave about 20% of the area unplanted, and eucalyptus pay a key role in greenhouse gas reduction and are usually planted in areas that were deforested long before; thus, they also tend to revive depleted soils (Evans Reference Evans1992).
With government and private support, a massive tree plantation program began in this period following the Forest Code adopted in 1968. By 1990, Brazil had the third-largest area of planted trees in any tropical area in the world, behind China and India (Evans Reference Evans1992). Initially, there were more pine than eucalyptus plantations, but by 2000, of the 4.8 million hectares of planted forests, 62% were eucalyptus and 38% were pine. By 2013, eucalyptus trees accounted for three-quarters of the 8.3 million hectares of planted trees. By 2019, this reached 10 million hectares, with 7.2 million hectares planted in eucalyptus and 2 million in pine; other tree varieties were planted on 387,000 hectares (IBGE 2019). Almost all the pine plantations were located in the states of the southern region, while the eucalyptus trees were spread throughout the country (IBGE, Sidra, table 5930). These plantations of Eucalyptus grandis trees, the most common variety used, would run to 1,111 trees planted per hectare, with 9 square meters of growing space between trees. As for pine forests, the space norm for the Pinus caribaea variety was 6 square meters and 1,667 trees per hectare (Evans Reference Evans1992; McNabb and Wadouski Reference McNabb and Wadouski1999). By 2019 almost all the trees used to produce cellulose in Brazil came from tree plantations. Even when other forestry products were produced, from sawn lumber to chips, Brazil’s mills obtained 72% of their wood from forest plantations and only 18% from native trees in 2019 (IBGE, Sidra, table 6945).
Another important phase for the industry was the growth of a national chemical sector, which began in Brazil in the 1960s. This allowed producers to reduce costs by using national chemical inputs. Klabin introduced the first sulfate processing plant in 1958. Another major producer of cellulose in this period was Suzano Papel e Celulose, led by Leon Feffer, who established his first paper factory in 1939. His son Max Feffer led the introduction of eucalyptus wood to Brazil, and the company began using it to produce cellulose in 1958. Suzano was the first to heavily invest in short-fiber hardwood eucalyptus trees, using the sulfate process as the basic input for generating cellulose. By the end of this decade several other major producers had entered the market and the era of eucalyptus plantations began. While both sulfate-bleached and sulfate-unbleached chemical wood pulp was almost equally produced up to the early 1980s, in that decade most of the industry moved toward producing bleached sulfate pulp, which has since dominated the market. By the late 2010s sulfate-bleached cellulose accounted for 90% of output.Footnote 4
The 1990s were a period of crisis due to the end of tariff protection, the end of government funding, and low prices for global commodities. But the extraordinary Brazilian productivity due to new eucalyptus meant that producers could compete on the world market, and in 1999, prices again rose as Chinese demand increased. At the same time in Brazil, as in most other producing countries, there was a move toward ever greater industry concentration, given increasing costs of production and the relatively delayed returns on investment. Thus, of the 148 companies producing cellulose in 1980, there remained only 38 companies producing cellulose in 2008 (Montebello and Bacha Reference Montebello and Bacha2011).
Many of the smaller firms which went out of business were consolidated into larger units thanks to funding from the Brazilian Development Banks, which in the first two decades of the twenty-first century even more aggressively promoted mergers in the meatpacking and the paper and pulp industries. Factory construction was quite expensive and returns were slow due to the time it took trees to mature. To be competitive, a factory needed to produce at least 2 million tons of pulp per year. This required at a minimum some 150,000 hectares of planted trees, or 300,000 hectares if renewable programs were enacted (Horta Reference Horta2017). As late as 2015 there were numerous producers and little difference in output among the leaders (Table 3). Many smaller companies and groups had Chilean, Finnish, Japanese, North American, and Brazilian capital invested (Campos and Foelkel Reference Campos and Foelkel2016). But from the government’s perspective, this division among relative equals weakened the industry in terms of export potential, and in 2018–2019 the BNDES provided funding for Suzano to take over Fibria Celulose, the world’s largest eucalyptus pulp factory. Fibria had been created after the merger of plants owned by Votorantim, a major Brazilian industrial group, and the traditional Brazilian company Aracruz, in 2008. With this purchase, Suzano became the largest Brazilian paper and pulp company and one of the largest in the world. In May 2021, Suzano announced that it was constructing a new cellulose factory in Mato Grosso do Sul that would come online in early 2024, increasing the company’s capacity to 13.2 million tons of cellulose per annum (Reuters 2021).
Ranking of the major producers of cellulose in 2015.

Source: Hora and Melo (Reference Hora and Melo2016, 83, table 1).
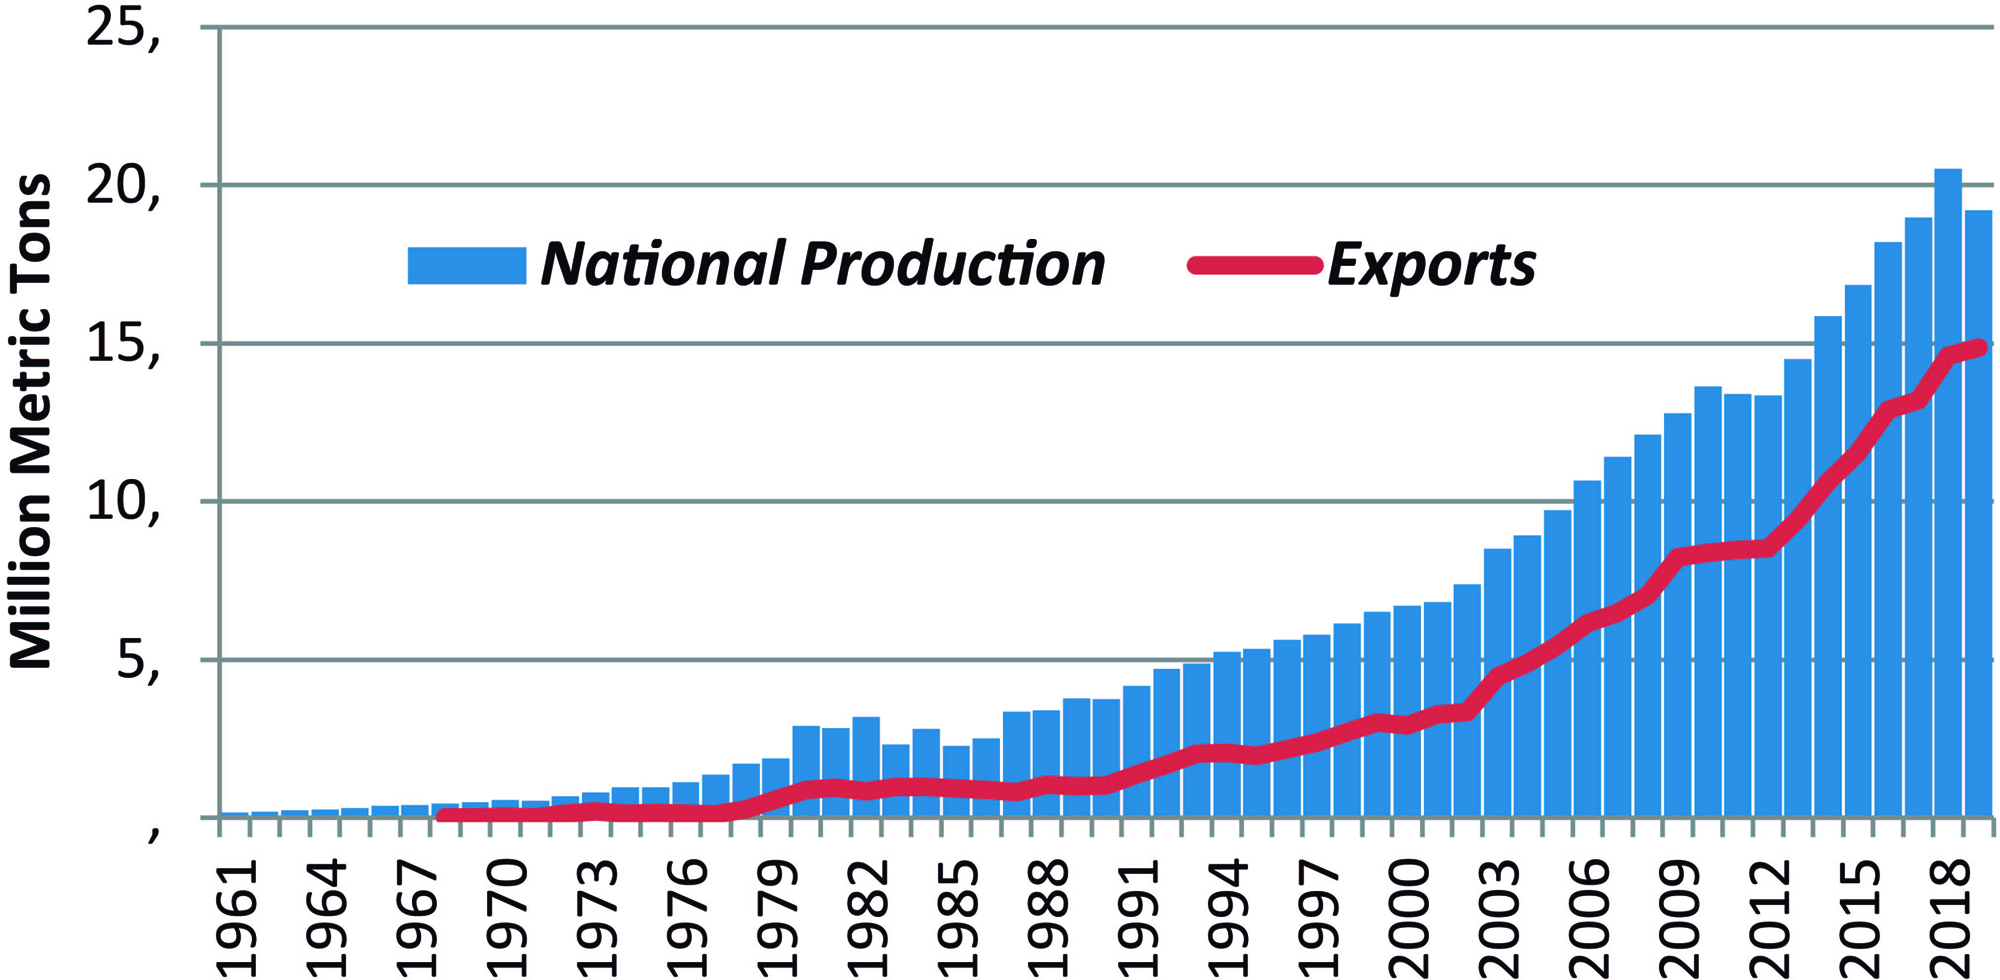
The evolution of Brazil’s production has been extraordinary—from 165,000 tons of chemical wood pulp in 1961 to 19 million tons by 2019. Whereas Brazil had begun to export its nationally produced cellulose only in 1968, by 2005 it exported half the cellulose that it produced and by 2019 was exporting 77% of national production (Figure 2). The value of these exports grew from around US$3 million in 1961 to US$7.2 billion by 2019 (FAOSTAT). By 2019 Brazil was the world’s leading exporter of chemical wood pulp, accounting for 25% of world exports, and ranked second in the world for production of chemical wood pulp and the bleached variety, accounting for 13% and 16% of global production, respectively (FAOSTAT). By the 2010s some 90% of national production was the bleached variety, and its primary markets were Europe and China.Footnote 5 In 2020 China consumed just under half of all such cellulose exports; the United States, 15%; Italy, 8%; and Holland, 6%—these four accounted for over three-quarters of Brazilian cellulose exports.Footnote 6 (MDIC 2021a). Although cellulose exports were a major income producer, they accounted for only 3% of national exports between 1997 and 2020. Nevertheless, cellulose exports brought in more than sugar or coffee, and about half of meat exports in 2020 (MDIC 2021b).
Volume of production and exports of chemical wood pulp exports from Brazil, 1961–2019. FAOSTAT, http://www.fao.org/faostat/en/#data/FO.
Cellulose was not the only forestry product from Brazil that entered the world market. Another major area of growth has been paper production; in 2019, Brazil was the tenth-largest world producer and the twelfth-largest exporter (behind Portugal and Korea), accounting for 3% of world exports that year (see Figure 3). While current national paper production is a tenth of world leader China’s 24.6 million tons, its paper exports in 2019 compare favorably: they were 29% of the 4.8 million tons of paper exports of Germany, the world’s leading exporter (FAOSTAT). Paper-producing companies in Brazil were smaller and less capitalized than cellulose factories and dedicated far more of their output to national consumption. There was continual concentration to fewer firms for papermaking as well, from 294 companies in 1975 to 211 in 2008. Although the paper industry is a major exporter, its sales initially went primarily to the local market, which as late as 2000 absorbed 80% of production. By 2019, the local market absorbed less than half of total output (Montebello and Bacha Reference Montebello and Bacha2011). Of all the three major South American forestry exporters, Brazil was the only significant exporter of printing and writing paper (FAOSTAT).
Volume of production and export of printing and writing paper, 1961–2019. FAOSTAT, http://www.fao.org/faostat/en/#data/FO.

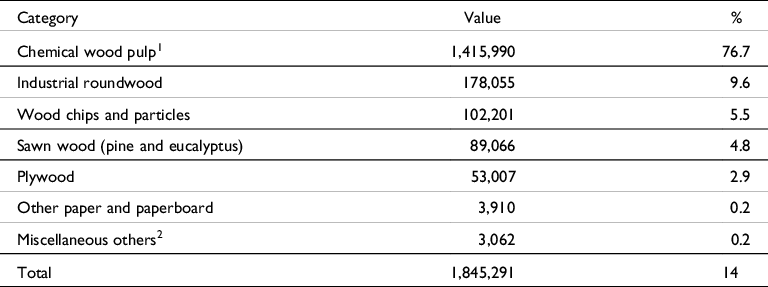
Brazil also produced another US$3 billion in wood byproducts as of 2019. The most significant were sawn woods, both pine and eucalyptus, and wood chips. It also exported significant amounts of plywood, cardboard, wrapping paper, and miscellaneous paper products (Table 4). In contrast to cellulose, only 41% of paper production went into exports and less to cardboard, while almost all tissue paper produced was absorbed in the home market (Table 5).
Value of major categories of forestry exports of Brazil in 2019, in US$1000.
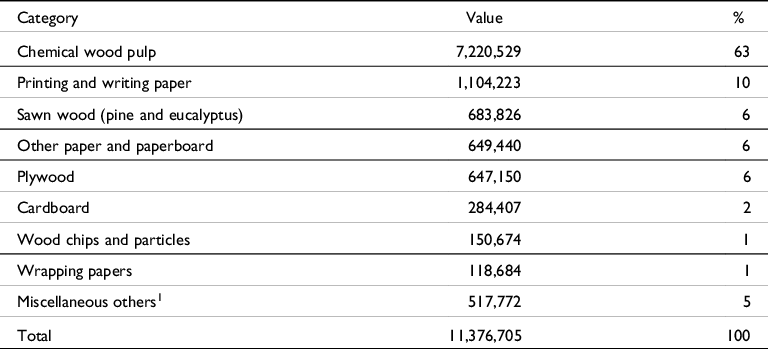
Source: FAOSTAT.
1 Consists of small amounts of various papers, cartons, and woods.
Ratio of exports to total production by type of paper product in 2019.

Source: Revista O Papel (December 2020): 49.
1 An important part is recycled paper.
Aside from cellulose and paper, 40% of the wood logs from 2010–2019 were used in other products (IBGE, Sidra, table 291). This noncellulose and nonpaper wood sector, which accounted for 29% of the total value of forestry products in 2019, includes the production of wood for shipbuilding, furniture making, civil engineering, pallet manufacturing, wood panels, laminate floors, and posts (IBGE 2019). Some of these woods went as unprocessed sawed lumber or log exports, which in 2019 earned US$1.5 billion compared to US$7.2 billion for processed pulp and US$2 billion for paper. Another US$1.3 billion was accounted for manufactured wood products.Footnote 7 Still other timber went for products that had little export value, since they were primarily destined to the local market, among the largest of which were the 6.3 million tons of charcoal that was produced in Brazil in 2019 (FAOSTAT).
Chile
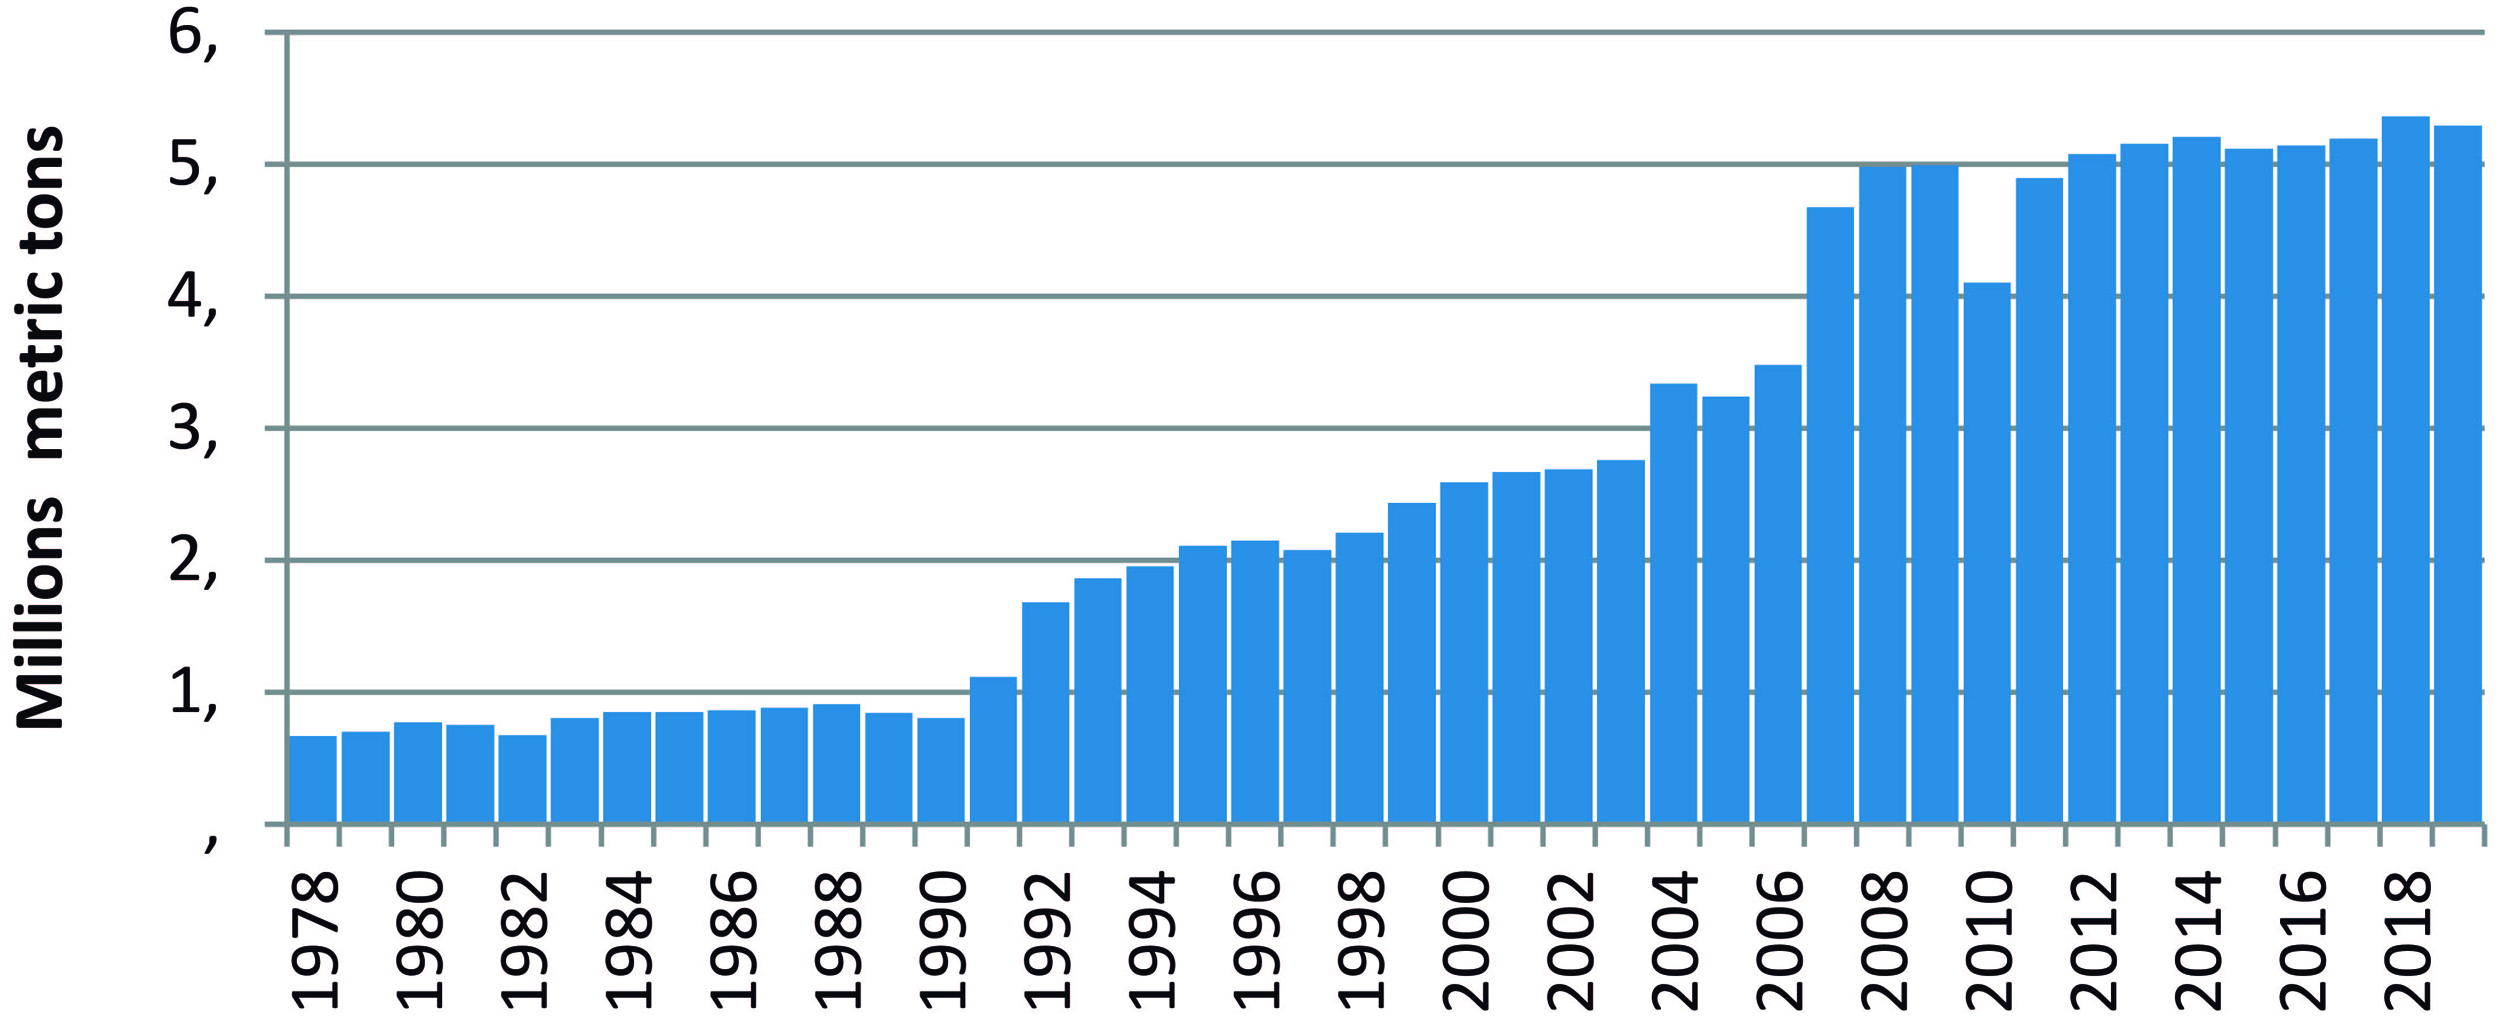
The evolution of the paper and pulp industries in Chile got a much later start than in Brazil. Chile is dependent on two major imported tree species for its cellulose production, pine (Pinus radiata) imported from California in the late nineteenth century and eucalyptus (primarily Eucalyptus globulus) (Clapp Reference Clapp1995). The development of tree plantations goes back to the first government forestry laws in 1931, expanded by subsequent laws in the 1960s and 1970s (Morales Reference Morales2003). The 1931 law led to a major conversion of poor farming land in the south to plantations of imported pines in the 1940s and 1950s. These planted pine and eucalyptus forests in the south and center of the country consistently expanded with government support. The Agrarian Reform of 1967 excluded tree plantations as the government continued to promote the industry. Government support of the forestry industry did not stop with Allende, although attempts were made to balance support with peasants’ demand for land. Nor did government policies change under the Pinochet regime. Although some expropriated lands were returned to their owners, the government continued to subsidize the industry and invest in its development and consolidation (Klubock 2014).
It was only in the second half of the twentieth century that both woods were successfully used commercially as a basis for producing pulp—and this after massive government and international agency support as credit, incentives, technical training, and even construction of the first mills. By the mid-1980s over 1 million hectares were planted, and by the 1990s, annually over 100,000 hectares of new trees were planted every year, reaching 2.3 million hectares in 2018 (INFOR 2020a). Most of the tree plantations are concentrated in Chile’s Region 8, a former wheat-producing zone with mostly degraded, low-value soils—the initial incentive for reforestation. Given the costs of transportation, it is no accident that 63% of the nearly 5 million tons of cellulose produced in the country by 2006 were in this region (Biobío), which accounted for 40% of planted forests (Luraschi Reference Luraschi2005). Of the estimated 2 million hectares in such forest plantations, 58% were pine and 36% eucalyptus (INFOR 2018). Some 1,600 to 2,500 trees per hectare is the norm for pine trees used in producing pulp. They are thinned once, and the 800–1,000 trees that remain are cut between 18 and 25 years after planting. Eucalyptus, used exclusively for pulp, are neither trimmed nor pruned and are harvested at fourteen or fifteen years (Salas et al. Reference Salas, Donoso, Rodrigo Vargas, Arriagada and Soto2016). They are treated differently than in Brazil, which has shorter growing seasons and cuts trees three times. Chile also has 13.4 million hectares of native woods, most of which are used for firewood and are not as well developed as the plantation trees (Donoso and Otero Reference Donoso and Otero2005).
Although Chile raised tariffs on imported papers and encouraged development of a local industry from the late nineteenth century, it imported most of its pulp and paper needs until well into the twentieth century. Thus, in the 1920s and 1930s, on the order of 80%–90% of paper and 50%–67% of pulp was imported (Herreros Vergara Reference Herreros Vergara1940). The first paper company was founded in 1920. It would initially satisfy local consumption. But supported with government funds, the Compañía Manufacturera de Papeles y Cartones SA (CMPC) became a giant multinational company and primarily a pulp and paper exporter by the end of the century (Lima-Toivanen Reference Lima-Toivanen, Lamberg, Ojala, Peltoniemi and Särkkä2012). Between forestry laws, the creation of forestry programs in national universities, and the promotion of new forestry industries, the Chilean government played a crucial role in industry development. Through its development corporation CORFO and its establishment of CONAF, the Corporación Nacional Forestal, in 1970, the state owned almost all wood-processing mills, including the large Arauco factory, and at one point 60% of the planted forests. Only CMPC was privately owned. But in the 1970s most of the state-owned factories were privatized (Katz, Stumpo, and Varela Reference Katz, Stumpo, Varela, Katz and Bercovich2003).
It was only in the 1960s that wood-based pulp was introduced, and then only cellulose made through mechanical processes of grinding. The use of chemicals to extract fibers began in the 1990s, first with pine and then eucalyptus. In contrast to Brazil, pine remained the dominant input for wood to produce pulp and still accounts for most of 2.3 million hectares in plantations (INFOR 2020). But in most recent years, eucalyptus have been increasingly used to produce chemical wood pulp (Figure 4).
Chemical wood pulp production from pine and eucalyptus trees in Chile, 1990–2019. INFOR, Chile, https://wef.infor.cl/industria/industria.php.

The first cellulose plant of CMPC was established in the mid-twentieth century in Region 8. The mills that followed were also developed with government capital. The biggest of the state-owned plants was the Arauco factory, built in 1972, and the Constitución plant, opened in 1975; both were eventually privatized in the following decades, with these two factories merging into one company, Arauco (also known as Celco or Celulosa Arauco y Constitución). This company and CMPC came to dominate cellulose production in Chile in the current era (Luraschi Reference Luraschi2005). But unlike Brazil and Uruguay, these companies continued to produce mechanical pulp along with the latest chemical processes. From 2013 to 2015, CMPC continued to produce mechanical-generated cellulose from some of its mills. Total output was 10% of all cellulose produced. Arauco only produced chemical pulp in its three mills. The five CMPC mills accounted for 49% of total Chilean pulp production, and the three Arauco mills for 51% of the total by 2015 (Pedraza Reference Pedraza2018; Lima-Toivanen Reference Lima-Toivanen, Lamberg, Ojala, Peltoniemi and Särkkä2012).
As in Brazil, cellulose production took off in Chile in the 1990s (Figure 5). Given the limited internal market, which was quickly satisfied and ended most imports, the major companies concentrated on exports of cellulose, which expanded rapidly. The success of this export drive was based on the same factors—higher productivity and lower costs—that drove growth in Brazil. It was estimated in 1990 that Chile produced softwood kraft pulp at US$473 per ton, compared to US$517 in the US South and US$708 in Finland (Herbert-Copley Reference Herbert-Copley1999). Chile also engaged in export of raw and semifinished wood products. In 2007 cellulose passed other forestry products in export value (Figure 6).
Cellulose production in Chile, 1978–2019. INFOR, Chile, https://wef.infor.cl/industria/industria.php.
Value of Chilean exports of forestry products by category, 2003–2019. Banco Central, https://si3.bcentral.cl/estadisticas/Principal1/Excel/SE/COMEX/excel.html.
As in Brazil, there was initially some production of sulfite unbleached paper, but this dropped to below 5% in the 1970s and disappeared by the late 1980s. Of the sulfate-processed pulp, unbleached and bleached were equally produced at the beginning, but by the late 1970s, chemically produced bleached pulp became dominant and by 2019 accounted for 90% of all chemically produced pulp (FAOSTAT). This bleached product came in two basic forms in Chile: BSKP and BEKP, which was the dominant product in Brazil. There was also some modest production of unbleached cellulose that used the pine’s long fibers (Luraschi Reference Luraschi2005).
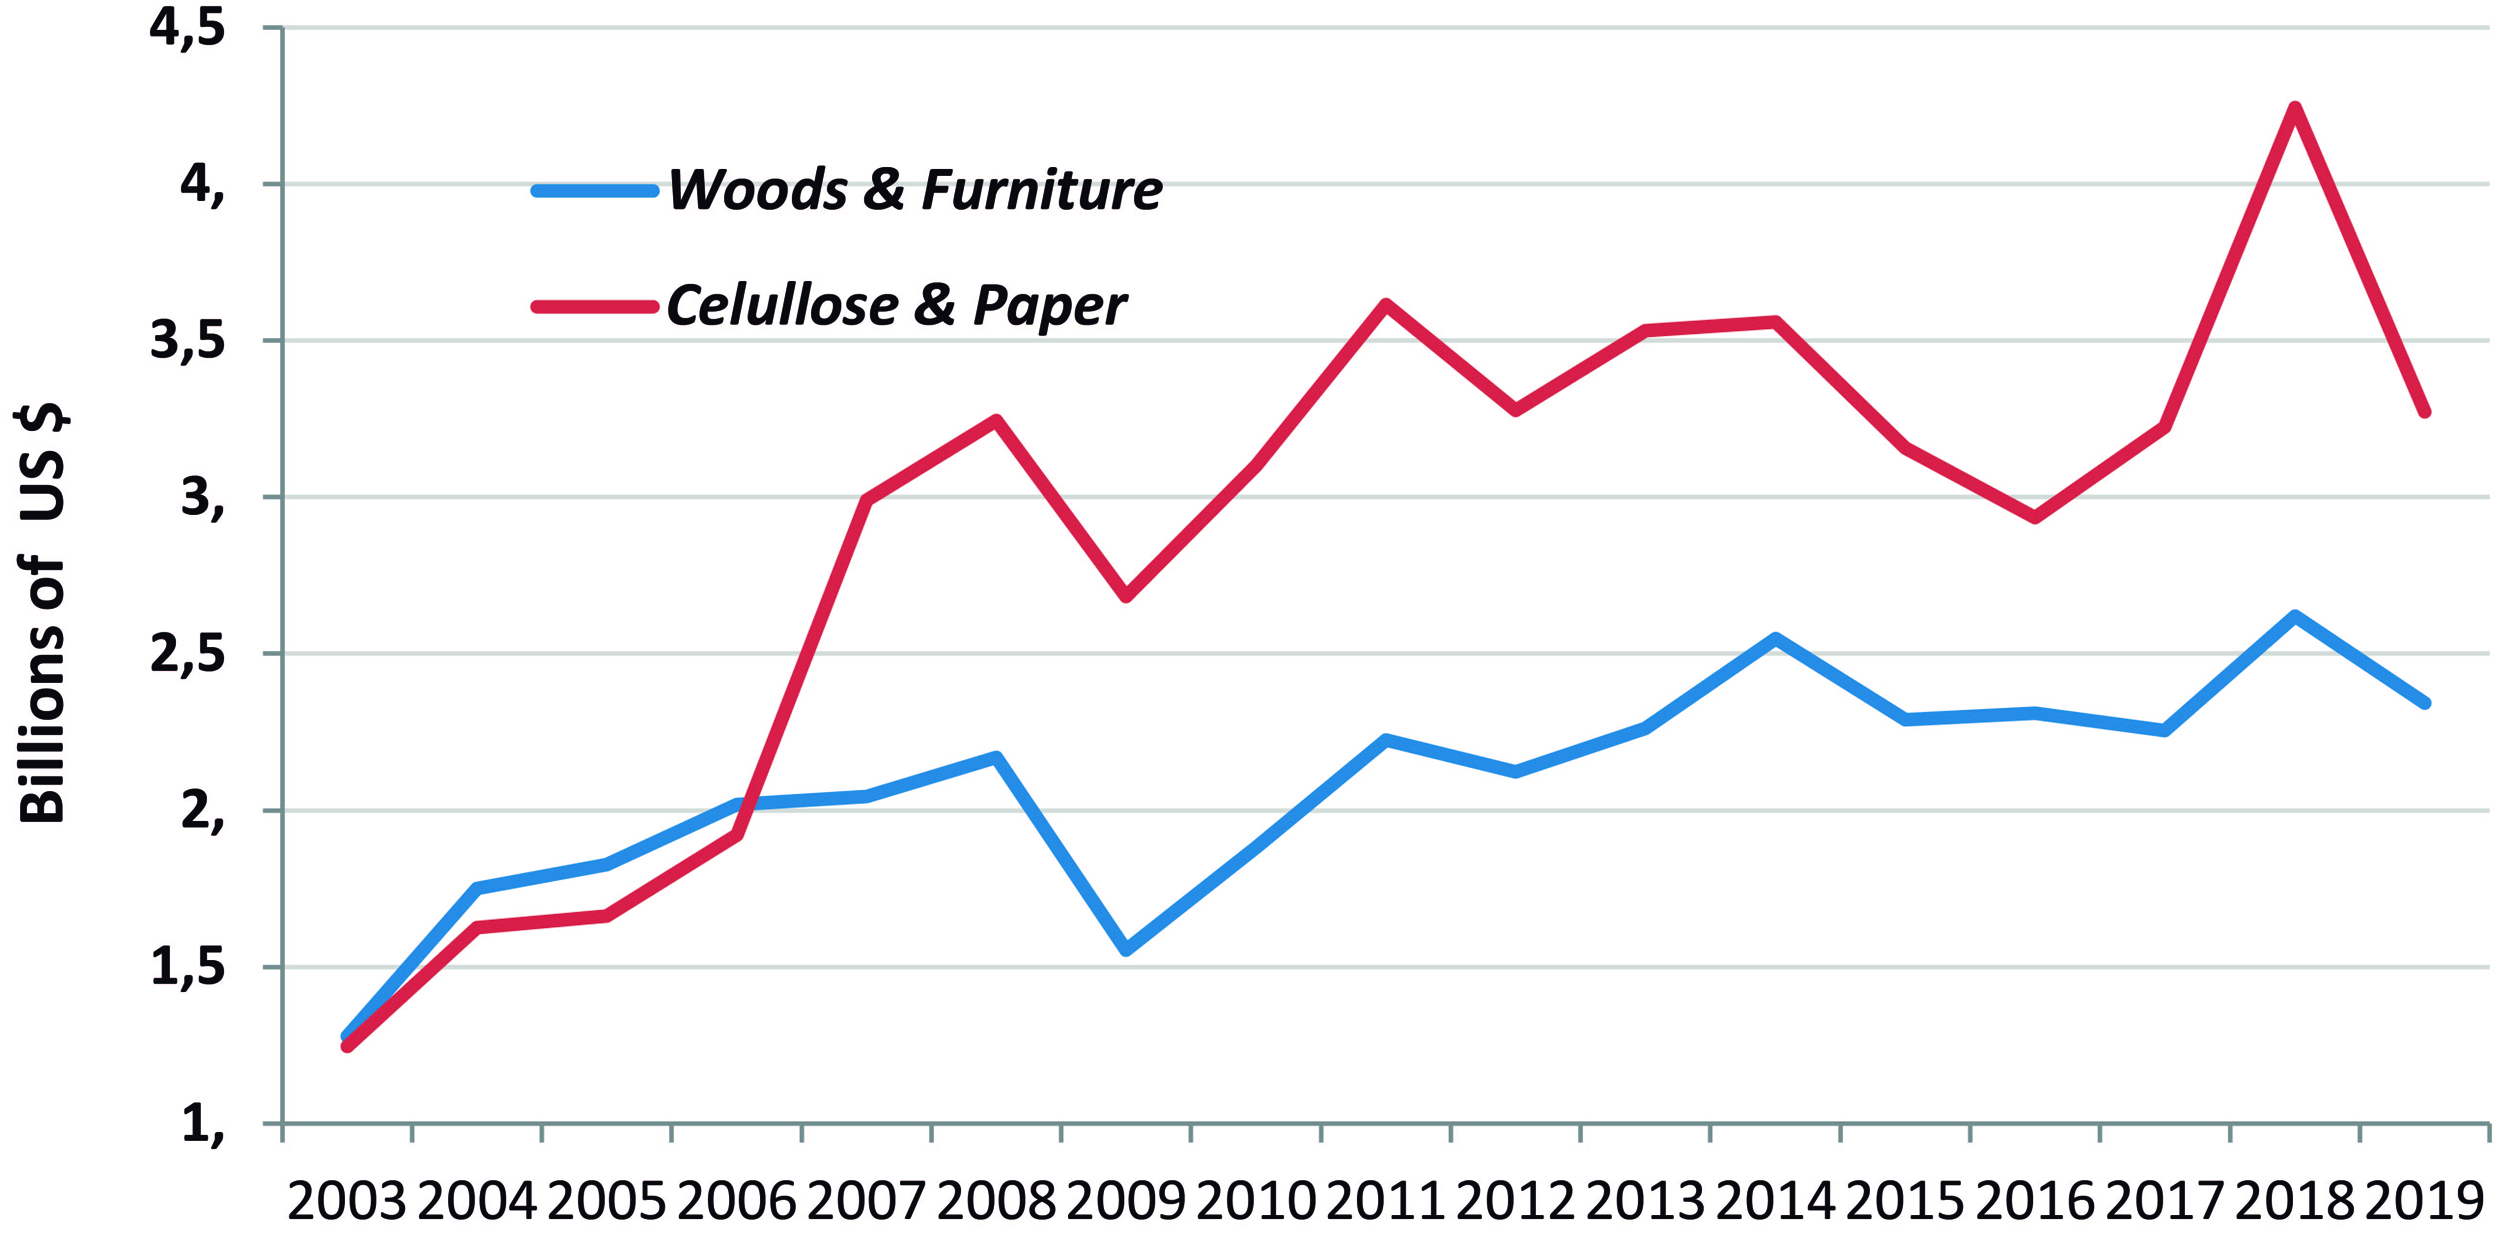
Forestry in Chile played a far more important role in exports of agricultural and forestry products in Brazil, where soybeans and grains dominated rural exports. In Chile the two sectors were balanced, growing at approximately the same rate from 1990 and accounting for approximately the same export value, despite the extraordinary growth of fruit orchards in this period (Figure 7). Although cellulose was the most important forestry export, other forestry exports accounted for more value in total forestry exports than in Brazil. Cellulose accounted for just over half the value of all such forestry exports in 2019 (Table 6). Unprocessed wood exports made up 24% of the total value of exports in that year, followed by nonprinting paper and cardboard and plywood. Of the total of 45.3 million cubic meters of woods cut in 2019, the biggest consumers were cellulose factories that absorbed 17 million cubic meters for making cellulose, 7.3 million cubic meters for firewood, 4.7 million cubic meters to sawmills, and 4.6 million cubic meters to make boards and veneers. Each of these categories exported part of their production so that almost a third, or some 14.2 million cubic meters, were exported (INFOR 2020b). There were 690 companies that exported wood or wood products, but the Arauco plant accounted for 41% of the value of all wood exports in 2019 and CMPC for 28% (INFOR 2020b).
Value of trade balance of forestry and agricultural exports of Chile, 1990–2019. ODEPA, https://apps.odepa.gob.cl/BalanzaParams.

Value of major categories of forestry exports of Chile in 2019, in US$1000.

Source: FAOSTAT.
1 Consists of small amounts of various papers, cartons, and woods.
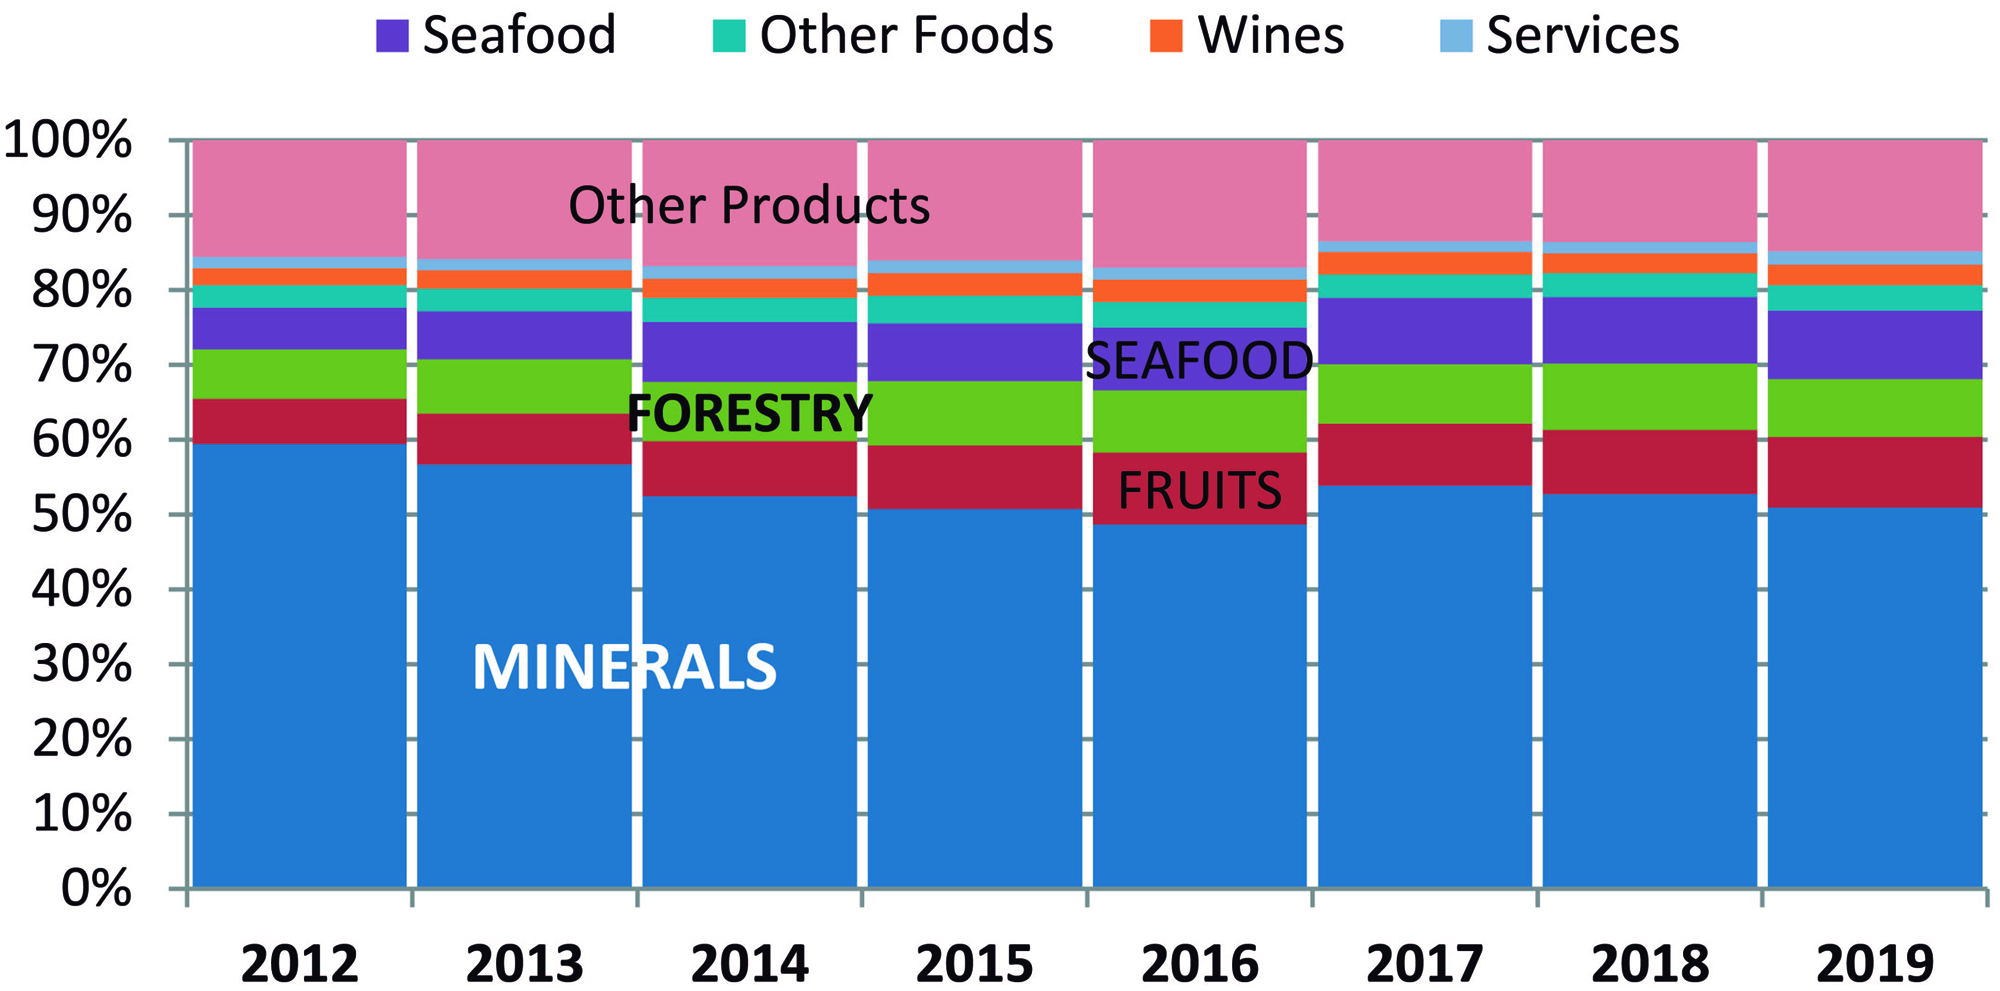
The value of forestry products was approximately equal in most years to the value of fruit and seafood exports (Figure 8). Wine and other agricultural exports together with fruit account for 16% of all Chilean exports, or double the forestry products.Footnote 8 The biggest consumer of Chilean pulp and wood products was China, which passed the United States as Chile’s principal consumer in 2008, and by 2018 was taking 30% of all wood products (INFOR 2018). As for cellulose, China was already consuming almost half of Chilean output by 2015, and this held through 2017 (Pedraza Reference Pedraza2018; NFOR 2018).
Share of principal products in Chilean exports, 2012–2019. https://www.aduana.cl/exportacion-por-productos/aduana/2020-04-02/091449.html.
Uruguay
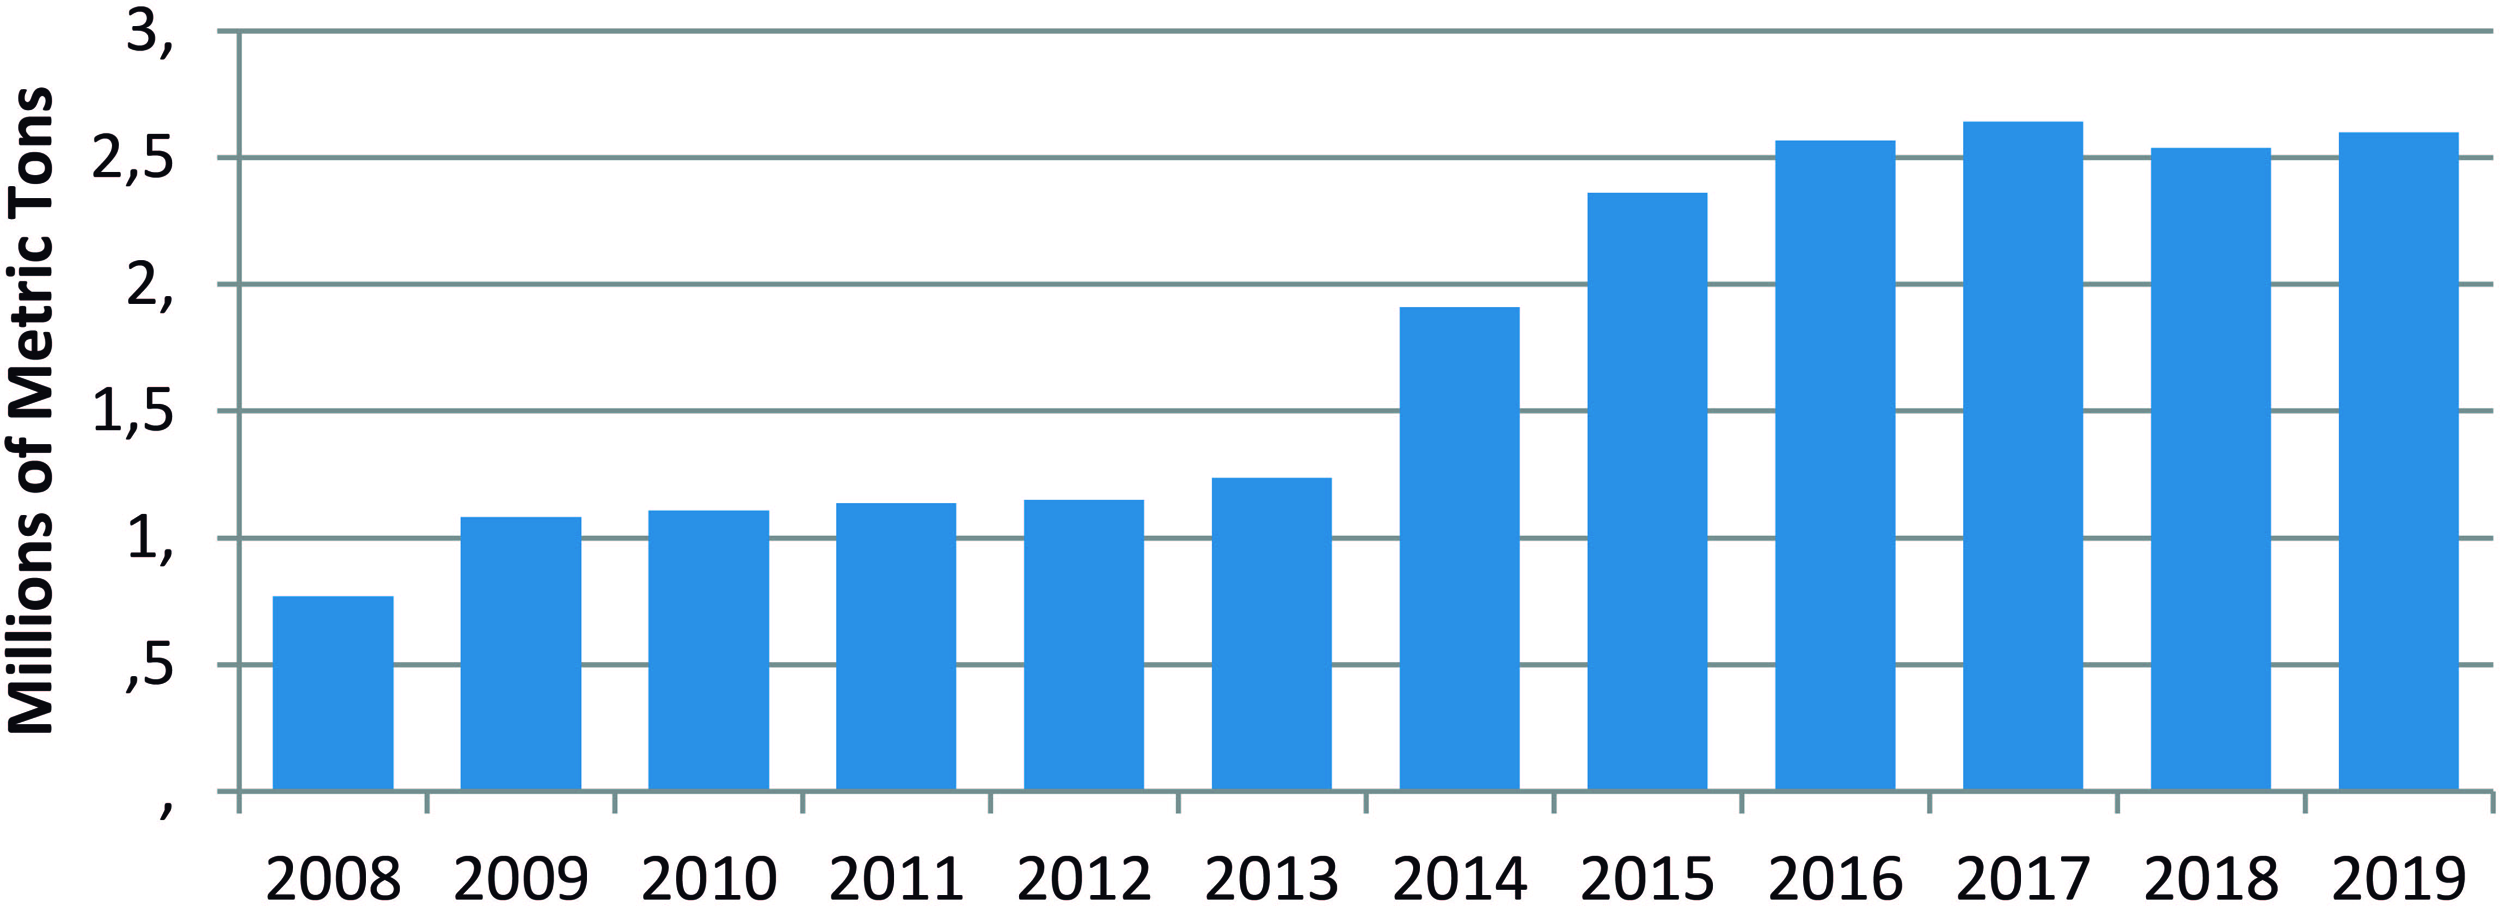
The cellulose industry in Uruguay began with government support in forestry laws to reforest the country. Even before the creation of the first cellulose mills, investors had been developing pine and eucalyptus plantations in Uruguay for decades, but especially after the forestry law of 1987, which provided support for a potential forestry industry. Two years after the forestry law, the government established the Instituto Nacional de Investigación Agropecuaria (INIA), which devoted resources to forestry studies. Among its activities was the adaptation of various eucalyptus to the local environment and preparation of soils for reforestation (Pissón Reference Pissón2018). These actions led to rapid growth of planted forests, and by 2005, Uruguay had 750,000 hectares planted (Gautreau Reference Gautreau2008). The government promoted the development of plantations of both pines and various species of eucalyptus trees that were introduced into Uruguay in the mid-nineteenth century. Planting proceeded at a rapid pace, and by 2019, Uruguay had 1 million hectares in planted pines and eucalyptus; of these, some 80% were eucalyptus, 18% pine, and 2% other species (SPF 2020). Almost two-thirds of the eucalyptus were planted in the northern provinces, half the pine plantations were in the center and southeast, another third of the pines were concentrated in the western coastal zone, and the rest were distributed in other areas. A government survey estimated that nearly 67% of the planted forests contained various types of eucalyptus and less than 33% had pine. Moreover, the hardwood eucalyptus trees that were used for 100% of the chips and woods for pulp making in 2019. Of the 42.2 million cubic meters of wood from all trees in 2019, 75% went to sawlogs, panels, and veneers, and only 25% to produce pulp (MGAP 2020a). All the woods processed were turned into kraft-bleached sulfate-produced cellulose (FAOSTAT).
Uruguay was the last of the major South American exporting states to become a significant forestry product exporter, and its history is different from the two other major South American producers in terms of the ownership of the milling industry and its role in the national economy. Unlike Brazil and Chile, the wood prepared for cellulose factories by national sawmills is shipped to factories in a free trade zone outside normal national boundaries. The only two major pulp mills processing Uruguayan woods are in tax-free zones, are completely foreign owned, and pay no taxes to the national government. Thus, national tree producers export most output of cut wood to free zones to be processed into cellulose (Tommasino and Annunziatto Reference Tommasino and Annunziatto2014; Resquin Pérez Reference Resquin Pérez2019). Of course the mills have also invested in national forests in preparation for their own development and these too were tax exempt (UPM 2015).
Despite the growth of local production, it was not until 2002 that the value of exported forestry products surpassed the value of their import, although by the end of the 2010s Uruguay had achieved a significant surplus in forestry products. Since it was a very late starter, Uruguay’s pulp and paper mills primarily concentrated on producing only chemically sulfate-bleached wood pulp when it entered the international market in 2008 (MGAP 2020b). This of course was long after Brazil and Chile had become major producers and exporters. Also, unlike the two other countries, the Uruguayan industry was completely foreign owned (MEF 2020). It also started as a concentrated industry with just two giant mills, in contrast to Brazil and Chile, which started with government-owned or government-supported smaller mills that were eventually concentrated into large private holdings late in the process.
The first mill, which opened in 2007, was the UPM Fray Bentos mill, jointly owned by two Finnish companies, UPM-Kymmene and Metsä, which began operations in the Colonia free trade zone. The second, a joint project of the Swedish-Finish company Stora Enso and Chile’s Arauco, was the Montes de Plata plant in the northwest department of Río Negro (also a free trade zone) on the Río de la Plata, which began operations in 2009.Footnote 9 The two companies by 2011 had some 504,000 hectares of forests, making them the largest private owners of forested lands in the country (Gautreau Reference Gautreau2014). Once production started, the two factories quickly generated an impressive amount of pulp and paper. In 2008 they exported 769,000 tons of cellulose, by the next year over 1 million tons, and 2.3 million tons by 2015, when the mills reached full capacity. This has since maintained a steady export of between 2.5 million and 2.6 million tons per annum. But this will increase substantially when a second UPM factory at Fray Bento capable of producing 2.1 million tons of pulp annually goes into production in 2023 (Presidencia 2020). In a report prepared for the government, it was estimated that the value chain of the original UPM factory involved several hundred national companies; from research firms improving trees, to companies hired to plant, maintain and harvest the trees, and the trucking companies that made 315 trips per day bringing in logs and chips to be converted to pulp (Presidencia (2017). It was estimated that the two mills in 2016 generated 25,000 jobs and an aggregated value of US$1.8 million, 3.6% of gross domestic product that year. It was the second exporter in the country, exceeded only by the meat industry (SPF 2017).
In 2018 the value of paper and pulp reached US$1.6 billion, slightly ahead of meat exports, accounting for 18% of the value of all Uruguayan exports that year (Figure 9) (Uruguay XXI 2018). Although cellulose declined to US$1.5 billion in 2019 and meat modestly surpassed cellulose, the third-ranking export, soybeans, reached US$998 million in exports (Uruguay XXI 2020a). Of all wood exports, cellulose made up 78% of the total value of all forest products in 2019, the highest among any of the three exporting South American countries. Some 64% of woods produced by the national sawmills went to produce cellulose in this same year (MGAP DGF 2020). Other wood products were of limited importance (Table 7). China and Europe were the primary recipients of US$1.6 billion in cellulose pulp in 2018. With its purchases of meat, soybeans, and cellulose, China became Uruguay’s leading commercial partner by the 2010s, accounted for a quarter of the value of all exports in 2018, and consumed 35% of its cellulose production (Banco Central 2018; Fuletti and Petraglia Reference Fuletti and Petraglia2018; FAOSTAT). The value of these exports went from some US$500 million the first year to US$1.4 billion in 2019 (Uruguay XXI 2020b).
Volume of Uruguayan exports of chemical wood pulp from the free trade zones, 2008–2019. FAOSTAT; MGAP, DGF, Estadísticas forestales (2020, 25, 31).
Value of major categories of forestry exports of Uruguay in 2019, in US$1000.
Source: FAOSTAT.
1 Free Zone exports exclusively.
2 Consists of small amounts of various papers, cartons and woods.
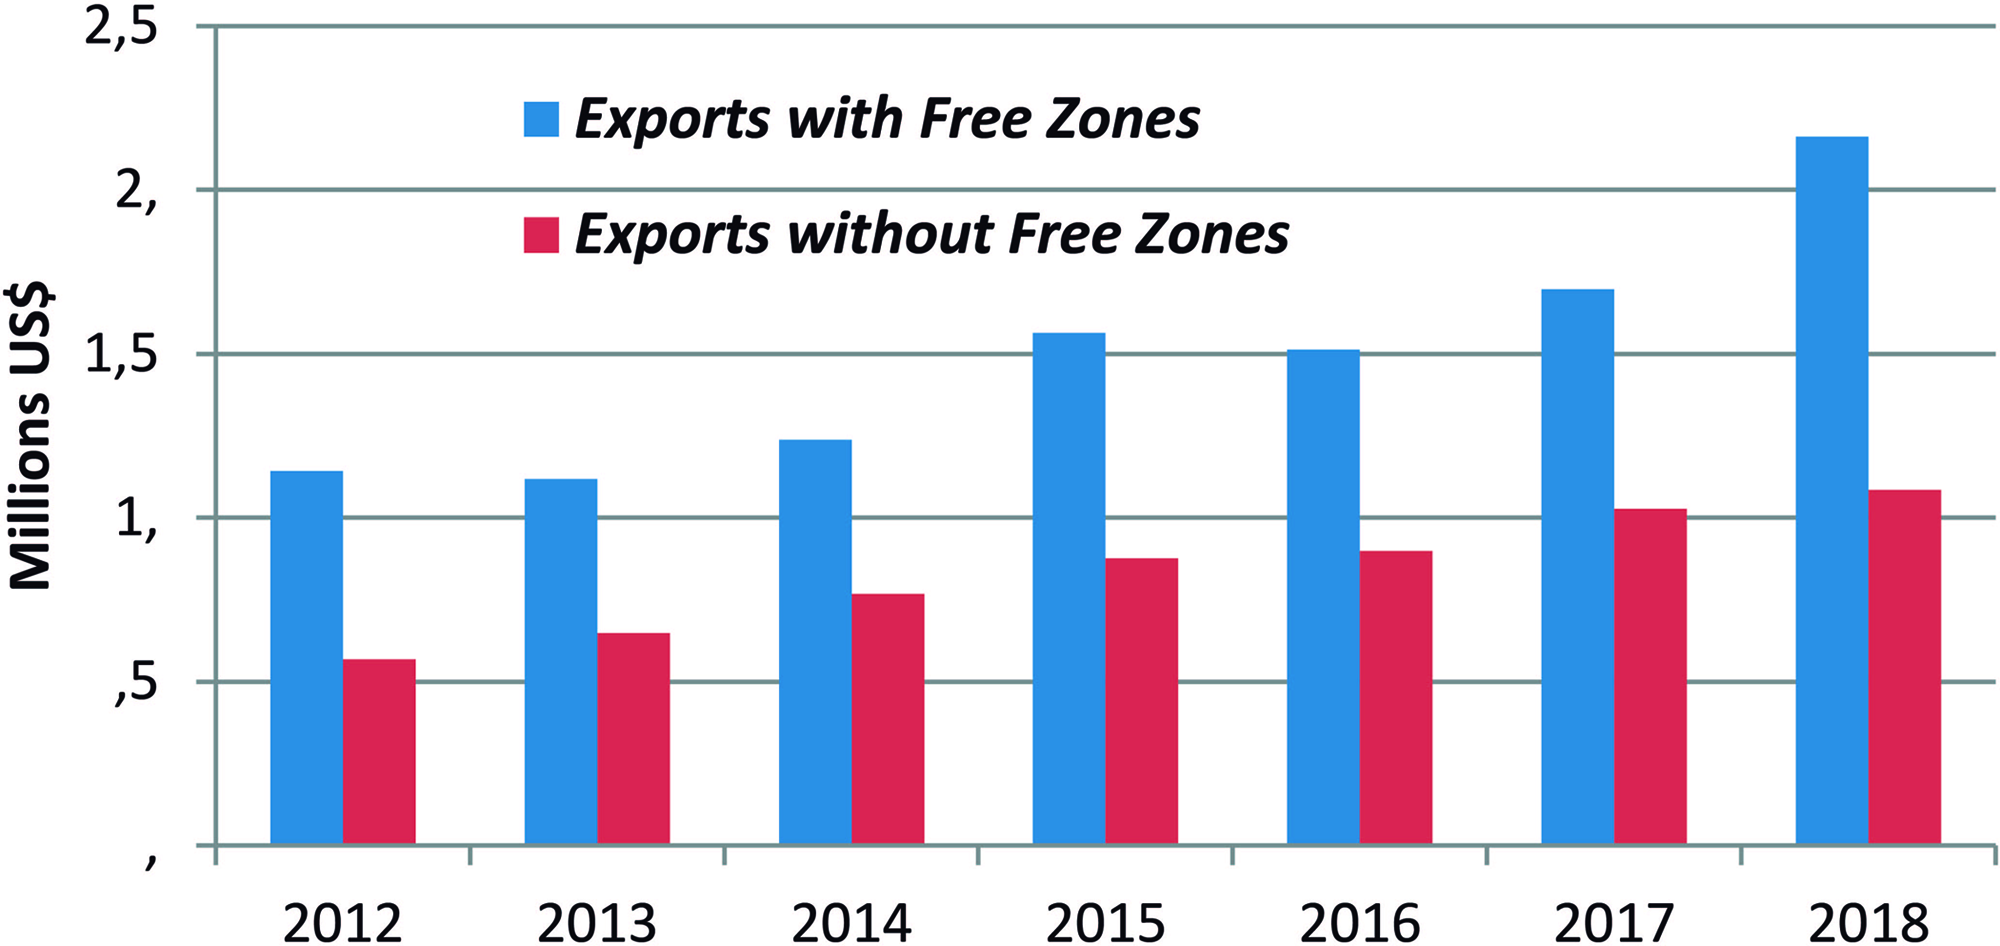
When including output of the free zones, the total value of forestry products doubles in the period 2012–2018. The combined national and free zone forestry exports reached US$2.1 billion in 2018 (Figure 10). Of this total, some 77% was accounted for by cellulose or wood pulp, all of which was produced in the free zone; no other wood export accounted for more than 8% (MGAP 2019). Outside of the two free zone mills, Uruguay produces no cellulose (MGAP DGF 2020).
Value of forestry exports with and without the free zone production, 2012–2018. MGAP, DGF, Estadísticas forestales (2020, 29, 37).
As with the exports of Brazil and Chile, China absorbed most of Uruguayan cellulose exports as well. In 2019 China accounted for 35% of the value of these exports, followed by the Netherlands, with 28%, and Italy, with 21%. Europe absorbed most of the unprocessed woods exports, accounting for 49% of all processed and unprocessed wood exports, while Asia, meaning primarily China, absorbed 42% of this total (MGAP DGF 2020).
Conclusion
The growth of a modern cellulose producing industry in Brazil, Chile, and Uruguay is a classic case of government-sponsored industrialization. It was the government in each case that saw the potential for this industry and provided the funds to construct the mills, offered incentives, or promoted forest plantations and subsidized research to adopt tree varieties to local soils. They all entered the international market for cellulose late in the development of the industry and were thus able to adopt the latest in sulfate chemical bleached paper production, in the highest demand. In Brazil and to a lesser extent in Chile there were early attempts to develop a national pulp and paper industry using many early methods, from rags to machine-produced pulp. This is probably similar to many other developing countries. But they developed a more modern chemical industry with significant government support. Forestry laws supported reforestation, then government research proved important as well. This was followed by domestic investments, at least in Chile and Brazil, and finally foreign direct investment. Forest plantations were established, but most especially in poorer regions or those with unproductive soils. New tree types were imported, and in Brazil, they were modified by private and public research to fit a tropical climate. Everywhere cellulose mills developed their own tree plantations (Lima-Toivanen Reference Lima-Toivanen, Lamberg, Ojala, Peltoniemi and Särkkä2012). The result was that when the modern mills were established in the 1980s and 1990s, there already existed abundant and sustainable wood resources to make pulp. This may explain the very rapid increase in exports from all three countries once the mills were constructed. It should also be stressed that these changes in forestry industries were parallel to changes in other agricultural activities. In the same period, for example, Brazil emerged as the world’s largest producer of soybeans, sugar, and a host of other agricultural products, and became the world’s leading meat exporter (Klein and Luna Reference Klein and Luna2018). Chile became an international exporter of fruits, wine, and farmed fish, and Uruguay also became a major exporter of soybeans and meat. Thus, the supply chains, market skills, and adoption of farming technology developed alongside the paper and pulp industries.
In terms of differences, Brazil and Chile developed large national companies to process the wood, whereas Uruguay created its industry exclusively with foreign capital. The paper and pulp industries were completely integrated into their respective economies in Brazil and Chile but isolated from Uruguay’s national economy. In Uruguay, the mills are all located in free trade zones—unusual because in most free trade zones, the primary work is in assembly of products imported from other countries, not original manufacturing for global export.
There were also differences in other forestry exports. Brazil developed an internationally competitive paper-producing industry that exported to the international market, as did Chile, along with Chile’s significant furniture and wood exports. In Uruguay, logs and chips—raw materials—were the only wood exports aside from cellulose. Finally it is worth stressing that this modern forestry industry was part of a general modernization of agriculture throughout the continent. All three countries experienced rapid growth in agriculture that enabled them to successfully compete in world markets.


 Open access