


Introduction
Inequalities in health, living standards, and opportunity are well-documented, and are common knowledge among citizens (Chancel, Piketty, Saez, & Zucman, Reference Chancel, Piketty, Saez and Zucman2021; Stone, Trisi, Sherman, & Beltran, Reference Stone, Trisi, Sherman and Beltran2020; Xu & Joyce, Reference Xu and Joyce2019). Unequal experiences of disadvantage tend to aggregate within individuals, such that multiple, different health and social problems are disproportionately experienced by the same small segment of citizens (Andersen, Richmond-Rakerd, Moffitt, & Caspi, Reference Andersen, Richmond-Rakerd, Moffitt and Caspi2021; Caspi et al., Reference Caspi, Houts, Belsky, Harrington, Hogan, Ramrakha and Moffitt2017; Richmond-Rakerd et al., Reference Richmond-Rakerd, D'Souza, Andersen, Hogan, Houts, Poulton and Moffitt2020). Here we evaluate the implications of multiple health and social disadvantages for population lifespan, by testing whether this population segment is at elevated risk for ‘deaths of despair’ (Case & Deaton, Reference Case and Deaton2015, Reference Case and Deaton2022; Stein, Gennuso, Ugboaja, & Remington, Reference Stein, Gennuso, Ugboaja and Remington2017).
Deaths of despair (deaths from suicides, drug and alcohol poisonings, and chronic liver diseases and cirrhosis) were first identified in the U.S. in the late 1990s among middle-aged, non-Hispanic white men and women without a four-year college degree (Case & Deaton, Reference Case and Deaton2015). Increases in these deaths have since been observed among other racial/ethnic groups (National Academies of Sciences, Engineering, & Medicine, 2021; Shiels et al., Reference Shiels, Chernyavskiy, Anderson, Best, Haozous, Hartge and de Gonzalez2017, Reference Shiels, Tatalovich, Chen, Haozous, Hartge, Napoles and Freedman2020) and younger working-age adults (25–44 years [National Academies of Sciences, Engineering, & Medicine, 2021]). It has been hypothesized that the steep rise in deaths of despair is largely confined to the U.S. due to three factors that differentiate it from other industrialized countries and underlie increasing inequality in economic opportunity and health: its weaker social-safety net and limited provision of communal supports across the lifespan; costly privatized healthcare system, with healthcare costs borne by employers (and by individuals, among those who are unemployed); and failure to implement strong pharmaceutical regulations (Case & Deaton, Reference Case and Deaton2020a, Reference Case and Deaton2020b; Haan, Hammerschmid, & Schmieder, Reference Haan, Hammerschmid and Schmieder2019; Sterling & Platt, Reference Sterling and Platt2022). However, support for this hypothesis–and associated policies to reduce premature mortality–requires information about deaths of despair in industrialized countries that differ in these contextual factors (King, Scheiring, & Nosrati, Reference King, Scheiring and Nosrati2022). Further, even if deaths from suicide, drugs, and alcohol are not rising at the same rate in other industrialized nations, they may cluster among individuals who disproportionately experience other health and social disadvantages, and come into contact with public services at a high rate. This hypothesis is supported by work in New Zealand and Denmark linking membership in this multiply-disadvantaged population segment to factors associated with deaths of despair, including low education and low wellbeing (Richmond-Rakerd et al., Reference Richmond-Rakerd, D'Souza, Andersen, Hogan, Houts, Poulton and Moffitt2020). If deaths of despair cluster in this population segment in countries with robust social-safety nets, nationwide healthcare, and highly-regulated pharmaceutical systems, this would suggest that disadvantage is a driver of deaths of despair, and these deaths are a marker of health and social inequalities even in countries with institutional contexts that may help to reduce premature mortality. It would also provide a window into the extent of disadvantage and distress experienced by the segment that goes beyond what is indexed by measures of health- and social-service involvement.
To test this hypothesis, we leveraged nationwide administrative data on 4.1-million working-age citizens from New Zealand and Denmark. In both nations we measured the concentration and accumulation of health and social disadvantages. We analyzed the distributions of citizens’ contacts with public sectors that signal health and social problems: public-hospital stays for physical- and mental-health difficulties, social-welfare benefit-use, and criminal convictions. We then integrated this information with information about cause-of-death to test the hypothesis that the concentration and accumulation of health and social disadvantage forecasts deaths from suicide, drugs, and alcohol: that adults who encounter multiple, different health and social services at a high rate (who account for a disproportionate share of service-use events) are at elevated risk for deaths of despair. To determine the breadth of premature-mortality risks within this ‘high-use’ population segment, we also tested whether the concentration and accumulation of health and social disadvantage forecasts deaths from other causes. There exists overlap between health disadvantage and premature mortality. However, we modeled health disadvantage as a predictor of deaths of despair and deaths from other causes (rather than a correlated outcome), as (a) poor physical and mental health precede early death (Richmond-Rakerd et al., Reference Richmond-Rakerd, D'Souza, Andersen, Hogan, Houts, Poulton and Moffitt2021; Plana-Ripoll et al., Reference Plana-Ripoll, Pedersen, Agerbo, Holtz, Erlangsen and Laursen2019), and (b) this temporal precedence was reflected in our measurement approach (see Methods).
Methods
New Zealand study population
Our New Zealand study population was drawn from the NZ Integrated Data Infrastructure (NZIDI), a collection of de-identified, individually-linked, whole-of-population administrative-data sources (Milne et al., Reference Milne, Atkinson, Blakely, Day, Douwes, Gibb and Teng2019; Statistics New Zealand, 2022). We included the 1 555 902 individuals who (a) resided in NZ in the July 2015–June 2016 fiscal year, (b) were 25–64 years old in that year, (c) resided in NZ for any time in the prior nine years (July 2006–June 2015), and (d) were born in NZ. Online Supplementary Figure S1A shows the study-population selection process. We measured the population's mortality in the July 2015–June 2016 year as a function of their public-service use in the prior nine years. We selected the 25–64-year age range to maximize representation of post-education, pre-retirement lives, including the 45–54-year-old midlife period in which deaths of despair were first identified (Case & Deaton, Reference Case and Deaton2015). Reliable electronic data capture was present for all administrative sectors of interest starting in July 2006. For consistency with prior research (National Academies of Sciences, Engineering, & Medicine, 2021; Shiels et al., Reference Shiels, Chernyavskiy, Anderson, Best, Haozous, Hartge and de Gonzalez2017, Reference Shiels, Tatalovich, Chen, Haozous, Hartge, Napoles and Freedman2020; Woolf & Schoomaker, Reference Woolf and Schoomaker2019), and because some work has identified variation in death-of-despair trends by age and sex (National Academies of Sciences, Engineering, & Medicine, 2021; Shiels et al., Reference Shiels, Chernyavskiy, Anderson, Best, Haozous, Hartge and de Gonzalez2017; Woolf & Schoomaker, Reference Woolf and Schoomaker2019), we analyzed the study population by age and sex (men and women aged 25–44 and 45–64 years). Ethical approval was obtained from the University of Auckland Human Participants Ethics Committee (ref. 023995). Output data underwent confidentiality review by Statistics New Zealand-Tatauranga Aotearoa.
Danish study population
The Danish study population covered the same age-population and observation period, following the Danish fiscal years. We included the 2 541 758 individuals who resided in Denmark in the January 2016–December 2016 fiscal year, were 25–64 years old in that year, resided in Denmark for any time in the prior nine years (January 2007–December 2015), and were born in Denmark (online Supplementary Figure S1B). Because this study's data come from de-identified registers that Statistics Denmark makes available for research purposes for approved institutions, IRB approval was not required.
Health and social disadvantages
We collected information about contacts with public-service sectors that signal health and social disadvantage. In the NZIDI, information about weeks spent on social-welfare benefits was recorded by the NZ Ministry of Social Development; information about bed-nights spent in public hospitals for physical- and mental-health problems was recorded by the NZ Ministry of Health; and information about criminal convictions was recorded by the NZ Ministry of Justice. In the Danish registers, information about social welfare was recorded by local governments and collected by the Labor Market Board; information about public hospitalizations was recorded by hospitals and collected by the Danish Health Board; and information about crime was recorded by Statistics Denmark (using information from the Criminal Justice System).
Deaths
In the NZIDI and Danish registers, information about mortality was obtained from records maintained by the NZ Ministry of Health and Statistics Denmark, respectively. We ascertained deaths of despair using primary cause-of-death codes (ICD-10 codes X60-X84 and Y87.0 (suicide); X40-X45, Y10-Y15, Y45, Y47, and Y49 (poisonings); and K70 and K73-K74 (alcoholic liver diseases and cirrhosis) (Case & Deaton, Reference Case and Deaton2015)). We also ascertained deaths from all other causes.
Covariates
We included three covariates in sensitivity analyses. Age was a continuous variable indicating individuals’ age in the final year of the 10-year observation period. Marital status was a categorical variable indicated whether individuals were married or in a civil union, ascertained from census data (NZ) and Central Population Register data (Denmark). Education level was a categorical variable indicating whether individuals had left secondary school without qualifications, ascertained from census data (NZ); or whether they had had received less than 12 years of education, ascertained from education records (Denmark).
Statistical analysis
To measure the concentration of disadvantage, we calculated Gini coefficients of inequality (Cohen, Reference Cohenn.d.; Gini, Reference Gini1912) based on the cumulative distributions of events in each sector (social welfare, public hospitalizations, and crime), for each age-and-sex group. We then operationally defined a high-use group in each sector as 5% of each age-and-sex group who accounted for a disproportionate share of use-events (Andersen et al., Reference Andersen, Richmond-Rakerd, Moffitt and Caspi2021). This cut-point was based on the sector with the lowest prevalence of involvement across age-and-sex groups (crime) and applied in all sectors to allow comparisons across sectors. In addition to sector-specific indicators of high-use group membership, we constructed measures of accumulation, in which we added up (0–3) the number of high-use groups to which each individual belonged; and recency, in which we calculated–for individuals who had been in the high-use group in a sector–the number of years since they had last had contact with the sector (1–9, across the nine years for which we measured public-service use, prior to the year in which we measured deaths). We assessed recency just for hospitalizations and crime; we could not construct a recency measure for social welfare due to limited variation. We used multinomial logistic regression with robust standard errors to predict deaths due to (a) despair and (b) other causes from measures of high-use group membership, accumulation, and recency, within each age-and-sex group. We tested for age- and sex-differences in coefficients using models of the full population which included age-and-sex interaction terms. We weighted the data based on time spent in the country during the nine-year observation period for public-service use, to account for differences between individuals in observation time due to out-migration.
Per the confidentiality rules of Statistics NZ, frequencies/counts were randomly-rounded to base three for the NZIDI data. Analyses were performed using SAS Enterprise Guide v7.1 (SAS Institute), Stata v15.0 (Danish data), and Stata v16.0 (NZIDI (StataCorp)).
Results
Study-population characteristics
Table 1 provides descriptive information for the study populations, overall and by age-and-sex. Of the study populations, approximately half were male (NZ = 51.1%, Denmark = 50.4%), and there was a relatively even age-distribution (25–44y: NZ = 49.9%, Denmark = 46.1%; 45–64y: NZ = 50.1%, Denmark = 53.9%). Approximately half of individuals were married or in a civil union (NZ = 48.7%, Denmark = 49.0%). Of the NZ study population, 15.2% had left secondary school without qualifications; and of the Danish study population, 23.2% had received less than 12 years of education.
Descriptive information for the New Zealand and Danish study populations

a Mean age indicates age at the end of the last year of the observation period.
b Age ranges indicate age in the last year of the observation period (age across the 12 months of the observation year for deaths; New Zealand = July 2015 to June 2016, Denmark = January 2016 to December 2016).
c Prevalences calculated among individuals with available data for marital status (NZ: N = 1 353 408 (25–44-year-old men = 309 021, 45–64-year-old men = 361 509, 25–44-year-old women = 340 041, 45–64-year-old women = 342 837); Denmark: N = 2 534 137 (25–44-year-old men = 591 187, 45–64-year-old men = 685 244, 25–44-year-old women = 574 368, 45–64-year-old women = 683 338)) and education (NZ: N = 1 474 107 (25–44-year-old men = 358 761, 45–64-year-old men = 381 858, 25–44-year-old women = 375 129, 45–64-year-old women = 358 359); Denmark: N = 2 540 780 (25–44-year-old men = 594 084, 45–64-year-old men = 686 098, 25–44-year-old women = 576 907, 45–64-year-old women = 683 691)).
d New Zealand data: left secondary school without qualifications. Danish data: received less than 12 years of education.
e The 5% cutoff for high-use group membership was defined within each age-and-sex group. We defined the high-use group to be the top 5%, or as close as possible to 5% given the distribution.
f Mean values for recency calculated among individuals with a history of high-use group membership in the sector.
Distributions of deaths
Figure 1 displays rates of deaths of despair and deaths from other causes, in NZ and Denmark, across the study period. Online Supplementary Figure S2 shows the proportion of the overall death rate attributable to deaths of despair, across the period. Death rates were calculated using the annual resident populations of individuals born in each country. In both countries, deaths of despair were less prevalent than deaths from other causes; deaths of despair did not increase across time; and deaths from other causes decreased across time, in most age-and-sex groups (Fig. 1). Death-of-despair rates were relatively consistent over time in NZ, but declined in Denmark (Fig. 1). In NZ, the proportion of the death rate attributable to deaths of despair fluctuated somewhat among 25–44-year-olds, but these fluctuations did not show a consistent increase or decrease across the study period (online Supplementary Figure S2).
Rates of deaths of despair and deaths from other causes (deaths per 100 000) in New Zealand and Denmark, across the study period. Years are the New Zealand and Danish fiscal years (New Zealand = July 2006 to June 2016, Denmark = January 2007 to December 2016). Death rates were calculated using the annual resident populations of individuals born in each country.

Distributions of disadvantages
Between July 2006 and June 2015, 31.1% of the NZ study population received social-welfare benefits, totaling 20 863 547 benefit-months; 38.9% were admitted to public hospitals for physical- or mental-health problems, totaling 6 775 366 bed-nights; and 12.9% were convicted for adult crimes, totaling 1 062 081 convictions (Table 1). Between January 2007 and December 2015, 20.8% of the Danish study population received social-welfare benefits, totaling 25 528 986 benefit-months; 39.0% were admitted to public hospitals for physical- or mental-health problems, totaling 14 357 592 bed-nights; and 7.3% were convicted for adult crimes, totaling 381 300 convictions (Table 1). Prevalence estimates by age-and-sex are shown in Table 1.
Health and social disadvantages were unequally distributed. Gini coefficients indicated high levels of concentration in the distributions of events in each sector; in the NZ study population, coefficients across age-and-sex groups ranged from 0.77–0.88 for social welfare, 0.77–0.95 for hospital-nights, and 0.89–0.98 for crime. In Denmark, coefficients ranged from 0.89–0.97 for social welfare, 0.88–0.93 for hospital-nights, and 0.91–0.98 for crime. The top 5% of the NZ study population (across age-and-sex groups) in each sector accounted for a disproportionate share of events, comprising 27.3–49.8% of benefit-months, 50.4–84.2% of hospital-nights, and 65.3–100.0% of convictions. In Denmark, these estimates ranged from 54.5–59.7% for benefit-months, 57.9–69.8% for hospital-nights, and 60.7–100.0% for convictions. Hereafter, we refer to this top 5% as the ‘high-use group’ in each sector.
Deaths of despair clustered within the high-use group
Although deaths from suicide, drugs, and alcohol were not markedly elevated within the overall study populations, they clustered within a small population segment that disproportionately experienced multiple other disadvantages. Individuals who appeared in the high-use group in each health and social sector were at substantially elevated risk for deaths of despair relative to those not in the group (Table 2, Fig. 2).
Risk ratios [and 95% confidence intervals] indicating associations of health and social disadvantage with deaths of despair and deaths from other causes, in New Zealand and Denmark
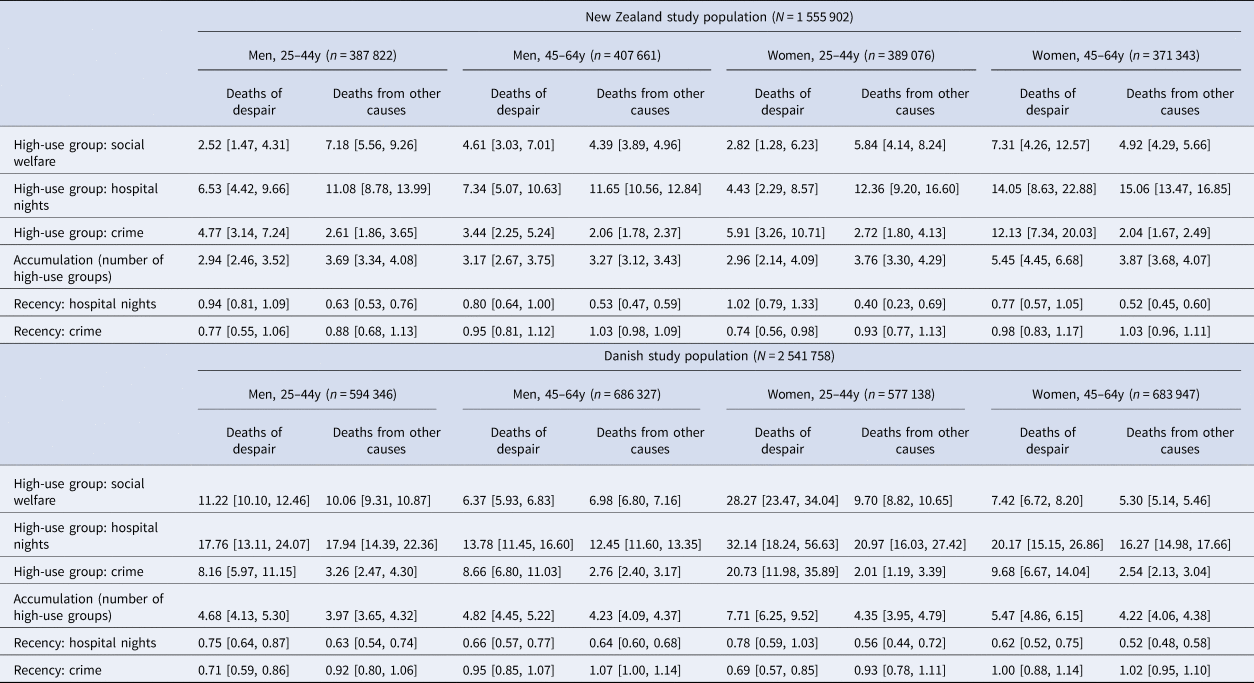
Note. Models predicted risk for deaths of despair and deaths from other causes in the last year of the observation period. The reference group for all tests was individuals who did not die in the year. Results from models comparing risk for deaths of despair against deaths from other causes are shown in online Supplementary Table S1. Recency = number of years since last service use, among individuals with a history of high-use group membership in the sector. In the New Zealand study population, counts were randomly rounded to a base of three, per the confidentiality rules of Statistics New Zealand. We re-estimated associations with confidence intervals adjusted for multiple testing and there was only one change in statistical inference: among 25–44-year-old New Zealand women, the association of recency of crime-sector contact with deaths of despair was no longer statistically significant (online Supplementary Table S7).
Individuals who disproportionately experienced health and social disadvantage also disproportionately experienced deaths of despair and deaths from other causes. The figure shows that individuals who appeared in the high-use group (top 5% of the population) in each health and social sector were at elevated risk for deaths of despair (A, B) and deaths from other causes (C, D), relative to those who did not appear in the high-use group. Death rates indicate rates during the one-year observation period for deaths (New Zealand = July 2015 to June 2016, Denmark = January 2016 to December 2016).

In NZ, relative risks for associations across age-and-sex groups ranged from 4.43 [2.29–8.57]–14.05 [8.63–22.88] for hospital-nights, 2.52 [1.47–4.31]–7.31 [4.26–12.57] for social welfare, and 3.44 [2.25–5.24]–12.13 [7.34–20.03] for crime (Table 2). Tests of age-and-sex differences indicated that associations with deaths of despair tended to be strongest among older women. For hospital-nights, the association was stronger among 45–64-year-old women than all other age-and-sex groups; for social welfare, the association was stronger among 45–64-year-old women than 25–44-year-old men; and for crime, the association was stronger among 45–64-year-old women than 25–44-year-old and 45–64-year-old men (online Supplementary Table S2A).
Associations were larger in Denmark than NZ, ranging from 13.78 [11.45–16.60]–32.14 [18.24–56.63] for hospital-nights, 6.37 [5.93–6.83]–28.27 [23.47–34.04] for social welfare, and 8.16 [5.97–11.15]–20.73 [11.98–35.89] for crime. Tests of age-and-sex differences indicated that associations with deaths of despair in Denmark tended to be strongest among younger women. For hospital-nights, associations were stronger among 25–44-year-old women and 45–64-year-old women relative to 45–64-year-old men; for social welfare, associations were stronger among 25–44-year-old women relative to all other age-and-sex groups, and among 25–44-year-old men relative to 45–64-year-old men; and for crime, associations were stronger among 25–44-year-old women relative to all other groups (online Supplementary Table S2B).
Individuals who were members of more high-use groups were at elevated risk for deaths of despair relative to those who were members of fewer high-use groups (RRs: NZ = 2.94 [2.46–3.52]–5.45 [4.45–6.68], Denmark = 4.68 [4.13–5.30]–7.71 [6.25–9.52]; Table 2). In NZ, the association of high-use-group accumulation with deaths of despair was stronger among 45–64-year-old women than all other age-and-sex groups (online Supplementary Table S2A). In Denmark, the association was stronger among 25–44-year-old women than other groups (online Supplementary Table S2B).
We calculated–for individuals who had been in the high-use group in the hospital and crime sectors–the number of years since they had last had sector contact. (We could not construct a recency measure for social welfare due to limited variation.) In NZ, 25–44-year-old women who had gone more years without crime-sector contact were at lower risk for deaths of despair (RR = 0.74 [0.56–0.98]; Table 2), but this association did not differ from that for other age-and-sex groups (online Supplementary Table S2A). In Denmark, men and 45–64-year-old women who had gone more years without hospital-sector contact were less likely to experience a death of despair (25–44-year-old men: RR = 0.75 [0.64–0.87], 45–64-year-old men: RR = 0.66 [0.57–0.77], 45–64-year-old women: RR = 0.62 [0.52–0.75]; Table 2); these associations did not differ by age-and-sex (online Supplementary Table S2B). For crime, 25–44-year-olds who had gone more years without sector contact were at lower risk for deaths of despair (men: RR = 0.71 [0.59–0.86], women: RR = 0.69 [0.57–0.85]); these associations were not observed (and were significantly weaker) among 45–64-year-olds (Table 2; online Supplementary Table S2B).
Deaths from other causes clustered within the high-use group
Individuals who experienced multiple health and social disadvantages were at elevated risk for deaths from causes beyond suicide, drugs, and alcohol (Table 2, Fig. 2). In NZ, associations with deaths from other causes, across age-and-sex groups, ranged from 11.08 [8.78–13.99]–15.06 [13.47–16.85] for hospital-nights, 4.39 [3.89–4.96]–7.18 [5.56–9.26] for social welfare, and 2.04 [1.67–2.49]–2.72 [1.80–4.13] for crime (Table 2). For hospital-nights, associations were stronger among 45–64-year-old women than 25–44- and 45–64-year-old men; and for social welfare, associations were stronger among 25–44-year-old men than 45–64-year-old men and women. Associations for crime did not differ by age-and-sex (online Supplementary Table S2A). In Denmark, associations ranged from 12.45 [11.60–13.35]–20.97 [16.03–27.42] for hospital-nights, 5.30 [5.14–5.46]–10.06 [9.31–10.87] for social welfare, and 2.01 [1.19–3.39]–3.26 [2.47–4.30] for crime (Table 2). For hospital-nights, associations were weaker among 45–64-year-old men than other age-and-sex groups. For social welfare, associations were stronger among younger than older individuals, and among older men than older women. Associations for crime did not differ by age-and-sex (online Supplementary Table S2B).
Individuals who were members of more high-use groups were at elevated risk for deaths from other causes (RRs: New Zealand = 3.27 [3.12–3.43]–3.87 [3.68–4.07], Denmark = 3.97 [3.65–4.32]–4.35 [3.95–4.79]; Table 2). In NZ, associations of high-use-group accumulation with deaths from other causes were weaker among 45–64-year-old men relative to all other age-and-sex groups (online Supplementary Table S2A). In Denmark, associations did not differ by age-and-sex (online Supplementary Table S2B).
In both nations, individuals who had gone longer without hospital-sector contact were at reduced risk for deaths from other causes, and recency of crime-sector contact was not associated with deaths from other causes (Table 2). In NZ, associations for recency of hospital-sector contact did not differ by age-and-sex (online Supplementary Table S2A). In Denmark, these associations were stronger among older women than younger and older men (online Supplementary Table S2B).
Sensitivity analyses
In both nations, the average length-of-stay was longer for psychiatric than physical-health hospitalizations. Further, Denmark relies more than NZ on inpatient treatment for mental-health problems, leading the distributions of psychiatric bed-nights to differ across countries. We re-estimated associations with high-use group membership in the hospital sector, excluding psychiatric admissions. Associations with deaths of despair were attenuated, but robust (NZ: RRs = 2.75 [1.24–6.08]–8.19 [4.85–13.85]; Denmark: RRs = 8.34 [6.05–11.50]–14.76 [11.06–19.70]). Associations with deaths from other causes were comparable (NZ: RRs = 11.73 [10.65–12.92]–15.84 [14.17–17.72]; Denmark: RRs = 13.53 [12.63–14.50]–24.78 [18.91–32.46]).
We excluded immigrants from primary analyses because (a) there are differences between NZ and Denmark in the average education level of the countries’ immigrant populations (Statistics New Zealand, n.d.; Statistics Denmark, 2021), and education level relates to the probability of being in a high-use group (Richmond-Rakerd et al., Reference Richmond-Rakerd, D'Souza, Andersen, Hogan, Houts, Poulton and Moffitt2020); and (b) within each country, there were differences among immigrants in their average education levels depending on country-of-origin. We re-estimated associations among immigrants independently, and among NZ- and Danish-born individuals together with immigrants (within each country).
Mortality rates (deaths/100 000) were lower among immigrants (deaths of despair: NZ-born = 25.8, NZ immigrants = 10.8; Danish-born = 33.1, Danish immigrants = 14.3; other deaths: NZ-born = 228.5, NZ immigrants = 111.1; Danish-born = 246.8, Danish immigrants = 125.0). In New Zealand, associations of high-use group membership in each sector with mortality were similar in magnitude among NZ-born and immigrant individuals (online Supplementary Table S3). In Denmark, the magnitude of associations with social-welfare high-use group membership was lower among immigrants. For hospitalizations, associations with deaths of despair and other deaths were larger in most age-and-sex groups; and for crime, associations with deaths of despair were smaller across all groups (online Supplementary Table S3). However, these associations should be interpreted with caution given low precision in estimation.
When NZ- and Danish-born individuals were analyzed together with immigrants, the magnitude of associations with high-use group membership in each sector was relatively similar. In Denmark, there were no changes in statistical inference (online Supplementary Table S4). In NZ, associations of hospitalization recency among 45–64-year-old men and women and crime recency among 25–44-year-old men with deaths of despair were significant, and the association of crime recency with deaths of despair among 25–44-year-old women was not significant when including immigrants (online Supplementary Table S4).
We tested whether associations with deaths of despair were driven by a particular type of death by re-estimating associations after separately removing deaths from suicides, poisonings, and alcohol-related diseases (online Supplementary Tables S5A,B). In both nations, nearly all associations were substantially increased in magnitude when suicide-related deaths were removed, suggesting a larger difference in rates of suicide-related deaths than in rates of drug- and alcohol-related deaths between those in and not in the high-use group (online Supplementary Tables S5A,B). However, statistical power for these analyses was somewhat limited given the relatively low rates of deaths of despair, particularly among women.
We re-estimated associations controlling for age, marital status, and education level (online Supplementary Table S6). Associations were attenuated, but generally robust. In NZ, there were four changes in statistical inference: associations of social-welfare high-use group membership with deaths of despair among 25–44-year-old men and women, crime high-use group membership with deaths from other causes among 25–44-year-old women, and crime recency with deaths of despair among 25–44-year-old women were not significant after covariate adjustment. In Denmark, the association of crime high-use group membership with deaths from other causes among 25–44-year-old women was no longer significant (online Supplementary Table S6).
Discussion
In this population-register study of 4.1-million citizens, individuals who disproportionately experienced multiple health and social disadvantages were at elevated risk for deaths of despair, and deaths from other causes. Associations were evident in men and women, among younger and older working-age adults, in native-born and immigrant populations, and across two industrialized nations with institutional contexts different from the United States.
Prior research has detected steeper rises in mortality from suicide, drug and alcohol poisonings, and alcohol-related diseases among working-age adults in the U.S. relative to other Western nations (Case & Deaton, Reference Case and Deaton2015; Haan et al., Reference Haan, Hammerschmid and Schmieder2019; National Academies of Sciences, Engineering, & Medicine, 2021). Consistent with these observations, these deaths were not markedly elevated in our NZ and Danish study populations, and they did not increase across the study period. This suggests that aspects of NZ and Denmark's institutional contexts that differ from the U.S.–including cradle-to-grave public healthcare and social-welfare systems, and stronger pharmaceutical regulations–may help reduce risk for deaths of despair, and contribute to lower rates of these deaths in these countries. However, we also found that deaths of despair were disproportionately experienced by a small segment of citizens who also disproportionately experienced multiple other health and social disadvantages. This extends prior work in NZ and Denmark identifying low levels of self-reported wellbeing among the high-use population segment (Richmond-Rakerd et al., Reference Richmond-Rakerd, D'Souza, Andersen, Hogan, Houts, Poulton and Moffitt2020), to show that these individuals are also characterized by distress-related premature deaths. It also indicates that deaths of despair are tied to health and social inequalities even in countries with systems and policies to support health and reduce premature mortality.
Excess mortality risks in the high-use population segment were not limited to deaths of despair. Deaths from other causes decreased in most age-and-sex groups across the study period, consistent with the progressive lifespan gains observed in industrialized nations prior to the COVID-19 pandemic (though these gains were slowing in many countries and even reversing in some, including the U.S. (Crimmins, Reference Crimmins2021)). However, like for deaths of despair, deaths from other causes clustered within the high-use group. This aligns with work in the U.S. identifying additional contributors to the rise in midlife mortality (e.g. increasing deaths from organ-system diseases and lower-than-expected decreases in cardiovascular-disease mortality) (Harper, Riddell, & King, Reference Harper, Riddell and King2021; Woolf & Schoomaker, Reference Woolf and Schoomaker2019), and indicates that ameliorating disadvantage across multiple health and social domains might reduce premature deaths from a range of causes. Where, however, should interventionists and policymakers consider directing such efforts? Previous research indicates that the high-use population segment experiences early-life factors that can follow from health and social disadvantage and that reduce modern-workforce preparedness, including poor cognitive health and low school-readiness in early childhood, mental-health difficulties in adolescence, and low educational attainment in young adulthood (Richmond-Rakerd et al., Reference Richmond-Rakerd, D'Souza, Andersen, Hogan, Houts, Poulton and Moffitt2020); and that individuals with a history of adolescent mental-health difficulties experience despair-related maladies at midlife (Brennan et al., Reference Brennan, Moffitt, Ambler, Harrington, Hogan, Houts and Caspi2023). Further, there is evidence for the effectiveness of mental-health and education-focused interventions for disadvantaged youth (Bergman, Reference Bergman2021; Greenberg & Lippold, Reference Greenberg and Lippold2013; Kieling et al., Reference Kieling, Baker-Henningham, Belfer, Conti, Ertem, Omigbodun and Rahman2011; York & Loeb, Reference York and Loeb2014), and evidence that education may reduce intergenerational continuity in disadvantage (Andersen et al., Reference Andersen, Richmond-Rakerd, Moffitt and Caspi2021). Results of these studies–together with those of the current analysis–suggest that efforts to support the most vulnerable citizens’ education and training potential across the early life-course could yield returns in the form of reduced health and social inequalities, including inequalities in lifespan. Our analysis also reveals that individuals at greatest risk for premature mortality come into contact with multiple public-service systems at a very high rate. Integrated-care models that coordinate service delivery across sectors–including programs that incorporate strategies to support mental health and involvement with education–may benefit the most disadvantaged segment of the population.
Associations between high-use group membership and deaths of despair were evident in both nations, but most associations were larger in Denmark. Differences may partly reflect more ‘competing risks’ for deaths of despair among the high-use group in NZ. For instance, motor vehicle-related fatalities are higher in NZ (Institute for Health Metrics and Evaluation, 2019). A key question for future research is whether interventions and policies to ameliorate disadvantage and extend healthy lifespan show similar or different effects across nations.
Associations between high-use group membership and deaths of despair were also evident in both native-born and immigrant populations of both countries. In NZ associations were a similar magnitude for both populations, while in Denmark associations were smaller among immigrants for social welfare and crime, but larger for hospitalizations. This suggests that, in general, the impact of multiple disadvantage on deaths of despair is not compounded by the unique disadvantages faced by immigrants (e.g., language barriers, adapting to a new culture, discrimination).
Tests of age- and sex-differences revealed that associations between high-use group membership and deaths of despair were typically larger among women–particularly older women in NZ and younger women in Denmark. Reasons for this are unclear, but it may be that multiple disadvantage is a more salient factor when death is a very rare event (around 20 per 100 000 for older women in NZ and 10 per 100 000 for younger women in Denmark).
Limitations
First, our definition of high-use groups based on a 5% cutoff was a practical way to capture concentration and identify a segment of individuals in need of intervention; other cutoffs capturing a greater proportion of the population could be explored. Second, our observation period started in 2006, which was the year from which reliable electronic data-capture was present for all NZ administrative sectors of interest. However, it would have been ideal to capture public-service use starting earlier, to include the period leading up to the 2007–2009 economic recession. Third, although associations with deaths of despair were evident across age-and-sex groups, associations among women were estimated with less precision given their comparatively low rates of deaths of despair. Fourth, our use of nationwide, linked administrative data enabled us to integrate information about multiple domains of disadvantage, and track associations at the population level. However, we could not conduct fine-grained assessments of psychological indicators of despair (Copeland et al., Reference Copeland, Gaydosh, Hill, Godwin, Harris, Costello and Shanahan2020; Shanahan & Copeland, Reference Shanahan and Copeland2021). Fifth, to be included in analyses, individuals had to have been alive during the years in which we measured public-service use, which may introduce a healthy-survivorship bias. Sixth, our observational design cannot confirm experiences of health and social disadvantage and high use of public services as causal factors in premature mortality. The study could not account for some potentially confounding factors, such as health history and socio-economic experiences in early life. Seventh, we considered cumulative experiences of disadvantage across the study period; approaches that evaluate heterogeneity and change in experiences of disadvantage would provide more detailed information concerning associations of disadvantage with mortality. Eighth, modeling health disadvantage as a predictor rather than related outcome of mortality avoided temporal overlap with social-disadvantage predictors (social-welfare and crime high-use group membership), but likely introduced predictor-criterion overlap. Lastly, there is potential for error in cause-of-death coding, such as misclassification of suicides as accidental drug poisonings or poisonings of undetermined intent (Snowdon & Choi, Reference Snowdon and Choi2020).
Conclusions
We provide preliminary evidence that the concentration and accumulation of health and social disadvantage forecasts inequalities in population lifespan in two countries: New Zealand and Denmark. These inequalities are attributable to deaths related to distress, and deaths from other causes. Institutional contexts–including robust public-healthcare and social-welfare systems, and strong pharmaceutical regulations–may help reduce deaths of despair. However, even in the presence of these factors, risk for these deaths remains unequally distributed, and falls on those experiencing the greatest disadvantage.
Supplementary material
The supplementary material for this article can be found at https://doi.org/10.1017/S0033291723003495.
Acknowledgements
We thank Statistics New Zealand and their staff for access to the IDI data and timely ethics review of output data. We thank the Public Policy Institute at the University of Auckland for access to their Statistics New Zealand data lab. We also thank Natalia Boven for helpful consultation on analyses.
Statistics New Zealand disclaimer
These results are not official statistics. They have been created for research purposes from the Integrated Data Infrastructure (IDI) which is carefully managed by Stats NZ. For more information about the IDI please visit https://www.stats.govt.nz/integrated-data/.
Funding statement
This research was supported by grant 1221 from the Rockwool Foundation, grant P2C HD065563 from the National Institute of Child Health and Human Development through the Duke Population Research Center, and grant PRG-1-153-20 from the American Foundation for Suicide Prevention. The content is solely the responsibility of the authors and does not necessarily represent the official views of the funding agencies.
Disclosures
The authors declare no conflicts of interest.


 Open access