
INTRODUCTION
Research examining environmental inequality has surged in recent decades. Much of this interest stems not only from ongoing concerns that poor and minority neighborhoods are disproportionately burdened by environmental hazards, but also from mounting evidence that these differentials in proximity and exposure contribute to significant racial and ethnic inequalities in a variety of social and health outcomes, including: perceptions of neighborhood disorder; housing values; educational attainment; cognitive development; psychological well-being; birthweight and gestational age; numerous cardiovascular, respiratory, and central nervous system disorders; as well as premature death (Downey Reference Downey2006; Downey and Van Willigen, Reference Downey and Van Willigen2005; Evans and Kantrowitz, Reference Evans and Kantrowitz2002; Kampa and Castanas, Reference Kampa and Castanas2008; Liu Reference Liu2001; Pastor et al., Reference Pastor, Sadd and Morello-Frosch2002; Pastor et al., Reference Pastor, Sadd and Morello-Frosch2004; Payne-Sturges and Gee, Reference Payne-Sturges and Gee2006; Ross et al., Reference Ross, Reynolds and Geis2000; Sadd et al., Reference Sadd, Pastor, Boer and Snyder1999).
However, despite the increasing scholarly attention to, and practical importance of, this area of inquiry, existing research suffers from several interrelated shortcomings. First, the vast bulk of Environmental Justice scholarship utilizes aggregate-level data to assess the correspondence between neighborhood racial composition and pollution levels (c.f., Ash and Fetter, Reference Ash and Fetter2004; Downey Reference Downey2005; Morello-Frosch et al., Reference Morello-Frosch, Pastor and Sadd2001), making it difficult to assess micro-level variations in exposure or to examine the role of individual- and household-level factors that might influence this exposure.
Second, even among those studies using individual-level data, most analyses rely on data collected at a single point in time or over relatively short windows of observation. While this work provides an important snapshot and, on the whole, strong evidence of environmental inequality, particularly by race (Ringquist Reference Ringquist2005), it is largely insensitive to the temporal dimension of exposure. This is an important limitation since theory and empirical research suggest that long-term dynamics are relevant for understanding racial and ethnic inequalities in the distribution, causes, and consequences of exposure to environmental hazards (Ard Reference Ard2015; Morello-Frosch Reference Morello-Frosch2002; Pais et al., Reference Pais, Crowder and Downey2014).
Third, as a function of such a reliance on point-in-time estimates, most studies of environmental inequality do not account for changes in income, family composition, and other life circumstances that are likely to impact residential location and, in turn, disparities in exposure to environmental hazards over time and across racial and ethnic groups. Similarly, the majority of cross-sectional research in this area implicitly ignores how such inequalities in exposure have been influenced by fluctuations in broader socio-spatial forces. While levels of hazardous pollutants have declined over time in most metropolitan regions in the United States, these declines appear to have been especially pronounced in the de-industrializing Midwest and other areas in which relatively large concentrations of people of color tend to reside ( Downey Reference Downey2005; Farley et al., Reference Farley, Danziger and Holzer2000).
At the same time, levels of racial residential segregation within metropolitan areas have decreased in ways that may have altered the extent of racial and ethnic disparities in pollution exposure. Contemporaneous assessments of environmental inequality, however, make it difficult, if not impossible, to assess the differential impacts of such dynamic macrosocial trends on longitudinal patterns of exposure to environmental hazards, or racial and ethnic inequalities therein.
To address these gaps in prior research, this study employs a unique combination of multilevel, longitudinal data to examine the long-term dynamics of environmental inequality from 1990 to 2009, focusing on racial and ethnic disparities in exposure to neighborhood air pollution and their micro- and macro-level determinants over time. Specifically, we combine individual-level data from the Panel Study of Income Dynamics (PSID) with census data on the economic and socio-demographic composition of the broader geographic context, as well as spatially-precise measures of air pollution in census blocks occupied by PSID respondents in the years since 1990. We focus on indictors of both particulate matter (PM) and nitrogen dioxide (NO2), criteria air pollutants that are regulated by the Environmental Protection Agency (EPA) as part of the Clean Air Act.
To this dataset we apply a series of multilevel repeated measures models to investigate several theoretically-relevant but underexplored questions: How has exposure to neighborhood air pollution changed over time? Are there significant racial and ethnic disparities in pollution exposure and in the degree to which such exposure has changed over time? How does variation within and between metropolitan areas impact these temporal and racial dynamics in pollution exposure? To what extent are racial and ethnic disparities in exposure and exposure trends due to racial and ethnic differences in individual- and household-level characteristics? Finally, how do racial-spatial patterns of metropolitan-level industrialization and residential segregation coincide with patterns of pollution exposure and environmental inequality over time?
BACKGROUND
Similar to many burgeoning areas of study, evidence as to the existence of and reasons for inequalities in exposure to environmental hazards is generally consistent but by no means unequivocal (c.f., Anderton et al., Reference Anderton, Anderson, Oakes and Fraser1994). Among the earliest works to systematically examine this issue was a landmark report published in 1987 by the Commission for Racial Justice (CRJ). According to the report, poor and minority neighborhoods were more likely to contain commercial hazardous waste facilities, irrespective of region, urbanization, and land value. These findings helped ignite a national grassroots movement and directed unprecedented political and scholarly attention to issues of environmental justice (Commission for Racial Justice 1987). Two decades later, a follow-up to this report using 2000 Census data, an updated database of commercial hazardous waste facilities, and newer methods that better match where people and facilities are located, found that significant racial and socioeconomic disparities remain in the distribution of the nation’s hazardous waste facilities, with racial differences often persisting across economic strata (Bullard et al., Reference Bullard, Mohai, Saha and Wright2008).
Over the years, scholars have documented similar inequalities by race and socioeconomic status (SES) in exposure to not only hazardous waste sites, but also industrial facilities that produce and release toxic chemicals as well as roadways and other non-industrial sources of pollution. Paul Mohai and Bunyan Bryant (Reference Mohai, Bryant, Bryant and Mohai1992) conducted one of the first meta-analyses of empirical work in this area. Their review of sixteen studies found that regardless of the geographic scope, the methodologies employed, or the risk examined, striking racial and SES disparities existed in the distribution of a variety of environmental hazards, and that in most cases, race was a more important predictor than SES (c.f., Mohai et al., Reference Mohai, Pellow and Roberts2009). A number of more recent reviews of the mounting literature on environmental justice overwhelmingly corroborate such conclusions (Brown Reference Brown1995; Evans and Kantrowitz, Reference Evans and Kantrowitz2002; Institute of Medicine 1999; Szasz and Meuser, Reference Szasz and Meuser1997), generally finding “ubiquitous” evidence of environmental inequalities by race, but “substantially weaker” evidence of SES-based environmental inequalities, which tend to vary across types of risk, levels of aggregation, study quality, and methodology (Ringquist Reference Ringquist2005, p. 241).
Nonetheless, the growing consensus that people of color across the socioeconomic spectrum are disproportionately exposed to various environmental hazards has, until relatively recently, been based largely on studies that examined this relationship in the aggregate. That is, by correlating racial (and/or SES) composition and pollution levels within some geographic boundary, such as cities, counties, zip codes, census tracts, or within some other pre-specified distance around a polluting facility. To be sure, these aggregate-level studies played an instrumental role in advancing both advocacy and scholarship around issues of environmental justice. Yet concerns about the ecological fallacy and a lack of clarity about causality likely hindered more decisive action to address such issues. Investigations into the extent of racial and ethnic disparities in proximity and exposure to environmental hazards at the individual level, as well as their micro- and, to a lesser extent, macro-level determinants have, therefore, become increasingly common.
Although these studies linking measures of pollution to individual-level data similarly suggest that people of color are disproportionately burdened by the geographic concentration of environmental hazards (Crowder and Downey, Reference Crowder and Downey2010; Pais et al., Reference Pais, Crowder and Downey2014), notable limitations remain. As suggested earlier, central among these shortcomings is the lack of attention to long-term dynamics. With only a limited number of recent exceptions (c.f., Pais et al., Reference Pais, Crowder and Downey2014), individuals’ exposure to environmental hazards tends to be assessed just once or within short observation periods, while the longitudinal individual-level research that does exist fails to assess changes in pollution exposure in the context of broader patterns of pollution decline across metropolitan areas.
The relative shortage of longitudinal environmental justice research is due in part to a dearth of suitable data. The EPA did not begin to collect and publish reliable national data on environmental hazards until about 1990. Since then, the few studies to both take advantage of the more than two decades of data now available and merge it with individual-level records that cover at least an equivalent time frame either focus on the differential effects of long-term exposure rather than differentials in the dynamics and determinants of the exposure itself (c.f., Barakat-Haddad et al., Reference Barakat-Haddad, Elliott and Pengelly2012; Delfino et al., Reference Delfino, Chang, Wu, Ren, Tjoa, Nickerson, Cooper and Gillen2009; Diez Roux et al., Reference Diez Roux, Auchincloss, Franklin, Raghunathan, Barr, Kaufman, Astor and Keeler2008; Jerrett et al., 2009; Liao et al., Reference Liao, Heiss, Chinchilli, Duan, Folsom, Lin and Salomaa2004; Miller et al., Reference Miller, Siscovick, Sheppard, Shepherd, Sullivan, Anderson and Kaufman2007; Whitsel et al., Reference Whitsel, Quibrera, Christ, Liao, Prineas, Anderson and Heiss2009) or, when individual exposure is more central to the study (c.f., Crowder and Downey, Reference Crowder and Downey2010; Pais et al., Reference Pais, Crowder and Downey2014), largely fail to factor larger historical trends in air pollution or related factors into the analyses. Thus, the ways in which extant evidence of large-scale declines in pollution have played out among different racial and ethnic groups and their corresponding effects on well-documented racial/ethnic disparities in exposure remain underexplored.
Before proceeding to the present study, however, we note three recurrent paradigms in the Environmental Justice literature that lead us to expect persistent racial and ethnic inequalities in pollution exposure in the face of nationwide declines that have been posited—and in some cases shown—to preferentially benefit people of color (Downey Reference Downey2005; Farley et al., Reference Farley, Danziger and Holzer2000). First, economic explanations suggest that decisions about where to site industrial facilities, major roadways, and other sources of air pollution are market-driven—that is, located in areas where land is cheapest (Mohai et al., Reference Mohai, Pellow and Roberts2009). Rent and housing values tend to be similarly low in these areas, making them more accessible to lower-income households, among which people of color are overrepresented, and less appealing to higher income households, among which Whites are overrepresented. According to this perspective, racial and ethnic differences in air pollution exposure emerge and are maintained over time as a function of individual- and household-level differences in socioeconomic resources across groups and their members’ corresponding residence (or not) in neighborhoods in which polluters get the most (or least) bang for their buck. By extension, then, persistent racial and ethnic disparities in SES should contribute to corresponding disparities in pollution exposure across time; however, if this were the entire story, adjusting for these individual- and household-level factors would eliminate, or at least substantially attenuate, any racial and ethnic gaps in exposure trends.
Second, and relatedly, sociopolitical explanations imply that industry and government seek the path of least resistance when siting hazardous waste and polluting industrial facilities and major roadways. Thus, neighborhoods with abundant resources and political clout, which also tend to house predominantly White individuals, tend to be actively avoided, whereas disenfranchised neighborhoods, in which people of color disproportionately reside, are sought out as easier targets because they tend to have fewer resources and are usually underrepresented among the decision-makers in industry and government (Mohai et al., Reference Mohai, Pellow and Roberts2009).
Finally, racial discrimination explanations argue that racial and ethnic inequalities in exposure to environmental hazards were produced and are perpetuated over time because racial discrimination in housing explicitly constrains the residential choices of people of color to poorer, more distressed neighborhoods in which levels of pollution are higher, over and above individuals’ financial means (Massey and Denton, Reference Massey and Denton1993; Peterson and Krivo, Reference Peterson and Krivo2010). These latter two explanations imply more macro-level influences on racial and ethnic inequalities in pollution exposure, particularly racial residential segregation and industrialization which have each undergone relatively considerable decreases over the last several decades, potentially affecting pollution exposure differentially across racial and ethnic groups over time.
In this study we are able to examine trends in individuals’ exposure to neighborhood air pollution from both industrial and mobile sources, as well as racial and ethnic inequalities in such trends, controlling for changes over time in individual- and household-level characteristics as well as changes in metropolitan-area residential segregation and industrialization. Whereas a compilation of various cross-sectional estimates provides a crude indication of declining levels of pollution exposure over time, as well as changes in racial and ethnic inequalities therein, our multilevel, longitudinal design extends prior research in several important ways.
First, it allows individual respondents to serve as their own controls, reducing bias from unobserved heterogeneity. Second, it examines predictors of pollution exposure at both the individual and metropolitan levels, consistent with the recognition that understanding environmental inequality and changes therein requires a comprehensive multilevel framework (Soobader et al., Reference Soobader, Cubbin, Gee, Rosenbaum and Laurenson2006). Finally, it allows individual-, household-, and metropolitan-level characteristics to vary across time and controls for the enduring effects of these factors when examining racial and ethnic inequalities in neighborhood air pollution exposure.
Such a comprehensive account of neighborhood air pollution exposure over two decades and in the context of both individual- and metropolitan-level dynamics is thus an important foundation on which to situate future research related to the temporal effects of such exposure on key social and health-related outcomes, as well as the extent to which differential exposure patterns help to explain persistent racial and ethnic disparities therein.
DATA AND METHODS
Sources
Individual-level data come from the 1990 to 2009 waves of the PSID, a longitudinal survey of U.S. residents and their families conducted annually between 1968 and 1997 and biennially thereafter. The initial panel included approximately 5000 families and 18,000 individuals, but because the descendants of original PSID families continue to be interviewed as they grow older and form their own independent households, the sample had increased to more than 9000 families and 22,000 individuals by 2009.
Several characteristics of the PSID make it advantageous for the purposes of this study. First, the dataset contains an oversample of low-income households, as well as information on a wide range of individual- and household-level characteristics that may influence levels of exposure to air pollution. Second, because the PSID has followed individuals for up to several decades, it is possible to observe individual- and household-level correlates of pollution exposure, as well as changes therein, over an extended period of time.
Finally, and of critical importance, the residential location of individual respondents at each survey wave can be linked to their corresponding Census codes for various levels of geographic aggregation using the PSID’s supplemental, restricted-use Geospatial Match Files. These codes allow us to examine the level of air pollution in respondents’ neighborhood of residence at each interview, as well as assess changing levels of residential segregation and industrialization in the broader metropolitan (or micropolitan) area in which the neighborhood and individual are located.
Information on air pollution in the Census block of residence in each year is derived from several EPA sources. The EPA has collected reliable national data on industrial and non-industrial pollution from point and non-point sources since 1990, which are disseminated in two primary ways: the Toxics Release Inventory (TRI) and the Air Quality System (AQS). We base our estimates on the AQS for several reasons. First, the pollution-output information based on the TRI relies on potentially unreliable self-reports by polluters. Second, and more problematic, it contains information on output from only relatively large facilities within a limited number of industries, and completely excludes pollution from non-industrial sources, including vehicles. These exclusions are particularly problematic for our purposes given potentially large racial and ethnic differences in proximity to roadways and other non-industrial hazards (Maantay Reference Maantay2001), and because the largest source of air pollution for most Americans is vehicle traffic. In contrast to the facility-based information in the TRI, the AQS reflects information collected directly through a nationwide network of air-quality monitoring stations that record concentrations of criteria air pollutants (pollutants that are regulated by the Clean Air Act) from all sources, allowing for more comprehensive measures of local pollution and variations therein.
Because the AQS data are based on a system of air-quality monitoring stations that are not evenly distributed across the nation and vary across time, a central challenge in the utilization of these data involves their conversion into reliable annual measures of pollution in specific neighborhoods. To do this we utilize and extend an innovative approach, developed by Joel Kaufman and colleagues (Sampson et al., Reference Sampson, Szpiro, Sheppard, Lindström and Kaufman2011), that combines land-use regression and universal kriging (LUR/UK). In basic form, this approach is a regression-based spatial interpolation method in which pollution concentrations at the locations of air-quality monitors are utilized as the outcome variable and a wide range of exogenous geographic, metrological, and population characteristics of the locations and (sometimes) surrounding areas are used as predictors. Footnote 1 These geographic, metrological, and population characteristics are obtained from a wide range of sources, including the U.S. Geological Survey and the U.S. Census. The resulting regression equation is then used to predict annual-average air pollution concentrations for any given location (i.e., latitude and longitude) in the contiguous United States, regardless of its distance from an actual air-quality monitoring station. Since the smallest unit of geography available for PSID respondents is the Census block, annual air pollution concentrations were predicted for each respondent’s Census block centroid.
Sample
Our analyses focus on non-Hispanic White (“White”), non-Hispanic Black (“Black”), and Latino household heads who were interviewed at least once and up to fourteen times between 1990 and 2009—years that correspond with our data on neighborhood air pollution and metropolitan-level characteristics. Respondents provided information, on average, at approximately six time points during our observation window. Correspondingly, we organize this information into a series of person-period observations, with each observation referring to the one- or two-year period between PSID interviews. In total, respondents in the sample contributed 106,250 person-periods of observation: 58,882 person-periods from White respondents; 35,233 person-periods from Black respondents; and 12,135 person-periods from Latino respondents.
Dependent Variable
The dependent variables for this study measure annual amounts of neighborhood air pollution. We focus in particular on three different criteria pollutants monitored regularly by a majority of the air monitors in the AQS system over the past two decades: (1) fine particulate matter (PM2.5), a mixture of solid particles and liquid droplets that are 2.5 micrometers in diameter and smaller; (2) coarse particulate matter (PM10), a mixture of solid particles and liquid droplets with diameters larger than 2.5 micrometers and smaller than 10 micrometers; and (3) nitrogen dioxide (NO2), one of a group of highly-reactive gases produced primarily by the combustion of fossil fuels. These pollutants capture different aspects of air pollution and may therefore have different distributions across space and time. For instance, PM tends to encompass a variety of sources (human-made and natural), whereas NO2 is seen as a marker of traffic-related air pollution. PM was measured in micrograms per cubic meter (µ/m3). NO2 was measured in parts per billion (ppb). To ease interpretation of the findings, levels of pollution were log-transformed following the addition of a constant value of one. In practice, this means coefficient estimates can be interpreted in terms of percent change in the expected level of each pollutant (i.e., 100*(exp(β)-1)).
Independent Variables
The key independent variable for this study is the respondent’s race/ethnicity. We differentiate between three groups that appear in sufficient numbers in the PSID to sustain multigroup comparisons of exposure: Whites, Blacks, and Hispanics of any race (“Latino”). We also assess the effects of other micro-level sociodemographic and economic characteristics, including: age (in years); marital status (1=unmarried; 0=married/cohabiting); family size; housing status (1=rent; 0=own); employment status (1=unemployed; 0=employed); and total household income, standardized using the Consumer Price Index to the year 2000. Except for race, all individual- and household-level covariates are measured as time-varying.
Dynamic macrosocial forces further inform our understanding of exposure to neighborhood pollution over time. Decennial Census data on the racial composition and industrial structure of respondents’ residential areas are derived from the Neighborhood Change Database (Geolytics 2012). As an indicator of metropolitan-area industrial structure, we measure the percentage of persons age sixteen and older employed as operators, assemblers, nonfarm laborers, service workers, or in transportation occupations. Residential segregation is measured using the multigroup entropy index, also known as the multigroup version of Theil’s H, or the multigroup information theory index (Reardon and Firebaugh, Reference Reardon and Firebaugh2002). We characterize both variables for either the metropolitan or, in the case of non-metropolitan residents, the micropolitan area in which respondents reside at each interview. Data for intercensal years are imputed using linear interpolation.
Analytic Strategy
Given the temporal and geographical nesting of the data, we examine racial and ethnic disparities in neighborhood air pollution exposure over time using a series of multilevel repeated measures models with multiple annual/biennial observations (level 1) for each of the individual respondents (level 2) who are clustered within metropolitan areas (level 3). To start, however, we construct a two-level model which can be represented in mathematical terms as follows:

where Y ti is the level of pollution (NO2, PM2.5, or PM10) in the block of residence at time t for individual i. At level 1, the repeated measures for a given respondent are modeled by an individual intercept (π 0i ) and slope (π 1i ), as well as a level-1 error term (e ti ), which captures the variability of the data points about the respondents’ regression line. Time (t) is centered on its overall mean (t = 7.63 where t = 0 is calendar year 1990) to facilitate interpretation and reduce the correlation between the estimated intercepts and slopes. At level 2, the collection of individual intercepts and slopes are modeled by an average intercept (β 00 ) and slope (β 10 ) that describe the overall level of pollution (at t = 7.63 or between calendar years 1997 and 1998) for respondents and the overall linear change in pollution exposure for respondents during follow-up, respectively. This model also estimates the variability of the individual intercepts and slopes around the average intercept and slope (r 0i and r 1i ). In addition, each level-2 equation includes coefficients for race (β 01 and β 11 ) and the interaction between race and time (β 02 and β 12 ) to discern if there are differences in average intercept and slope for different racial/ethnic groups.
Building on this initial model, we then add our third level of clustering: metropolitan areas. Whereas our two-level model allowed for variation within and between individuals, we now split this variability by an additional factor, allowing us to distinguish variation in pollution exposure for individuals sharing the same metropolitan area from variation between individuals in different metropolitan areas. Extending our two-level model from above yields the following three-level model:

where the additional subscript, j, indexes metropolitan areas. At level 3, then, the average metropolitan area intercepts and slopes are modeled by overall averages (γ 000 , γ 010 , γ 020 , γ 100 , γ 110, and γ 120 ) and corresponding variance components (u 00j , u 01j , u 02j , u 10j , u 11j, and u 12j ) that capture the variability of the metropolitan area average intercepts and slopes around the overall averages for all metropolitan areas. The level-3 models reflect the addition of random slopes for race, time, and the race*time interaction, which allow these effects to vary across metropolitan areas. Finally, we add to this model controls for individual- and household-level characteristics and then metropolitan-level factors. Similar to time, all covariates were centered on their overall means.
RESULTS
Table 1 presents descriptive statistics, by race/ethnicity, for all of the variables in the analysis. These statistics point to racial/ethnic differences in several sociodemographic characteristics, but most important for our purposes are the substantial group differences in neighborhood exposure to all three pollutants. On average, the concentration of NO2 was 13.30 ppb in blocks occupied by White respondents compared to 16.47 ppb and 20.95 ppb for Black and Latino respondents, respectively. Exposures to PM show similar racial/ethnic differentials: Black and Latino respondents were exposed to neighborhoods in which average concentrations of PM2.5 and PM10 were between 7% and 32% higher than in areas occupied by White respondents.
Descriptive Statistics by Race-Ethnicy
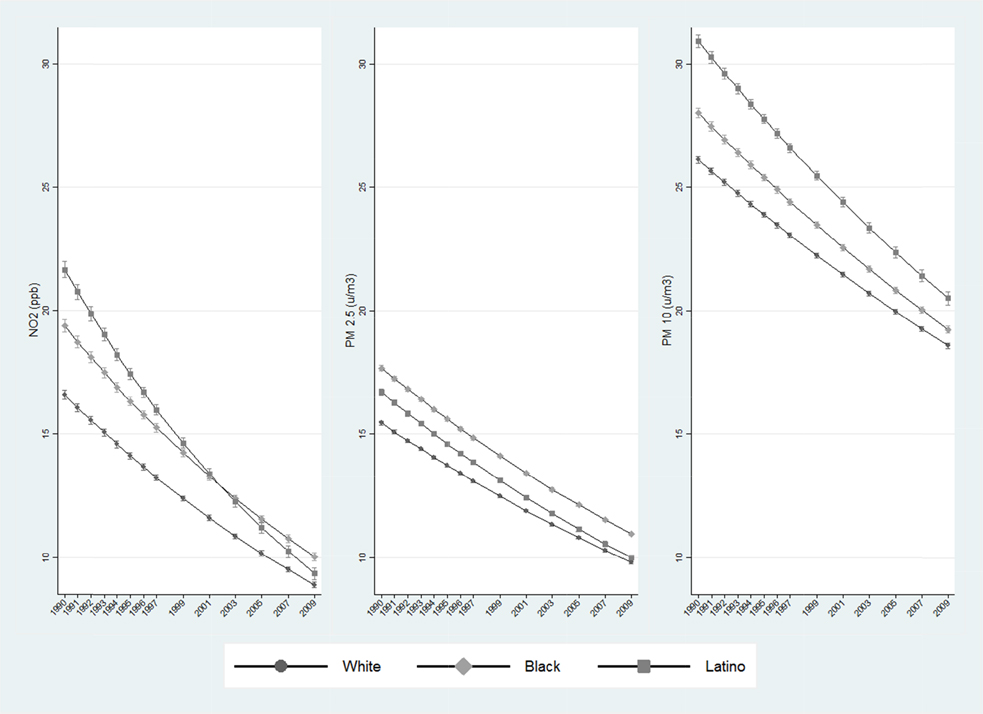
These results are largely consistent with past research using less precise measures of point-in-time industrial pollution (cf., Crowder and Downey, Reference Crowder and Downey2010), but provide more detailed information about exposure to specific pollutants with distinct social and health correlates. More importantly, our data provide an opportunity to examine group-specific changes in pollution exposure over time. These changes are displayed, for each pollutant separately, in Figure 1. While there are variations in the trends for different pollutants, a predominant pattern characterized by three important features is clear. First, average block-level concentrations of all three types of pollution declined substantially for all three racial/ethnic groups between 1990 and 2009. Second, these declines appear slightly more pronounced for black and, in particular, Latino respondents. Third, despite somewhat sharper declines in pollution for Blacks and Latinos than for Whites, substantial racial/ethnic differences in pollution exposure persisted, with Black and Latino respondents residing in blocks with higher concentrations of pollution than was found in Whites’ blocks even as of 2009.
Block-level exposure to NO2, PM2.5, and PM10, respectively, by race/ethnicity and time.
These racial/ethnic differences in levels and trends in pollution exposure are further quantified in Tables 2 through 4 which present repeated measures models predicting, respectively, NO2, PM2.5, and PM10. The first set of log-linear models (Model 1, Tables 2-4) shows that, on average, Blacks had 19.51% higher concentrations of NO2 (100*(exp(0.18)-1) = 19.51), 14.64% higher concentrations of PM2.5 (100*(exp(0.14)-1) = 14.64), and 7.21% higher concentrations of PM10 (100*(exp(0.07)-1) = 7.21) compared to Whites. On all three counts, the average environmental burden was even greater for Latinos: they had 51.29% higher concentrations of NO2 (100*(exp(0.41)-1) = 51.29), 15.63% higher concentrations of PM2.5 (100*(exp(0.15)-1) = 15.63), and 29.01% higher concentrations of PM10 (100*(exp(0.25)-1) = 29.01), on average, relative to Whites.
Racial-Ethnic Differences in Exposure to Block-Level NO2
Note: Block-level NO2 is log-transformed following the addition of a constant value of 1.
* p<0.05 **p<0.01 ***p<0.001.
Racial-Ethnic Differences in Exposure to Block-Level PM2.5
Note: Block-level PM2.5 is log-transformed following the addition of a constant value of 1.
* p<0.05 **p<0.01 ***p<0.001.
Racial-Ethnic Differences in Exposure to Block-Level PM10
Note: Block-level PM10 is log-transformed following the addition of a constant value of 1.
* p<0.05 **p<0.01 ***p<0.001.
In Model 2 of each table we introduce the two-level structure to assess changes in pollution exposure over time (variation across observations for the same individual) and racial differences in these exposure trajectories. Again, these results reinforce the notion of substantial race-specific change in neighborhood pollution exposure at the individual level. For example, the negative and statistically significant coefficient for time (β = -0.02, p < 0.001) in Model 2 of Table 4 indicates that for Whites (the reference category), the average concentration of PM10 declined by an average of about 1.69% per year (100*(exp(-0.02)-1) = 1.69) during the period between 1990 and 2009. For Black respondents, the average annual decline was 0.21% steeper (100*(exp(-0.002)-1) = 0.21) and for Latinos nearly 0.40% steeper (100*(exp(-0.004)-1) = 0.40) compared to Whites, or decreases of about 1.89% and just over 2% per year, on average, for Blacks and Latinos, respectively. While these racial/ethnic differences in the pace of decline in PM10 are substantively modest, they are statistically significant at greater than the 99% confidence level. This same general pattern holds true for the other pollutants as well. Thus, both Black and Latino respondents demonstrated measureable, albeit modest, movement towards closing the racial/ethnic gaps in air pollution exposure over time.
We turn now to the results of the three-level models designed to assess the extent to which racial differences in pollution exposure, and trends therein, are affected by the broader geographic context in which members of different racial/ethnic groups are located. Here we take advantage of the fact that our PSID respondents were dispersed across 733 metropolitan and micropolitan areas during the study period, with an average of 145 observations in each of these areas. We confirmed that the hierarchical model best suited for this analysis contained random effects at both the individual and metropolitan levels for both the intercept and a few slope parameters (i.e., time, race, and the race*time interaction); the p-value for the log-likelihood test comparing Models 2 and 3 was less than 0.001 in predicting each of the three pollutants.
Model 3 in Tables 2, 3, and 4 provides evidence of substantial variation in both the overall level of pollution and the effects of race on pollution across metropolitan areas. In all three tables, the random-effects components for the intercept and the slopes for Black and Latino are relatively large and statistically significant. The three-level random effects models show further attenuation of the overall racial inequality and differences in the rates of decline by race over time. That is, after accounting for variations across metropolitan areas, the average Black-White difference in NO2 was 13.68% (100*(exp(0.13)-1) = 13.68) at the average observation period (t = 7.63 or between calendar years 1997 and 1998), and the corresponding differences in PM2.5 and PM10 were 5.07% (100*(exp(0.05)-1) = 5.07) and 5.59% (100*(exp(0.05)-1) = 5.59), respectively. Allowing the intercept and slopes to vary across metropolitan areas also considerably reduced the estimated difference between Latinos and Whites on all three pollution outcomes (Model 2 vs. Model 3 of Tables 2-4).
Also important is the fact that accounting for between-metropolitan variation in levels of pollution and slopes on key variables diminished the estimated group differences in trajectories of pollution. For example, the steeper pace of decline in PM10 for Blacks (vs. Whites) observed in Model 2 was no longer statistically significant when the level-three random intercept and slopes were included. Similarly, the small differential declines in the other two pollutants for Blacks and across all three pollutants for Latinos (vs. Whites) were also attenuated, although they remained statistically significant (Model 3, Tables 2-4). Overall, this suggests that racial/ethnic differences in the pace of pollution decline over the two decades of the study were driven, at least in part, by the fact that members of different racial/ethnic groups were exposed to different metropolitan contexts.
In Model 4 of each of the tables we introduce individual- and household-level controls theoretically linked to pollution exposure. Of these, employment, marital status, and home ownership were most consistently associated with exposure to all three pollutants. Net of other variables in the models, spending a greater proportion of time unmarried and a greater proportion of time in rental housing were both associated with exposure to higher concentrations of pollutants in the neighborhood, whereas spending a greater share of time unemployed was linked, somewhat unexpectedly, to lower levels of pollution (perhaps because employed people tend to reside in closer proximity to their places of work which tend to be located in more polluted areas). More important, however, is the fact that controlling for these individual- and household-level conditions did little to explain the residual racial differences in average levels of pollution exposure or changes in this exposure over time. That is, comparing Model 4 and Model 3 in each table shows little difference in the coefficients for Black and Latino or their interactions with time.
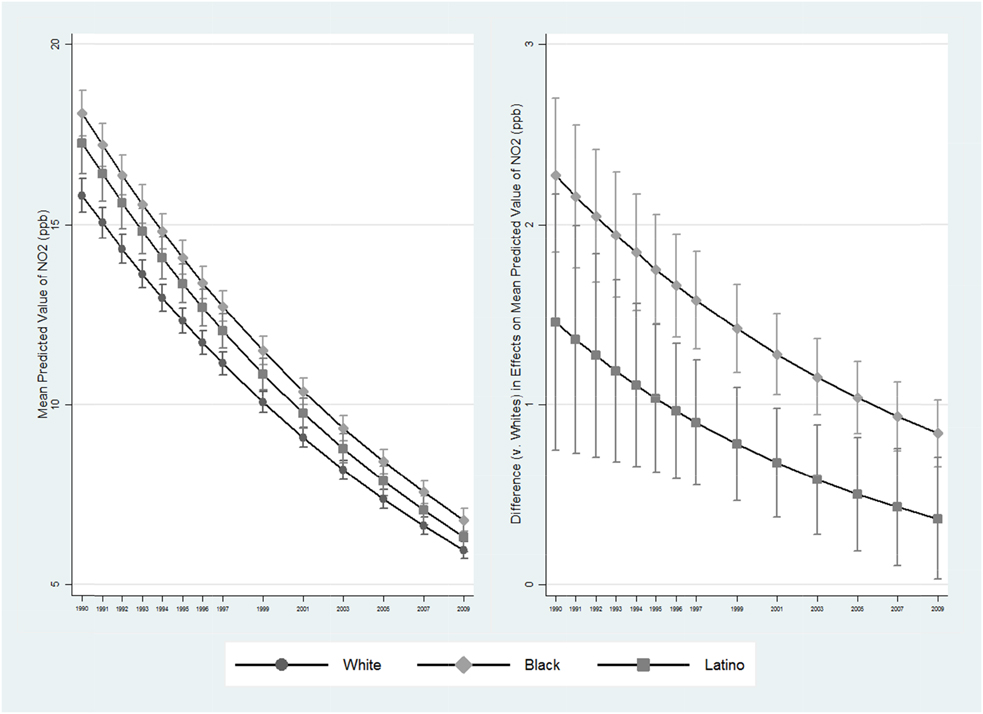
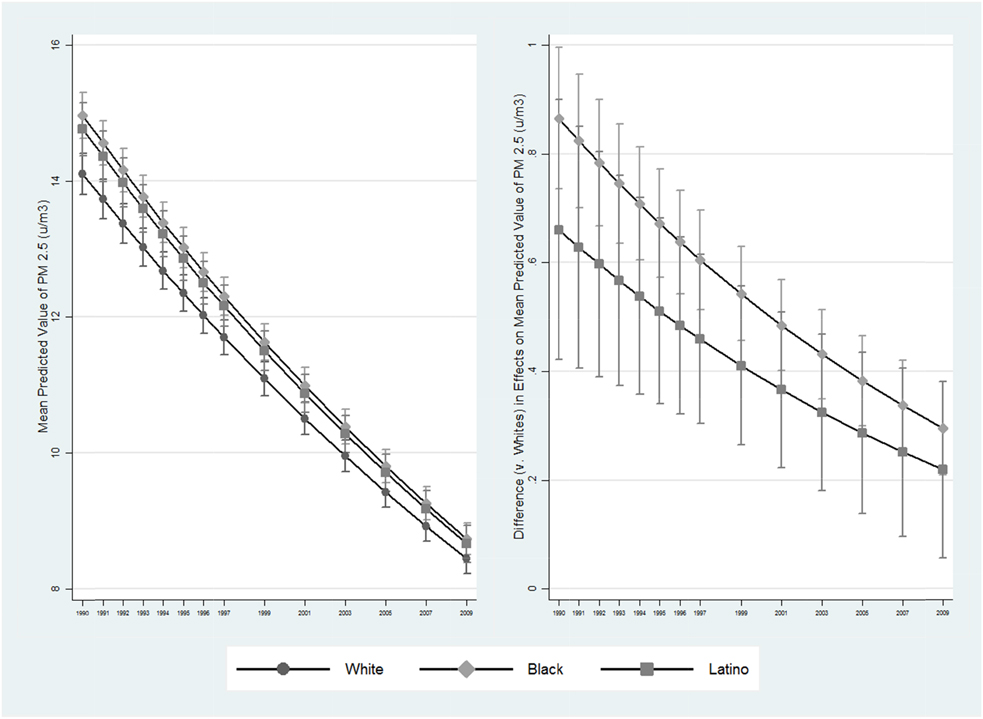
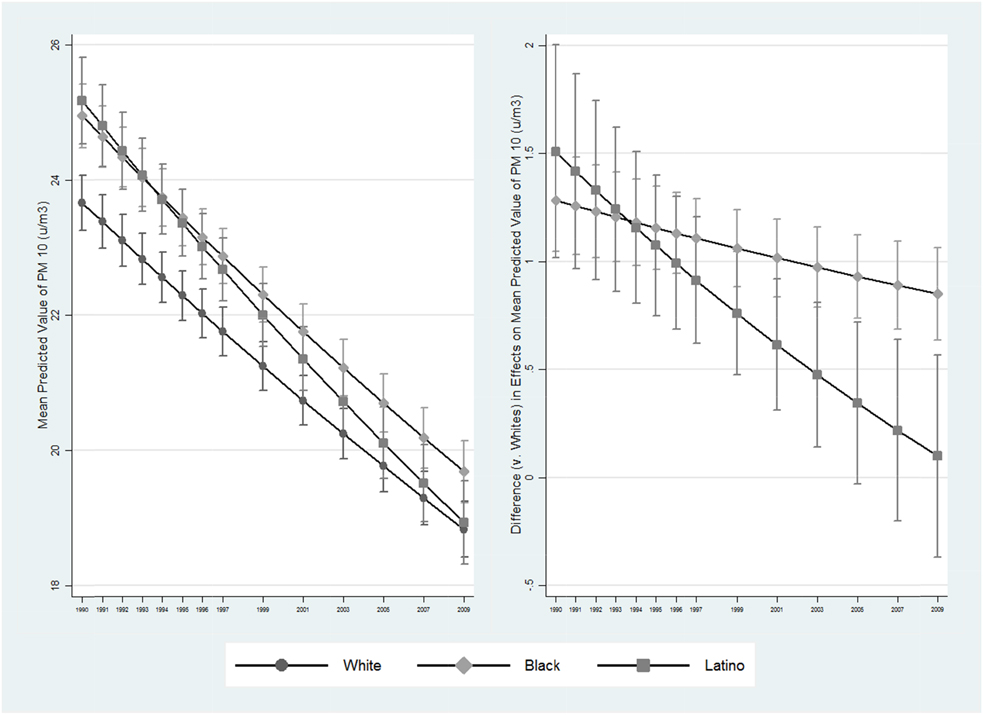
Similarly, the addition in Model 5 of controls for metropolitan-area characteristics does relatively little to change the magnitudes or significance levels of the overall racial differences or the racial differences in time trends in neighborhood air pollution. To be clear, the observed racial differences in pollution exposure persist across time even after individual- and household-level and metropolitan area characteristics are controlled. These findings are summarized in Figures 2 through 4, which depict mean predicted values and their 95% confidence intervals for NO2, PM2.5, and PM10, respectively, across time for Whites, Blacks, and Latinos (left side of figure), as well as differences in each of the mean predicted pollution levels between Whites (reflected at the horizontal zero line) and either Blacks or Latinos across time (right side of figure). All other covariates are set to their sample means. As just described and as the figures show, Blacks and Latinos are persistently exposed to higher levels of pollution than Whites, and although these differences (vs. Whites) tend to decrease over time, they remain statistically significant for all three pollutants at even the most recent time points among Blacks and for both NO2 and PM2.5 among Latinos, net of individual-, household-, and metropolitan-level factors.
Mean predicted value of and differences in NO2 by race/ethnicity and time.
Mean predicted value of and differences in PM2.5 by race/ethnicity and time.
Mean predicted value of and differences in PM10 by race/ethnicity and time.
The final, fully adjusted models (Model 5, Tables 2-4) further show that racial/ethnic inequality in NO2, our indicator of traffic-related air pollution, is greater than that observed for PM2.5 and PM10. Blacks had 12.94% higher (100*(exp(0.12)-1) = 12.94) and Latinos 7.31% higher (100*(exp(0.08)-1) = 7.31) concentrations of NO2 relative to Whites, on average, while the racial/ethnic differential was less than 5% for the other two pollutants. Moreover, the small but statistically significant steeper declines in PM2.5 (β = -0.001, p < 0.001) for Blacks and in PM10 for Latinos (β = -0.003, p < 0.01) remained evident, while there were no longer any differential declines in NO2 among Blacks or Latinos compared to Whites.
CONCLUSION
Understanding racial/ethnic differences in exposure to neighborhood air pollution is an important endeavor given strong evidence of deleterious impacts on social and health-related outcomes. Yet past research on this topic provides an incomplete picture of patterns of environmental inequality. The common use of aggregate-level data makes it difficult to conceptualize individual-level exposure or assess the roles of micro-level factors that affect differentials in exposure to pollution. The individual-level analyses that have been done in the past use rough measures of pollution, covering a relatively short timeframe, and have focused on either point-in-time estimates of pollution exposure or broad pollution trajectories for individuals. These studies, therefore, provide little information about how individual-level exposure to neighborhood air pollution, and racial differences therein, has changed over time or how it varies across metropolitan context.
Our goal in this paper has been to cast light on differences in exposure as a means to help set the agenda for studying the role of environmental inequality in shifting patterns of, and racial disparities in, health and well-being. We make use of a unique combination of data, containing precise and comprehensive estimates of Census-block pollution to which individuals were exposed at multiple points in time across almost two decades. We make full use of these data by estimating multilevel repeated measures models that allow us to assess racial/ethnic differences in pollution exposure and identify variations in this exposure across time and metropolitan areas.
Several important conclusions emerge from this analysis. First, as has been demonstrated in past research, there are substantial racial/ethnic differences in exposure to pollution across neighborhoods. Our research demonstrates that this environmental inequality operates down to the Census block level and across several distinct types of pollution, with Black and Latino individuals exposed to levels of NO2, PM2.5, and PM10 that are significantly higher than those experienced by Whites. Moreover, these racial/ethnic differences are apparent even among those individuals sharing the same metropolitan context and persist even after controlling for individual- and household-level factors that affect residential location.
Second, average levels of pollution have declined for all three racial/ethnic groups included in our data, but these declines have been slightly more pronounced for Blacks and Latinos than for Whites. Nevertheless, even after accounting for these racial and ethnic differences in the rates of decline in pollution exposure, racial disparities in average exposure remain sharp, even as of the most recent observation periods. Third, group differences in both average exposure and trends in exposure are attributable, in large measure, to group differences in broader metropolitan context. Black and Latino respondents faced higher concentrations of neighborhood pollution, but also more dramatic decreases in pollution, in part because they are concentrated in metropolitan areas in which pollution levels are higher but falling more rapidly than in those occupied by White respondents.
In light of these findings, two broad areas of future research seem particularly important. First, with the accumulation of evidence of pronounced and persistent racial/ethnic differences in exposure to neighborhood air pollution, it is important to turn our attention to the factors maintaining racial and ethnic disparities. Here, an important goal will be to disentangle the relative importance of several forces that likely shape racial and ethnic differences in pollution exposure, including: racially-distinct patterns of individual mobility between more- and less-polluted neighborhoods; processes of neighborhood change or stagnation affecting pollution exposure for those who do not move; and patterns and drivers of change in sources of pollution, including more discerning measures of industrial composition, across space that, given sharp differences in the racial and ethnic composition of metropolitan areas, have racially disparate impacts on overall and pollutant-specific environmental burden.
Perhaps more important will be continued, multidisciplinary efforts to assess the repercussions of these persistent environmental inequalities for racial and ethnic disparities in social and health-related outcomes. The consistency and persistence of the patterns highlighted in our work suggest that racial and ethnic differences in exposure to neighborhood air pollution are likely an important source of persistent racial and ethnic disparities in health and well-being at the population level. Moreover, the fact that a relatively small portion of the overall variation in pollution exposure is attributable to changes across time for individuals suggests persistent, long-term exposure for some individuals across substantial periods of time. Theoretically, this long-term exposure is likely to be much more detrimental to individual health and well-being than short doses of exposure. Understanding the implications of this long-term exposure on social and health outcomes, and racial/ethnic differences therein, as well as how environmental, behavioral, and biological determinants of health and well-being coalesce in relation to space and time (cf., Jacquez et al., Reference Jacquez, Sabel and Shi2015) are crucial ongoing endeavors.
ACKNOWLEDGMENT
This research was supported by an individual grant to KC (R01 HD078501) and an infrastructure grant to the University of Washington’s Center for Studies in Demography and Ecology (R24 HD042828) from the Eunice Kennedy Shriver National Institute of Child Health and Human Development. Anjum Hajat was also supported by a NIH Career Development Award (K99 ES 023498) from the National Institute of Environmental Health Sciences.


