


1. Introduction
Mass political participation is an essential component in the functioning of democracy (Verba and Nie, Reference Verba and Nie1972: 3–4). Among various forms of participation, voting is often considered a key mechanism for democratic accountability. Why are some voters more likely to turn out to vote than others? Some previous studies adopt a rational choice perspective and argue that the decision to vote depends on how citizens weigh expected benefits, civic duty, and the costs of participation (Riker and Ordeshook, Reference Riker and Ordeshook1968; Blais, Reference Blais2000). More recent research further suggests that turnout decisions are shaped by civic duty and preference strength and that these motivations may interact (Blais and Achen, Reference Blais and Achen2019). Other scholars emphasize the importance of cognitive mobilization and explain voting behaviour in terms of educational attainment, political interest, and political knowledge (Dalton and Wattenberg, Reference Dalton and Wattenberg2002; Schlozman, et al., Reference Schlozman, Verba and Brady2012). A large body of research also demonstrates that education has a substantial impact on turnout. The finding is supported by randomized and quasi-experimental evidence (Sondheimer and Green, Reference Sondheimer and Green2010), cross-national analyses of relative educational attainment (Persson, Reference Persson2013), and studies using aggregate-level data on higher education expansion (Hansen, Reference Hansen2025). In addition, scholars who take a social-psychological approach suggest that party identification affects not only vote choice but also decision to participate in elections. Specifically, voters with stronger party identification are generally more likely to vote (Campbell et al., Reference Campbell, Converse, Miller and Stokes1960: 98).
The civic voluntarism model provides an important perspective for explaining turnout (Verba et al., Reference Verba, Schlozman and Brady1995), and it has received support from various empirical studies. This model posits that voters with party identification are more likely to vote than those without party identification (Verba and Nie, Reference Verba and Nie1972: 223; Cassel and Hill, Reference Cassel and Hill1981; Abramson and Aldrich, Reference Abramson and Aldrich1982; Tsai, Reference Tsai2001; Clarke et al., Reference Clarke, Sanders, Stewart and Whiteley2004: 253–254; Wu and Liu, Reference Wu, Liu, Achen and Wang2017). From a macro-level perspective, some research has found that the long-term decline in voter turnout in the United States is related to the decreasing strength of party identification (Rosenstone and Hansen, Reference Rosenstone and Hansen1993; Bartels, Reference Bartels2000). However, other studies suggest that the effect of party identification strength on the likelihood of voting is rather limited (Silver, Reference Silver1973: 121; Petrocik, Reference Petrocik1974; Ashenfelter and Kelley, Reference Ashenfelter and Kelley1975). These mixed findings indicate that the relationship between party identification and voter turnout remains inconclusive and deserves further investigation. Recent scholarship has also examined the relationship between ambivalence and turnout. The main argument is that when voters simultaneously hold positive evaluations of competing parties and perceive little difference between them, the utility of voting declines, which may lead to abstention (Lavine, Reference Lavine2001; Lavine et al., Reference Lavine, Johnston and Steenbergen2012; Groenendyk, Reference Groenendyk2019). Additional research shows that the effect of ambivalence on turnout varies across institutional contexts. More specifically, ambivalence has a stronger demobilizing effect in polarized societies, parliamentary systems, countries with voluntary voting, and party systems with lower levels of fragmentation (Çakır, Reference Çakır2022).
Unlike ambivalence, which is rooted in balanced evaluations of competing parties, the conflicted voter framework focuses on the tension between partisan identity and candidate preference. Building on this distinction, this paper draws on Weisberg and Grofman (Reference Weisberg and Grofman1981) and Bourgeois-Gironde and Ferreira (Reference Bourgeois-Gironde and Ferreira2020) to argue that psychological tension arises when a voter’s partisan identification does not match the party affiliation of their preferred candidate. If the tension cannot be reconciled, electoral participation itself becomes psychologically burdensome.
In this study, we hypothesize that conflicted voters, defined as those whose partisan identification does not align with their candidate preference, are less likely to turn out than consistent voters. Rather than focusing on the interaction between the strength of party identification and the gap in candidate evaluations, we emphasize alignment, namely, whether a voter’s partisan identification matches the party affiliation of the candidate he or she prefers. This distinction is central to our theoretical argument because it allows us to examine the psychological tension that arises when partisan identity and the party affiliation of the preferred candidate do not match, and how this tension affects turnout.
This paper makes two main contributions. First, using pooled survey data from the Taiwan Election and Democratization Study (TEDS) for Taiwan’s presidential elections from 2008 to 2024, our binary logistic regression results demonstrate that conflicted voters are less likely to turn out to vote. The empirical finding contributes to the literature on political behaviour in Taiwan and suggests that conflicted voter status should be incorporated into future studies of voter turnout. Second, this paper also carries practical implications for party politics. The empirical results suggest that political parties should pay closer attention to conflicted voters in closely contested elections. This point is especially important in closely contested elections, where turnout differences among a small segment of the electorate can have notable political consequences.
2. Theory and hypotheses
2.1. Party identification and voter turnout
Many previous studies show that voters with stronger partisan attachments tend to display higher levels of political interest, and thus, they are more actively involved in political life (Miller and Shanks, Reference Miller and Shanks1996: 154–156; Conway, Reference Conway2000: 52–5). Within the civic voluntarism framework, party identification is understood as an important attitudinal resource that encourages citizens to participate in politics (Verba et al., Reference Verba, Schlozman and Brady1995: 269) and helps explain patterns of voter turnout (Clarke et al., Reference Clarke, Sanders, Stewart and Whiteley2004: 226–227). Compared with independents or voters who lack a clear partisan attachment, individuals who identify with a political party are more likely to seek out political information, discuss political issues with others, and take part in campaign-related activities (Wu and Liu, Reference Wu, Liu, Achen and Wang2017: 254). These forms of engagement, in turn, increase their likelihood of voting.
The argument that party identification helps explain voter turnout has received broad empirical support (Verba and Nie, Reference Verba and Nie1972: 223; Cassel and Hill, Reference Cassel and Hill1981; Abramson and Aldrich, Reference Abramson and Aldrich1982; Tsai, Reference Tsai2001; Clarke et al., Reference Clarke, Sanders, Stewart and Whiteley2004: 253–254; Wu and Liu, Reference Wu, Liu, Achen and Wang2017). However, other studies report more limited or inconsistent effects of partisan strength on turnout (Silver, Reference Silver1973: 121; Petrocik, Reference Petrocik1974; Ashenfelter and Kelley, Reference Ashenfelter and Kelley1975; Franklin, Reference Franklin2004). In this sense, the existing literature suggests that the effect of party identification on the likelihood of voter turnout remains inconclusive and requires further investigation.
Much of the existing research on voting behaviour implicitly assumes that partisans tend to prefer the candidate nominated by their own party. From the perspective of conflicted voter theory, however, this assumption does not necessarily hold. When a voter’s party identification does not align with the party affiliation of the candidate he or she prefers, internal conflict may arise and affect the decision to turn out. Since the behaviour of such conflicted voters has received limited attention, this study examines how alignment or misalignment between a voter’s party identification and the party affiliation of the preferred candidate shapes turnout.
2.2. Conflicted voter theory
Research on political attitudes has long shown that voters do not always hold internally consistent views across different political aspects or issue positions (Conover and Feldman, Reference Conover and Feldman1981; Tetlock, Reference Tetlock1986; Treier and Hillygus, Reference Treier and Hillygus2009; Rudolph, Reference Rudolph2011), and such inconsistency shapes political behaviour (Markus and Converse, Reference Markus and Converse1979; Grofman and Kline, Reference Grofman and Kline2010; Lin and Tsai, Reference Lin and Tsai2014). When a voter’s partisan identification does not align with the party affiliation of their preferred candidate, their turnout behaviour may differ from that of voters whose partisan identification and candidate preference are aligned. From a rational choice perspective, participation is more likely when voters perceive clear and meaningful differences between the major parties. In contrast, when voters see little distinction between candidates, or hold negative evaluations of both, the expected benefits of voting may not outweigh the costs, which may lead them to abstain (Brody and Page, Reference Brody and Page1973).
Building on the theoretical perspective of Brody and Page (Reference Brody and Page1973), Weisberg and Grofman (Reference Weisberg and Grofman1981) identify additional situations that may discourage turnout. These include cases in which voters hold favourable evaluations of both major-party candidates or identify with one party while preferring the candidate nominated by the opposing party. Bourgeois-Gironde and Ferreira (Reference Bourgeois-Gironde and Ferreira2020) develop a game-theoretic model of voter turnout and introduce the concept of the ‘conflicted voter’s curse’. This concept is based on the assumption that voters display ‘betrayal aversion’, that is, a reluctance to act against the political party with which they identify. Psychological tension arises when a voter supports candidates nominated by a party different from the one with which the voter identifies. Conflicted voters then face two forms of regret. One results from action, namely voting for a candidate from the opposing party and thereby violating their partisan identity. The other results from inaction, namely choosing not to vote. Since regret resulting from deliberate action tends to be more intense than regret associated with inaction, conflicted voters may consider abstention as the less psychologically costly option (Bourgeois-Gironde and Ferreira, Reference Bourgeois-Gironde and Ferreira2020: 365). As a result, even voters who possess characteristics typically associated with higher turnout, such as political interest and partisan motivation, may choose to abstain.
While voters may try to reduce this tension through self-rationalization, such efforts are often less effective in political environments where partisan and ideological boundaries are highly salient. Existing research shows that ideological and partisan polarization tends to increase voter turnout because it sharpens political distinctions and heightens the perceived stakes of elections (Hetherington, Reference Hetherington, Nivola and Brady2008; Moral, Reference Moral2017; Béjar et al., Reference Béjar, Moraes and López-Cariboni2020). Many studies also find that affective polarization encourages voter turnout by motivating voters to support their own party or oppose a disliked out-party (Ward and Tavits, Reference Ward and Tavits2019; Bankert, Reference Bankert2021; Harteveld and Wagner, Reference Harteveld and Wagner2023). For conflicted voters, however, affective polarization may have a different impact. In contexts where affective polarization is strong, voters tend to develop more negative feelings toward the opposing party, which increases the psychological cost of acting against their partisan identity. If such voters prefer a candidate from the opposing party, supporting that candidate may be perceived as an act of betrayal. Therefore, higher levels of affective polarization are likely to amplify the psychological pressure associated with betrayal aversion and, in turn, increase the likelihood of abstention among conflicted voters.
To sum up, we argue that party identification does not uniformly encourage turnout. Its association with turnout depends on whether a voter’s partisan identity aligns with the party affiliation of the candidate he or she prefers. For conflicted voters in contexts with strong levels of affective polarization, abstention may be seen as the less costly behavioural option because it helps avoid the psychological tension associated with betrayal aversion. Accordingly, we hypothesize that voters whose partisan identification does not align with the party affiliation of their preferred candidate are less likely to vote.
3. Case selection and research design
3.1. Why study conflicted voters in Taiwan?
Taiwan provides an especially suitable context for examining the mechanism proposed by conflicted voter theory. Existing studies show that Taiwanese voters who report some degree of party identification, regardless of which party they support, are consistently more likely to participate in elections than those with no partisan attachment (Tsai, Reference Tsai2001; Shiao, Reference Shiao2009; Wu and Liu, Reference Wu, Liu, Achen and Wang2017: 258).Footnote 1 Yu (Reference Yu, Achen and Wang2017) further finds that independents and partisan learners show lower turnout rates than voters with clear and stable partisan identities. Although prior research on voting behaviour in Taiwan emphasizes the role of party identification in shaping electoral participation, to the best of our knowledge, no study has examined voter turnout from the perspective of conflicted voters.
In addition, Taiwan is characterized by a distinctive pattern of political polarization. In many Western democracies, ideological polarization is structured mainly along left–right economic dimensions. In Taiwan, by contrast, political competition has long centred on the issue of national identity, particularly the unification–independence divide (Tsai et al., Reference Tsai, Hsu and Huang2007; Hsiao and Cheng, Reference Hsiao and Cheng2014). Beyond issue-based polarization, affective polarization also plays a significant role in shaping Taiwanese voters’ political attitudes. Existing studies show that partisans in Taiwan hold increasingly negative views toward rival parties and their supporters (Hsiao, Reference Hsiao2014, Reference Hsiao2019), and such affective polarization is related to presidential vote choice (Lee and Chang, Reference Lee and Chang2022).
Taiwan’s electoral context also offers important analytical advantages for identifying conflicted voter behaviour. Since the first direct presidential election in 1996, Taiwanese presidential contests have largely been dominated by two major political camps, with only the 2000 and 2024 elections featuring relatively competitive third-party candidates. Turnout in these elections has remained consistently high, often exceeding 75 percent. Although Taiwan does not permit absentee voting and participation may therefore involve certain logistical costs, the country’s consistently high turnout suggests that non-participation is likely to reflect voters’ meaningful decision rather than institutional exclusion. Moreover, major parties in Taiwan use primary systems that allow participation by non-party members. The Democratic Progressive Party (DPP) adopted this system in 2011, while the Kuomintang (KMT) followed in 2015. This institutional feature makes it more likely that parties nominate candidates who are not the most preferred choice of their partisan base. As a result, voters may face a genuine tension between partisan loyalty and candidate preference. These institutional settings discussed above therefore allow us to assess more clearly whether voters whose partisan identification conflicts with their preferred candidate still turn out to vote or instead withdraw from participation.
Data from the Taiwan Election and Democratization Study (TEDS) for presidential elections from 2008 to 2024 show that conflicted voters account for about 5.1 percent of the electorate in Taiwan. Although this group is relatively small, it may still matter in highly competitive two-candidate elections, where even modest changes in turnout can affect the electoral results. In short, Taiwan’s polarized political climate, inclusive primary institutions, and consistently high-turnout environment make it a particularly suitable case for examining how internal partisan conflict shapes voter turnout.
3.2. Operationalization of variables
To test the hypothesis regarding conflicted voters, this study focuses on five presidential elections in Taiwan from 2008 to 2024. The primary reason for concentrating on presidential elections is that the presidency represents the highest level of elected office in Taiwan. Unlike legislative or local executive elections, where candidates vary by electoral district, presidential candidates are the same nationwide. This uniformity makes presidential elections particularly suitable for analysing voter behaviour across the entire electorate.
We draw on data from the TEDS surveys, which are based on independent nationwide samples and were administered through face-to-face interviews after each presidential election. The fieldwork was conducted between January and May following the election year, depending on the survey wave. The numbers of observations used in this study for the 2008, 2012, 2016, 2020, and 2024 elections are 1,197, 1,141, 986, 1,181, and 1,068, respectively.
Coding schemes of all variables used in the empirical models of this study are shown in Appendix 1. The dependent variable in this study is self-reported turnout in the presidential election of the corresponding year. Respondents who indicated that they voted are coded as 1, while those who did not vote are coded as 0. Cases with no response are treated as missing values and excluded from the analysis.Footnote 2 It is worth noting that overreporting of voter turnout in survey data is common in studies of electoral participation. As noted by Chang et al. (Reference Chang, Hsu and Juang2019: 56), this may be related to implementation issues during the interview process. Another possible explanation is that some respondents who did not vote may nonetheless report having voted due to social desirability bias, which tends to inflate self-reported turnout (Karp and Brockington, Reference Karp and Brockington2005; Holbrook and Krosnick, Reference Holbrook and Krosnick2010; Tsai, Reference Tsai2010).
In this study, it is possible that some respondents underreport turnout in order to avoid revealing behaviour that conflicts with their partisan identification or candidate evaluations. However, such strategic misreporting is more likely to occur in questions about vote choice rather than voter turnout. To the extent that measurement error remains, it would more likely attenuate, rather than exaggerate, the observed difference in turnout between conflicted and consistent voters. Accordingly, the estimated association between partisan–candidate incongruence and turnout should be interpreted conservatively.
The key independent variable captures whether a voter’s partisan identification aligns with the party affiliation of their preferred presidential candidate. This variable is constructed based on the combination of partisan identification and candidate preference, following the coding strategies used by Grofman and Kline (Reference Grofman and Kline2010) and Lin and Tsai (Reference Lin and Tsai2014). For partisan identification, we rely on the survey item that asks whether the respondent tends to support a particular political party. If the respondent answers ‘yes’, a follow-up question asks which party they identify with; this information is used to determine partisan affiliation. Respondents who answer ‘no’ are treated as having no party identification. In this study, we classify party identification into four categories: Pan-Blue, Pan-Green, Taiwan People’s Party (TPP), and nonpartisans. The Pan-Blue camp includes the KMT, People First Party (PFP), New Party, joint KMT–PFP responses, and general references to the ‘Pan-Blue’ camp. The Pan-Green camp includes the DPP, Taiwan Solidarity Union (TSU), New Power Party (NPP), Taiwan Independence Party (TIP), and general references to the ‘Pan-Green’ camp.Footnote 3 Voters who identify with other parties that cannot be clearly classified as either Pan-Blue or Pan-Green are excluded from the empirical analysis.Footnote 4
For the coding of candidate preference, we use respondents’ feeling thermometer ratings of the presidential candidates nominated by the KMT and the DPP as an indicator of candidate favourability.Footnote 5 For elections from 2008 to 2020, we calculate the difference between a respondent’s rating of the KMT presidential candidate and their rating of the DPP candidate. A positive value indicates a preference for the KMT candidate; a value of zero indicates equal evaluations of both candidates and is thus coded as an indifferent candidate preference; a negative value indicates a preference for the DPP candidate. The coding strategy differs for the 2024 election because the TPP also nominated a presidential candidate. In this case, we compare respondents’ ratings of all three major candidates. If one candidate receives the unique highest score, the respondent is coded as preferring that candidate. If two or more candidates share the highest score, the respondent is coded as having an indifferent candidate preference. Although the PFP nominated James Soong in the 2012, 2016, and 2020 elections, his electoral support was much lower than that of the KMT and DPP candidates, and very few respondents reported voting for him. We therefore limit the candidate preference measure for the 2008–2020 elections to the KMT and DPP candidates. By contrast, the inclusion of the TPP candidate in 2024 is warranted, as the TPP received 26.46 percent of the presidential vote, making it a meaningful third option in that election.
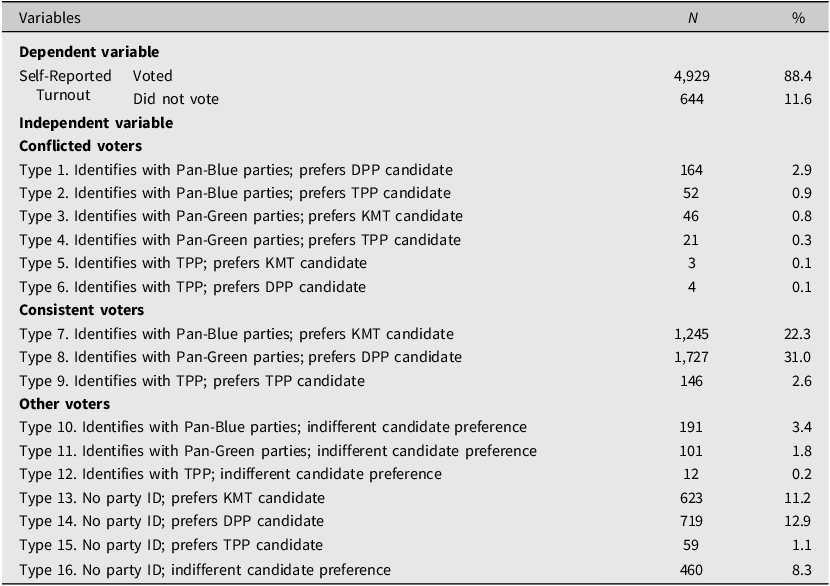
In short, this study classifies party identification into four categories: Pan-Blue, Pan-Green, TPP, and nonpartisans. Candidate preference is also divided into four categories: preference for the KMT candidate, preference for the DPP candidate, preference for the TPP candidate, and indifferent candidate preference. Combining these classifications, and following the coding strategies of Grofman and Kline (Reference Grofman and Kline2010) and Lin and Tsai (Reference Lin and Tsai2014), we categorize voters into 16 distinct types based on the alignment between party identification and candidate preference (see Table 1).
Descriptive statistics of dependent variable and independent variables

Source: TEDS 2008P, TEDS 2012, TEDS 2016, TEDS 2020, TEDS 2024, and authors’ calculations.
Note: The total sample size is 5,573, derived from the merged dataset after excluding incomplete cases. Only observations without missing values were retained.
In addition to the key independent variable measuring voter type, the empirical model also includes a set of control variables known to be associated with voter turnout. First, the demographic factors that we control for are gender (Baldez, Reference Baldez2011; Kostelka et al., Reference Kostelka, Blais and Gidengil2019), age (Fieldhouse et al., Reference Fieldhouse, Tranmer and Russell2007; Goerres, Reference Goerres2007; Bhatti et al., Reference Bhatti, Hansen and Wass2012; Tsui and Wu, Reference Tsui and Wu2011), and ethnicity. Age is measured using generational cohorts as the main indicator (Wass, Reference Wass2007; Smets, Reference Smets2012; Smets and Neundorf, Reference Smets and Neundorf2014). We use equal intervals between cohorts to minimize within-group heterogeneity and allow for more valid age-based comparisons. In addition, we include period indicators for the five election years (2008, 2012, 2016, 2020, and 2024). By including both cohort and period variables, we account for age effects while also mitigating potential multicollinearity issues (Yang and Land, Reference Yang and Land2013).
Beyond demographic variables, the model also incorporates other control variables drawn from theoretical frameworks on political participation, particularly those summarized by Clarke et al. (Reference Clarke, Sanders, Stewart and Whiteley2004). Following the civic voluntarism model (Verba et al., Reference Verba, Schlozman and Brady1995), we consider that individuals’ social background and life experiences is associated with the resources and skills they acquire to understand and engage in politics, which in turn shape their attitudes toward political participation. Based on this framework, we include educational attainment level (Hillygus, Reference Hillygus2005; Tenn, Reference Tenn2007; Campbell, Reference Campbell2009; Gallego, Reference Gallego2010), political efficacy (Campbell et al., Reference Campbell, Gurin and Miller1954; Balch, Reference Balch1974), political knowledge, and political discussion as control variables.
In addition, prior research suggests that individuals’ assessments of the government performance (Campbell et al., Reference Campbell, Converse, Miller and Stokes1960; Key, Reference Key1966; Gomez and Hansford, Reference Gomez and Hansford2015) and national economy (Wolfinger and Rosenstone, Reference Wolfinger and Rosenstone1980; Rosenstone, Reference Rosenstone1982) are associated with political participation. Accordingly, we control for: 1) voters’ satisfaction with the president and 2) their perceptions of economic conditions. Finally, incorporating findings from election research in Taiwan, we control for the unification–independence stance (Wu and Tan, Reference Wu and Tan2005; Tsai, Reference Tsai2007).Footnote 6
3.3. Estimation techniques
Given that the dependent variable in this study is binary, we employ binary logistic regression models to examine the association between conflicted voter status and voter turnout. To facilitate interpretation, we report average marginal effects (AMEs). The AMEs are computed by first calculating the marginal effect for each observation while holding all other covariates at their observed values. These individual effects are then averaged across all observations. As a result, the reported estimates reflect the average effect over the empirical distribution of covariates in the sample rather than effects evaluated at a specific set of covariate values. The functional form used to estimate the relationship between conflicted voter status and turnout is as follows: $\ln \left( {{{{\rm{Turned}}\;{\rm{out}}} \over {Not\;turned\;out}}} \right) = {\alpha _i} + {\beta _1}{x_{Types\;of\;voters}} + {{\beta _n}{x_{Other\;covariates}}} + {\varepsilon _i}$
In terms of analytical strategy, this study first estimates a pooled cross-year model using survey data from five presidential elections to examine the generalizability of the conflicted voter hypothesis. In this model, we include period dummy variables to account for potential year-specific effects associated with each wave of the survey. Second, we conduct separate model estimations for each individual survey year to further assess whether the theoretical expectations receive consistent empirical support across different subsamples.
In addition, because conflicted voters as defined in this study are not randomly assigned, they may systematically differ from other types of voters in observable characteristics. To enhance comparability and provide more rigorous empirical evidence, we implement propensity score matching (PSM) to analyse our data as a robustness check. By matching conflicted and consistent voters on relevant covariates, we aim to reduce potential selection bias and assess whether the observed association remains substantively robust.
4. Empirical analysis
Table 1 reports the descriptive statistics for the dependent and independent variables used in this study. Descriptive statistics for the control variables are reported in Appendix 2. In the sample, approximately 88.4 percent of respondents reported having voted.
Based on the conflicted voter framework, we classify respondents into three types of voters. First, the category of ‘consistent voters’, defined as those whose party identification aligns with the party affiliation of their preferred candidate, forms the largest group. Specifically, 22.3 percent of respondents identified with a Pan-Blue party and preferred the KMT candidate, while 31.0 percent identified with a Pan-Green party and preferred the DPP candidate. Together, these consistent voters account for 55.9 percent of the sample.
Second, the category of ‘conflicted voters’, defined as those whose party identification does not align with the party affiliation of their preferred candidate, makes up about 5.2 percent of respondents. This category includes Pan-Blue identifiers who preferred the DPP candidate (2.9 percent) or the TPP candidate (0.9 percent), Pan-Green identifiers who preferred the KMT candidate (0.8 percent) or the TPP candidate (0.3 percent), and TPP identifiers who preferred either the KMT or DPP candidate (0.1 percent each). Last, the remaining 38.9 percent of respondents fall into the category of ‘other voters’, which includes those without a party identification or without a clear candidate preference.
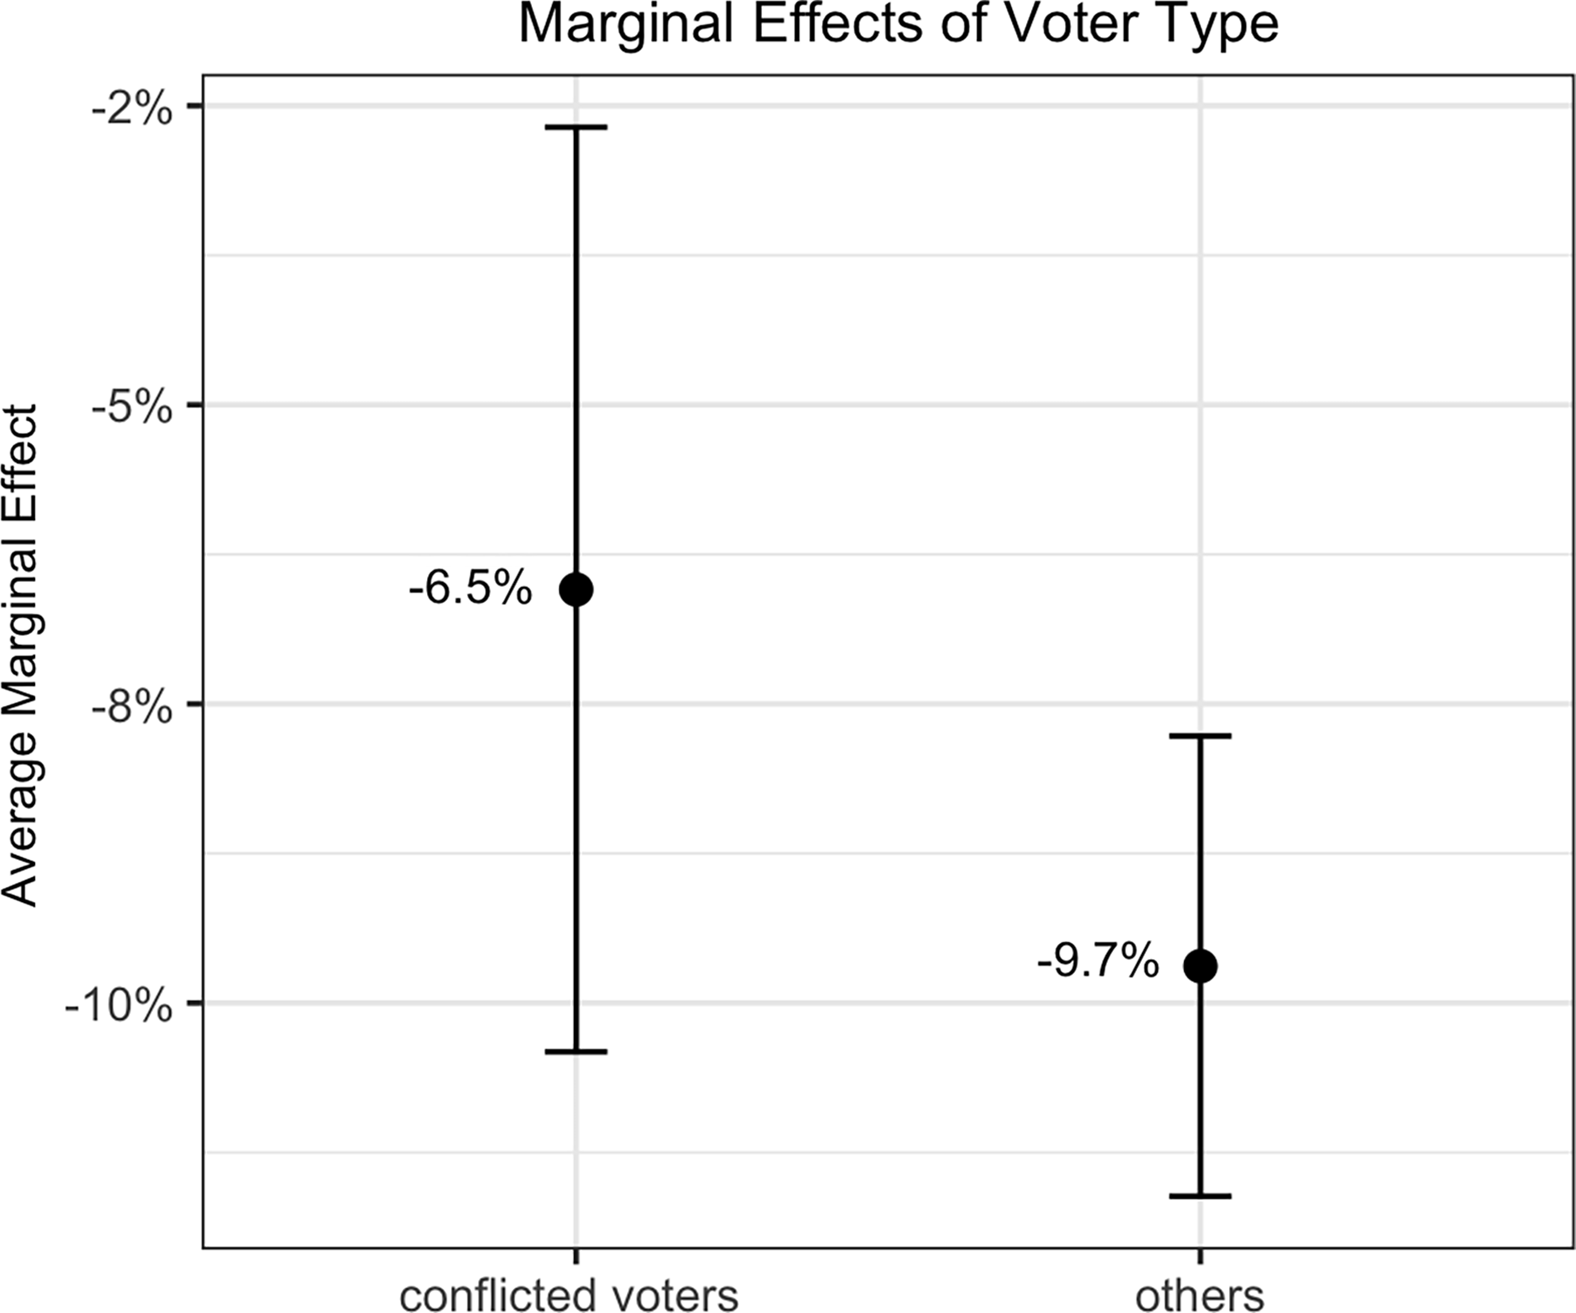
Table 2 presents the results from the pooled cross-year analysis using data from the 2008, 2012, 2016, 2020, and 2024 presidential elections (N = 5,573). Using the category of ‘consistent voters’ as the reference group, the results show that, holding all other variables constant, the category of ‘conflicted voters’ is less likely to turn out to vote, and the difference is statistically significant. According to the AMEs shown in Figure 1, the probability of voting is 6.5 percentage points lower for conflicted voters, compared to consistent voters. This evidence supports the conflicted voter hypothesis proposed in this study.
Binary logistic regression analysis of conflicted voters and turnout
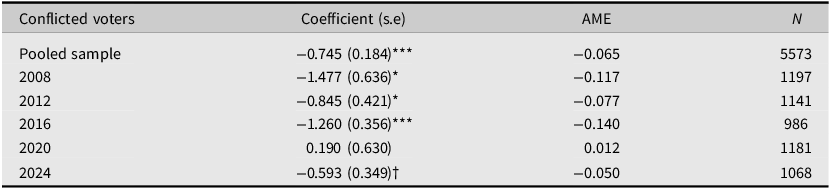
Source: TEDS 2008P, TEDS 2012, TEDS 2016, TEDS 2020, TEDS 2024, and authors’ calculations.
Notes: The dependent variable is self-reported voter turnout (1 = voted, 0 = did not vote). Coefficients are estimated using logistic regression models. Standard errors are reported in parentheses.
†P < 0.1; *P < 0.05; **P < 0.01; ***P < 0.001. Estimates shown are for the main independent variable only; results for full models are reported in Appendices 4–9.
Marginal effects of voter type on turnout.
Source: TEDS 2008P, TEDS 2012, TEDS 2016, TEDS 2020, TEDS 2024, and authors’ calculations.

When the models are estimated separately for each election year, the results are largely consistent with the findings from the pooled analysis. Specifically, the results from the 2008, 2012, 2016, and 2024 elections all show that conflicted voters are significantly less likely to vote than consistent voters. The results suggest that, during the KMT’s return to power in the 2008 election following the first partisan alternation, as well as during Ma Ying-jeou’s successful re-election in 2012, conflicted voters tended to abstain. Similarly, in the 2016 election, which marked the DPP’s political comeback, conflicted voters again demonstrated lower turnout. Even in the 2024 election, in which three competitive candidates each receiving over one-quarter of the vote, conflicted voters remained less likely to vote, indicating the consistency of our cross-year findings.
In our empirical analyses, the only exception for the voting behaviour of conflicted voters appears in the 2020 election, during which President Tsai Ing-wen won re-election. The difference in voter turnout between conflicted voters and consistent voters did not reach statistical significance. This evidence may be attributed to the presence of a populist challenger and the unexpected mobilizing effect of the Hong Kong protest movement, both of which contributed to a highly competitive election environment for voter mobilization. Moreover, it is also possible that Tsai Ing-wen’s strong re-election momentum may have encouraged some conflicted voters – such as those who identified with the KMT but preferred Tsai – to still turn out to vote.
In fact, according to our dataset for the 2020 election, 43 respondents identified with the KMT but preferred Tsai Ing-wen, and 40 of them reported voting. Additionally, two respondents identified with the DPP but preferred Han Kuo-yu, and both voted. While these observations should be interpreted with caution – since our regression model controls for multiple factors and does not rely on bivariate analysis – they nonetheless offer some evidence that, in the 2020 election, conflicted voters were not particularly likely to abstain.
In addition to the results for the main independent variables, we find that voters categorized as ‘other voters’ are significantly less likely to vote than consistent voters. This pattern is statistically significant across all models reported in Appendices 4–9. Although the ‘other voters’ category includes both nonpartisans and a small number of voters who report indifference or lack of clear preference, the lower turnout observed for this group is broadly consistent with previous findings that voters without stable partisan attachments tend to participate at lower rates (Verba and Nie, Reference Verba and Nie1972: 223; Cassel and Hill, Reference Cassel and Hill1981; Abramson and Aldrich, Reference Abramson and Aldrich1982; Tsai, Reference Tsai2001; Clarke et al., Reference Clarke, Sanders, Stewart and Whiteley2004: 253–254; Wu and Liu, Reference Wu, Liu, Achen and Wang2017).
Moreover, we find that respondents interviewed in the 2012, 2016, 2020, and 2024 TEDS face-to-face surveys are less likely to vote than those surveyed in 2008 (see Appendix 4). Women are nearly 3 percentage points more likely to vote than men, while younger cohorts consistently show lower turnout. By contrast, the coefficients for the variables of education level and ethnic origin are not statistically significant in most model specifications.
Several attitudinal variables also show limited explanatory power. Unification–independence stance,Footnote 7 satisfaction with the president, self-assessed economic conditions, and internal and external political efficacy do not have statistically significant association with turnout in the pooled sample (see Appendix 4), the 2008 election sample (see Appendix 5), or the 2016 election sample (see Appendix 7). The coefficient for ‘Better Self-Rated Economy’ reaches statistical significance in the 2012 and 2020 models (see Appendix 6 and Appendix 8), but the direction and magnitude of the estimates vary across elections. In contrast, particularly political discussion and political knowledge are positively associated with turnout in several models, although their statistical significance varies across election years.
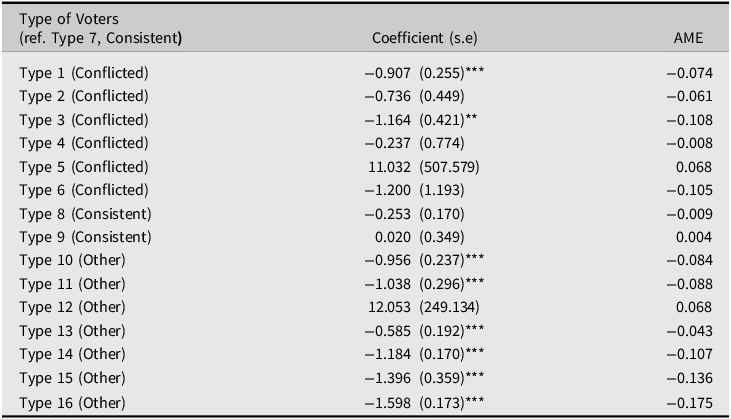
To further explore which kinds of conflicted voters are less likely to turn out to vote, we conduct an additional analysis using a 16-category voter typology based on combinations of party identification and candidate preference. With Type 7 voters (Pan-Blue identifiers who prefer the KMT candidate) as the reference group, the results in Table 3 show that conflicted voters within both the Pan-Blue and Pan-Green camps are significantly less likely to vote, holding other factors constant. Based on average marginal effects, Type 1 voters (Pan-Blue identifiers who prefer the DPP candidate) are more than 7 percentage points less likely to vote than consistent Pan-Blue voters. Moreover, Type 3 voters (Pan-Green identifiers who prefer the KMT candidate) are nearly 10 percentage points less likely to turn out.
Additional analyses (pooled cross-year model)
Source: TEDS 2008P, TEDS 2012, TEDS 2016, TEDS 2020, TEDS 2024, and authors’ calculations.
Notes: The dependent variable is self-reported voter turnout (1 = voted, 0 = did not vote). Coefficients are estimated using logistic regression models. Standard errors are reported in parentheses.
Voter types are defined by combinations of party identification and presidential candidate preference. Conflicted voters include the following: Type 1, Pan-Blue identifiers who prefer the DPP candidate; Type 2, Pan-Blue identifiers who prefer the TPP candidate; Type 3, Pan-Green identifiers who prefer the KMT candidate; Type 4, Pan-Green identifiers who prefer the TPP candidate; Type 5, TPP identifiers who prefer the KMT candidate; and Type 6, TPP identifiers who prefer the DPP candidate. Consistent voters include: Type 7, Pan-Blue identifiers who prefer the KMT candidate (reference group); Type 8, Pan-Green identifiers who prefer the DPP candidate; and Type 9, TPP identifiers who prefer the TPP candidate. Other voters include: Type 10, Pan-Blue identifiers with indifferent candidate preference; Type 11, Pan-Green identifiers with indifferent candidate preference; Type 12, TPP identifiers with indifferent candidate preference; Type 13, nonpartisans who prefer the KMT candidate; Type 14, nonpartisans who prefer the DPP candidate; Type 15, nonpartisans who prefer the TPP candidate; and Type 16, nonpartisans with indifferent candidate preference.
†P < 0.1; *P < 0.05; **P < 0.01; ***P < 0.001. Estimates shown are for the main independent variable only; results for full models are reported in Appendix 10.
However, conflicted voter types involving the TPP, whether through party identification or candidate preference, do not show statistically significant relationship with turnout. This is likely due to the TPP’s first participation in the presidential election in 2024, which yielded only 80 observations (1.4% of the sample). Such a small sample might lead to large standard errors and statistically insignificant results. In short, the additional analysis in Table 3 provides more nuanced evidence for the conflicted voter hypothesis proposed in this study.
5. Robustness check
It is important to acknowledge that the group of conflicted voters might not be generated randomly. Specifically, conflicted voter status may systematically differ from other types of voters in observable characteristics. For instance, individuals with higher levels of political knowledge and political interest are more likely to turn out to vote, whereas younger cohorts tend to participate at lower rates. Confounding therefore remains a concern.
To address this concern, we employ propensity score matching (PSM) (Bai and Clark, 2018) to mitigate selection bias between conflicted voters and consistent voters. In our analysis, propensity scores are estimated using logistic regression that considers a set of pre-treatment variables, including gender, ethnicity, generational cohorts, educational attainment, political efficacy, political knowledge, political discussion, unification–independence stance, and election year. We implement nearest-neighbour PSM with a 1:1 ratio. After matching, the analytical sample consists of 289 conflicted voters and 289 consistent voters, indicating successful matches for all conflicted voters with highly similar consistent voter counterparts.
Figure 2 reports covariate balance diagnostics before and after matching. The standardized mean differences for most covariates decline substantially after matching and are close to zero, suggesting that the procedure improves balance between the two groups on observable characteristics. The vertical dashed line indicates an absolute standardized mean difference of 0.1, which is a commonly used threshold for acceptable covariate balance (Austin, Reference Austin2009; Zhang, et al. Reference Zhang, Kim, Lonjon and Zhu2019). This provides support for the use of the matched sample as a more comparable basis for analysis.
Covariate balance test of propensity score matching.
Source: TEDS 2008P, TEDS 2012, TEDS 2016, TEDS 2020, TEDS 2024, and authors’ calculations.

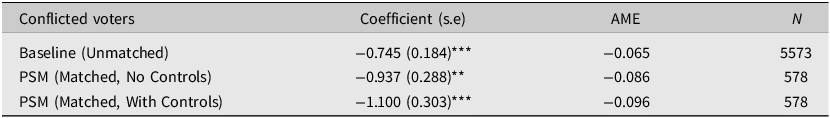
Table 4 presents logistic regression results across several model specifications. In the full sample without matching, conflicted voters are significantly less likely to turn out, with an average marginal effect of −0.065. After applying PSM without additional covariates, the negative association becomes larger in magnitude, with an average marginal effect of −0.086. This pattern indicates that differences in observable characteristics do not fully account for the lower turnout among conflicted voters. When additional covariates and election-year fixed effects are included in the matched sample, the result remains largely unchanged. The estimated average marginal effect is −0.096, indicating a 9.6 percentage-point lower probability of voting among conflicted voters.
Binary logistic regression estimates of the effect of voter conflict on turnout: original and propensity score matched samples

Source: TEDS 2008P, TEDS 2012, TEDS 2016, TEDS 2020, TEDS 2024 and authors.
Notes: The dependent variable is self-reported voter turnout (1 = voted, 0 = did not vote). Coefficients are estimated using logistic regression models. Standard errors are reported in parentheses.
†P < 0.1; *P < 0.05; **P < 0.01; ***P < 0.001. Estimates shown are for the main independent variable only; results for full models are reported in Appendix Table 4 and Appendix Table 11.
Overall, the results in Table 4 show that conflicted voters are consistently less likely to participate in election. The evidence is robust to both matching and regression adjustment. The increase in magnitude after matching suggests that differences in observable characteristics do not fully account for the turnout gap between conflicted and consistent voters. While these analyses do not establish causal effects, the use of PSM reduces concerns about selection on observables and strengthens confidence in the robustness of the association between partisan–candidate incongruence and electoral abstention.
6. Conclusion
Party identification is generally understood as a relatively stable political orientation that develops over time. While a large body of research shows that partisans are more likely to participate in elections, some research has found that the effect of party identification on voter turnout is not always statistically significant. The mixed findings suggest that the relationship between partisanship and participation remains inconclusive.
This study argues that one reason for these mixed results is that the mobilizing effect of party identification depends on voters’ preferences for specific candidates. Building on the theoretical perspectives of Weisberg and Grofman (Reference Weisberg and Grofman1981) and Bourgeois-Gironde and Ferreira (Reference Bourgeois-Gironde and Ferreira2020), we propose that when voters’ partisan identification does not align with the party affiliation of their preferred candidate, they face greater psychological costs and find it more difficult to justify participation. For such conflicted voters, abstention can serve as a way to avoid feelings of betrayal toward their affiliated party and preferred candidate. Using survey data of Taiwan’s presidential elections, the empirical results consistently show that conflicted voters are less likely to vote than consistent voters.
While our empirical analysis supports our proposed hypothesis, two limitations should be noted. First, self-reported turnout may be subject to social desirability bias, which is a common concern in survey-based studies of electoral participation. While overreporting is well documented in the literature, there is no clear evidence that this bias differs systematically between conflicted and consistent voters. Nonetheless, some degree of measurement error may remain. Second, because the analysis relies on observational survey data, conflicted voter status is not randomly assigned. We use propensity score matching to improve comparability between conflicted and consistent voters by balancing observed characteristics, but unobserved differences may still remain. For this reason, the findings should be interpreted as evidence of a robust association rather than a definitive causal effect.
This study contributes to the literature on political behaviour in Taiwan by demonstrating that the explanatory power of party identification depends on whether voters’ partisan identity is consistent with their preferred candidate’s affiliated party. Future research may further examine how affective polarization shapes the relationship between partisan-candidate incongruence and participation. Moreover, future studies may also explore whether the strength of partisan attachment conditions this relationship.Footnote 8
Looking ahead to the 2028 Taiwanese presidential election, it is unclear whether the race will again feature three major candidates, as in 2024, or whether the opposition camp will unite behind a single candidate, as in 2004, to challenge the incumbent DPP. If the latter scenario emerges and the electoral campaign becomes a closely contested two-candidate race, even a relatively small share of conflicted voters may affect the margin of victory.
More broadly, conflicted voters matter beyond any single election. When parties nominate candidates with strong populist appeals or ideologically extreme positions, some partisan supporters may hesitate to fully back their party’s nominee. As a result, more voters may experience tension between partisan loyalty and candidate preference, which may in turn reduce their likelihood of voting. In democracies characterized by rising populism and affective polarization, how parties seek to influence the turnout behaviour of conflicted voters may carry important implications for electoral outcomes.
Supplementary material
The supplementary material for this article can be found https://doi.org/10.1017/S1468109926100334
Competing interests
The authors declared no potential conflicts of interest with respect to the research, authorship, and/or publication of this paper.


 Open access