


1. Introduction
Glacier mass balance is a clear and direct signal of variations in climate forcing acting on the ice surface and, hence, determining long-term glacier response (Oerlemans, Reference Oerlemans2001; Zemp and others, Reference Zemp2015; Beniston and others, Reference Beniston2018). Understanding the glacier–climate linkage is crucial for accurately modelling future glacier evolution and corresponding impacts on local to continental hydrology, as well as sea-level rise (Hock and others, Reference Hock, Hutchings and Lehning2017, Reference Hock2019; Zemp and others, Reference Zemp2019). Long-term mass-balance measurements have a great value for investigating changes in climate forcing and their effect on glacier melt rates, and have been used in numerous recent studies (e.g. Carturan and others, Reference Carturan2016; Rabatel and others, Reference Rabatel, Dedieu and Vincent2016; Vincent and others, Reference Vincent2017; Thibert and others, Reference Thibert, Dkengne Sielenou, Vionnet, Eckert and Vincent2018; Charalampidis and others, Reference Charalampidis2018; Réveillet and others, Reference Réveillet2018; O'Neel and others, Reference O'Neel2019; Andreassen and others, Reference Andreassen, Elvehøy, Kjøllmoen and Belart2020; Vargo and others, Reference Vargo2020). However, observational series are often rather short and in many cases, their documentation is incomplete. This paper focuses on the seasonal mass-balance measurements on Claridenfirn, north-eastern Switzerland, that stand out both regarding their temporal coverage (106 years), as well as the quality of the observations, and their documentation and archiving.
Claridenfirn is a mountain glacier with an area of 4.3 km$^{2}$ at present (2019). Point mass-balance observations were started in the year 1914 at two individual sites marked by annually relocated stakes and are continued until today (Firnberichte, 1914–1978; GLAMOS, 1881–2020). Both the length of the time series, and probably also the detail of documentation of the direct measurements, are unequalled at the global scale, thus making these series highly valuable for investigating and understanding the effects that long-term changes in climate have on the accumulation and melt of Alpine glaciers (e.g. Machguth and others, Reference Machguth, Paul, Hoelzle and Haeberli2006b; Ohmura and others, Reference Ohmura, Bauder, Müller and Kappenberger2007; Huss and others, Reference Huss, Funk and Ohmura2009b; Gabbi and others, Reference Gabbi, Huss, Bauder, Cao and Schwikowski2015). To our knowledge, the Claridenfirn series also represents the only direct observation of annual/seasonal glacier mass balance for the period 1914 to 1946 worldwide, except for a few similar but often incomplete and/or discontinued point measurements on some other Swiss glaciers (e.g. Aletsch, Silvretta; Huss and Bauder, Reference Huss and Bauder2009).
The Claridenfirn measurements consist of two individual mass-balance time series at point locations at an elevation of $\sim$ 2900 and 2700 m a.s.l., respectively. The upper site experienced accumulation in most years since 1914. Also the lower site was often in the accumulation area until the 1980s but has experienced ablation since then, with significant mass loss in every year of the 21st century. The point mass-balance measurements were repeatedly quality-checked and homogenized, and detailed results were published in reports (Müller and Kappenberger, Reference Müller and Kappenberger1991; GLAMOS, 2017). Numerous studies made extensive use of the Claridenfirn data to investigate the glacier–climate linkage, or to calibrate and validate mass-balance models (Vincent and others, Reference Vincent2004; Ohmura and others, Reference Ohmura, Bauder, Müller and Kappenberger2007; Machguth and others, Reference Machguth, Eisen, Paul and Hoelzle2006a, Reference Machguth, Paul, Kotlarski and Hoelzle2009; Huss and Bauder, Reference Huss and Bauder2009; Huss and others, Reference Huss, Funk and Ohmura2009b, Reference Huss, Hock, Bauder and Funk2010, Reference Huss, Dhulst and Bauder2015; Gabbi and others, Reference Gabbi, Huss, Bauder, Cao and Schwikowski2015; Drolon and others, Reference Drolon, Maisongrande, Berthier, Swinnen and Huss2016; Roe and Baker, Reference Roe and Baker2016; Marty and others, Reference Marty, Tilg and Jonas2017).
Previous studies on Claridenfirn have relied on point measurements. These are specific to their location and only contain information on temporal mass-balance variability (e.g. Vincent and others, Reference Vincent2004, Reference Vincent2017, Reference Vincent2018) as opposed to the total loss of ice volume, or the glacier-wide mass balance, which is relevant for hydrological applications (Elsberg and others, Reference Elsberg, Harrison, Echelmeyer and Krimmel2001; Cogley and others, Reference Cogley2011). Extrapolating point measurements to the entire glacier area is, however, subject to considerable uncertainties (Fountain and Vecchia, Reference Fountain and Vecchia1999; Cox and March, Reference Cox and March2004; Holmlund and others, Reference Holmlund, Jansson and Pettersson2005; Thibert and others, Reference Thibert, Blanc, Vincent and Eckert2008). Re-analysis at regular intervals combining direct point observations with independent geodetic mass changes is therefore recommended (Haeberli and others, Reference Haeberli, Hoelzle, Paul and Zemp2007; Zemp and others, Reference Zemp2013), and is performed based on a wide range of approaches (Huss and others, Reference Huss, Bauder and Funk2009a; Van Beusekom and others, Reference Van Beusekom, O'Neel, March, Sass and Cox2010; Barandun and others, Reference Barandun2015; Andreassen and others, Reference Andreassen, Elvehøy, Kjøllmoen and Engeset2016; Klug and others, Reference Klug2018; O'Neel and others, Reference O'Neel2019; Wagnon and others, Reference Wagnon2021). In the case of Claridenfirn, computation of glacier-wide mass balance is further complicated due to ice losses by break-off at a frontal ice cliff.
The century-scale seasonal point measurements at Claridenfirn can offer new insights into the factors driving glacier mass loss. Long-term observations on Claridenfirn allow directly analysing the effect of variations in observed accumulation and melt on mass loss over a centennial time span. This is important as the early 20th century has seen periods of substantially positive mass balance (e.g. 1910s) and major mass losses (e.g. 1940s) (e.g. Vincent, Reference Vincent2002; Huss and others, Reference Huss, Hock, Bauder and Funk2010), and as these periods are not covered by other measurements of glacier mass change (Zemp and others, Reference Zemp, Hoelzle and Haeberli2009).
Here, we present a complete re-analysis of the Claridenfirn series. First, we focus on the 106-year point mass-balance series, thus substantially updating and replacing datasets from previous investigations (Müller and Kappenberger, Reference Müller and Kappenberger1991; Huss and Bauder, Reference Huss and Bauder2009; Huss and others, Reference Huss, Dhulst and Bauder2015). Second, we provide a detailed description and uncertainty assessment of the approaches used to infer long-term glacier-wide mass balance. Particular attention is devoted to ice losses due to avalanches from an ice cliff at the glacier terminus, i.e. an ablation process different than surface melting, which complicates the determination of mass change. Long-term variations and trends in mass-balance components are analysed using the century-scale time series allowing a better understanding of the climate change effects on long-term Alpine glacier retreat.
2. Study site and data
2.1 Claridenfirn
Claridenfirn is a mountain glacier in north-eastern Switzerland with an area of 4.3 km$^{2}$ (2019) and an elevation range from 2550 to 3250 m a.s.l. In the mid-1980s the glacier covered an area of 6.1 km$^{2}$
 and its terminus was located at 2290 m a.s.l. The glacier is mostly exposed towards southeast (Fig. 1). The topographical situation of Claridenfirn is particular as the glacier is spread over different accumulation basins that do not lead into one single, clearly established glacier snout. Proglacial runoff is distributed over more than a dozen outlets. Four principal parts of the glacier are distinguishable (Fig. 1) and are separated by ice divides: (I) Spitzalpelifirn with an ablation area facing east accounting for $\sim$
 35% (32%) of today's glacier surface (numbers in parentheses indicate fractions in 1956). (II) Central and main part of Claridenfirn, including the upper measurement site, terminating in a steep and cascading ice cliff ($\sim$
 43% (39%) of the glacier surface). (III) Eastern part of Claridenfirn, including the lower site, flowing southwards and including $\sim$
 20% (20%) of the surface area. (IV) Previously relevant, today only remnant glacier ice, with a northerly exposure comprising 2% (9%) of the glacier area.
(a) Overview map of Claridenfirn. The position of the two point mass-balance measurements (upper, lower) is indicated. Surface contours and the black outline refer to 2013. The blue outline shows glacier extent in 1985. Roman numbers I–IV indicate individual ice flow catchments, separated by dashed lines (see text for details). (b) Measurements at the upper site. The ochre layer marks the late-summer horizon for determination of accumulation in the subsequent year. (c) Overview of Claridenfirn in 2007, mainly showing ice flow catchments I–II with the position of the two sites (red bars) and the ice cliff (photos: M. Huss and G. Kappenberger).

2.2 Direct point mass-balance observations
Seasonal mass balance at two sites in the upper and lower parts of Claridenfirn has been determined continuously since 1914 (Fig. 1). Winter snow water equivalent (w.e.) is typically measured in May, annual balance in September. Centre dates of the surveys are 26 May $\pm$ 23 d, and 18 September $\pm$
 11 d, respectively. Both observation sites are fixed in position, localized by reference points outside the glacier or – more recently – by GPS, and are marked by stakes that are annually replaced at the original location to exclude effects of ice flow on measured mass balance. Between 1936 and 2019 surface elevation has decreased by 15 m at the upper and 32 m at the lower site. Measurements are performed at or close to stakes drilled into the firn or ice. Stakes permit a direct measurement of the firn/ice layer thickness lost. In addition, they also allow locating the last summer's horizon marked with ochre or sawdust in snow pits that are dug near the stakes when measuring the density of winter snow, or firn accumulation in late summer. Both point measurement series have been digitized using original field books and were published both for the 75-year (Müller and Kappenberger, Reference Müller and Kappenberger1991) and the 100-year anniversary (Chapter 4.16 in GLAMOS, 2017) of the series, hence contributing to a complete compilation of the metadata documenting the raw measurements. Supplementary Tables 1 and 2 provide all observations of seasonal point mass balance.
The seasonal point mass-balance records on Claridenfirn are nearly complete. Besides the seasonal measurements at the end of both winter and summer, additional intermediate readings are reported at up to monthly resolution for many years (Firnberichte, 1914–1978; GLAMOS, 1881–2020). However, during the early years of the series some data gaps occurred due to losses of the stakes with extreme snow depths (Fig. 2). For the lower site, only one annual value (1916) is missing from the 106-year long series; for the upper site, annual data are missing for 9 years. There is no year in which annual mass-balance measurements are missing for both sites. For winter balance, there are more data gaps (14 and 16 missing years for the upper and lower sites, respectively). In 9 years, no winter balance observation is available for both stakes at the same time with the last data gap in 1948 (Fig. 2). Winter snow density measured in situ is reported for 66% (48%) of the surveys at the upper (lower) site. Measured density of the accumulated firn layer over the annual period is reported for 67% (58%) of the years at the upper (lower) site. When no density observation was available, the average of all measurements was used to convert snow/firn depth to w.e. (see Supplementary Tables 1 and 2). Missing direct density observations for annual mass balance are restricted to the period before 1960 and only occur at one instance afterwards. In the case of firn ablation (i.e. negative point mass balance in the accumulation area), estimated densities of between 600 and 800 kg m$^{-3}$ were assigned based on the previous years’ conditions (7 and 30 instances for the upper and lower sites, respectively) but values are difficult to be verified. A detailed assessment of uncertainties in point mass-balance series is provided in Section 5.1.1.
Data availability for Claridenfirn. Direct point observations of the annual and the winter mass balance between 1914 and 2020 are shown for the upper and the lower site. The availability of DEMs for computing geodetic mass change is shown by black lines; the grey bar indicates the period covered by observations.

2.3 Geodetic surveys
Geodetic surveys ensure unbiased mass-balance series in the long term (Thibert and others, Reference Thibert, Blanc, Vincent and Eckert2008; Zemp and others, Reference Zemp2013). Comparison of DEMs provides changes in ice volume over periods of a few years to several decades (Bamber and Rivera, Reference Bamber and Rivera2007; Bolch and others, Reference Bolch, Buchroithner, Pieczonka and Kunert2008; Nuth and Kääb, Reference Nuth and Kääb2011; Dussaillant and others, Reference Dussaillant2019). For Switzerland, a wealth of high-quality maps and aerial photographs extends back until the first half of the 20th century (Bauder and others, Reference Bauder, Funk and Huss2007). For Claridenfirn, seven DEMs are available from such maps or aerial imagery (Table 1, Fig. 2). The earliest DEM refers to 1936 and was established by digitizing contours of the first accurate map sheet (LK50, based on terrestrial photography, see e.g. Bauder and others, Reference Bauder, Funk and Huss2007; Rastner and others, Reference Rastner, Joerg, Huss and Zemp2016). DEMs for 1956 to 2003 were evaluated based on aerial photography with a ground resolution of 0.2–0.5 m using standard photogrammetrical techniques (e.g. Baltsavias and others, Reference Baltsavias, Favey, Bauder, Bosch and Pateraki2001). The two last DEMs (2013, 2019) were processed by the Swiss Federal Office of Topography (swisstopo) and are derived from the swissALTI$^{3\text {D}}$ product (swisstopo, 2018; Weidmann and others, Reference Weidmann, Gandor and Artuso2018). In addition, the historical Siegfried map, referring to about the year 1900 (Freudiger and others, Reference Freudiger, Mennekes, Seibert and Weiler2018), is available. Mapped surfaces are not accurate enough to establish a DEM but the glacier outline provides information on ice extent at the beginning of the study period.
Availability of DEMs for computing geodetic ice volume change, including the exact date

The glacier area as assessed from the corresponding outlines and the spatial resolution of the DEMs is given. The estimated uncertainty $\sigma _{\rm {DEM}}$ of the local elevation information has been assigned based on previous studies (e.g. swisstopo, 2018).
Following swisstopo's processing flow applied to the generation of all official maps and DEMs in Switzerland, geo-referencing and co-registration of aerial photographs is based on clearly recognizable ground-control points with known positions (Rickenbacher, Reference Rickenbacher2013). As the photogrammetrical DEMs of Claridenfirn between 1956 and 2003 have been established over a time period of several decades (Bauder and others, Reference Bauder, Funk and Huss2007), the exact number and position of the respective tie points used for each DEM can unfortunately not be reconstructed. About 10 ground-control points by swisstopo, located on surrounding summits and other landmarks are available, were used to geo-reference the two latest DEMs (2013, 2019), and are very likely to also have been used for co-registering the previous DEMs. We have investigated potential elevation biases between the DEMs by comparing the raw point clouds over non-glacierized terrain. To do so, we computed differences of photogrammetric elevations acquired within a distance of 1 m. Average absolute differences from intercomparison of all terrain models at 1000–3000 individual points were mostly $\lt$ 0.3 m, and thus within the accuracy of the method (Bauder and others, Reference Bauder, Funk and Huss2007). Slightly larger systematic offsets, of up to 1 m, were found for the DEM of 1956. They can likely be attributed to an effect of elevation changes over perennial snow or to geomorphological processes and, hence, we decided to not correct for the bias. A more significant elevation bias of 2.1 m over stable terrain was found for the DEM of 1936 which is based on a topographical map, and the terrain model was adjusted accordingly. Evaluating systematic differences specified for aspect classes did not reveal significant lateral shifts or errors in the co-registration. Furthermore, adjustment of the DEMs following the approaches proposed by Nuth and Kääb (Reference Nuth and Kääb2011) would be arguable as the local topography around Claridenfirn causes the ice-free aspect classes covered by the DEMs to be strongly skewed towards southeast (Fig. 1a).
All DEMs were interpolated to a 25 m$\times$ 25 m grid. This resolution is sufficient for the generally low roughness of glacier surfaces. We estimate the uncertainty of the local elevation information as between $\pm$
 2 and $\pm$
 10 m by relying on published numbers for comparable data sources (Table 1, Bauder and others, Reference Bauder, Funk and Huss2007; Fischer and others, Reference Fischer, Huss and Hoelzle2015; swisstopo, 2018). Glacier outlines were mapped based on the same imagery to obtain changes in ice extent consistent with changes in surface elevation.
Annual geodetic mass balance $B_{\rm {geod}}$ (in m w.e. a$^{-1}$
 ) is obtained from

where $\Delta V$ is the overall glacier volume change derived by differencing two subsequent DEMs, $\rho _{\Delta {V}}$
 is the density of volume change set to 850 kg m$^{-3}$
 (Huss, Reference Huss2013), $\rho _{\rm {w}}$
 the density of water, $\overline {S}$
 is the average glacier area over the considered period and $\Delta t$
 is the time interval. Differences between the dates of the geodetic surveys and the field measurements need to be corrected. For details on this procedure, as well as an uncertainty assessment of geodetic mass balances we refer the reader to Section 5.1.2.
2.4 Ice thickness and surface velocity
In March 1993, ice thickness along five profiles in the upper part of ice flow basin II (Fig. 1a), around the location of the upper measurement site, was measured using a low-frequency ground-penetrating radar (Funk and others, Reference Funk, Bösch, Kappenberger and Müller-Lemans1997). Thicknesses of up to 250 m were found (Fig. 3a) and uncertainties are estimated as $\pm$ 2–5% (Funk and others, Reference Funk, Bösch, Kappenberger and Müller-Lemans1997).
(a) Measured bedrock topography at a transversal profile at the upper measurement site (Funk and others, Reference Funk, Bösch, Kappenberger and Müller-Lemans1997). Ice surface in 1936, 1985 and 2013 is shown based on DEMs. (b) Observed surface displacement between 1993 and 1994. The grey shaded region indicates the area between the profile and the ice cliff contributing to frontal ice break-off ($B_{\rm {below\text {-}profile}}$ ) together with volume flux through the profile.

We further employ singular unpublished observations of surface ice flow velocity performed between 20 Sept 1993 and 29 Sept 1994. At a 700 m-long profile $\sim$ 1.5 km from the ice cliff, including the upper measurement site and 10 additional stakes, surface displacement and mass balance was measured over 1 year. Displacements of up to 14 m were determined based on positioning of the stakes with triangulation (Fig. 3b). Ice thickness along the same profile was measured and bedrock reflections were mostly clear (Funk and others, Reference Funk, Bösch, Kappenberger and Müller-Lemans1997).
2.5 Meteorological information
The technique to evaluate glacier-wide mass balance employed in the current study requires continuous meteorological time series at daily resolution. For air temperature, the long-term series from Säntis (2502 m a.s.l., at a distance of 56 km from Claridenfirn) was used. This series has been homogenized to account for effects of systematic measurement errors or station re-locations (Begert and Frei, Reference Begert and Frei2018). The observations on Säntis represent the closest continuous temperature data covering the entire study period at an elevation similar to the study site. For precipitation, a local series from Elm (965 m a.s.l., 23 km) was used. Elm is the long-term precipitation series closest to the study site. As Elm is a valley station, overall winter precipitation is $\lt$ 50% of snow accumulation observed on Claridenfirn. We assessed the correlation of precipitation sums (1 Oct to spring measurement date) for 13 long-term precipitation series across the entire Swiss Alps with observed point winter balance on Claridenfirn 1914–2020, indicating that the correlation with the station at Elm was most favourable. Nevertheless, the relatively low correlation ($r^{2} = 0.40$
 ) indicates that seasonally adjusting meteorological observations to the conditions on the glacier is important (see Section 3.1).
3. Methods
Direct mass-balance measurements are inherently inhomogeneous and need approaches to make them comparable and usable for investigating the glacier–climate linkage. Observations of point balance, for example, are affected by the varying survey dates. Inferring the drivers of changes in mass balance also requires separate consideration of its components – accumulation and ablation. Although seasonal field observations tend to resolve these components in a climate with a clear seasonality such as in the Alps, significant accumulation can occur after the winter survey. Similarly, ablation can occur after the late-summer survey. Furthermore, glacier monitoring puts a strong focus on glacier-wide mass balance, allowing comparison of individual glaciers (e.g. Zemp and others, Reference Zemp, Hoelzle and Haeberli2009, Reference Zemp2015).
In order to (i) homogenize the observation dates, (ii) separate the mass-balance components and (iii) extrapolate the point mass balances to the entire glacier, we apply methodologies that have been proposed in earlier studies (Huss and Bauder, Reference Huss and Bauder2009; Huss and others, Reference Huss, Dhulst and Bauder2015). By optimising a daily accumulation and temperature-index melt model to match the seasonal observations in each individual year, we derive the variations in mass balance directly from the measurements, and use the model for downscaling the observations to a daily resolution. This permits the analysis of arbitrary periods (e.g. hydrological year), as well as the separation of individual mass-balance components. This approach is utilized at the point-scale for the observational series of each site, as well as at the glacier-scale by using a spatially distributed model that is additionally constrained with observations of ice volume change at decadal intervals. In the following, the employed methodology is described, highlighting developments of the approach specific to this study. The complete procedure is schematized in Figure 4.
Schematic illustration of the procedure to optimize the model-based mass-balance evaluation to all available measurements. Optimization loops for inferring homogeneous point balance series are in red (1). Additional optimization loops and input variables for computing glacier-wide mass balance are in blue (2). Only parameters that are varied during the optimization process are shown. See text for further details.

3.1 Point mass-balance series
For computing surface ablation rates $a_{\rm {sfc}}$ at day $t$
 at the location of each measurement site we rely on the formulation proposed by Hock (Reference Hock1999):

where $f_{\rm {M}}$ (m w.e. K $^{-1}$
 d$^{-1}$
 ) is a melt factor, $r_{\rm {snow/ice}}$
 (m w.e. K$^{-1}$
 W$^{-1}$
 m$^{2}$
 d$^{-1}$
 ) are radiation factors for snow and ice surfaces and $I_{\rm {pot}}$
 is the potential, clear-sky solar radiation at the investigated location. Air temperature $T( t)$
 is extrapolated to the elevation of the site using monthly lapse rates derived from nearby weather stations. Snow accumulation is calculated based on measured precipitation $P( t)$
 occurring at $T( t)$
 smaller than a threshold temperature of 1.5$^{\circ }$
 C with a linear transition range of $\pm$
 1$^{\circ }$
 C (Hock, Reference Hock1999). A precipitation correction factor $c_{\rm {prec}}$
 allows a scaling to the observed winter snow accumulation.
For each individual year and individually for each measurement site, the model was calibrated in an automated procedure minimizing the misfit with the seasonal observations. $c_{\rm {prec}}$ was optimized based on the direct winter accumulation measurements. For the melt parameters $f_{\rm {M}}$
 , $r_{\rm {snow}}$
 and $r_{\rm {ice}}$
 (Eqn (2)), constant ratios $a_1 = 40$
 W m$^{-2}$
 and $a_2 = 0.5$
 were assumed based on literature values (Hock, Reference Hock2003), and used to relate all parameters to each other by $f_{\rm {M}} = a_1 \cdot r_{\rm {ice}}$
 and $r_{\rm {snow}} = a_2 \cdot r_{\rm {ice}}$
 . The parameters were tuned so that the observed annual point balance was matched. Typically, three to five iterations were necessary to constrain the accumulation and melt parameters for achieving an exact match of both winter and summer measurements. In the few years with missing data (Fig. 2), average parameters determined for all years with observations were used, thus allowing for these data gaps to be filled based on a consistent methodology.
3.2 Glacier-wide mass balance
Our approach to compute glacier-wide mass balance from the two seasonal point measurements is very similar to the methodology described above but extends the model from the point to the spatial scale. Various approaches to compute glacier-wide mass balance from point information have been presented in the glaciological literature. Among the simplest and most popular ones are the profile and the contour method (Østrem and Stanley, Reference Østrem and Stanley1969; Kaser and others, Reference Kaser, Fountain and Jansson2003) or kriging (Hock and Jensen, Reference Hock and Jensen1999). Here, we employ a mass-balance model, annually constrained with the available seasonal field data, thus achieving an inter- and extrapolation which is based on process-description rather than simplified empirical relations (e.g. just based on elevation, as in the profile method).
The basic concept of our approach is to constrain a distributed mass-balance model at the annual scale to match both direct observations of winter accumulation and annual point balance. This is achieved by varying model parameters in each year individually. In addition, for periods bounded by two DEMs, we ensure agreement between the computed cumulative glacier-wide mass change and the observed geodetic mass change (Fig. 4). The approach shares some similarities with statistical variance analysis for mass-balance interpretation (see e.g. Lliboutry, Reference Lliboutry1974; Thibert and Vincent, Reference Thibert and Vincent2009) but is able to resolve both mass-balance variability on a spatial grid and daily temporal variations. The latter is achieved via the modelling that uses meteorological information. It was demonstrated that statistical variance analysis is applicable also in the case of relatively few measurement points (Thibert and Vincent, Reference Thibert and Vincent2009), which makes it particularly suitable to our study site. Specific to Claridenfirn, an additional ablation component due to frontal ice break-off needs to be estimated, which is conducted based on a mass-flux approach (see Section 3.3). This component of the mass balance is captured by periodical DEM comparison, but not by the in situ mass-balance measurements.
The distributed mass-balance model operates at a spatial resolution of 25 m$\times 25$ m and is driven by daily air temperature and precipitation data. Local temperature at each gridcell is computed using a linear gradient with elevation, and melt is derived with Eqn (2). Accumulation for all gridcells $( x,\; \, y)$
 of the glacier surface and day $t$
 is computed by

The spatial variation in snow accumulation over the glacier is taken into account by using a dimensionless multiplier $D_{\rm {snow}}( x,\; \, y)$ and a related scaling factor $f_{D_{\rm {snow}}}$
 with a default value of 1. $D_{\rm {snow}}$
 is considered as constant over the entire study period and was derived by combining different factors that are known to influence the spatial distribution of snow accumulation (e.g. Winstral and others, Reference Winstral, Elder and Davis2002; McGrath and others, Reference McGrath2015): (i) The large-scale long-term average precipitation field was interpolated from a gridded precipitation product (MeteoSwiss, 2014), featuring a precipitation gradient from northwest to southeast over the study area. This is consistent with previous studies on regional precipitation variability (Braun and others, Reference Braun1994; Müller-Lemans and others, Reference Müller-Lemans, Aellen, Braun, Kappenberger and Steinegger1997). (ii) Small- to medium-scale accumulation variability was estimated from terrain characteristics. For local slopes between 40 and 60$^{\circ }$
 , the value of $D_{\rm {snow}}$
 is linearly reduced in the range $[ 0,\; -1]$
 . Terrain curvature was evaluated within a radius of 150 m around every gridcell, and $D_{\rm {snow}}$
 is assumed to scale linearly with curvature. We prescribe a spread (2 standard deviations, SD) of the values of between $-$
 0.4 (convex) and 0.4 (concave). Thresholds are motivated by a study on the variability of the dimensionless multiplier by Farinotti and others (Reference Farinotti, Magnusson, Huss and Bauder2010). (iii) Wind-driven reduction in accumulation at the highest elevation was mimicked by linearly reducing local snow accumulation above the plateau with the upper measurement site (2900 m a.s.l.) by 20% per 100 m. This gradient is poorly constrained but is important to avoid substantial overestimates of accumulation in the steep and exposed uppermost sections of the glacier that only account for a limited share of the total area. Finally, $D_{\rm {snow}}$
 was normalized to an average of 0 over the glacier surface. The spatial parameter $D_{\rm {snow}}$
 varies between –1 (no snow accumulation) and $\sim$
 1 (twice as much snow as on average) and is visualized in Supplementary Figure 2. $f_{D_{\rm {snow}}}$
 is considered as a calibration factor, adjusted for every period bounded by two DEMs allowing a fine-tuning of the magnitude of spatial snow accumulation variations to observations while preserving the general pattern.
We compute conventional balances (Elsberg and others, Reference Elsberg, Harrison, Echelmeyer and Krimmel2001), i.e. mass balance is extrapolated to the actual glacier surface in each year, also including the glacier area beneath the ice cliff (Fig. 1). Ice surface elevation and extent were interpolated between the available states given by DEMs and corresponding outlines (Table I) assuming linear changes, thus providing an annually updated glacier geometry.
By running the spatially distributed model over each year, accumulation and melt parameters were automatically calibrated to match the seasonal field observations – as in the case of the point-scale application. An exact fit at both measurement locations is not feasible but we constrain the average misfit between modelled and observed point balance in each year (both for the winter and the annual period) to be zero. Although melt and accumulation parameters vary annually in order to match the field data, the temperature gradient ${\rm d}T/{\rm d}z$ , the ratios between the melt model parameters ($f_{\rm {M}}$
 , $r_{\rm {snow}}$
 , $r_{\rm {ice}}$
 , Eqn (2)), as well as the scaling factor for spatial snow distribution $f_{D_{\rm {snow}}}$
 (Eqn (3)) are constant over the time interval bounded by subsequent DEMs (Fig. 4). In an automated procedure, we varied these parameters within physically reasonable bounds, and maximized the agreement with the geodetic mass changes measured for the respective period. Optimized values for ${\rm d}T/{\rm d}z$
 typically are between –0.004 and –0.006$^{\circ }$
 C m$^{-1}$
 , while optimal values for $f_{D_{\rm {snow}}}$
 are between 0.9 and 1.1. The consideration of frontal ice break-off requires an additional iteration loop which we described in the following (Fig. 4). An in-depth assessment of the uncertainties affecting both observational data and inferred glacier-wide mass balance is given in Section 5.
3.3 Estimating mass loss by frontal ice break-off
Standard approaches to evaluate glacier-wide mass balance are unable to account for the process of frontal ice break-off and avalanching (e.g. Østrem and Stanley, Reference Østrem and Stanley1969; Hock and Jensen, Reference Hock and Jensen1999; Kaser and others, Reference Kaser, Fountain and Jansson2003). However, geodetic surveys capture the overall volume change of a glacier over time. The latter can be converted into a mass change based on a density assumption. Although ice flow basins I, III and IV are only subject to surface accumulation and ablation processes, additional ablation occurs in basin II due to ice break-off at an $\sim$ 500 m wide ice cliff (Fig. 1). This process has the potential of affecting the mass balance of $\sim$
 40% of Claridenfirn's total surface area although not impacting on the measurements of point balance.
For assessing the volume and temporal changes in net losses by frontal ice break-off, we employ a simple mass-flux approach based on measured ice thickness and surface flow velocity at a profile (Fig. 3b). We note that our methodology requires several assumptions and simplifications but allows for a first-order estimate of this mass-balance component based on observations.
We assume a basal sliding fraction of 50%, typical for Alpine glaciers (Gudmundsson, Reference Gudmundsson1999), and thus use a depth-averaged velocity of 90% of the surface flow speed. We computed the annual ice volume flux for the year 1994, when thickness and surface displacement were measured, by integrating over the entire transversal profile intersecting the upper measurement site. Surface displacement in between the 11 observation points was linearly interpolated (Fig. 3b). This results in a volume flux of $1.1\pm 0.3\times 10^{6}$ m$^{3}$
 a$^{-1}$
 when accounting for uncertainties in (i) ice thickness, (ii) surface velocity and (iii) the fraction of basal sliding. Unfortunately, no repeated observations of flow velocity at the profile are reported. We thus estimated variations in mass flux through the profile over the 106-year period by analysing changes in ice thickness and surface slope relative to 1994 based on the seven available DEMs. For each position $i$
 along the profile, we computed surface flow velocity $u$
 based on

where $f_{\rm {shape}} = 0.9$ is a shape factor appropriate for the site, $\rho _{\rm {ice}} = 900$
 kg m$^{-3}$
 is the ice density, $g$
 is the acceleration of gravity and the exponent of the flow law is set to $n = 3$
 (Glen, Reference Glen1955). $h$
 is the local ice thickness, and $\alpha$
 is local the surface slope computed in flow direction over two times $h$
 . Both $h$
 and $\alpha$
 refer to the respective DEM. $A_{{\rm f}, \, i}$
 is the temporally constant flow rate factor which we determine for all measurement points individually based on observed thickness and measured flow velocity in 1994. It thus accounts for imprecisions in the local measurements. We find an average value of $A_{{\rm f}} = 1.1\times 10^{-16}$
 Pa$^{-3}$
 a$^{-1}$
 . By keeping $A_{{\rm f}, \, i}$
 fixed over time, $u_i$
 becomes a function of $\alpha _i$
 and $h_i$
 thus permitting to compute volume fluxes for all available geometries. In fact, temporal changes in slope at the profile were negligible, and the surface only started lowering by a limited amount after 1985 (Fig. 3a). This resulted in almost constant ice volume flux through the profile until the 1980s and an $\sim$
 10% reduction per decade afterwards.
For computing the flux across the ice cliff and thus the annual volume of frontal ice break-off, surface mass change $B_{\rm {below\text {-}profile}}$ in between the profile and the front needs to be accounted for. This region corresponds to 1.1 km$^{2}$
 (with almost no changes over time), and thus to 18–24% of Claridenfirn's overall area (Fig. 3b). Net mass gains below the profile, as mostly occurring before the year 2000, will add to flux at the ice cliff, whereas negative mass balance, as during the last two decades, will reduce frontal ice break-off. $B_{\rm {below\text {-}profile}}$
 is evaluated for each year from the computed mass-balance distribution. As annual variations in surface mass balance will not have an immediate impact on ice flow in the vicinity of the ice cliff and, hence, on frontal ablation rates, we smooth the time series with a moving window arbitrarily set to a width of 10 years and compute the corresponding average $\overline {B_{\rm {below\text {-}profile}, \, {\it y}}}_{10}$
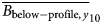 . The volume of flux over the ice cliff in year $y$
 , $Q_{\rm {cliff}, \, {y}}$
 , is computed by

where $Q_{\rm {prof}, \, {y}}$ is the flux through the transversal profile in m$^{3}$
 a$^{-1}$
 . In case $Q_{\rm {cliff}, \, {y}}$
 is negative, it is set to zero; between 1914 and 2020, this situation never occurred however. Over large parts of the 20th century, a steep regenerated glacier (e.g. Benn and Evans, Reference Benn and Evans2010) was located below the ice cliff (laterally connected to the main glacier, Fig. 1). Only ice avalanches that are deposited outside of the glacial perimeter represent a significant net mass loss to the glacier system. This mass loss $Q_{\rm {frontal}, \, {\it y}}$
 is computed as

where $f_{\rm {ret}, \, {y}}$ is a factor accounting for the share of the annual flux over the ice cliff $Q_{\rm {cliff}, \, {y}}$
 (Eqn (5)) retained by the regenerated glacier. If ice avalanches are entirely deposited on the regenerated glacier below, there is limited net contribution of frontal ablation to glacier mass loss as the avalanche mass is re-integrated into the glacier and is subject to climate-driven ablation processes (Fig. 5). Quantifying the exact dates, volumes and runout zones of individual ice avalanches, as well as the thickness of the deposits is beyond the scope of our study. It is however likely that melt rates are somewhat larger in the avalanche deposits due to fracturing and, hence, higher specific surface area. Maps indicate that the regenerated glacier decreased in area over the last century and that, from the late 20th century onwards, it was almost inexistent due to decreased avalanche activity (Supplementary Figs 3, 4; Table 3). In this case, ice avalanches completely leave the glacier system, and the deposits melt outside of the glacial perimeter.
Schematic cross-profile through the ice cliff (see Fig. 1) at the terminus of basin II illustrating the temporal evolution of frontal geometry.

Based on these observations, we parameterize $f_{\rm {ret}, \, {y}}$ as a linear function of glacier area below the ice cliff. The latter was evaluated based on the available glacier outlines. If the regenerated glacier is inexistent, $f_{\rm {ret}}$
 equals zero. For the year 1914 and the maximal extent of ice below the cliff (0.3 km$^{2}$
 ) given by the historical Siegfried map (Freudiger and others, Reference Freudiger, Mennekes, Seibert and Weiler2018), we arbitrarily set $f_{\rm {ret}} = 0.8$
 . This accounts for the fact that also in the case of a large, regenerated glacier almost reaching the valley floor, melt rates in the avalanche deposits are enhanced. We linearly interpolated $f_{\rm {ret}}$
 in between the available glacier outlines. We find $f_{\rm {ret}} = 0.27\pm 0.22$
 on average over the entire study period but note that the assumptions are strong and that the uncertainty in $f_{\rm {ret}}$
 is high. We therefore perform conservative tests to investigate the corresponding effects on the results (Section 5.2).
4. Results
The presentation of results is separated into two parts: we first discuss point mass-balance series for analysing impacts of long-term changes in climate forcing on accumulation and melt. These observations are unaffected by ice dynamics and the glacier response time, and do not carry uncertainties due to extrapolation to the entire glacier or estimates of frontal ablation. Second, we analyse changes in observed glacier-wide mass balance, discuss the importance of the frontal ablation component and put the centennial Claridenfirn series into context with other glaciers in the European Alps. This allows us to assess its representativeness.
4.1 Point mass-balance series
We analyse mass-balance components over the hydrological year (1 Oct to 30 Sept) to permit intercomparison of individual years; correcting point balance from the measurement dates to this fixed-date system follows the methodology described in Section 3.1. We also extract the components of mass balance, i.e. accumulation and melt. Henceforth, we define melt as the entire ablation occurring during the hydrological year and express it with a negative sign, and accumulation as the sum of solid precipitation between 1 Oct and 31 May. Although our approach would allow inferring accumulation during the summer months, we focus on winter accumulation as the former is inherently difficult to constrain with seasonal observations, thus resulting in larger uncertainties.
The two point observations show largely consistent temporal variations in accumulation and melt (Fig. 6). In the following, we thus average deviations from their respective mean over the entire study period (1914–2020). Differences in mass-balance anomalies between the sites at the annual or decadal scale can be attributed to local conditions affecting the sites differently (e.g. wind drift), or the existence of occasional data gaps before $\sim$ 1950 (Fig. 2) and the corresponding reconstruction of mass balance (see Section 3.1). The series indicate slightly larger melt anomalies at the lower measurement site than at the upper (Fig. 6b). This can likely be attributed to a snow-ice albedo feedback as the equilibrium line rises over the site in years with above-average forcing (see also Gabbi and others, Reference Gabbi, Huss, Bauder, Cao and Schwikowski2015). The data indicate melt rates more negative than the 106-year average in the 1920s, the 1940s and continuously since the mid-1980s. In the 1910s, the 1930s and between $\sim$
 1950 and 1985, melt rates were smaller than average. Snow accumulation shows large year-to-year variations but weak multi-decadal changes. Positive anomalies can be noted between $\sim$
 1960 and 2000, and an intermittent drop is visible around 2010 (Fig. 6b). Compared to the period 1960–1990, the last decade (2010–2020) is characterized by an increase in melt by 1.07 m w.e. a$^{-1}$
 , corresponding to a 50% increase relative to average melt observed at the two measurement sites. Accumulation remained almost unchanged ($-0.02\, {\rm m}$
 w.e. in the last decade, when compared to 1960–1990).
Long-term annual anomalies of (a) winter accumulation (1 Oct to 31 May), and (b) melt (1 Oct to 30 Sept) of both point observations from their respective 1914–2020 average. Note that melt is expressed with a negative sign. The 11-year running means of the annual anomalies are shown both for the individual sites and their average.

Melt season length, here defined as the number of days with $\gt$ 0.01 m w.e. of ablation, shows positive trends over the entire period with $+$
 1.9 d per decade at the upper and $+$
 1.5 d per decade at the lower measurement site. Changes in melt season length have recently accelerated. Relative to 1960–1990, the melt season was 23 d longer over the last decade and on average of both sites, corresponding to an increase of one third. Melt parameters that are annually adjusted to match the seasonal point observations (Fig. 4) do not show any long-term temporal trends but are subject to year-to-year variations of $\pm$
 16% (1 SD).
For more closely analysing the temporal variations in observed point balance, data were aggregated to decadal means (Fig. 7). Deviations in decadal accumulation from the long-term mean (1914–2020) remain below 0.22 m w.e. a$^{-1}$ , whereas decadal departures in melt from the average vary between $+$
 0.71 (1910s) and $-0.88\, {\rm m}$
 w.e. a$^{-1}$
 (2010s). This confirms the importance of variations in melting to drive annual mass-balance variability, as found in earlier studies (Oerlemans, Reference Oerlemans1992; Larsen and others, Reference Larsen2015; Vincent and others, Reference Vincent2017; O'Neel and others, Reference O'Neel2019; Bolibar and others, Reference Bolibar2020). However, in three decadal periods (positive: 1960s, negative: 1940s, 2000s) variations in accumulation explain almost 40% of the anomaly. The impact of above- or below-average accumulation is also subject to amplification by the albedo effect (Klok and Oerlemans, Reference Klok and Oerlemans2004; Box and others, Reference Box2012; Naegeli and Huss, Reference Naegeli and Huss2017). This indicates that accumulation anomalies can help explaining both positive and negative changes in mass balance at the decadal scale. However, correlation of anomalies in decadal mass balance and accumulation is inexistent ($r^{2} = 0.01$
 ), whereas it is high for anomalies in melt ($r^{2} = 0.87$
 ).
).
Decadal mean anomalies of (a) annual mass balance, (b) accumulation and (c) melt as an average over the two measurement sites. Anomalies are deviations from the 1914–2020 mean. Note that melt is expressed with a negative sign and that the first and the last periods contain $\lt$ 10 years. Numbers in (a) indicate the percentage of the annual mass-balance anomaly explained by decadal variations in accumulation. Only significant values are shown. Periods with substantial departures from the mean are highlighted (1910s, 1940s, 1960s/70s and 2000/10s).

To better understand the temporal evolution of mass-balance components, an analysis using stepped 20-year linear trends was performed. The significance of the trends evaluated for periods at a progressive interval of 3 years (e.g. 1914–1934, 1917–1937, etc.) was tested using the non-parametric Mann–Kendall test (Mann, Reference Mann1945; Pellicciotti and others, Reference Pellicciotti, Bauder and Parola2010; Baraer and others, Reference Baraer2012). Trends were classified into insignificant, significant at the 80% level (low significance), and significant at the 95% level (high significance).
For melting, highly significant positive 20-year trends are found around the 1940s and over the last 40 years, being strongest between 1975 and 1995 (Fig. 8a). For the 21st century, the trend in melting is $+$ 0.52 m w.e. a$^{-1}$
 per decade. Very few significant 20-year trends are evident in the snow accumulation series; they were slightly positive in the 1950s and clearly negative around 2000 (Fig. 8b). Trends in annual mass balance are broadly consistent with trends in melting but with inverted sign (Fig. 8c).
Twenty-year trends fitted in progressive 3-year steps through the time series (average of both measurement sites) of annual (a) melt, (b) accumulation and (c) mass balance. The significance of all trends has been evaluated according to the Mann–Kendall test and classified into three categories: not significant, low significance and high significance. A running mean of the stepped trends is shown.

4.2 Glacier-wide mass balance
4.2.1 Mass-balance series
The glacier-wide mass-balance series 1914–2020 are constrained to agree with all seasonal in situ point data, as well as with the observed decadal geodetic mass changes within their uncertainties (Fig. 4). Before 1936 and after 2019 inferred annual mass balances cannot be constrained with geodetic surveys as no DEMs are available. Given the consistency of the model-based mass-balance extrapolation scheme over the remaining 83 years, we are confident that the same procedure is also suitable for deriving glacier-wide balance for these time intervals. Our results show a cumulative mass change 1914–2020 of $-0.12\pm 0.03$ Gt, corresponding to a cumulative mass balance of $-24\pm 6$
 m w.e. (Fig. 9). Between the beginning of the 20th century and the 1980s, Claridenfirn was almost in balance with climate, with mass losses in the 1940s compensated by gains in the 1910s and the 1960s/70s. The last three decades were, however, characterized by strong and continuous mass loss.
Cumulative series of annual mass change of Claridenfirn, including an estimated uncertainty band (see Section 5). Geodetic mass changes based on repeated DEMs are shown with blue triangles including their uncertainty. Glacier area (top) is stated for the available DEMs including cumulative mass balance (red) for these dates, and period averages of inferred annual glacier-wide mass balance (bottom) are given in between.

4.2.2 Relevance of frontal ice break-off
Our flux-based estimates of net volume losses due to ice break-off at a frontal ice cliff range between 0.0 and $1.7\times 10^{6}$ m$^{3}$
 a$^{-1}$
 (Fig. 3). Related to the instantaneous glacier area this corresponds to a specific loss of between 0.00 and 0.25 m w.e. a$^{-1}$
 . Our results – based on measured thickness and surface velocity in 1994, long-term geometry changes and computed mass balance in the region contributing to the flux – indicate that frontal ablation underwent significant temporal variations over the last century (Fig. 10). Ice flux at the considered transversal profile $Q_{\rm {prof}}$
 only showed relatively limited changes over time. However, shorter-term variations might be masked by the resolution of our data that is given by the availability of DEMs. Ice flux at the considered transversal profile $Q_{\rm {prof}}$
 only showed relatively limited changes over time. However, shorter-term variations might be masked by the resolution of our data that is given by the availability of DEMs. We validated fluxes at the profile inferred from velocity observations in 1994 and surface topography changes using the sum of two components: (i) the integrated surface mass balance given by our extrapolation to the contributing region, and (ii) the dynamic thickening/thinning in the area upstream of the profile that was determined based on the comparison of DEMs. We find good agreement with periodical deviations remaining below 10% throughout the entire study period. The dynamics of total flux over the ice cliff $Q_{\rm {cliff}}$
 (Eqn (5)) closely resemble cumulative glacier-wide mass balance of the entire glacier system (Fig. 9): highest values are found in the 1960s/70s while a strong decrease is observed over the last few decades, rapidly tending towards zero (Fig. 10). Net losses to the glacier system due to frontal ablation $Q_{\rm {frontal}}$
 are also determined by the deposition zones of avalanches on a partly connected, regenerated glacier underlying the ice cliff (Fig. 5), parameterized by the poorly constrained parameter $f_{\rm {ret}}$
 (Eqn (6)). Especially during the first half of the 20th century, net losses due to ice break-off were mitigated by deposition on the regenerated glacier. With a moderate decrease in ice flux at the transversal profile and a shift to negative values of $B_{\rm {below\text {-}profile}}$
 around the year 2000, frontal ablation processes are now losing their importance for overall glacier mass change (Fig. 10). This is also confirmed by recent qualitative observations of the ice cliff (Supplementary Fig. 8).
Inferred annual ice volume fluxes at a transversal profile (blue dots correspond to known surface topography), across the ice cliff (black dotted), and as net loss to the glacier system (black). Surface mass change below the transversal profile is shown in red. Please refer to the text (Section 3.3) and Eqns (5) and (6) for details and to Figure 3b for the spatial context.

In comparison with overall surface melting, ablation due to frontal ice break-off accounts for $\sim$ 9% on average over the 106 years (Supplementary Fig. 10). This indicates that this ablation process has a second-order importance for Claridenfirn's overall mass balance. Between 1960 and 1980, however, the contribution of frontal ice break-off rose to above 20% for 5 years with below-average surface melting and maximum ice flux over the ice cliff (Fig. 10). During the last decade, estimated contributions of ice avalanches to overall ablation tended towards zero.
Variations in frontal ablation, i.e. a process that is only indirectly linked to climate via ice flow dynamics (e.g. van der Veen, Reference Van der Veen2002), might hamper the merit of a mass-balance record for analysing glacier response to climate change. We therefore confronted inferred decadal changes in glacier-wide mass balance with respect to a reference period (1960–1990) to changes in the rate of frontal ice break-off (Fig. 11). For almost all decades, we found opposite signs for the changes in mass balance and frontal ablation relative to the reference period: negative mass balances and a corresponding reduction in glacier volume, coincide with smaller ice flux and, thus, a reduction of frontal break-off. This process exerts a positive, i.e. stabilizing effect on overall mass balance. For the last decade (2010–2020), the effect of frontal ablation change accounts for 20% of the mass-balance change. The reduced frontal ablation rate has thus mitigated the change in climatic mass balance, i.e. the mass balance only related to surface accumulation and ablation, to some extent. In most other decades, the relative effect of frontal ablation change is smaller than 10% relative to the mass-balance change, but the magnitude of variations in climatic balance is consistently reduced (Fig. 11). This generally limited effect indicates that long-term mass-balance variations of Claridenfirn have a high relevance for climatic interpretation, despite the frontal ablation component that is typically avoided when selecting glaciers for monitoring programmes (Kaser and others, Reference Kaser, Fountain and Jansson2003). Furthermore, we note that geometric changes (retreat of the terminus, reduction of surface elevation, disintegration) also have a substantial impact on mass-balance series that are not subject to frontal ablation processes (e.g. Huss and others, Reference Huss, Hock, Bauder and Funk2012; Carturan and others, Reference Carturan, Rastner and Paul2020).
Decadal glacier-wide mass-balance difference with respect to the reference period 1960–1990 (grey). The change in net losses due to frontal ice break-off related to the instantaneous glacier area is shown in blue, and the percentage relative to the glacier-wide mass-balance change is stated if the latter is $\gt$ $\pm$
$\pm$ 0.1 m w.e. a$^{-1}$
 . The change in the climatic mass balance is indicated by the dashed grey lines.

4.2.3 Large-scale representativeness
Long-term mass balances inferred for Claridenfirn were compared to other series throughout the European Alps over (i) a long-term period (40 years), and (ii) the last decade. For the period 1968–2008, glacier-wide mass-balance series from 14 glaciers in Austria, France, Italy and Switzerland are available (Supplementary Table 4; WGMS, 2020). For 2008–18, 36 glaciers are available for comparison, resulting in a spatially representative coverage of the European Alps, including different glacier types and sizes (WGMS, 2012; Zemp and others, Reference Zemp2015). For the 14 glaciers with complete data series, we also investigate the change in average glacier-wide mass balance between the two periods.
The spread in average balance for the glaciers with long-term observations is considerable (e.g. between $-2.5$ and $-0.4\, {\rm m}$
 w.e. a$^{-1}$
 for the last decade). In both periods, Claridenfirn exhibits mass balances slightly above the median of the other observed Alpine glaciers (Fig. 12). However, the Claridenfirn series closely agree with the median for Switzerland, which is less negative than for other European countries. We hypothesize that, compared to glaciers in Austria, France and Italy, the monitored Swiss glaciers show somewhat less negative balances as they are located at higher average elevations and are larger. Mass-balance differences between the periods 1968–2008 and 2008–2018 provide insights into the glaciers’ sensitivity to changes in forcing. In contrast to average values, changes in glacier-wide balance are relatively consistent across the Alps (Fig. 12). This is in line with conclusions by Vincent and others (Reference Vincent2017). The two French glaciers in the dataset however show mass-balance changes substantially more negative than other glaciers for glacier-wide balance that is analysed here, but a regionally homogeneous response also for these glaciers was found when analysing point mass-balance series (Vincent and others, Reference Vincent2017). Data for Claridenfirn closely match the median mass-balance change of the European Alps. The mass-balance sensitivity of Claridenfirn is thus regionally representative which is an important prerequisite when utilizing this series for climate impact studies.
Comparison of glacier-wide mass balance of Claridenfirn averaged over a 40-year period (1968–2008) and the last 10 years to other long-term series in the Alps (WGMS, 2020). In addition, mass-balance difference between the 40- and the 10-year period is given. The number of available series ($n$ ) and the SD of their 40- and 10-year averages (stdev, in m w.e.) is stated for all periods. The median of all series (large grey symbol) and for the individual European countries (coloured symbols) is indicated with triangles. Note that Glacier des Sarennes (France) shows substantially more negative mass balances than all other series due to non-climatic positive feedbacks following its disintegration (Thibert and others, Reference Thibert, Dkengne Sielenou, Vionnet, Eckert and Vincent2018).

5. Uncertainty assessment
5.1 Uncertainty in observations
5.1.1 Point mass-balance measurements
Various components contribute to the uncertainty in point mass-balance measurements, depending on the type of observation, as well as on absolute mass gain or loss in the specific year. Estimating the uncertainty of the individual components is inherently difficult as, in many cases, they cannot be constrained. Nevertheless, we attempt to isolate the components and to assign conservative uncertainty estimates based on literature (e.g. Fountain and Vecchia, Reference Fountain and Vecchia1999; Zemp and others, Reference Zemp2013; Beedle and others, Reference Beedle, Menounos and Wheate2014) or experience. The documentation of the Claridenfirn series provides detailed information on the field techniques employed during each survey (Supplementary Tables 1 and 2). Cumulated over the upper and the lower sites, 60% of the annual measurements were performed by locating a marked horizon beneath the accumulated firn layer (type I observation). In a few cases (4%) the marked horizon was not found, and accumulation was detected by probing without a firm reference (type II). A third of the observations was based on readings of the mass-balance stake, mostly in the case of ablation (type III). In a few years, no observation is available for the respective site (type IV).
We identify and quantify the following uncertainty components in point balance measurements: (a) reading uncertainty ($\sigma _{\rm a} = \pm$ 0.05 m w.e.), (b) potential vertical movement of the stake, e.g. by melt-in or compaction of lower firn layers ($\sigma _{\rm b} = \pm$
 0.02–0.10 m w.e., depending on surface type; Müller and Kappenberger, Reference Müller and Kappenberger1991), (c) direct measurement or estimation of density of the gained or lost firn/ice layer ($\sigma _{\rm c} = \pm$
 0.5–10% relative to that year's mass balance), (d) refreezing of melt water in lower firn layers, or depletion due to water percolation ($\sigma _{\rm d} = \pm$
 0.05 m w.e.) and (e) erroneous detection of last year's horizon ($\sigma _{\rm e} = \pm$
 0.20 m w.e.). For type I, components (a), (c) and (d) are relevant; for type II, in addition also component (e). For type III, components (a) to (c) determine the uncertainty, in the case of mass gain in addition also (d). The most important individual uncertainty component is the determination of density, contributing $\sim$
 40–50% to the total uncertainty. We conservatively assign an uncertainty of $\pm$
 10% to firn density measurements (see e.g. Gugerli and others, Reference Gugerli, Salzmann, Huss and Desilets2019), also corresponding to the SD of all direct density observations on Claridenfirn. An uncertainty of $\pm$
 3 and $\pm$
 0.5% was assigned when density was estimated for ablation of strongly densified firn or bare ice, respectively. Based on the root of the sum of squares of the relevant components for each type, point balance uncertainty was computed annually (Supplementary Fig. 11). For missing data (type IV) twice the average uncertainty of the respective site was conservatively assigned. Point balance uncertainties range between $\pm$
 0.05–0.32 m w.e with an average of $\pm$
 0.17 m w.e. ($\pm$
 0.12 m w.e.) for the upper (lower) site. The two measurement locations can be considered as independent from each other. The combined uncertainty in point balance measurements is thus reduced by the root of the number of sites, $\sqrt {n}$
 =1.41, and is $\pm$
 0.10 m w.e.
5.1.2 Geodetic mass change
The uncertainty in geodetic mass change is computed according to standard procedures (e.g. Thibert and Vincent, Reference Thibert and Vincent2009; Rolstad and others, Reference Rolstad, Haug and Denby2009; Zemp and others, Reference Zemp2013). The local uncertainty $\sigma _{x, y}$ in annual elevation change for each gridcell $( x,\; \, y)$
 is given by

with $\sigma _{\rm {DEM1}}$ and $\sigma _{\rm {DEM2}}$
 the uncertainties of the two compared DEMs (Table I). As the uncertainties in the individual gridcells are typically neither fully uncorrelated nor fully correlated over the glacier surface, we adopt the approach proposed by Rolstad and others (Reference Rolstad, Haug and Denby2009). Fischer and others (Reference Fischer, Huss and Hoelzle2015) determined a typical correlation length $L = 0.4$
 km for Swiss glaciers. Here, we conservatively set $L = 1.0$
 km. Following Rolstad and others (Reference Rolstad, Haug and Denby2009) the uncertainty in geodetic elevation change at the glacier-wide scale $\sigma _{\Delta z}$
 is then obtained as

For direct comparison to glaciological mass balance, differences between the exact date of DEM acquisition and the field surveys were corrected by taking into account mass gain or loss provided by the calibrated mass-balance model. Time differences are typically small (around a week, Table I). We conservatively assign an uncertainty of $\pm$ 50% in terms of mass to this date correction at both the beginning and the end of each period between two DEMs. We then compute an additional error term $\sigma _{\rm {date}}$
 , which is negligible ($\lt$
 0.02 m w.e. a$^{-1}$
 ) for most periods, except for 2003–2013 when it accounts for 0.06 m w.e. a$^{-1}$
 due to the acquisition of the first DEM 6 weeks prior to the field survey.
Finally, the uncertainty in the annual geodetic mass balance $\sigma _{\rm {geod}}$ (m w.e. a$^{-1}$
 ) for the entire glacier can be computed with

where $\Delta t$ is the time period covered by the two DEMs, $\Delta z$
 is the average surface elevation change and $\sigma _{\Delta z}$
 is the corresponding uncertainty (Eqn (8)). We assume a density of ice volume change $\rho _{\Delta V}$
 of 850 kg m$^{-3}$
 (Huss, Reference Huss2013) and allow for a large uncertainty $\sigma _{\rho _{\Delta V}}$
 of $\pm$
 100 kg m$^{-3}$
 in the conversion factor. This approach provides error bars for geodetic mass change depending on all factors affecting the uncertainty. Total uncertainties range between $\pm$
 0.07 and $\pm$
 0.18 m w.e. a$^{-1}$
 which is typical for co-registered photogrammetrically derived DEMs (Thibert and others, Reference Thibert, Blanc, Vincent and Eckert2008; Thibert and Vincent, Reference Thibert and Vincent2009; Fischer, Reference Fischer2010; Zemp and others, Reference Zemp2013; Beedle and others, Reference Beedle, Menounos and Wheate2014). Uncertainties are highest for the first period (1936–1956, uncertain elevation data) and the last period (2013–2019, short time interval).
5.2 Uncertainty in glacier-wide mass balance
For estimating the uncertainty in inferred glacier-wide mass balance, various experiments were performed to disentangle the impact of individual components (e.g. extrapolation into unmeasured regions, measurement point density, frontal ablation). Typically, glacier monitoring programmes operate with more comprehensive networks of mass-balance stakes (Fountain and Vecchia, Reference Fountain and Vecchia1999; Pelto, Reference Pelto2000; Zemp and others, Reference Zemp2013; Andreassen and others, Reference Andreassen, Elvehøy, Kjøllmoen and Belart2020), and computation of glacier-wide balances based on only two point measurements is challenging. Two different types of uncertainty can be distinguished: (1) local uncertainty in computed mass-balance distribution, and (2) uncertainty in glacier-wide mass balance. Most mass-balance programmes worldwide do not consistently evaluate and report uncertainties in extrapolated local mass balance (WGMS, 2020), which is likely related to sparse data for benchmarking. In contrast, uncertainties in glacier-wide mass balance are often investigated in detail and are reported (e.g. Zemp and others, Reference Zemp2013; Sold and others, Reference Sold2016; Andreassen and others, Reference Andreassen, Elvehøy, Kjøllmoen and Engeset2016; O'Neel and others, Reference O'Neel2019). This quantity also has a higher relevance for assessments of mass change or hydrology, and is the focus of this chapter.
5.2.1 Uncertainty in mass-balance extrapolation
Our approach used to compute glacier-wide mass balance based on seasonal point measurements and geodetic volume changes depends on choices of mass-balance model parameters. Due to equifinality, several combinations of parameters are possible that honour the observations similarly well. This will lead to a somewhat different mass-balance distribution and, thus, deviations from the reference time series (Fig. 9). We varied the air temperature gradient, the scaling factor for spatial snow distribution $f_{D_{\rm {snow}}}$ (Eqn (3)), as well as the ratio between $r_{\rm {ice}}$
 and $r_{\rm {snow}}$
 (Eqn (2)) to obtain three alternative series of glacier-wide mass balance based on repeating the same calibration procedure (Fig. 4) that ensures agreement with all observations (seasonal point balance and geodetic mass change). Differences compared to the reference spread around 0, with an SD of $\sigma _{\rm {model}} = \pm$
 0.05 m w.e. a$^{-1}$
 on average (Fig. 13a).
Assessment of the uncertainties in glacier-wide mass balance for various experiments targeting different factors (see text for details). Experiments (Ex.) are grouped according to individual aspects of the overall uncertainty. (a) Distribution of differences in annual mass balance relative to the reference for the respective experiment. Boxes contain 1$\sigma$ (69%) of the data and bars refer to 2$\sigma$
 (95%). (b) Average RMSE of the model at the two annual point balance measurements. The red line shows the value found for the reference as a benchmark. Note that for experiments 6 and 7, only a single point observation per year has been used and the RMSE is thus zero.

Our model-based extrapolation to the glacier-scale requires daily meteorological data as input. Since long-term direct weather observations close to glaciers rarely exist, the model's sensitivity to this data was tested by repeating the computations with weather stations that would be considered as non-representative for meteorological conditions at the site. Using temperature and precipitation series from the distant low-elevation stations in Zurich (556 m a.s.l., 65 km from the study site) and Sion (542 m a.s.l., 134 km) has a small impact. Differences in annual mass balances in comparison with the reference show SDs of $\sigma _{\rm {meteo}} = \pm$ 0.06 and 0.08 m w.e. a$^{-1}$
 over the entire time series, respectively, and no bias (Supplementary Figs 12 and 8; Fig. 13a). The agreement of inferred mass-balance distribution with the two point measurements, expressed by the root-mean-square error (RMSE), is somewhat less favourable than for the reference (Fig. 13b).
It might appear counter-intuitive that the meteorological forcing only has a small effect on computed glacier-wide mass balance in our approach. The methodology of constraining the distributed model with seasonal point observations and geodetic mass change (Fig. 4), however, ensures that year-to-year variability, as well as long-term changes in mass balance are given by field data while the model only acts as a tool to extrapolate mass-balance components into unmeasured regions.
We investigate whether the two point observations available on Claridenfirn are able to accurately resolve the actual year-to-year variability in glacier-wide balance. To achieve this, we generated two different sets of point measurements where one of the two observations in each season (i.e. winter and late-summer survey) was randomly omitted. Based on this dataset reduced by 50% of all observations, the complete calibration procedure (Fig. 4) was repeated. We then compared the resulting glacier-wide mass-balance series to the reference, shedding light on effects of point observation density on inferred mass-balance variability. We find an average SD of $\sigma _{\rm {data}} = \pm$ 0.20 m w.e. a$^{-1}$
 (Fig. 13). Although this significant reduction in the observational dataset leads to a larger uncertainty in glacier-wide balance, the results indicate that Claridenfirn's temporal mass-balance variability is still resolved, consistent with findings by Thibert and Vincent (Reference Thibert and Vincent2009) for Glacier des Sarennes. We include this experiment in our uncertainty assessment as we acknowledge that the two available measurements may miss additional variability which might have been revealed by a higher number of measurement sites.
We combine the uncertainties derived in the above experiments as

to yield an estimate of the uncertainty due to mass-balance extrapolation from the point- to the spatial scale. We find $\sigma _{\rm {spatial}} = \pm$ 0.22 m w.e. a$^{-1}$
 .
.
The spatial snow distribution multiplier $D_{\rm {snow}}$ (Supplementary Fig. 2) is a poorly constrained element of our approach although exerting an important control on spatial mass-balance distribution. It only depends on topographic characteristics but cannot be validated directly by the in situ data. To investigate its importance for inferring glacier-wide mass balance we perform two additional experiments by setting $f_{D_{\rm {snow}}}$
 (Eqn (3)) to 0.7 and 1.3, respectively, throughout the entire study period. This corresponds to a major change in the amplitude of spatial snow variability, i.e. suppressed or enhanced local minima/maxima of snow accumulation. When repeating the calibration procedure (Fig. 4) we find that highly unrealistic parameter combinations are needed with these prescribed values of $f_{D_{\rm {snow}}}$
 to match both point and geodetic observations (e.g. values of ${\rm d}T/{\rm d}z$
 of up to –0.02$^{\circ }$
 C m$^{-1}$
 , or ratios between $r_{\rm {ice}}$
 and $r_{\rm {snow}}$
 of up to 7). Also, the RMSE at point measurements increases by a factor of two or more. This indicates that – although observations can be matched with this important change in prescribed snow distribution – the major departures from the assumptions taken in our reference model are unreasonable as they are unable to honour measurements and physical model parameters at the same time.
5.2.2 Uncertainty due to periodic updates of hypsometry
A further potential source of uncertainty when inferring glacier-wide mass balance is the surface area-elevation distribution (glacier hypsometry). In the case of Claridenfirn, new DEMs and glacier outlines are available in time intervals of 6 to 23 years, but surface elevation and glacier extent were linearly interpolated in between. To assess the impact of this approximation, mass balance was recomputed using the closest DEM in time. The effect is small, and differences compared to the reference spread around 0, with an average SD of $\sigma _{\rm {area}} = \pm$ 0.07 m w.e. a$^{-1}$
 .
.
5.2.3 Impact of uncertainties on frontal ablation
We define two additional experiments for assessing the impact of the assumptions related to the computation of ice volume flux and frontal ice break-off. In these experiments, all effects reducing or increasing frontal ablation estimates are systematically superimposed: (i) ice thickness is decreased/increased by 5% (Funk and others, Reference Funk, Bösch, Kappenberger and Müller-Lemans1997), (ii) surface flow velocity is decreased/increased by 10%, (iii) basal sliding fraction is set to 0 or 100% and (iv) the poorly constrained, annually interpolated value of $f_{\rm {ret}}$ is increased/decreased by 50% in each year (Eqn (6)). Most error bounds were arbitrarily set but are conservative. The four factors are unlikely to be met at the same time; the experiments thus define a highly conservative uncertainty range. For both experiments, the model-based mass-balance extrapolation was re-optimized using the same in situ point measurements and geodetic mass changes (Fig. 4).
The experiments indicate that the assumptions made when estimating frontal ice break-off only impact on inferred glacier-wide mass balance to a limited extent, although the maximum value of inferred frontal ice break-off differs by $-$ 25 and $+$
 85% from the reference for the two experiments, respectively. Year-to-year variability in mass balance remains almost unchanged and the cumulative mass loss over the entire study period agrees with the reference since the results have been constrained to match observed geodetic balances (Supplementary Figs 9 and 10). Differences in glacier-wide mass balance relative to the reference show an average SD of $\sigma _{\rm {frontal}} = \pm$
 0.06 m w.e. a$^{-1}$
 (Fig. 13a). Although a match with observational data can be found also with substantially different frontal ablation, the quality of the computed mass-balance distribution, i.e. the agreement with the point observations, decreases (Fig. 13b); errors almost double for the upper-bound estimate of frontal ice break-off.
5.2.4 Availability of high-frequency geodetic mass change
In total, seven DEMs are available over the study period, with intervals of between 6 and 23 years. The temporal frequency of observed geodetic mass change is thus relatively high. In an additional experiment we assessed the potential effect of less frequent DEMs to constrain our inferred annual time series of glacier-wide mass balance. We left out every second DEM, resulting in only three (1936–1979, 1979–2003, 2003–2019) instead of six time periods with information on geodetic mass change. As above, we repeated the complete calibration procedure (Fig. 4) and compared resulting annual mass balances to the reference. We find a rather small SD of $\sigma _{\rm {DEMfreq}} = \pm$ 0.07 m w.e. a$^{-1}$
 . This indicates that a high frequency of DEMs, allowing us to constrain cumulative mass change more tightly, is not an essential prerequisite for application of our approach, thus emphasizing its robustness.
5.2.5 Local mass-balance uncertainty
Furthermore, we investigated the uncertainty in computed mass-balance distribution based on the experiment with a 50% random reduction in seasonal point observations (see above). By confronting local mass balance extrapolated to the point observations that were not used in the calibration procedure, we find an average SD of $\sigma _{\rm {local, w}} = \pm$ 0.30 m w.e. for the winter surveys, and of $\sigma _{\rm {local, a}} = \pm$
 0.37 m w.e. for the annual surveys. In addition, we also validated computed mass-balance distribution in the year 1993/1994 against 10 independent point observations at stakes that, at the time, were installed for the determination of the flow velocity (Fig. 3), and find $\sigma _{\rm {local, a, 1994}} = \pm$
 0.77 m w.e. Uncertainties in extrapolated local mass balance are thus significantly higher than for glacier-wide mass balance, as they cannot be constrained with geodetic mass changes and rely solely on the used extrapolation procedure. Nevertheless, the results are satisfying given the small number of point observations, confirming the robustness of the applied methodology.
5.3 Integrative uncertainty estimate
We combine all potential sources of uncertainty to an integrative uncertainty estimate for both the annual glacier-wide mass balance and its long-term average. Individual uncertainty components are combined via the root sum of squares assuming them to be independent. Using the specific estimates for Claridenfirn derived above and similar to Zemp and others (Reference Zemp2013), we account for the following uncertainty sources: $\sigma _{\rm {point}} = \pm$ 0.10 m w.e. a$^{-1}$
 is the overall uncertainty in the raw point measurements at the scale of the entire glacier. $\sigma _{\rm {spatial}} = \pm$
 0.22 m w.e. a$^{-1}$
 is the uncertainty due to spatial extrapolation of mass balance. $\sigma _{\rm {area}} = \pm$
 0.07 m w.e. a$^{-1}$
 is the uncertainty due to uncertain area-elevation distribution in an individual year and $\sigma _{\rm {frontal}} = \pm$
 0.06 m w.e. a$^{-1}$
 is the uncertainty due to assumptions on frontal ice break-off. Combining these components with

yields an overall uncertainty in annual glacier-wide mass balance of $\sigma _{\rm {glac}} = \pm$ 0.25 m w.e. a$^{-1}$
 , which is similar to other long-term glaciological mass-balance series on alpine glaciers (e.g. Zemp and others, Reference Zemp2013; Beedle and others, Reference Beedle, Menounos and Wheate2014; Andreassen and others, Reference Andreassen, Elvehøy, Kjøllmoen and Engeset2016; Klug and others, Reference Klug2018). Note that assumptions are highly conservative, i.e. most experiments for investigating uncertainties are based on constellations that are widely incompatible with available evidence (e.g. in the case of spatial extrapolation or frontal ice break-off). The actual error in annual glacier-wide balance is thus likely to be smaller.
Uncertainties in long-term average mass balance are significantly smaller as the glaciological series have been constrained using geodetic mass changes with uncertainties of between $\sigma _{\rm {geod}} = \pm$ 0.07–0.18 m w.e. a$^{-1}$
 , depending on the precision of the DEMs and the length of the time interval covered. Assuming uncertainties in annual glacier-wide mass balance $\sigma _{\rm {glac}}$
 (Eqn (11)) to be uncorrelated in time, they are reduced by the root of the number of years when considering longer periods. This leads to an estimate of mass-balance uncertainty below $\pm$
 0.10 m w.e. a$^{-1}$
 for periods longer than seven years, and below $\pm$
 0.05 m w.e. a$^{-1}$
 when considering a time span of more than three decades.
6. Conclusion
Direct measurements of seasonal glacier surface mass balance on Claridenfirn, Switzerland, have been performed continuously for 106 years at two sites, resulting in a globally unequalled temporal record of high-elevation snow accumulation and snow/ice melt. This study presents a comprehensive description of the approaches taken when evaluating the long-term field data for inferring consistent time series, both at the level of the measurement points and for glacier-wide mass balance.
The centennial data series of accumulation, melt and mass balance at two point locations show significant variations over time. Positive mass-balance anomalies occurred in the 1910s and in the 1960s/70s, whereas the 1940s and the last two decades were characterized by strongly negative deviations from the average over the 106 years of observation. The decade 2010–2020 showed an increase in melt rate by 1.07 m w.e. a$^{-1}$ , or $+$
 50%, relative to the period 1960–1990. Long-term variability in accumulation is relatively small, not correlated with mass-balance changes at the decadal scale, and can only be relevant in individual periods. Reduced accumulation, for example, supported the negative mass-balance anomalies in the 1940s and 2000s. In general, mass-balance changes are clearly driven by melting.
The model-based approach to infer glacier-wide mass balance from the point measurements was shown to be reliable. It allows unifying both in situ seasonal point observations and geodetic mass changes obtained from remote sensing. Overall uncertainties in annual glacier-wide mass balance of $\pm$ 0.25 m w.e. a$^{-1}$
 , and uncertainties in decadal average balance of $\lt$ $\pm$
$\pm$ 0.10 m w.e. a$^{-1}$
 are estimated, comparable with series on other alpine glaciers (e.g. Thibert and others, Reference Thibert, Blanc, Vincent and Eckert2008; Zemp and others, Reference Zemp2013; O'Neel and others, Reference O'Neel2019).
The overall mass balance of Claridenfirn is impacted by the process of frontal ice break-off, an ablation component difficult to be quantified precisely at a centennial timescale. Considerations of ice volume flux at a cross-profile indicate significant long-term variations in frontal ice loss, equivalent to 0.00–0.25 m w.e. a$^{-1}$ relative to overall glacier area. On average, frontal ice break-off contributes to up to $\sim$
 9% of total annual ablation. The effect of changes in frontal mass loss mostly explains $\lt$
 10% of glacier-wide mass-balance change relative to the period 1960–1990, but accounts for $\sim$
 20% in 2010–2020. Experiments have shown that assumptions made when estimating this component have a minor impact on glacier-wide mass-balance series. By comparison to numerous long-term monitoring programmes, it was demonstrated that the observations at Claridenfirn are representative for mass-balance changes at the scale of the European Alps.
Supplementary material
The supplementary material for this article can be found at https://doi.org/10.1017/jog.2021.22.
Acknowledgements
This study was conducted in the frame of Glacier Monitoring Switzerland (GLAMOS). The programme is supported by the Federal Office for the Environment, MeteoSwiss in the frame of the Global Climate Observing System (GCOS) Switzerland and the Swiss Academy of Sciences (SCNAT). The centennial measurement series relied on many scientists and volunteers. To mention just a few, we are grateful for the contribution by A. de Quervain, R. Billwiller, R. Streiff-Becker, A. Lemans, M. Aellen, H. Müller, M. Funk and the guardians of the Swiss Alpine Club hut J. Dürst, R. Dürst, B. Marti and P. Beglinger. MeteoSwiss supplied the weather data, and swisstopo is acknowledged for providing historical maps, digital elevation models and aerial photographs. We thank the World Glacier Monitoring Service for collecting and distributing regional mass-balance data. Two anonymous reviewers and the editor S. O'Neel provided insightful and constructive comments for finalizing the paper.
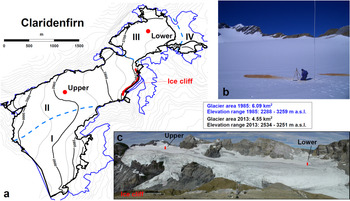


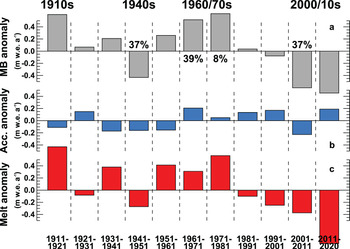


 Open access