

Introduction
There is growing recognition of the importance of creating fiscal space for increasing domestic government funding of health care and other social services such as education, social welfare, sanitation and housing. Since the publication of the World Health Report 2010, universal health coverage (UHC) is now strongly supported by national governments and international organizations and increasingly considered as an overarching goal in which health equity and health as a human right are central features (WHO, 2010; UN General Assembly, 2012, 2015a). UHC means that everyone has access to needed, effective services of adequate quality and is protected against financial hardship from using these services. One of the fundamental and most debated issues within the context of UHC is the ability of countries to raise sufficient resources for health. Emerging evidence from countries in different regions of the world advancing toward UHC show progress was achieved by relying primarily on mandatory pre-payment financing mechanisms such as general taxes and mandatory health insurance contributions (Kutzin, Reference Kutzin2012; Akiko et al., Reference Arze del Granado, Coady and Gillingham2014; Doherty et al., Reference Doherty, Kirigia, Ichoku, McIntyre, Hanson and Chuma2014).
The recently adopted Addis Ababa Action Agenda that provides a global financing framework for implementing the sustainable development goals (SDGs) is also focusing attention on the need for improved domestic government funding of social services. The Action Agenda promotes ‘inclusive economic growth, protecting the environment and promoting social inclusion’ (UN General Assembly, 2015b: para 1). Inclusive development, either social or economic, requires investment in people’s capabilities through public spending on social services, particularly health, education and nutrition (UN Development Programme, 2013). Public spending on social services is a means of income redistribution and contributes to sustained inclusive economic development.
Thus, both the health policy focus on UHC and the broader SDGs call for increased government funding of health and other social services. This paper considers issues related to fiscal space for such increased government spending.
Fiscal space refers to the budgetary room that allows a government to devote resources to specific services or activities without prejudicing the sustainability of its financial position (Tandon and Cashin, Reference Stenberg, Elovianio, Chisholm, Fur, Perucic, Rekve and Yurekli2010). There are two major factors that not only determine domestic government spending on health care (and other social services), but are the key policy levers for increasing such spending:
-
∙ The level of total government expenditure; this can be expressed as government expenditure as a percentage of gross domestic product (GDP), which, in turn, is influenced by government revenue as a percentage of GDP and government debt levels; and
-
∙ The percentage of total government expenditure devoted to the health sector (and other social sectors) – i.e., the prioritization of spending on the health sector.
To date, most of the literature on the fiscal space for health care has focused on budget reprioritization in favor of the health sector, increasing external funding for health care, generating sector-specific funding (e.g. possible dedicated taxes or mandatory health insurance) and improving efficiency in the use of health sector funds, sometimes with a limited focus on the macro-economic context (Tandon and Cashin, Reference Stenberg, Elovianio, Chisholm, Fur, Perucic, Rekve and Yurekli2010). This is understandable, given that the more fundamental fiscal policy issues (e.g. government revenue, expenditure and debt levels) are generally seen as beyond the domain of the health sector. However, a key drawback of focusing on generating sector-specific funding and prioritization of the health sector in the use of government funds is that this potentially impacts adversely on other social services. Not only are social services such as education key social determinants of health, thus ultimately contributing to improved health status, they are of importance in their own right in contributing to inclusive social and economic development. In another paper in this special issue, McIntyre et al. (Reference McIntyre, Meheus and Røttingen2017) argued that it would be more appropriate to express government spending on health relative to GDP rather than general government expenditure. They showed that in order to progress toward UHC, government spending on health should be at least 5% of GDP and that it would cost US$86 per person to ensure access to primary health care services.
It is therefore important to consider broader fiscal space issues to improve public spending on all social services. In this paper we examine options for increasing domestic government revenue in low- and middle-income countries (LMICs). Other sources of fiscal space for the health sector noted above are outside the remit of this paper. We focus not only on sources of fiscal space, but also the factors influencing government revenue levels and domestic taxation policy choices. The paper is organized as follows. In the following section we examine the levels of government expenditure, revenue and debt by country category. In third section, we consider fiscal space options for LMICs, and discuss tax and non-tax options to generate government revenue as well as factors influencing domestic taxation policies. In the last section we summarize the various fiscal space options.
Overview of government revenue, expenditure and debt levels by country category
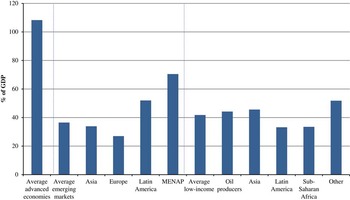
Figure 1 provides an overview of government revenue and expenditure by country category (based on the latest International Monetary Fund [IMF] country categories). It should be noted that government revenue and expenditure includes resources generated through tax and other government sources such as the exploitation of mineral or other natural resources and social security or mandatory insurance contributions. Ministries of finance regard mandatory social security contributions as part of the ‘tax burden’ on residents when addressing fiscal issues. There is a relationship between the country categories and average government revenue and expenditure levels. Government revenue in 2012 ranged from an average of slightly <36% of GDP in advanced economies to about 28% in emerging markets and <22% in low-income countries. Government expenditure was nearly 42% of GDP in advanced economies, just under 30% in emerging markets and nearly 25% in low-income countries. Thus most countries in all categories were operating deficit budgets in 2012 – which is unsurprising, given the global economic crisis at that time. However, the size of the budget deficit was far lower in low-income countries (<3% of GDP) and emerging markets (2% of GDP) than in advanced economies (just over 6% of GDP). The lowest levels of government revenue and expenditure are found in Sub-Saharan Africa, Asia (which include China and India) and MENAP countries (Middle East, North Africa and Pakistan).
Government revenue and expenditure as % of GDP by country category (2012) Source: International Monetary Fund (2014). Note: MENAP: Middle East, North Africa and Pakistan.

The next sections examine in more detail the levels of government expenditure, revenue and debt across countries.
Government expenditure levels
Figure 2 shows considerable variation in government expenditure relative to GDP across countries with government expenditure ranging from <14% of GDP (in countries such as Sudan, Madagascar and Guinea-Bissau) to >55% of GDP (in countries such as Finland, Denmark and France). While the relationship between per capita GDP and government expenditure relative to GDP is positive, it is a relatively weak correlation (correlation coefficient=0.326). Some high-income countries/jurisdictions have relatively low levels of government expenditure, such as Singapore (14.5% of GDP) and Hong Kong (19.3% of GDP). Conversely, some low-income countries have relatively high levels of government expenditure, such as Lesotho (63.1% of GDP) and the Solomon Islands (50.6% of GDP).
Relationship between log of per capita GDP and government expenditure (2012) Source: International Monetary Fund (2015).

Thus, although Figure 1 shows that the level of government expenditure tends to be higher on average in advanced economies than in emerging markets and low-income countries, those averages obscure wide variations across countries reflecting fiscal policy choices and the level of government revenue generated.
Government revenue levels
As with government expenditure, there are wide variations in government revenue levels across countries. Government revenue as a percentage of GDP ranges from 9.9% in Sudan and <12% in for instance Guatemala and Bangladesh to >50% in countries such as Finland, Denmark and Norway as well as other oil-producing countries like Libya and Kuwait and some outlier low-income countries (particularly those emerging from long-standing conflict such as Timor-Leste, likely related to a weak economy and limited private sector activity in such contexts). As shown in Figure 3, there is a weak yet positive correlation (correlation coefficient=0.387) between per capita GDP and government revenue levels.
Relationship between log of per capita GDP and government revenue (2012) Source: International Monetary Fund (2015).

Government debt levels
As Figure 1 shows all categories of country were operating on deficit budgets in 2012. Figure 4 provides an overview of the levels of government debt. The IMF has indicated that it regards ‘a debt to GDP ratio of 60% for high-income countries and 40% for LMICs as “prudent” debt levels’ (Chowdhury and Islam, Reference Chowdhury and Islam2010). However, there is no substantive basis for those recommendations: the 60% ratio is simply the median debt to GDP ratio in Europe at the time of moving toward monetary union. The IMF referred to the LMIC ratio as a ‘useful benchmark’ but added that “it bears emphasizing that a debt ratio above 40 percent of GDP by no means necessarily implies a crisis – indeed […] there is an 80 percent probability of not having a crisis (even when the debt ratio exceeds 40 percent of GDP)” (Quoted in Chowdhury and Islam, Reference Chowdhury and Islam2010).
Government gross debt as % of GDP by country category (2012) Source: International Monetary Fund (2014). Note: MENAP: Middle East, North Africa and Pakistan.
What is interesting to note from Figure 4 is that while most of the so-called emerging markets and low-income countries have complied with the IMF’s ‘prudent’ debt levels (the exceptions being the MENAP region, where many oil-producing countries are located), the advanced economies have not. Countries belonging to this last category registered gross debt levels exceeding 100% of GDP in 2012.
Can LMICs create fiscal space for domestic funding of health and other social services?
The above overview highlights that although levels of government revenue and expenditure are generally lower in LMICs than in high-income countries, there is considerable variation across countries. This raises the question of whether LMICs that currently have relatively low levels of government expenditure are able to create budgetary room to allow them to devote an increasing amount of resources to social services over time without jeopardizing financial sustainability.
From this perspective, there are clearly concerns about constantly running a deficit budget and developing an unsustainable level of government debt. If domestic public expenditure on social services is to be increased, it will be necessary to explore ways of increasing government revenue. Deficit financing, which could be used to increase such spending in the short term, is an important mechanism for avoiding spending cuts on social services during periods of economic crisis. While operating a deficit budget is not a favorable option in any context, it is more appropriate to incur debt to develop assets, such as investing in human capital development, than to increase spending on military activities (Balakrishnan et al., Reference Balakrishnan, Elson, Heintz and Lusiani2011).
The following sections of this paper consider ways in which LMICs could potentially increase government revenue. First, various sources of government revenue are examined and then issues involving tax rates and related taxation policy issues are discussed. Finally, non-tax government revenue sources are considered.
Overview of government revenue sources
A range of factors influences government revenue levels, including the types of revenue that can feasibly be generated within a specific country. On average in OECD countries, 61% of government revenue is generated from taxes (e.g. on income, consumption, wealth, property and capital), 24% from social contributions (e.g. for pensions, health and social security) and 15% from grants and other revenue (OECD, 2013). The generation of revenue through social contributions is partly related to the level of formal sector employment; generating much revenue from this source is difficult if formal sector employment is low. However, it is also related to country preferences as regards levying social contributions. For example, as shown in Figure 5, while social contributions are widely used as a revenue source in many European countries, their use is very limited in countries such as Australia and New Zealand, despite those countries having high levels of formal sector employment.
Distribution of government revenue in OECD countries by type of revenue (2011) Source: OECD (2013).

Grants from foreign governments or international organizations are quite rare in OECD countries, though played a role in the past. For example, the US Marshall plan after World War II facilitated the establishment of the National Health Service in the UK (Fox, Reference Fox2004). Other revenues (e.g. proceeds from the sale of state assets or natural resources and income from state-owned property) can be significant in some member countries. For example, Norway raises >25% of revenues from other sources – above all, the sale of oil and oil products (Figure 5).
The level of government revenue is also influenced by the types of tax that a government chooses to levy and the rate of each tax levied (the latter issue is considered in the next section). On an average in OECD countries, income and profit taxes account for 35% of tax revenue, mandatory social contributions (which, as noted above, are a form of dedicated tax) 26%, payroll taxes 1%, property taxes 5.6%, taxes on goods and services (e.g., value added tax or general sales tax [GST]) 32% and other taxes <1%. Figure 6 shows that income and profit taxes and social contributions (which are also levied on income) account for the bulk of tax revenue in most OECD countries.
Distribution of tax revenue in OECD countries by type of tax (2012) Source: OECD (2014).

Figure 6 also shows that taxes on goods and services account for a much higher share of total tax revenue in OECD countries that do not fall into the high-income category (such as Mexico and Turkey) than in other OECD countries. Similarly, a relatively heavy reliance on indirect taxes on goods and services (e.g. VAT or GST and excise and import duties) is also observed for LMICs in Asia though there is nevertheless variation across countries (O’Donnell et al., Reference O’Donnell, van Doorslaer, Rannan-Eliya, Somanathan, Adhikari, Akkazieva, Harbianto, Garg, Hanvoravongchai, Herrin, Huq, Ibragimova, Karan, Kwon, Leung, Lu, Ohkusa, Pande, Racelis, Tin, Tisayaticom, Trisnantoro, Wan, Yang and Zhao2005).Footnote 1
In general, there is greater reliance on indirect (as opposed to direct) taxes in LMICs than in high-income countries, which is related to the far lower levels of formal sector employment in the former. In many LMICs, the informal sector forms a large share of GDP and enforcing payment of income taxes and social contributions (i.e. direct taxes) on those outside of formal employment is challenging and administratively costly. Excise taxes on goods and services that are used by the informal sector can be imposed to raise additional revenue such as taxes on mobile phone use. However, additional forms of indirect taxation must be carefully evaluated as they may be potentially regressive (see also next sections).
However, across countries with comparable GDP and formal sector employment levels, there are differences in the level of total tax revenue and the distribution of that revenue by type of tax. Tax rates are a key factor contributing to those differences.
Tax rates
There is considerable variation in the rates of direct and indirect taxes across countries. For example, within the EU, VAT rates range from 15% in Luxembourg and 18% in Cyprus and Malta to 25% in Croatia, Denmark and Sweden and 27% in Hungary (European Commission, 2013). Outside the EU, lower VAT rates can be found: 5% in Taiwan, 7% in Thailand and 10% in Botswana, Lebanon and South Korea (United States Council for International Business (USCIB), 2013). Some jurisdictions, such as the Canary Islands, Guernsey and Hong Kong, levy no VAT or GST.
Rates of personal income tax and mandatory social security contributions vary considerably across countries too. Those variations do not follow a set pattern according to the level of economic development. For example, while Papua New Guinea and India have per capita GDP levels of <$2000, they levy some of the highest taxes on personal income and mandatory social security contributions, alongside highest-income countries such as Luxembourg (per capita GDP of $105,509), Denmark ($56,369) and Belgium ($43,593). All of these countries have effective income tax and social security rates that combined exceed 40% of personal income (KPMG, 2011). At the other end of the spectrum, LMICs such as Angola, along with high-income countries such as Singapore and Switzerland have income tax and social security rates of below 20%. Many of the oil-producing nations, such as Kuwait, Bahrain, Oman and the UAE, have no income tax but some social security payments (of <10%), while Qatar levies no income tax or social security contributions (KPMG, 2011).
Some countries/jurisdictions, such as Denmark, impose high direct income taxes and social security contributions as well as high indirect taxes such as VAT. Others, such as Luxembourg, have high direct taxes but low VAT relative to other EU countries. Still others, such as Taiwan and Hong Kong, have both low direct income taxes and low VAT, although taxes on goods to which VAT does not apply may be high in those jurisdictions – e.g., Hong Kong and Singapore levy taxes of 35–100% on motor vehicles (USCIB, 2013). A tax that is increasingly levied in both high-income and LMICs are excise taxes on products harmful to health such as tobacco, alcohol and more recently unhealthy food and beverages (the so-called ‘sin taxes’). Sin taxes often serve a dual purpose: to generate additional government revenue and at the same time discourage the use of these goods and services (Stenberg et al., 2010).
The rates set for the various categories of direct and indirect tax are ultimately a matter of fiscal policy choice. The next section explores some issues that may influence that choice.
Some factors influencing domestic taxation policy choices
A key factor that can, or at least should, influence the relative emphasis placed on different forms of taxation, including the rate of each type of tax, is that of equity. From an equity perspective, there is a relative preference for progressive rather than regressive forms of taxation. A progressive tax is a tax whereby groups with a higher income contribute a higher percentage of their income than lower-income groups (i.e. the tax rate increases with income). A tax is considered regressive when lower-income groups contribute a higher share of income than higher-income groups. In general, direct taxes tend to be progressive and indirect taxes regressive (Van Doorslaer and Wagstaff, Reference Van Doorslaer and Wagstaff1993; Wagstaff et al., Reference Wagstaff, van Doorslaer, van der Burg, Calonge, Christiansen, Citoni, Gerdtham, Gerfin, Gross, Häkinnen, Johnson, John, Klavus, Lachaud, Lauritsen, Leu, Nolan, Perán, Pereira, Propper, Puffer, Rochaix, Rodríguez, Schellhorn, Sundberg and Winkelhake1999). However, some recent studies have found that in some LMICs, VAT and other indirect taxes can be mildly progressive (O’Donnell et al., Reference O’Donnell, van Doorslaer, Rannan-Eliya, Somanathan, Adhikari, Akkazieva, Harbianto, Garg, Hanvoravongchai, Herrin, Huq, Ibragimova, Karan, Kwon, Leung, Lu, Ohkusa, Pande, Racelis, Tin, Tisayaticom, Trisnantoro, Wan, Yang and Zhao2008; Mills et al., Reference Mills, Ataguba, Akazili, Borghi, Garshong, Makawia, Mtei, Harris, Macha, Meheus and McIntyre2012). While taxes on goods and services may not be regressive in many low-income countries, they are unquestionably less progressive than taxes on personal income and corporate profits and are strongly regressive in most middle- and high-income countries (Wagstaff et al., Reference Wagstaff, van Doorslaer, van der Burg, Calonge, Christiansen, Citoni, Gerdtham, Gerfin, Gross, Häkinnen, Johnson, John, Klavus, Lachaud, Lauritsen, Leu, Nolan, Perán, Pereira, Propper, Puffer, Rochaix, Rodríguez, Schellhorn, Sundberg and Winkelhake1999; O’Donnell et al., Reference O’Donnell, van Doorslaer, Rannan-Eliya, Somanathan, Adhikari, Akkazieva, Harbianto, Garg, Hanvoravongchai, Herrin, Huq, Ibragimova, Karan, Kwon, Leung, Lu, Ohkusa, Pande, Racelis, Tin, Tisayaticom, Trisnantoro, Wan, Yang and Zhao2008; Mills et al., Reference Mills, Ataguba, Akazili, Borghi, Garshong, Makawia, Mtei, Harris, Macha, Meheus and McIntyre2012; Reeves et al., Reference Reeves, Gourtsoyannis, Basu, McCoy, McKee and Stuckler2015).
It defeats the purpose of investing in expenditure on social services if the revenue used for such expenditure is generated from regressive sources. For example, the UN special rapporteur on the right to food noted with reference to Brazil that
The tax structure in Brazil remains highly regressive. Tax rates are high for goods and services and low for income and property, bringing about very inequitable outcomes …. [W]hile the social programmes developed under the ‘Zero Hunger’ strategy are impressive in scope, they are essentially funded by the very persons whom they seek to benefit, as the regressive system of taxation seriously limits the redistributive aspect of the programmes (Quoted in: Balakrishnan et al., Reference Balakrishnan, Elson, Heintz and Lusiani2011).
Progressive tax revenue sources should be prioritized, particularly in countries with high levels of income inequality. While in the past, international financial organizations such as the IMF have argued that taxes on personal income and corporate profits should be kept to a minimum to encourage savings and investment, respectively, there is scope for raising such taxes in some countries. As indicated in the previous section, there are many countries that have relatively low personal income taxes and social security contributions.
However, a key problem is ‘tax competition’ whereby some countries lower corporate taxes or offer other tax benefits in order to attract investment. While some analysts argue that such competition is healthy, there are growing international concerns about its harmful aspects by encouraging a ‘race to the bottom’, which ultimately leads to tax revenue losses in all countries involved in that race. The average corporate tax rate in OECD countries declined from 37.6% in 1996 to 28.3% in 2006 (Tax Justice Network, 2012). Unsurprisingly, tax competition is particularly harmful for lower-income countries and weaker states, which are less capable of dealing with such competition and ultimately suffer because of their lower revenue bases (Keen and Simone, Reference Keen and Simone2004). There have been some efforts to address the issue, such as those outlined in the 1998 OECD report Harmful tax competition; but they have been largely unsuccessful (Tax Justice Network, 2006). The OECD is now focusing on promoting transparency in company earnings and tax payments and the sharing of information across countries’ tax authorities. Recently, the European Commission has been more pro-active in investigating tax rulings granted to companies, and has ruled against ‘selective tax advantages’ in several member states considering them to be illegal under EU state aid rules (European Commission, 2015, 2016).
Other factors affecting tax revenue
Another practice closely associated with tax competition involves transnational companies avoiding corporate tax by ‘transferring’ earnings from activities in countries with higher tax rates to countries with low or zero taxes. For example, an ActionAid report documented how SABMiller, which owns most of the breweries in Africa and makes profits of >£2 billion a year, pays no tax at all in countries such as Ghana (ActionAid, Reference Akiko, Araujo, Cashin, Harris, Ikegami and Reich2010). It is able to avoid doing so because the brands of beer sold in African countries, though invented locally, are owned by SABMiller in The Netherlands. The African breweries pay the Dutch company massive royalties, on which the latter pays very little tax owing to the tax regulations in The Netherlands. Moreover, profits are gained through substantial management service fees that the African breweries have to pay to SABMiller’s sister companies based in Switzerland, where taxes on such earnings are minimal too.
Transfer pricing – whereby inputs are sold at highly inflated prices to a sister company so that very little profit is reflected in countries with high tax rates – is also frequently used for tax avoidance purposes. Although tax avoidance is not illegal insofar as companies comply with tax laws but simply ensure that profits are reflected to the greatest extent possible in countries with the lowest tax rates, many would nonetheless regard it as immoral, particularly when governments of LMICs are being deprived of desperately needed tax revenue to meet the social service needs of their population. The former and recently reappointed South African minister of finance has described ‘aggressive tax avoidance’ as a ‘serious cancer eating into the fiscal base of many countries’ (Quoted in: ActionAid, Reference Akiko, Araujo, Cashin, Harris, Ikegami and Reich2010).
Multinational corporations are not alone in practising tax avoidance. Domestic companies and high net worth individuals are frequently engaged in tax avoidance practices, too, not least because they have the resources to employ skillful tax consultants who ensure that the minimum tax is paid. For example, an investigation by the South African Revenue Service (SARS) determined that there are ~9300 high net worth individuals (defined as those with a gross income of >R7 million per year and/or assets in excess of R75 million), but only 360 of them are registered as taxpayers. SARS estimated that it was losing R48 billion in tax revenue annually from those individuals, which is equivalent to about 7% of total government revenue (Vanek, Reference Vanek2012).
Countries such as South Africa and Kenya have demonstrated how tax revenue can be increased significantly through improving tax compliance and without increasing tax rates (Hausman, 2010). This was achieved in South Africa by increasing the management capacity of the revenue authority, changing the authority’s organizational culture to one of delivering a service and zero tolerance for corruption, offering amnesties for tax evaders (i.e., those who had previously evaded tax are able to begin declaring taxable income without being penalized for previous evasion) and taking legal steps against those who remained non-compliant.
To increase the fiscal space for government spending on health and other social services, it is crucial that tax revenue authorities introduce measures to improve tax compliance if it remains weak. However, this may require overall improvements in state governance (particularly addressing corruption) as compliance may be weak owing to lack of trust that the government will use tax revenue appropriately. In addition, steps need to be taken to reduce the potential for tax avoidance. This is likely to be easier to achieve in the case of domestic companies and individuals.
As regards both tax avoidance by transnational corporations and activities such as capital flight, it is necessary to increase global cooperation and improve transparency, although those tasks have proved difficult to achieve to date. Nevertheless, it is important not only to exert moral suasion but also to highlight the potential for high-income countries to reduce their international aid responsibilities through creating an environment in which LMICs can increase their domestic government revenue. For example, it is estimated that the amount of annual tax revenue lost to developing countries as a result of transfer pricing manipulation is $98–106 billion, compared with total overseas development assistance of $83.5 billion in 2009 from the member countries of the OECD’s Development Assistance Committee (Balakrishnan et al., Reference Balakrishnan, Elson, Heintz and Lusiani2011). Suggested approaches to addressing this challenge include ensuring greater transparency in reporting on business activities and tax payments across the globe and the automatic exchange of information across tax authorities worldwide (Tax Justice Network, 2006, 2012; ActionAid, Reference Akiko, Araujo, Cashin, Harris, Ikegami and Reich2010). More ambitious proposals, including unitary taxation systems and taxing transnational companies on a consolidated basis and apportioning the revenue to states according to the geographical distribution of economic activities, are less likely to be enforceable.
Non-tax options for increasing government revenue
As noted above, many oil-producing countries can avoid imposing any income taxes but are still able to generate substantial government revenue through oil extraction (e.g., government revenue accounts for 31% of GDP in Qatar, 30% in the UAE, 39% in Oman, 27% in Bahrain and 68% in Kuwait). Figure 1 shows that even oil-producing countries falling into the low-income country category are able to generate substantial government revenue relative to GDP.
However, some countries with extensive oil or other natural resource reserves could potentially generate more government revenue from this source than they currently do. Thus key factors influencing total revenue are whether a country has mineral and/or other natural resources and whether the government has instituted appropriate policies to ensure that the country as a whole benefits from the exploitation of those resources (e.g. through extraction by a state-owned company or through securing appropriate royalties from private companies that extract the natural resources) (Witter and Outhred, Reference Witter and Outhred2015). Good governance is also critical: according to a recent report, in the first half of 2013 Nigeria lost about 5% of its oil output through theft (Katsouris and Sayne, Reference Katsouris and Sayne2013). Maximizing domestic government revenue from natural resources is becoming an increasingly important issue in Africa, not least following the discovery of oil in Ghana and gas resources in Tanzania. To underscore the importance of this potential source of government revenue: oil revenues account for an estimated 70% of government revenue in Nigeria (Revenue Watch Institute).
Once again, global action is required to support improved governance in the exploitation of natural resources in LMICs. A positive initiative was the approval of legislation by the European Parliament in June 2013 that requires all extractive companies (in the oil, gas and mineral sectors as well as loggers of primary forests) to publicly disclose any payments to national or regional governments that exceed €100,000.
In recent years, an increasing number of intergovernmental organizations and development banks, such as the IMF and the OECD, have also been advocating for a reform of fossil-fuel subsidies. The International Energy Agency estimated that in 2014, fossil-fuel subsidies totaled $500 billion (International Energy Agency, 2015). Although the subsidies intended to support poorer income groups, most of the benefits of subsidies are captured by high-income groups (Arze del Granado et al., 2010) and lead to excessive consumption that increases global carbon dioxide emissions and contribute to global warming (Bauer et al., Reference Bauer, Coady, Kangur, Josz, Ruggiero, Sdralevich, Singh and Villafuerte2013). There is now wide recognition that fossil-fuel subsidies represent a large opportunity cost and could be allocated to more productive sectors such as health or education. Reforming subsidies may also increase government revenue if fossil fuels are currently taxed differently than other consumer goods or services (e.g. lower VAT or GST rates) (Clements et al., Reference Clements, Coady, Fabrizio, Gupta, Alleyne and Sdralevich2013). In recent years, with the declining oil prices, a number of countries such as Indonesia, India, Iran and Malaysia have seized the opportunity to reform fossil-fuel subsidies (World Bank, 2015); Indonesia for instance reallocated the fiscal resources released by the subsidy reform toward social assistance programmes to mitigate the adverse impact on the poor and reduce public opposition (Asian Development Bank, 2015; Gupta et al., Reference Gupta, Dhillon and Yates2015).
Discussion
Current discussions about UHC and the SDGs highlight the need to increase domestic government expenditure on health and other social services in many countries. A frequent response to calls for increasing government expenditure on health and other social services in LMICs is that those countries lack the fiscal space. The information presented in this paper demonstrates that a country’s level of economic development does not predetermine the level of government revenue as a percentage of GDP, nor does it dictate the tax rates that a country should levy. Rather, the level of taxation is a fiscal policy choice or political decision, and a government’s revenue-generating ability is influenced by factors such as natural resource reserves and policies on their exploitation, employment levels, the degree of tax compliance and the efficiency of revenue collection. Clearly some countries appear more successful than others in creating fiscal space and have relatively high levels of government expenditure and revenue as a percentage of GDP irrespective of the level of economic development. We have explored a range of factors that can contribute to the considerable variation in government revenue as a percentage of GDP across countries with similar GDP per capita (see Figure 3), but further detailed research could shed light on the most important contributory factors in countries that have been particularly successful in creating fiscal space.
For LMICs in which the level of government revenue remains relatively low, there is a range of opportunities to increase that revenue without further burdening poorer population groups. If a country has considerable mineral and other natural resources, a key starting point is to assess government policy on the exploitation of those resources and whether government revenue from that source could be increased. A principal concern, however, is that the natural resources will become depleted. But recent research has shown that if the state plays a strong role by adopting economic policies that provide incentives to invest in diversifying productive capacity and if it invests in social services (that build human capital), natural resource wealth can be harnessed for equitable and sustainable development (UN Research Institute for Social Development, 2012).
For countries that are not rich in natural resources, a careful assessment of existing taxation policy and practice is necessary. Recent experience has demonstrated how government revenue can increase significantly through increased efficiency in tax collection and improved compliance. While it may be important to introduce or increase some taxes such as sin taxes as soon as possible for public health reasons, it may only be appropriate to consider raising taxes after improving tax collection efficiency and compliance. From an equity perspective, priority should be given to generating revenue from direct taxes. However, in the context of low levels of formal sector employment in low-income countries, it is unavoidable that indirect taxes comprise a large proportion of tax revenue. Some indirect taxes, such as those on luxury goods, are far more progressive than others, including VAT. In addition, the careful selection of goods and services to be VAT exempt or zero-rated can reduce that tax’s potential regressivity. There is a range of other ‘innovative’ financing options (such as financial transactions taxes) that are not explored in this paper as they are extensively documented elsewhere (see, e.g. High-Level Taskforce on Innovative International Financing for Health Systems, 2009).
The ability of LMICs to successfully implement such strategies for increasing government revenue is in many ways dependent on supportive global action. That includes addressing tax competition and improving transparency in business activities, tax payments and payments to governments by extractive companies. It is very encouraging that the Addis Ababa Action Agenda (UN General Assembly, 2015b: Clause 23) commits to such actions, including making ‘sure that all companies, including multinationals, pay taxes to the Governments of countries where economic activity occurs and value is created’.
An important area for future research is the political-economy of creating fiscal space. While this paper argues that there is considerable potential for increasing government revenue and expenditure in many LMICs, making this a reality depends on national political processes, which are often subject to external influence.
Finally, efforts to increase domestic public funding of health services should be accompanied by strategic purchasing reforms to promote the efficient and equitable use of scarce resources as demonstrated in Thailand (Tangcharoensathien et al., 2015).
Conclusion
In order to make progress toward UHC and the SDGs, governments in LMICs will need to improve domestic funding sources for health, focusing in particular on mandatory pre-payment financing. While external aid will still be needed for the poorest countries to implement UHC reforms, the mantra of ‘lack of fiscal space’ should be challenged; it is possible to increase government revenue where this is currently low through strategies such as improved efficiency and compliance in revenue collection, whether this takes the form of taxes or other revenue sources such as from the exploitation of natural resources, increased tax rates where appropriate and/or pursuing innovate financing mechanisms. This requires bold domestic fiscal policy choices but also global action to support domestic efforts.
Acknowledgments
This paper was written as part of the Chatham House Working Group on Financing.
Financial Support
This work is based on research supported by the South African Research Chairs Initiative of the Department of Science and Technology and National Research Foundation (NRF) of South Africa and the RESYST research consortium funded by UKaid from the Department of International Development. Any opinion, finding and conclusion or recommendation expressed in this material is that of the authors and the NRF and UKaid do not accept any liability in this regard.


 Open access