


Introduction
The welfare issues faced by broiler chickens (Gallus gallus domesticus) raised in commercial, intensive systems are manifold and have been well documented. Welfare, defined as the state of an animal’s mental and physical well-being, is determined by how that animal interacts with the environment it finds itself in (Carenzi & Verga Reference Carenzi and Verga2009). Broiler chickens have been selectively bred for increased muscle deposition (i.e. meat) in a short space of time, with fast-growing strains of chicken reaching around 2 kg in 30 days (Torrey et al. Reference Torrey, Mohammadigheisar, Nascimento dos Santos, Rothschild, Dawson, Liu, Kiarie, Edwards, Mandell, Karrow, Tulpan and Widowski2021). The welfare of highly selected fast-growing broiler chickens is influenced greatly by their genetics, environment and management (Anderson et al. Reference Anderson, Campbell, Crump, Arnott and Jacobs2021; Mench et al. Reference Mench, de Jong, Butterworth, Butterworth, Berg, de Jong, Mench, Raj and Manteca2021a; Grandin & Deesing Reference Grandin, Deesing and Grandin2022). Fast-growing chickens commonly face many painful diseases, including cardiovascular disease, lameness and skeletal problems, skin problems from contact dermatitis, and respiratory problems, among others (Mench et al. Reference Mench, de Jong, Berg, Raj and Butterworth2021b; Wilcox et al. Reference Wilcox, Sandilands, Mayasari, Asmara and Anang2024). Many articles describe and investigate the welfare issues found on broiler chicken farms, which demonstrates there are serious welfare concerns for fast-growing broiler chickens in commercial production (e.g. Tuyttens et al. Reference Tuyttens, Federici, Vanderhasselt, Goethals, Duchateau, Sans and Molento2015; de Jong et al. Reference de Jong, Hindle, Butterworth, Engel, Ferrari, Gunnink, Perez Moya, Tuyttens and Van Reenen2016; Mench et al. Reference Mench, de Jong, Berg, Raj and Butterworth2021b; Wilcox et al. Reference Wilcox, Sandilands, Mayasari, Asmara and Anang2024). Husbandry and management on farms affects chicken welfare; from the lighting (Olanrewaju et al. Reference Olanrewaju, Thaxton, Dozier, Purswell, Roush and Branton2006; van der Sluis et al. Reference van der Sluis, van der Eijk, Izquierdo Garcia-Faria, te Beest, Wolthuis-Fillerup and de Jong2025), litter management (Chamblee & Yeatman Reference Chamblee and Yeatman2003; Le Reference Le2017; de Toledo et al. Reference de Toledo, Roll, Rutz, Dallmann, Dai Prá, Leite and Roll2020), climate control (Lin et al. Reference Lin, Zhang, Du, Gu, Zhang, Buyse and Decuypere2005; Olanrewaju et al. Reference Olanrewaju, Purswell, Collier and Branton2010; Shahzad & Sultan Reference Shahzad and Sultan2021), and stocking density (Dawkins Reference Dawkins2018; van der Eijk et al. Reference van der Eijk, Gunnink, Melis, van Riel and de Jong2022), among others (for a review, see Wilcox et al. Reference Wilcox, Sandilands, Mayasari, Asmara and Anang2024). These findings have led to legislative changes in some regions, such as the UK Animal Welfare Act (2006) and the Welfare of Farmed Animals (England) Regulations (2007), or the European Union Council Directive 2007 (2007/43/EC). These aim to protect broiler chickens’ welfare by ensuring that farmers adhere to specific husbandry and management protocols. In other circumstances, research has led to certification schemes to encourage and motivate farmers to produce animal products grown under better welfare conditions, with varying success. A key motivator for improving animal welfare in the UK was consumer concern for animal welfare (Lewis et al. Reference Lewis, Tzilivakis, Green, Warner and Coles2008). However, in Taiwan, food safety and ‘healthiness’ was a higher priority and encouraged consumer demand for better welfare animal products (Yang & Hong Reference Yang and Hong2019; Chang & Chen Reference Chang and Chen2022). Another approach to improve animal welfare is through corporate engagement, where animal advocates campaign for food businesses to commit to buying products that are farmed to a higher welfare standard. Corporate engagement is becoming effective to increase the voluntary transition from battery cage to cage-free housing for layer chickens in some countries in Asia (Hartcher et al. Reference Hartcher, Nuggehalli, Yang, Catalina, De Luna, Agus, Ito, Idrus, Rahayu, Jattuchai, Descovich, Lane and Sinclair2023).
One of several initiatives to improve broiler chicken welfare via corporate engagement is The Better Chicken Commitment (BCC) [UK] (undated), also known as the European Chicken Commitment, which aims to improve chicken welfare by recommending standards for the management of broiler chicken farms. The BCC recommendations have been adapted to several countries and regions, including the UK, the US, Canada, Europe, Australia and New Zealand, and Brazil. The recommendations differ depending on the region, but mainly focus upon stocking density, lighting periods, litter depth and quality, and in some countries stipulate which are the best chicken breeds to use in given situations. By 2020, 180 food businesses in the US had committed to the BCC, but a lack of data has prevented a detailed assessment of its direct impact upon chicken welfare (Peacock & Mendez Reference Peacock and Mendez2020).
The effectiveness of accreditation schemes in improving animal welfare standards is debatable (More et al. Reference More, Marchewka, Hanlon, Balzani and Boyle2021; Uehleke et al. Reference Uehleke, Seifert and Hüttel2021). However, in the absence of sufficient national animal welfare legislation, accreditation schemes can encourage farmers to adopt better welfare practices, allow informed consumer choice, and can inform and highlight the issues of farm animal welfare in countries where it is seldom discussed. In a review of farm animal welfare governance, Hårstad (Reference Hårstad2024) describes the private sector, including accreditation schemes, as ‘key actors’ for faster drivers of change, and political influence or legislation as ‘slow drivers’ in the animal welfare political field (Hårstad Reference Hårstad2024).
Animal agriculture in Indonesia is a growing industry, and large, industrialised farming practices are common. However, there is no specific farm animal welfare legislation in Indonesia, and it is not a political priority (Statharas & Zeng Reference Statharas and Zeng2023). West Java has the highest proportion of broiler chicken farms in Indonesia (Ferlito & Respatiadi Reference Ferlito and Respatiadi2018), many of which are closed-house industrialised farm systems, contracted by vertical integrated businesses to grow chickens (Wilcox et al. Reference Wilcox, Sandilands, Mayasari, Asmara and Anang2024). Chicken meat is the most consumed terrestrial meat product in Indonesia, and its consumption is rising (Statistics Indonesia 2023). Despite this, there has been a paucity of research into the welfare status of broiler chicken farms in Indonesia, there are no broiler chicken certification schemes for higher welfare, and no recommendations for farmers to safeguard broiler chicken welfare.
Leg health is a key indicator of broiler chicken welfare, and foot-pad dermatitis (FPD) and hock burn (HB) have been described as ‘iceberg indicators’ for chicken welfare (Nielsen et al. Reference Nielsen, Alvarez, Bicout, Calistri, Canali, Drewe, Garin-Bastuji, Gonzales Rojas, Schmidt, Herskin, Miranda Chueca, Padalino, Pasquali, Roberts, Spoolder, Stahl, Velarde, Viltrop, Winckler, Tiemann, de Jong, Gebhardt-Henrich, Keeling, Riber, Ashe, Candiani, García Matas, Hempen, Mosbach-Schulz, Rojo Gimeno, Van der Stede, Vitali, Bailly-Caumette and Michel2023). Iceberg indicators are measures that can provide an indication of the welfare of an animal over time. Animal welfare fluctuates over an animal’s lifespan, and changes in affective states are normal (Reimert et al. Reference Reimert, Webb, van Marwijk and Bolhuis2023). However, welfare indicators can offer insights into long-term welfare outcomes. FPD and HB are issues that develop over time, and short-term environmental changes do not have a significant impact; these are more likely to develop over prolonged periods of poor conditions. Therefore, these can be used as indicators of welfare in broiler chickens and shed light upon farm conditions in recent weeks (Nielsen et al. Reference Nielsen, Alvarez, Bicout, Calistri, Canali, Drewe, Garin-Bastuji, Gonzales Rojas, Schmidt, Herskin, Miranda Chueca, Padalino, Pasquali, Roberts, Spoolder, Stahl, Velarde, Viltrop, Winckler, Tiemann, de Jong, Gebhardt-Henrich, Keeling, Riber, Ashe, Candiani, García Matas, Hempen, Mosbach-Schulz, Rojo Gimeno, Van der Stede, Vitali, Bailly-Caumette and Michel2023). Factors affecting FPD in the Netherlands include litter quality, season, thinning practices, stocking density, breed, and age (de Jong et al. Reference de Jong, van Harn, Gunnink, Hindle and Lourens2012). In Nigeria, researchers found that replacing litter on a weekly basis successfully reduced occurrence of FPD (Alabi et al. Reference Alabi, Olagunju, Aderemi, Lawal, Oguntunji, Ayoola, Oladejo, Adeleye, Adewumi, Alabi and Tarta2023), therefore litter management can be a primary factor regarding FPD. Important features of litter include the ability to both absorb and release moisture, be free from contaminants, and to not compact down (Diarra et al. Reference Diarra, Lameta, Amosa and Anand2021). The current study made use of FPD and HB as key indicators of animal welfare and investigates how these are affected by on-farm conditions in Indonesia.
To create recommendations for better welfare in Indonesia, preliminary research must investigate the current issues affecting chicken welfare. Such recommendations may also be applicable to other countries with similar climate and farming systems in Southeast Asia. These could be used to improve the lives of the almost 4 million tons of intensively raised chickens reared for Indonesian national meat consumption every year (Badan Pusat Statistik Indonesia 2024). This research aimed to evaluate the standard of broiler chicken welfare on commercial farms in West Java, using both animal- and resource-based measures, and investigate how management and husbandry affect welfare outcomes.
Materials and methods
Farms and management
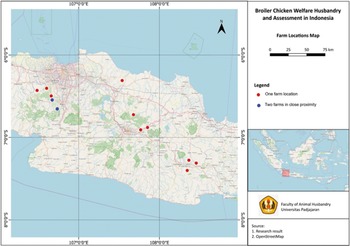
Data were collected from fourteen farms, selecting one chicken house, i.e. one flock of chickens at each farm, across West Java (Figure 1) between November 2023 and June 2024. The flocks were at company farms or farms contracted to grow chickens for large integrated businesses. Inclusion criteria constituted that the chicken house must have capacity for more than 20,000 chickens, must use a fast-growing strain of chicken, and be in the province of West Java.

Figure 1. Distribution of the 14 broiler chicken farms surveyed across West Java, Indonesia.
The number of chickens per farm averaged 380,539, ranging between 21,000 and 2,000,000. There were between one and five houses on each farm, with a mean of 3.6 houses per farm, and a mean of 39,700 chickens per house. Chicken age during data collection averaged 26.6 days, ranging between 20 and 32 days, with a mean weight of 1.54 kg (range 0.47 to 3 kg). Flocks of chickens were either Cobb (two flocks), Lohmann (five flocks), Ross 308 (three flocks) or a mix of strains (four flocks). A number of farmers were unsure as to the specific mix of chickens since they had originated from several breeders and been supplied by a contracting business. All the chickens were kept in mixed-sex groups.
Lights were kept on for 24 h a day (0 dark hours) in seven flocks; were turned off for 1 h at night in two flocks; were off for two non-consecutive hours at night in two flocks; and off for three non-consecutive hours in one flock (1–3 Dark category). The two remaining flocks had their lights off 3.5 h and 4 h during the night (3–4 dark). All farms used rice hulls as a litter substrate, except for one farm which fermented and re-used the rice hull litter over cycles (F11), and two farms which mixed woodchip into the rice hull litter (F12 and F13). The average drinking water temperature across all farms was 26.9°C, with a range from 25.2 to 29.4°C. Chickens were fed standard commercial feed in three stages; starter, grower and finisher feeds, and had ad libitum access to water via automated nipples with drip cups (apart from one farm which did not have drip cups). Two of the chicken houses had one (ground) floor, nine had two floors of chickens, and three had three floors. Ten of the houses were of a closed-house design, which had cooling pad systems and negative pressure fans at the far end of the house for air ventilation. Four of the farms were semi-closed, with negative pressure fans and a thick black mesh material (known locally as ‘paranet’) across the openings for the air inlet but were not equipped with cooling pads.
Flocks were visited when the chickens were aged 26 days or more or were within five days of going to slaughter. At two farms, the chickens were slaughtered at a younger age for export (frozen), so they were visited at 20 and 25 days old. This was an uncontrollable variable from the commercial farms visited but provides a real representation of the conditions on farms. Most of the farms measured 120 × 12 m (length × width), and stocking densities of 20–22 kg chicken per m2, or between 13–19 chickens per m2 were described. The mean altitude of the farms was 382 m above sea level (ASL), with a range between 50–840 m ASL.
Initial discussions were conducted with each farm manager to determine if the flock was suitable for inclusion in the research study, and whether they were willing to join the study. Methods of data collection and how the data would be used were also explained, and the researcher guaranteed they would provide individual welfare reports to each farm.
Data collection on-farm
Data collection on-farm was carried out by two researchers whose roles remained consistent throughout the entire data collection period; one measured the parameters and the other entered data onto a digital Excel® datasheet, which had been formatted to allow specific responses in each column. Each farm visit lasted two days.
On arrival at the farm, the manager was asked a series of questions regarding the animal husbandry and management on the farm. These included questions relating to the current flock, previous flock data, husbandry practices, standard operating procedures, and data regarding the farm location and building. Farm biosecurity was reported by the farmer and then observed by the researchers. Biosecurity was categorised after data collection, scored from the conditions encountered from ‘few’ measures, ‘medium’ to ‘more’ measures. Few biosecurity measures were the least measures in place, with only a foot dip on entering the chicken house. Medium biosecurity included a vehicle spray, change of boots, and body disinfectant, as well as foot dips on entering the chicken house. ‘More’ biosecurity measures included farms where the workers and researchers had to shower, wear clothes provided by the farm, and disinfect equipment using a UV disinfectant box before entering the farm, in addition to the ‘medium’ measures. Four of the farms were categorised as having few biosecurity measures, six had medium and four had more biosecurity measures.
Welfare Quality® data collection
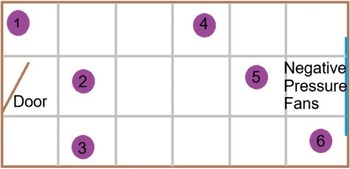
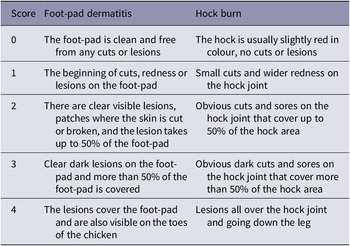
For each flock, data were collected according to Welfare Quality® (WQ) parameters (Welfare Quality® 2009). Where possible these data were collected from the ground floor but, for four flocks, data were collected on the first floor, because the ground floor chickens had already been cleared or thinned. In six pre-defined locations of the chicken house (Figure 2), 25 chickens were penned in a portable plastic corral, data recorded on each chicken individually, and they were released back into the flock, totalling a sample of 150 chickens per farm. Chickens were sampled for FPD and HB on both legs, using the five-point WQ scoring system (Welfare Quality® 2009), described in Table 1. Breast blisters and cleanliness were also recorded. Breast blisters were recorded in a binary scale of present or absent, and identified by any red marking, bruising, or blood on the skin of the breast. Cleanliness was scored on a binary scale of present or absent, where 0 = totally clean or up to one soiled patch on the body, and 1 = dirty; dirty was defined as yellowing feathers or dirt on the feathers around the body indicating a lack of ability to clean themselves.

Figure 2. Plan of sampling sites (1–6, purple circles) in a standard chicken house, where the door is at the left end, and negative pressure fans to the right. This encompasses walls, middle sections and corners for a representative sample of the chickens.
Table 1. Description of foot-pad dermatitis and hock burn score in broiler chickens, taken from Welfare Quality® (2009)

The chickens were then weighed to the nearest gram on an electric scale (Spritool New Model High Accuracy Multi-functional pets scale up to 30 kg, purchased in the UK), by placing the chicken in a standing position on the scale platform, then putting them back with the rest of the flock, outside of the portable pen to ensure no chickens were assessed twice. The chickens were handled carefully and gently, any chickens who appeared particularly stressed by being in the portable pen were released into the flock without assessing and handling.
At each of the six locations in the house, the percentage of birds panting and huddling was calculated by counting the number of birds panting and huddling in the immediate vicinity of the researcher out of the 100 closest birds. Panting is defined as the bird breathing rapidly in short gasps, often sitting upright with their mouth open with visible respiratory movements (Welfare Quality® 2009). Huddling was defined as groups of birds sitting close by each other in ‘clumps’ with empty spaces between the clumps. Panting and huddling were calculated by both researchers and the average for each location calculated.
At each location after each set of 25 chickens had been assessed, micro-climate data were recorded. Micro-climate data were taken by placing the equipment directly on top of the litter and waiting for the number to stabilise. Measurements were taken throughout the data collection day. The micro-climate parameters measured and equipment used were: as follows:
-
• Carbon dioxide (ppm) (Sndway SW 723 – AI886 CO2 Combustible Halogen Detector Meter, Sndway, China; measuring range 0–9999PPM [± 40 +3% accuracy]);
-
• Temperature (°C) (Sndway SW 723 – AI886 CO2 Combustible Halogen Detector Meter [± 1°C accuracy]);
-
• Humidity (%) (Sndway SW 723 – AI886 CO2 Combustible Halogen Detector Meter [± 5% accuracy]);
-
• Wind speed (m s–1) (Anemometer Data Logger Benetech GM8902 Wind Meter, China; measuring range 0.0–45.0 [± 3% ± 0.1 accuracy]);
-
• Light intensity (Lux) (Smartphone Light Meter Application, Light meter, Lux Meter 2.0, Coolexp, Vietnam);
-
• Ammonia (ppm) (NH3 Smart Sensor AR8500, China; measuring range 0–100 ppm [ ± 2%]);
-
• Litter score (0–4 scale, see below for full description);
-
• Litter depth (cm) (manual ruler);
-
• Number of negative pressure fans on (farms had between 6–11 fans per floor); and
-
• Estimated feather coverage (%) to nearest 25%.
The litter scoring method was used as set out in Welfare Quality® guidelines 2009):
-
0) Completely dry and flaky – moves easily with the foot;
-
1) Dry but not easy to move with foot;
-
2) Leaves imprint of foot and will form a ball if compacted, but ball does not stay together well;
-
3) Stick to boots and sticks readily in a ball if compacted;
-
4) Sticks to boots once the cap or compacted crust is broken.
Drinking water temperature was taken from the cup under the nipple using a digital liquid thermometer (SUTMSH Stainless Steel Water Thermometer, SUTMSH-08, China), and this was taken at only one point in the chicken house in front of the main doors.
The Temperature humidity Index (THI) was calculated for each of the 84 locations (14 houses × 6 locations) where the Welfare Quality® data were collected. THI limits for chickens have been categorised as < 72% THI representing absolute comfort, 73–76% equalling light discomfort, 77–80% moderate discomfort, 81–84% severe discomfort, and above 85% is considered life threatening conditions for chickens (Moraes et al. Reference Moraes, Júnior and Oliveira2008).
THI was calculated using the following calculation:
 $$ \mathrm{T}\mathrm{HI}=\mathrm{THI}=0.8\times \mathrm{T}+\mathrm{RH}\times \left(\mathrm{T}-14.4\right)+46.4 $$
Where:
-
• T = ambient or dry-bulb temperature in °C;
-
• RH = relative humidity expressed as a proportion, i.e. 75% humidity is expressed as 0.75.
Data handling and processing
During data collection, data were entered directly onto separate spreadsheets for each farm and then checked and cleaned after each farm visit and then combined into a master dataset, which was used for analysis. Mean FPD and HB scores for male and female chickens, and for each of the six farm locations for each flock were calculated.
Input factors, including litter score, litter depth, lighting photoperiod, light intensity, age of chickens, breed, humidity, and farm altitude were analysed against welfare indicators FPD and HB scores. No breast blisters were recorded throughout the entire data collection process.
Analytical approach and variable selection
To investigate the environmental and management predictors of the welfare outcomes FPD and HB severity in broiler chickens, Cumulative Link Mixed Models (CLMM) (Christensen Reference Christensen2023) were employed using the ordinal package in R studio (Posit team 2025). This modelling approach was chosen because the outcome variables were measured on an ordinal scale (scores ranging from 0 to 3, where levels 3 and 4 were grouped for analyses due to lack of samples with score 4), where the distance between levels is ordered but not necessarily equal. The CLMM framework accommodates this ordinal nature of the dependent variables and allows for random intercepts, thereby accounting for clustering by flock (n = 14) and by sampling location within flocks (n = 6 per farm).
A total of 14 predictors included: litter score (0–4); litter depth (cm); relative humidity (%); elevation (m above sea level); light category (0 = no dark hours; 1 = 1–3 dark hours; 2 = > 3–4 dark hours); light intensity (lux); wind speed (m s–1); ammonia (ppm); carbon dioxide (ppm). Animal-level predictors were bodyweight (kg) and breed (1 = Lohmann, 2 = Ross 308, 3 = Cobb, 4 = Mixed flock).
To account for dependence among birds sampled within the same context, we included random intercepts for farm and for location:
-
• FPD model: FPD ~ … + (1|Farm_Code) + (1|Location);
-
• HB model: HB ~ … + (1|Farm_Code) + (1|Location).
We report odds ratios (OR) and 95% Wald confidence intervals (CIs) for all fixed effects. For categorical predictors, ORs are relative to the stated reference level (Litter score = 0; Light category = 0 [no dark]; Breed = 1 [Lohmann]).
Data pre-processing and model assumptions
Continuous predictors were standardised (mean = 0, SD = 1) prior to modelling to improve numerical stability and to place coefficients on a comparable scale; for interpretability we present raw (unscaled) descriptive statistics (mean [± SD]) in Tables 5 and 6. We screened multicollinearity via pairwise correlations and VIFs; temperature was excluded from the final FPD/HB models due to collinearity with humidity. Model fitting used the Laplace approximation. Random-effects variances describe clustering at farm and location.
In a separate analysis, Spearman correlations were carried out using IBM SPSS® Statistics Software to assess the correlations between litter score, ammonia ppm and CO2 ppm.
Ethical considerations
Ethical approval was obtained from Universitas Padjadjaran, reference number: 25/UN6.KEP/EC/2024. The researchers were not able to intervene regarding farm management, but animal welfare concerns were communicated to farm workers wherever possible.
Results
Animal-based measures
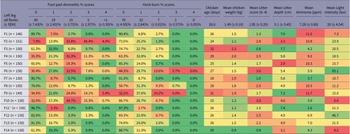
A total of 2,104 chickens were sampled across 14 flocks (min 146, max 158 chickens), all of which were included in the analysis. The distribution of FPD and HB on left and right legs was almost the same, so only left leg data were used in this analysis (FPD left leg mean [± SD] = 0.71 [± 1.006], FPD right leg mean = 0.71 [± 0.995], HB left leg = 0.36 [± 0.640], HB right leg = 0.35 [± 0.656]). The mean and percentage distribution of FPD and HB left leg scores across all farms are shown in Table 2. Scores were benchmarked across flocks to assess the differences and to illustrate variation between flocks. In subsequent analyses, FPD and HB scores of 4 were combined with scores 3, because very low numbers of chickens had FPD and HB scores of 4.
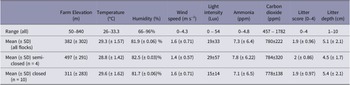
Table 2. The percentage of birds with each foot-pad dermatitis and hock-burn score (0–4), and means of litter score, litter depth, ammonia and light intensity, means taken from six points in each flock. Conditional formatting shows ‘better’ welfare outcomes in green shading, and ‘worse’ outcomes in red shading. Standard error of mean (SEM) is given for foot-pad and hock-burn scores, standard deviation (SD) is given for all means, in brackets. Data were collected from fourteen broiler chicken farms in West Java, Indonesia

* Farm fermented and re-used litter for subsequent growing periods.
Micro-climate data
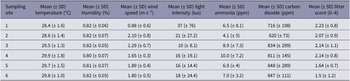
A summary of the micro-climate data is shown in Tables 3 and 4. Elevation was wide ranging and higher for semi-closed houses. Humidity was also higher in semi-closed houses, as was light intensity, however wind speed was lower. Other measures did not differ greatly between closed and semi-closed systems. Litter score was higher (worse) towards the door end of the chicken house (location 1–3) compared to in the direction of the negative pressure fans (locations 4–6).
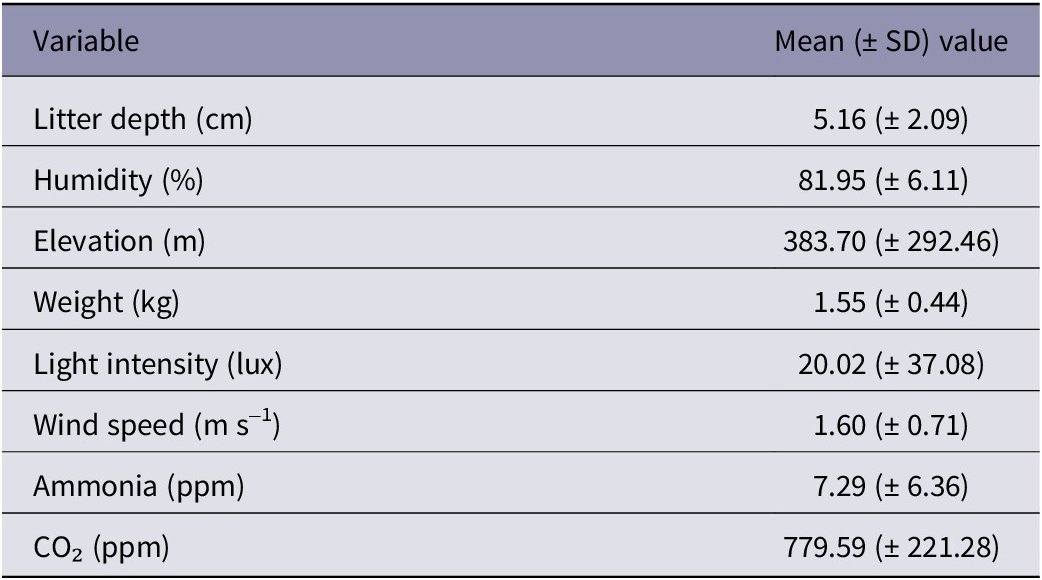
Table 3. Mean (± SD) micro-climate variables across 14 broiler chicken flocks in farms across West Java, Indonesia

Table 4. Mean (± SD) micro-climate results per location from 1–6 sampling sites in 14 broiler chicken flocks across West Java, Indonesia. Location 1 is closest to the door of the chicken house and location 6 is at the opposite end near the fans

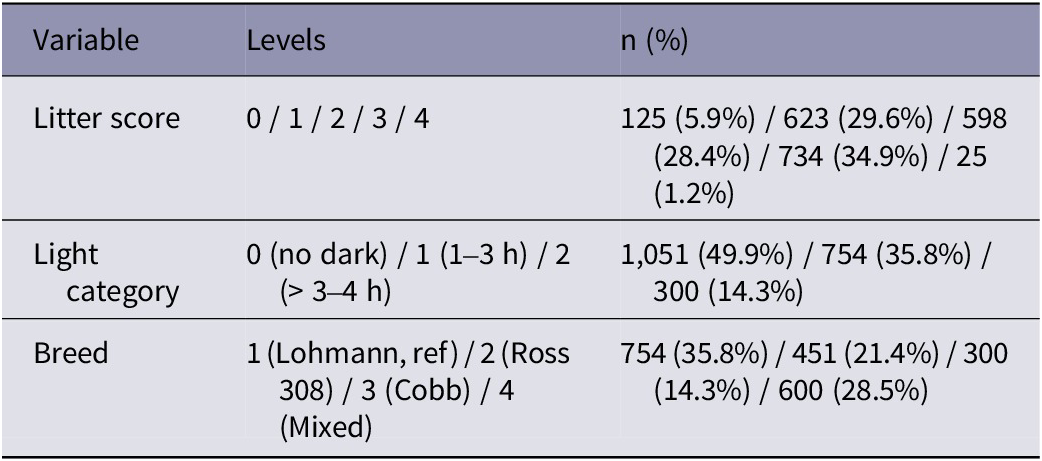
Tables 5 and Table 6 summarise continuous and categorical predictors. These statistics are derived from the same dataset used for modelling (n = 2,104).
Table 5. Descriptive data from continuous predictors of broiler chicken welfare from 14 farms in West Java, Indonesia (n = 2,104)

Table 6. Descriptive data from categorical predictors of broiler chicken welfare from 14 farms in West Java, Indonesia

Statistical analysis
Model 1: Footpad dermatitis score
The FPD CLMM used 2,104 observations, with log-likelihood = −1,816.12 and AIC = 3,676.23. Random effects indicated substantial between-farm variability (Farm SD = 1.086; Location SD = 0.524).
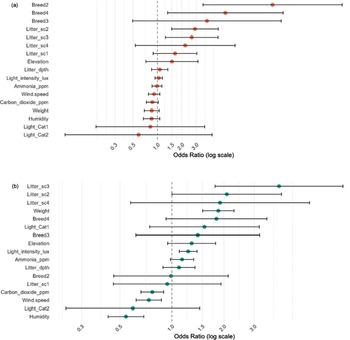
Significant predictors of higher FPD severity were Litter score 2, Litter score 3, and Breed 2 (Ross 308) and Breed 4 (Mixed) (relative to their respective references) (Figure 3). Elevation, weight, and CO₂ showed suggestive trends (P < 0.10) but were not conclusive (Table 7).

Figure 3. Estimated odds ratios (OR) with 95% confidence intervals for the effects of environmental and individual-level covariates on the severity of (a) foot-pad dermatitis and (b) hock burn in broiler chickens from fourteen farms in West Java, Indonesia. The vertical dashed line indicates an OR of 1 (no effect). Variables to the right of this line are associated with increased odds of higher severity, while those to the left indicate a decrease in odds. Definition of terms: Breed2: Ross 308; Breed3: Cobb; Breed4: Mixed flock; Litter_sc1: litter score 1; Litter_sc2: litter score 2; Litter_sc3: litter score 3; Litter_sc4: litter score 4; Litter_dpth: litter depth (cm); light_intensity_lux: light intensity (lux); Light_Cat1: 1-3 dark hours; Light_Cat2: > 3–4 dark hours.
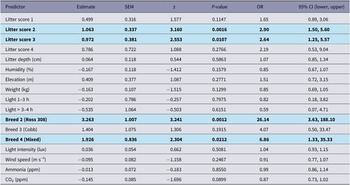
Table 7. Outputs of CLMM analyses for footpad dermatitis from 14 broiler chicken flocks, in West Java, Indonesia. Results in bold are significantly different (P < 0.05)

Random effects (FPD): Farm variance = 1.179 (SD = 1.086);
Location variance = 0.274 (SD = 0.524).
Model 2: Hock burn score
The HB CLMM also used 2,104 observations, with log-likelihood = −1,345.59 and AIC = 2,735.19. In this model location-level variability was comparable to farm-level variability, and somewhat more influential (Farm SD = 0.300; Location SD = 0.513).
Significant predictors of higher HB severity were Litter score 2–3, greater bodyweight, higher light intensity, and lower humidity, lower wind speed, and lower CO₂ (note: OR < 1 indicates a decrease in odds per unit increase) (Figure 3, Table 8).
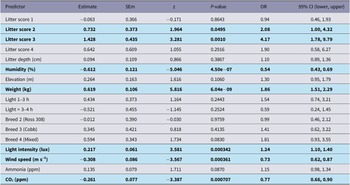
Table 8. Outputs of CLMM analyses for hock burn from 14 flocks of broiler chickens in West Java, Indonesia. Results in bold are significantly different (P < 0.05)

Random effects (HB): Farm variance = 0.090 (SD = 0.300);
Location variance = 0.263 (SD = 0.513).
Influence of random effects
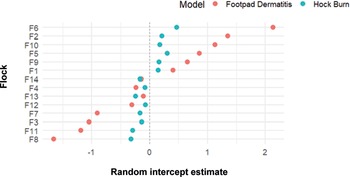
The CLMM included random intercepts for flock and location to account for clustering. For FPD, the random effect variance was higher at the flock level (1.18 [± 1.09]) than the location level (0.27 [± 0.524]), indicating substantial between-flock variability (Figure 4). In contrast, for HB most of the random effect variance was attributed to location (0.26 [± 0.513]), with minimal variation between flocks (0.09 [± 0.300]). This suggests that FPD is more influenced by flock-wide factors, and both FPD and HB were similarly affected by location within-flock.

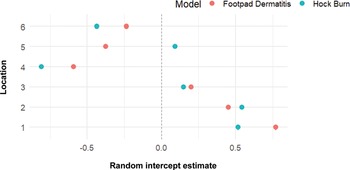
Figure 4. Descriptive caterpillar plot of estimated random intercepts for each flock from cumulative link mixed models (CLMMs) of foot-pad dermatitis and hock burn severity, in order of farm that scores the highest (worse) at the top to lowest (best) at the bottom. Points represent the deviation of each farm’s intercept from the overall sample mean, with estimates shown separately for each model. The dashed vertical line at 0 indicates no deviation from the overall intercept. Positive or negative values suggest flock-specific variation in severity beyond fixed effects. Data were collected from fourteen broiler chicken farms in West Java, Indonesia.
The FPD and HB scores were consistently worse in locations 1 and 2 near the air inlets and better in the middle and towards the negative pressure fans end of the chicken houses, at locations 4 and 6 (Figures 5 and 6). As per descriptive statistics in Table 4, these results correspond to generally worse litter quality scores in location 1, compared to better litter quality scores at location 6.

Figure 5. Caterpillar plot of estimated random intercepts for each location (1–6) inside the chicken house from cumulative link mixed models (CLMMs) of foot-pad dermatitis and hock burn severity. Points represent the deviation of each location’s intercept from the overall mean, with estimates shown separately for each model. The dashed vertical line at 0 indicates no deviation from the overall intercept. Positive or negative values suggest location-specific variation in severity beyond fixed effects, with higher negative values having a lower (better) score, and higher positive values having a higher (worse) score. Data were collected from six set locations on fourteen broiler chicken farms in West Java, Indonesia.

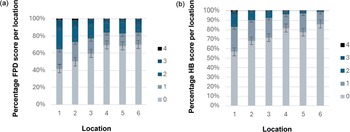
Figure 6. Showing (a) chicken foot-pad dermatitis scores and (b) hock burn scores at six locations (1–6) in 14 chicken houses across fourteen farms in West Java, Indonesia (n = 84 locations) with standard error bars shown.
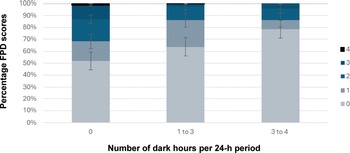
Ammonia ppm did not correlate with litter score (rs[84] = 0.088; P = 0.425), however CO2 ppm did show a weak positive correlation with litter score (rs[84] = 0.251; P < 0.05). Ammonia and CO2 also significantly positively correlated with each other (rs[84] = 0.583; P < 0.01). Although photoperiod (light category) was not a statistically significant predictor in the CLMM, there was a trend for farms with longer dark periods to have better FPD and HB outcomes (Figure 7), with farms with no dark period having the highest FPD and HB scores.

Figure 7. Mean % foot-pad dermatitis scores for flocks that were managed under different photoperiods, 0 dark hours (5 flocks), 1–3 dark hours (7 flocks), and > 3–4 h (2 flocks), bars showing standard error. These data were collected from fourteen broiler chicken farms in West Java, Indonesia.
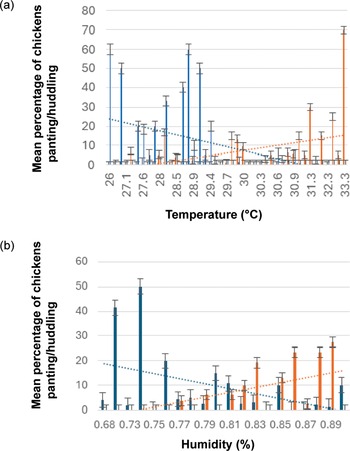
None of the locations in any flock were categorised as absolute comfort THI; 1.1% of locations were light discomfort, 29% moderate discomfort, 62% severe discomfort, and 8.3% of the locations were life threatening THI. The lowest THI calculated was 76.8%, and the highest 86.2%. ‘Life threatening’ conditions occurred on three farms. Panting and huddling behaviour corresponded with the temperature and humidity, with lowest for both panting and huddling behaviours occurring at around 30°C and 81% humidity. There was a weak to moderate positive correlation between temperature and percent of chickens panting (rs[84] = 0.379; P < 0.01), and a moderate negative correlation between temperature and percent of chickens huddling (rs[84] = –0.486; P < 0.01). There was also a weak to moderate negative correlation between humidity and panting behaviour (rs[84] = –0.313; P < 0.05), and a moderate positive correlation between humidity and huddling behaviour (rs[84] = 0.454; P < 0.01) (Figure 8).

Figure 8. Effect of (a) temperature and (b) humidity on panting and huddling behaviour, where the blue lines represent estimated percent of chickens huddling and the orange lines represent estimated percentage of chickens panting. Data were collected from six locations on each of fourteen farms in West Java, Indonesia (n = 84).
On all the farms visited there were insect larva (Alphitobius diaperinus), commonly known as the litter beetle or lesser mealworm (known locally as ‘franky’), abundant and easily visible living in the litter. There was only one farm where these were not detected, which was on the farm that fermented and re-used litter.
Discussion
In the flocks studied here, litter quality and breed of chicken were predictors of FPD, whereas litter quality, bodyweight, light intensity, humidity, wind and CO2 predicted HB. There was wide variation in FPD scores, but less variation in HB scores between flocks. The variation at the six locations was similar for FPD and HB, and the results at each location were consistent, with the door end of the chicken houses showing poorer welfare outcomes and greater variation in micro-climate compared to areas near the fans. An important finding was that litter score was consistently worse at locations near the door of the chicken house compared to locations towards the fans, and welfare outcomes showed the same pattern.
FPD and HB are commonly used as indicators of broiler chicken welfare, either on-farm or at slaughter (Kjaer et al. Reference Kjaer, Su, Nielsen and Sørensen2006; Haslam et al. Reference Haslam, Knowles, Brown, Wilkins, Kestin, Warriss and Nicol2007; Alabi et al. Reference Alabi, Olagunju, Aderemi, Lawal, Oguntunji, Ayoola, Oladejo, Adeleye, Adewumi, Alabi and Tarta2023). These results show that severe FPD lesions were more common than severe HB lesions in flocks in West Java, and that there was greater variation of FPD between flocks, making it more difficult to identify predictors of FPD from this dataset statistically. However, FPD outcomes in this study were better than those reported elsewhere: of 38,600 chickens sampled at a slaughterhouse in the Netherlands at around 2.5 kg or 42 days old, 35.5% showed no lesions, compared to 60% no lesions in the current study (FPD score 0), 26.1% showed mid lesions, compared to 34% here (FPD scores 1 and 2 combined), and 38.4% had severe lesions, compared to 6% here (FPD scores 3 and 4 combined) (de Jong et al. Reference de Jong, van Harn, Gunnink, Hindle and Lourens2012). The differences between the two studies can be equated to an older age and weight of chickens in the Netherlands study, where older chickens have spent more time on increasingly poor-quality litter (de Jong et al. Reference de Jong, van Harn, Gunnink, Hindle and Lourens2012). De Jong et al. (Reference de Jong, van Harn, Gunnink, Hindle and Lourens2012) also found that chickens from farms where thinning had taken place had better FPD scores, because the chickens were taken to slaughter at a younger age which may be more comparable to the chickens in the current study. One benefit for chicken welfare in Indonesia is the young slaughter age, averaging around 32 days or 1.8–2.0 kg; this means welfare parameters do not reach the same extremes as in other countries where the market demands a bigger carcase. Researchers in Algeria reported that chickens had an average of 22% FPD score 0 (Boussaada et al. Reference Boussaada, Liani and Guergueb2024), however they found great variation in FPD scores between different regions, with some having as high as 50% of chickens FPD score 0, and some as low as 5% at a mean age of 48 days old. The authors attributed worse FPD scores to inadequate control of humidity resulting in damp litter, which may also be the case with the current data, particularly in locations close to air inlets which may increase humidity. Other research has shown wet litter to be the most important factor contributing to FPD (Shepherd & Fairchild Reference Shepherd and Fairchild2010; de Jong et al. Reference de Jong, van Harn, Gunnink, Hindle and Lourens2012), and the current research also found that high litter scores (i.e. wetter litter) was an important contributing factor to worse FPD and HB outcomes.
In the current study, breed was a significant predictor for welfare outcomes; Ross 308 flocks had worse welfare outcomes followed by mixed breed, then Cobb flocks, whereas Lohmann flocks showed the best welfare outcomes. De Jong et al. (Reference de Jong, van Harn, Gunnink, Hindle and Lourens2012) found that Ross 308 male chickens showed worse FPD scores at slaughter compared to Cobb, however mixed sex Ross 308 flocks had better FPD scores compared to Cobb; in the current study all flocks were mixed sex. These conflicting results may indicate that different breeds have varying welfare outcomes in different climates, however more data would be needed to further investigate that.
Heat stress has been shown to increase the incidence and severity of FPD, lower weight gain and reduce growth performance (Kuter et al. Reference Kuter, Cengiz, Köksal, Sevim, Tatlı, Ahsan, Güven, Önol and Bilgili2023). THI calculations in the current research showed that chickens in West Java may often be in discomfort. Keeping chickens under high THI conditions is likely to cause heat stress, and this is a serious concern for animal welfare (Saracila et al. Reference Saracila, Panaite, Papuc and Criste2021). Similar conditions were found in Cuba, where the average THI of layer hens was calculated to be 85.5%, in the life-threatening THI zone (Ajakaiye et al. Reference Ajakaiye Joachim, Ajakaiye, Perez-Bello, Mollineda-Trujillo, Abreu, Las Villas, Clara, Clara, Ajakaiye, Perez-bello and Mollineda-trujillo2011). High THI in chicken farming is likely to become more of a problem with climate change; Lallo et al. (Reference Lallo, Cohen, Rankine, Taylor, Cambell and Stephenson2018) suggested that exploring more climate-resilient strains would be one way to mitigate the effects of climate change. THI does not account for velocity or wind speed caused by the negative pressure fans in the chicken houses, however Tao and Xin (Reference Tao and Xin2003) formulated a Temperature Humidity Velocity Index (THVI) for male broiler chickens to include this factor and also include the length of time that the chickens were exposed to particular conditions (Tao & Xin Reference Tao and Xin2003; Shahzad & Sultan Reference Shahzad and Sultan2021). THVI can be useful for modelling outcomes; depending on the duration birds are kept under certain conditions, however, THVI calculations require wet bulb temperature, which was not recorded in this study.
Litter depth was not a significant predictor of FPD or HB in the CLMM models, perhaps due to the small range in recorded litter depths (i.e. between 2.3–7.7 cm). Ekstrand et al. (Reference Ekstrand, Algers and Svedberg1997) found that a litter depth of more than 5 cm promoted positive welfare outcomes, however, there has been little follow-up research regarding this, presumably as a result of the various other factors which can influence the benefits of litter (e.g. material qualities). Fifty percent of farms in this study had litter averaging more than 5 cm, and 50% were shallower. Farmers often commented that the rice harvest prior to the period of data collection had been poor, and therefore rice hulls were expensive and difficult to obtain. Although data collection occurred over an eight-month period, the comment remained consistent. This is a result of unpredictable weather making the rice harvest unreliable and less productive, which has been attributed to climate change (Salman et al. Reference Salman, Yassi and Bahsar-Demmallino2017). One of the farms fermented and re-used the litter in the next cycle. Where others found that fermenting rice hulls increased FPD (Xavier et al. Reference Xavier, Broom, McManus, Torres and Bernal2010), in the current results, the one farm that fermented rice hulls had the best outcome of FPD, and 5th lowest (i.e. best) litter score, compared to the other farms, however it is not possible to determine if that was a causal factor. Research on the effects of fermented litter appears to be uncommon (de Toledo et al. Reference de Toledo, Roll, Rutz, Dallmann, Dai Prá, Leite and Roll2020); researchers in Vietnam looked at the effects of adding a microbial product to the litter whilst the chickens were growing, and they found benefits included drier and better quality litter, and they also reported that chickens showed a better feed conversion ratio (Le Reference Le2017). Although only one flock studied here used fermented litter, further investigation into the benefits of litter fermentation may reduce the problem of sourcing rice hulls and could potentially improve litter and FPD scores.
The insect larva, A. diaperinus, was prevalent throughout farms in Indonesia, with the exception of the farm which fermented litter where they were absent. This is the most common insect species found in chicken litter worldwide and they have been linked to many common poultry diseases which can reduce chicken productivity (Retamales et al. Reference Retamales, Vivallo and Robeson2011). They are resistant to many insecticides, and their optimum temperature for growth is around 30°C (Sammarco et al. Reference Sammarco, Hinkle and Crossley2023), which makes Indonesian farms a very suitable habitat. When ingested by the chickens, A. diaperinus can spread disease, including Salmonella typhimurium, Escherichia coli and Marek’s disease, among others, (Retamales et al. Reference Retamales, Vivallo and Robeson2011; Sammarco et al. Reference Sammarco, Hinkle and Crossley2023), which are prominent diseases in Indonesia broiler production. As well as promoting disease, digestion of larvae can cause watery faeces, and result in a reduced feed consumption (Sammarco et al. Reference Sammarco, Hinkle and Crossley2023). Steps should be taken to reduce or eliminate the prevalence of insect larvae in the chicken house for disease reduction, to reduce losses, and to increase productivity, as well as animal health and welfare. Further investigation regarding the effect of fermenting litter on eradicating A. diaperinus from Indonesian broiler farms is needed.
Surprisingly, there was little difference in the descriptive data on micro-climate between closed and semi-closed chicken houses. Flocks housed in semi-closed systems were slightly cooler on average than closed-house systems, which may be explained by their generally higher elevation, around 200 m ASL higher, on average, than closed-house systems. This is in accordance with other research in Indonesia which also did not find significant differences in micro-climate in closed versus semi-closed systems, except for wind speed (Muharlien et al. Reference Muharlien, Yulianti and Hamiyanti2020). However, there are other benefits of using a closed-house system, for example, improved biosecurity. Hamiyanti et al. (Reference Hamiyanti, Nurgiartiningsih, Muharlien and Suyadi2023) did not find significant differences in performance of chickens raised under three different housing systems in Indonesia, including closed, semi-closed and open systems. Those authors found that although not significantly different, in closed systems the chickens did have slightly better feed conversion ratio and Performance Index, but ammonia levels were higher, and chickens kept in an open house were shown to have the best performance based on bodyweight (Hamiyanti et al. Reference Hamiyanti, Nurgiartiningsih, Muharlien and Suyadi2023). Given the considerable financial investment in closed-house systems, further investigation into their benefits in Indonesia would be warranted.
Micro-climate, including CO2 and ammonia, can fluctuate over time, and in this research these measures were taken at six times/points for each flock in the same order, starting at location 1 and ending at location 6, which may have influenced the results. Using constant monitors in several locations of the chicken house would provide a more accurate measure of how these measures change throughout the day and throughout the growing period.
Increased ammonia levels did not correspond to worse litter quality scores, however, in Indonesia the relative humidity (RH) outside can be very high, with an average RH in West Java of 77–87% (World Data 2025). In these circumstances, poor litter quality may be caused not only by a build-up of chicken faeces, but also by the humid incoming air, contributing to reduced litter quality close to the air inlets (i.e. at the door end of the house). High RH has also been linked to increased respiratory disease (Wang et al. Reference Wang, Shen, Dai and Li2023); data on respiratory disease were not collected during this study, however several flocks were observed persistently coughing. Finding solutions to reduce the humidity on broiler farms in Indonesia may help to improve litter quality and reduce respiratory disease. Reduced litter quality has been associated with high ammonia levels (Mou et al. Reference Mou, Czarick and Fairchild2025), however this observation was with deeper litter at 15–20 cm deep. The authors concluded that continuous air movement in the chicken house from circulatory fans helped ensure litter remained drier and allowed chickens to distribute themselves more evenly across the floor, further reducing wet patches (Mou et al. Reference Mou, Czarick and Fairchild2025). They found additional circulation fans also improved FPD scores compared to control groups, due to reduced litter moisture. Improving air circulation with additional fans could help to improve litter quality and FPD scores on Indonesian farms, particularly in location 1, which was consistently poor in both respects in this study.
Fifty percent of the flocks in this study were managed under 24-h lighting regimes whereby chickens are never afforded a dark period. The results showed a trend for chickens grown with dark periods of up to 4 h to show improved welfare outcomes. This corresponds with previous research, which revealed a lack of dark period to be detrimental both to chicken health and welfare, as well as production outcomes (Jiang et al. Reference Jiang, Fu and Cheng2023). Similarly, in Algeria, increasing the number of dark hours from zero to 2 h was also associated with better FPD scores (Boussaada et al. Reference Boussaada, Liani and Guergueb2024). A study looking at the effect of different light programmes on broiler chicken health and welfare parameters in Korea found that, overall, the optimum photoperiod was 18 light: 6 dark hours (Kim et al. Reference Kim, Son, Jeon, Kim, Yun, Kang, E-C and Kim2022). Providing 6 dark hours resulted in the lowest litter moisture content and the second best FPD scores, compared to treatments of 24 h continuous light, 18 h continuous light, 8 h continuous light, and intermittent light. This is in line with the results of Schwean-Lardner et al. (Reference Schwean-Lardner, Fancher, Gomis, Van Kessel, Dalal and Classen2013) who found bodyweight to be greatest under 17 to 20 h of light, compared to 14 and 23 h of light. In the same study they also found that FPD scores improved with increased dark period, as was found in this study. The welfare benefits of having a dark period include regulating circadian rhythms, melatonin production, and health indicators (Schwean-Lardner et al. Reference Schwean-Lardner, Fancher, Laarveld and Classen2014; Magee et al. Reference Magee, Olanrewaju and Purswell2023), and farmers could also save money on energy costs.
Study limitations
One limitation of this research is the small sample size and wide variation in farming practices across the farms visited, which reduces the power of the results. Another was that the micro-climate data were collected in the same order on all the farms, starting with location 1 in the morning and finishing with location 6 in the afternoon; the time of day may have influenced the micro-climate data, however all farms are comparable because data were collected at similar times of day on each farm. Lack of replicates is a further limitation; it is not possible to say if the flock assessed is representative of all flocks grown in those chicken houses and on those farms.
Animal welfare implications and Conclusion
The welfare of broiler chickens on commercial farms in West Java is influenced by farming management and husbandry. In this study, FPD and HB were used as indicators of chicken welfare. Litter quality and breed were the most significant predictors of chicken welfare, and both litter quality and welfare were worse towards the door end of the chicken house, and better towards the end with the blower. Chicken farms in Indonesia often deploy 24-h lighting systems with no dark period, which is detrimental to animal welfare. Our results, presented in the context of the relevant literature, showed improved chicken welfare was associated with farms providing dark periods, and a 6-h dark period is suitable for broiler chickens.
There are specific challenges related to broiler chicken farming in tropical countries, particularly in terms of climate, however the results here are comparable to findings from around the world. Taking birds for slaughter at a younger age is a benefit for individual broiler welfare, however high humidity, difficulty sourcing litter, and lack of legal husbandry standards are challenges. These issues could potentially be improved in a cost-effective way: investigating solutions such as the effects of fermentation and re-use of litter, and installation of small circulatory fans to reduce humidity and litter dampness in certain sections of the chicken house could improve the litter quality and could therefore improve welfare outcomes. The results of this study could be used to inform recommendations to improve broiler chicken welfare specifically in Indonesia and be extended for use in other tropical countries.
Acknowledgements
Special thanks to my supervisors at Universitas Padjadjaran and Scotland’s Rural College for their support, expertise and input. Thanks to Namrata Biligeri Anirudh for assistance with statistical analysis. Thanks also to the farmers, managers and stockmen who offered assistance on farms, allowed farm visits and took the time to provide discussion and interaction. Thank you to Open Philanthropy for supporting this research project, and to BPDP scholarship from Universitas Padjadjaran. Thank you to the three reviewers for providing a constructive critique of this article, and the editors at the UFAW Animal Welfare journal.
Competing interests
None.

 Open access