

INTRODUCTION
Despite the year-round circulation of the influenza virus in tropical regions [Reference Russell1–Reference Cannell3], in temperate zones, annual influenza epidemics consistently emerge in the winter months. In the tropics, even though seasonal changes in temperature and day length are less pronounced and influenza epidemics are smaller, influenza incidence still tends to peak during the rainy season [Reference Cannell2, Reference Alonso4]. The coincident timing of influenza epidemics with climatic changes suggests that environmental factors may play a role in effecting changes in the virus, the host or the interplay between host and virus.
Several features of the winter experience in temperate regions, such as colder outdoor temperatures, drier indoor conditions, reduced exposure to solar radiation and indoor crowding have been proposed as determinants of epidemic timing [Reference Cannell2, Reference Polozov5–Reference Lowen7]. Recent animal studies have linked low temperatures and low relative humidity to increased rates of aerosol but not contact transmission of the influenza virus [Reference Polozov5, Reference Lowen6, Reference Lowen8]. Using data from France, from 1971 to 2002, Viboud et al. also found a higher incidence of influenza during the cold phases of the El Niño/Southern Oscillation, relative to the warm phases [Reference Viboud7]. These studies contribute to the growing body of evidence that point to the role of low temperatures and humidity in facilitating the airborne transmission of the influenza virus. To better understand the importance of relative humidity and temperature in determining the timing of influenza epidemics, Lowen et al. called for further studies based on surveillance and meteorological data at a fine spatial resolution [Reference Lowen6].
In addition to temperature and relative humidity, solar radiation may also play a role, as varying exposure to sunlight is known to affect innate immunity and may also inactivate the airborne virus [Reference Cannell2, Reference Sagripanti and Lytle9, Reference Jensen10]. During autumn and winter, reduced exposure to sunlight affects immune function by altering the endogenous production of specific immunomodulators [Reference Cannell2, Reference Srinivasan11–Reference Carrillo-Vico15]. For example, dermal production of vitamin D3, an important immune system regulator [Reference Cantorna16] requires direct skin exposure to ultraviolet B radiation. Thus, during the winter, levels of circulating vitamin D3 diminish, rendering the inhabitants of temperate regions more susceptible to infection [Reference Cannell2, Reference Hope-Simpson15]. However, another immune system regulator and antioxidant, melatonin, increases with decreased daylight exposure and thus may offer some protection against influenza in northern areas with fewer daylight hours [Reference Srinivasan11–Reference Carrillo-Vico13]. Findings from a recent study by Finkelman et al. provide some support for a negative association between solar radiation and epidemic timing, at least at the global scale [Reference Finkelman17]. Analysing patterns of influenza epidemic timing among 19 temperate countries, from 1997 to 2005, they found that influenza A epidemics were significantly earlier in low-latitude countries than in high-latitude countries.
Other studies of influenza epidemic timing in the tropics and subtropics have revealed a relationship between climate and influenza spread [Reference Alonso4, Reference Chew18]. Chew et al. investigated the effects of climate on the broader class of viral respiratory infections and found a significant positive association between influenza B incidence and precipitation [Reference Chew18]. In a study describing the geographical variation in epidemic timing in Brazil, Alonso et al. believed that the observed spatio-temporal patterns of spread were better explained by climate (i.e. humidity, temperature and precipitation) than by population demographics and travel [Reference Alonso4].
In this paper we examine the effect of latitude, longitude, temperature, dew point and solar radiation on the city-specific timing of peak influenza activity throughout the USA, in order to better understand the environmental and geographic factors that promote influenza spread in temperate regions.
METHODS
Timing of influenza epidemics
We acquired hospitalization records for all respiratory illness for each of 37 paediatric hospitals participating in the Pediatric Health Information System (PHIS), for the study period 2000–2005 (Fig. 1). Situated in large metropolitan areas, PHIS member hospitals are amongst the largest and most advanced paediatric hospitals in the USA. Since only a subset of respiratory illness visits are a result of influenza infection, we included only those visits with principal diagnosis (ICD-9) codes most closely related to influenza. More specifically, we defined an influenza case as an in-patient visit with an ICD-9 code equal to one of 486·00, 487·00, 487·1 or 487·8, a subset of codes that are known to be specific markers of influenza infection [Reference Marsden-Haug19]. Restriction to a few influenza-associated ICD-9 codes provides greater specificity in identifying in-patient visits due to influenza and not other co-circulating viruses, such as respiratory syncytial virus (RSV). RSV incidence has been significantly associated with climate [Reference Chew18, Reference Yusuf20] and misclassifying RSV cases as influenza cases could impact the results of the analysis.
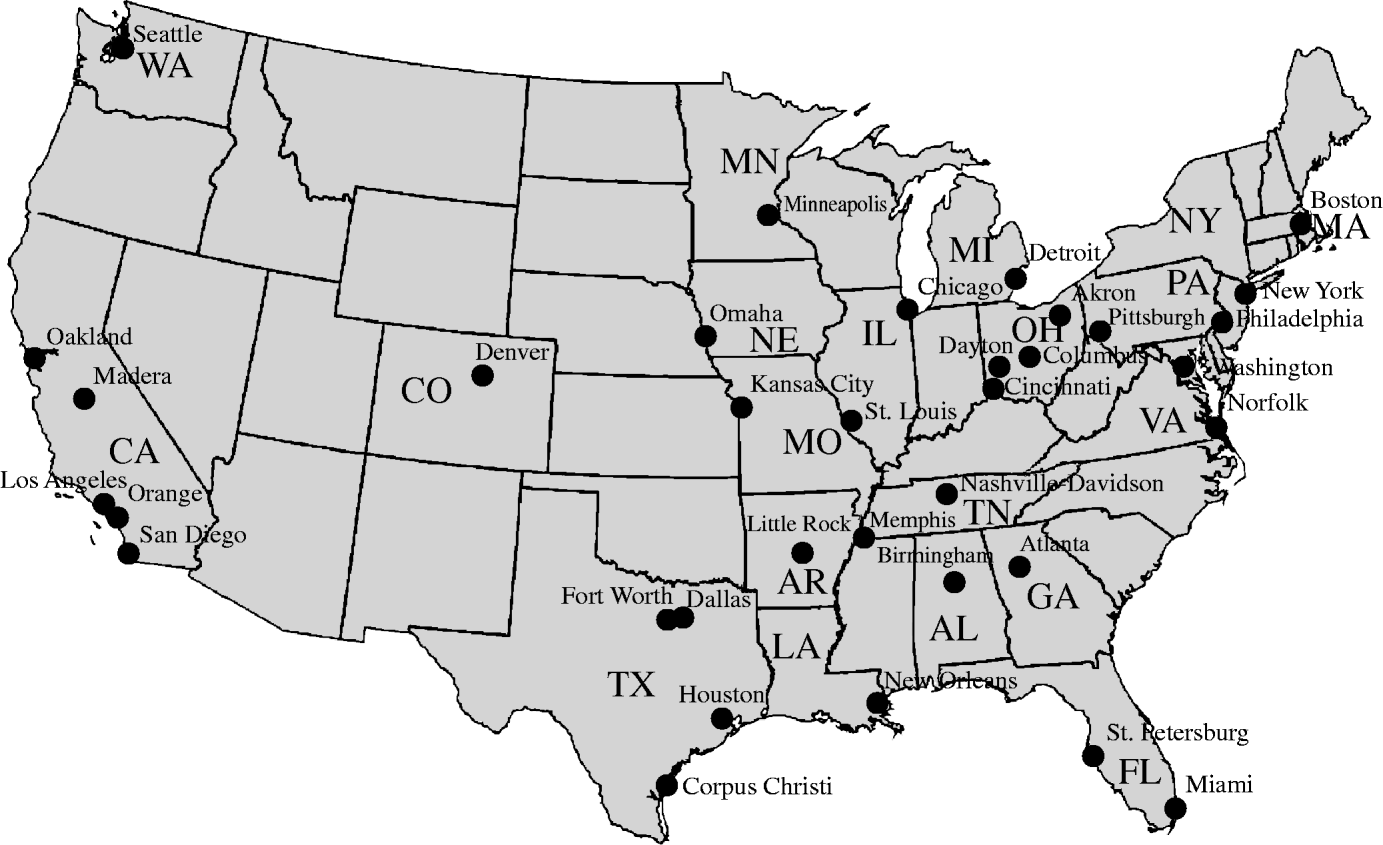
Map of USA showing cities and states of Pediatric Health Information System hospitals.
The study period comprised five influenza seasons where each influenza season was defined as the 40th week of the calendar year to the 39th week of the following year. For each city and each influenza season in the study period, we found the weekly totals of influenza cases and defined the timing of the epidemic as the week with the maximum number of influenza cases (i.e. the ‘city-specific peak week’). We also considered, as candidates for ‘city-specific peak week’, those weeks in which the number of visits were within 5% of the maximum number of visits. For about 70% of the 35 cities×5 seasons =175 epidemics, we were able to identify a single week that qualified as the ‘peak week’.
To guide the choice of city-specific peak week in the case of multiple candidate weeks we used the regional WHO-NREVSS viral isolate data which are available at the CDC website [21]. Each year, WHO and NREVSS laboratories test a large number of specimens for the influenza virus. Weekly counts of positive specimens (viral isolates) are computed for each of nine regions that together comprise the 50 states of USA and the District of Columbia. Using these data, we determined the regional viral isolate peak week for each influenza season. In addition to the regional viral isolate peak weeks, we considered the city-specific RSV peak weeks, estimated from the series of weekly PHIS hospitalizations corresponding to the RSV-specific ICD-9 code 466·11. In selecting the city-specific influenza peak week our goal was to choose the candidate week that was preceded and followed by weeks of substantial influenza activity and the candidate week that corresponded more closely to the regional viral isolate peak week than the RSV peak week. First, if there were more than two candidates, we chose the two candidates that were closest to the WHO-NREVSS regional viral isolate peak week. The candidate that was finally chosen as the city-specific peak week satisfied at least two of the following three criteria: (1) the candidate week was closest to the regional viral isolate peak week, (2) the candidate week had the greatest number of visits in a 7-week period that included the 3 weeks preceding and following the candidate week and (3) the candidate week was furthest from the city-specific RSV peak week. The candidate week that satisfied at least two of the three criteria was selected as ‘peak week’ for that city and influenza season.
Meteorological data and potentially confounding variables
For each city, daily average temperature and dew-point data were compiled using observations from the meteorological station closest to the hospital. These data were drawn from the National Oceanic and Atmospheric Administration (NOAA) National Climate Data Center (NCDC) Cooperative Summary of the Day TD3200 dataset. Daily short-wave solar radiation estimates were extracted from 8 km resolution gridded meteorological surfaces for the USA generated by the National Aeronautics and Space Administration (NASA) Ecological Forecasting Laboratory using the NASA Terrestrial Observation and Prediction System (TOPS). Incident short-wave solar radiation surfaces were generated by applying the daymet algorithm [Reference Thornton, Running and White22] which estimates incident solar radiation as a function of diurnal temperature range and sun-slope geometry. For each influenza season, we calculated city-specific averages of solar radiation, dew-point and average daily temperature measurements for the 3 months preceding the usual time of onset of epidemics (i.e. October–December). These daily climate variable averages were assessed as predictors of peak week in the statistical analyses.
In addition to the climate variables, we assessed the strength of association between three socio-demographic variables and peak week. The first was population size, a variable that was found to be a potential determinant of epidemic timing in the USA for data aggregated at the state level [Reference Viboud23]. We also assessed the effect of population density on timing because increased crowding may promote faster spread of an epidemic and result in an earlier influenza peak. The last variable we considered was the percentage of the population aged <18 years. Studies on the age-specific timing of influenza activity have found that paediatric groups lead adult groups in timing of influenza activity [Reference Olson24, Reference Brownstein, Kleinman and Mandl25]. Increased rates of transmission may occur in areas that have a greater proportion of the population aged <18 years [Reference Brownstein and Mandl26]. Data for socio-demographic variables were obtained from the United States Census 2000 [27].
Missing data
Of the 37 hospitals, two were excluded from the analysis. For one of the hospitals (in Milwaukee, WI) we had insufficient meteorological data due to numerous data gaps. The second hospital (in Palo Alto, CA) had only 606 cases across the five influenza seasons, resulting in a time series without discernible influenza peaks. In addition, two cities, St Louis (MO) and Atlanta (GA) were missing solar radiation values for the first influenza season, so these were imputed with solar radiation measurements from nearby cities Kansas City (MO) and Birmingham (AL)/Nashville (TN), respectively. Two cities, New York City and Oakland were missing in-patient counts for the first two influenza seasons and their missing peak weeks were automatically imputed in the Bayesian analysis.
Statistical analysis
Our goal was to assess the strength of the association between the city-specific climate variable averages and the city-specific peak weeks over the five influenza seasons of the study period. The correlations in measurements from the same city and measurements from the same influenza season preclude a regression analysis based on data pooled over all cities and influenza seasons. While an overall impression of the strength of association may have been attained from separate analyses by season, the range in the climate variable measurements (averages) was limited for some seasons so accuracy in parameter estimation may have been compromised by using this approach. In addition, greater statistical power may be achieved with a statistical analysis that utilizes all the data at once. Thus, we used multilevel models to determine the individual contribution of each of the environmental factors on epidemic timing.
We applied a Bayesian approach, as inference for generalized mixed models can be particularly sensitive to the point estimates of the variance parameters when there is insufficient information in the data given the complexity of the model. Bayesian hierarchical models average over the uncertainty of the parameters of the model rather than using point estimates [Reference Gelman and Hill28] thus, in the case of sparse data where the point estimates of variance parameters are imprecise, the Bayesian approach should give more reliable results. We also had to consider that latitude, temperature, solar radiation and dew point are correlated variables. Due to our relatively small sample size and the collinearity between the variables, we assessed the relationship between each variable with peak week without adjusting for the other covariates.
The Bayesian model we used included city and influenza season random effects to account for the correlations in multiple measurements from the same city and influenza season. Let y i represent the peak week of the epidemic and x i the independent variable (i.e. climate variable, latitude or longitude). Further, let the categorical variables j[i] and k[i] represent the city and the influenza season, respectively, in which measurement i was made. There were 35 cities and five influenza seasons giving a total of 35×5=175 peak week, solar radiation, temperature and dew-point measurements. The formulation of the model is as follows:
where N(μ, σ2) represents the normal distribution with mean μ and variance σ2. The random effects for city and season are denoted by α.city and α.season, respectively. The city random effects are subject to the identifiability constraint ![]() . We chose vague priors for the standard deviations and means of the random effects, Uniform(0, 100) and Normal(0, 106) distributions, respectively. All analyses were conducted using R and WinBUGS 1.4 software [31, Reference Spiegelhelter32]. WinBUGS software is particularly convenient because it automatically performs multiple imputations for missing outcome data [Reference Spiegelhelter32].
. We chose vague priors for the standard deviations and means of the random effects, Uniform(0, 100) and Normal(0, 106) distributions, respectively. All analyses were conducted using R and WinBUGS 1.4 software [31, Reference Spiegelhelter32]. WinBUGS software is particularly convenient because it automatically performs multiple imputations for missing outcome data [Reference Spiegelhelter32].
The potential scale reduction factor ![]() was used to assess convergence of the Markov Chain Monte Carlo (MCMC) sequence [Reference Gelman33] and test runs demonstrated that with 30 000 iterations,
was used to assess convergence of the Markov Chain Monte Carlo (MCMC) sequence [Reference Gelman33] and test runs demonstrated that with 30 000 iterations, ![]() <1·01 for all models, indicating that convergence was achieved. Thus, three chains of length 30 000 with different initial values were generated, 15 000 were discarded as burn-in iterations and the sequence was thinned, so that only every fifth simulated draw was retained leaving a posterior sample of 9000 for parameter estimation.
<1·01 for all models, indicating that convergence was achieved. Thus, three chains of length 30 000 with different initial values were generated, 15 000 were discarded as burn-in iterations and the sequence was thinned, so that only every fifth simulated draw was retained leaving a posterior sample of 9000 for parameter estimation.
RESULTS
From 1 October 2000 to 30 September 2005, there were a total of 63 334 PHIS cases that met the case definition. City-specific five season totals ranged from 734 (Omaha, NE) to 4844 (Houston, TX) with a mean of 1828 cases per city. The mean of solar radiation averages for October–December was 185·0 W/m2 and ranged from 40·13 to 316·9 W/m2 over the five influenza seasons. The mean of the temperature and dew-point averages were 11·0°C (range −0·43 to 24·3) and 5·3°C (range −6·3 to 9·7), respectively. Latitude ranged from 25·7° to 47·7° and longitude ranged from −122·3° to −71·1°.
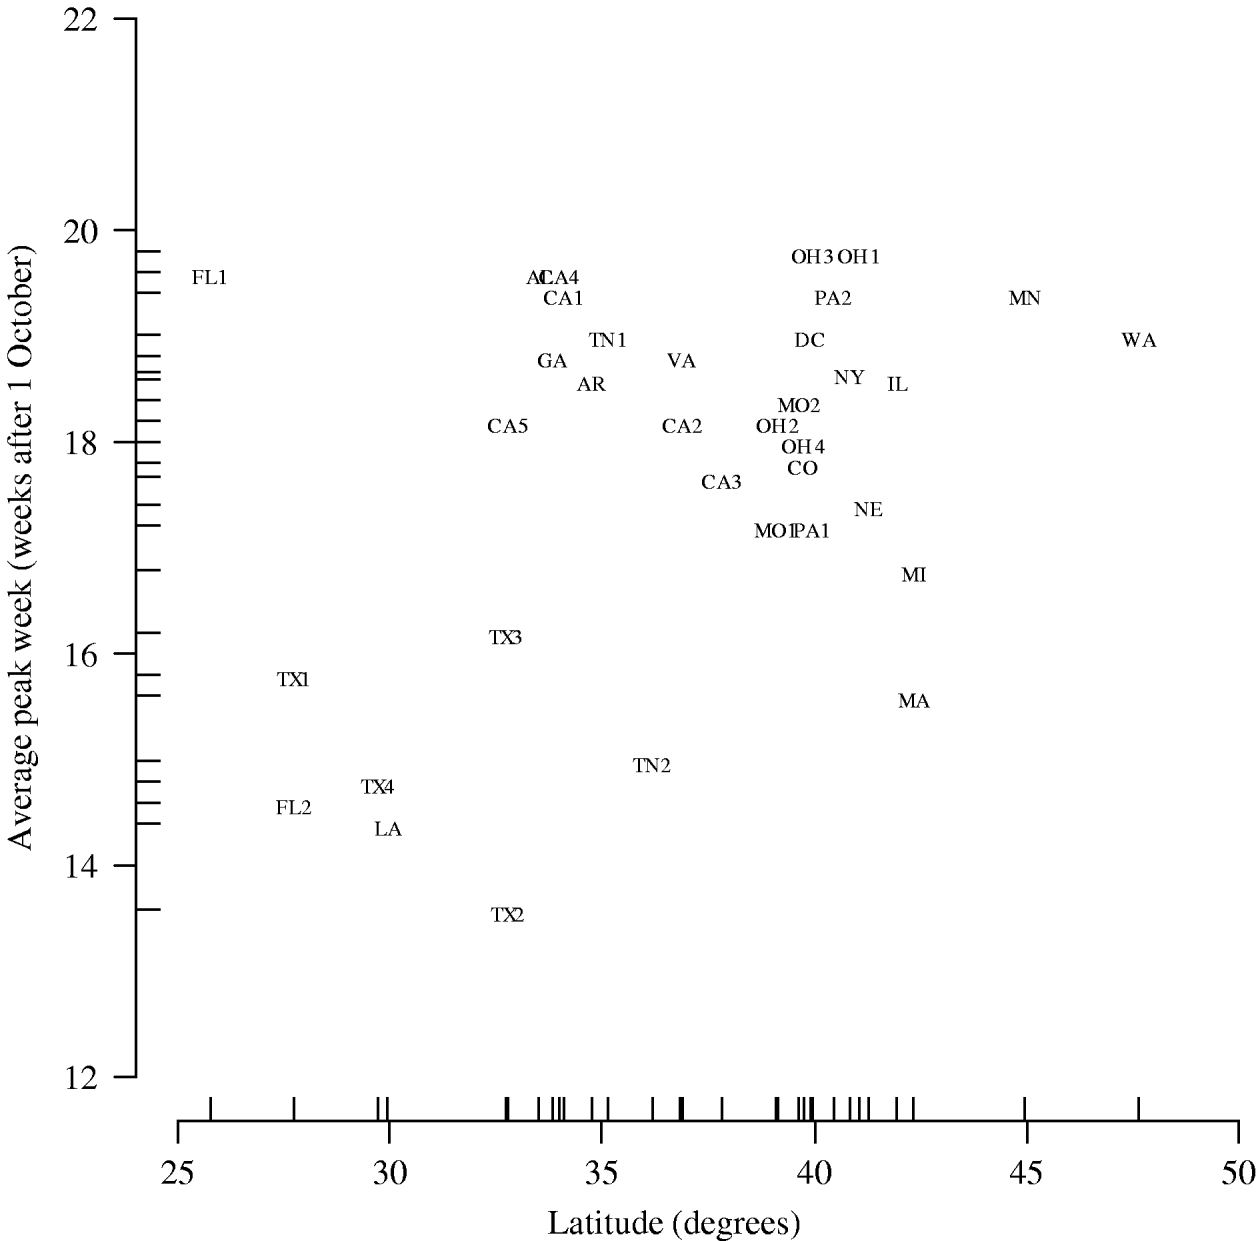
Figure 2 shows peak week averaged over the five influenza seasons plotted against latitude. In the multilevel modelling of peak week on geographical coordinates, we observed a positive association with latitude (0·13 weeks per degree, 95% CI 0·013–0·24) but not with longitude (0·0115 weeks per degree, 95% CI −0·033 to 0·056).
Peak week averaged over the five influenza seasons vs. latitude of city (hospital). AL, Alabama (Birmingham); AR, Arkansas (Little Rock); CA, California (1, Los Angeles; 2, Madera; 3, Oakland; 4, Orange; 5, San Diego); CO, Colorado (Denver); DC, District of Columbia (Washington, DC); FL, Florida (1, Miami; 2, St Petersburg); GA, Georgia (Atlanta); IL, Illinois (Chicago); LA, Louisiana (New Orleans); MA, Massachusetts (Boston); MN, Minnesota (Minneapolis/St Paul); MO, Missouri (1, Kansas City; 2, St Louis); NE, Nebraska (Omaha); NY, New York (New York City); OH, Ohio (1, Akron; 2, Cincinnati; 3, Columbus; 4, Dayton); PA, Pennsylvania (1, Philadelphia; 2, Pittsburgh); TN, Tennessee (1, Memphis; 2, Nashville); TX, Texas (1, Dallas; 2, Corpus Christi; 3, Fort Worth; 4, Houston); VA, Virginia (Norfolk); WA, Washington (Seattle).
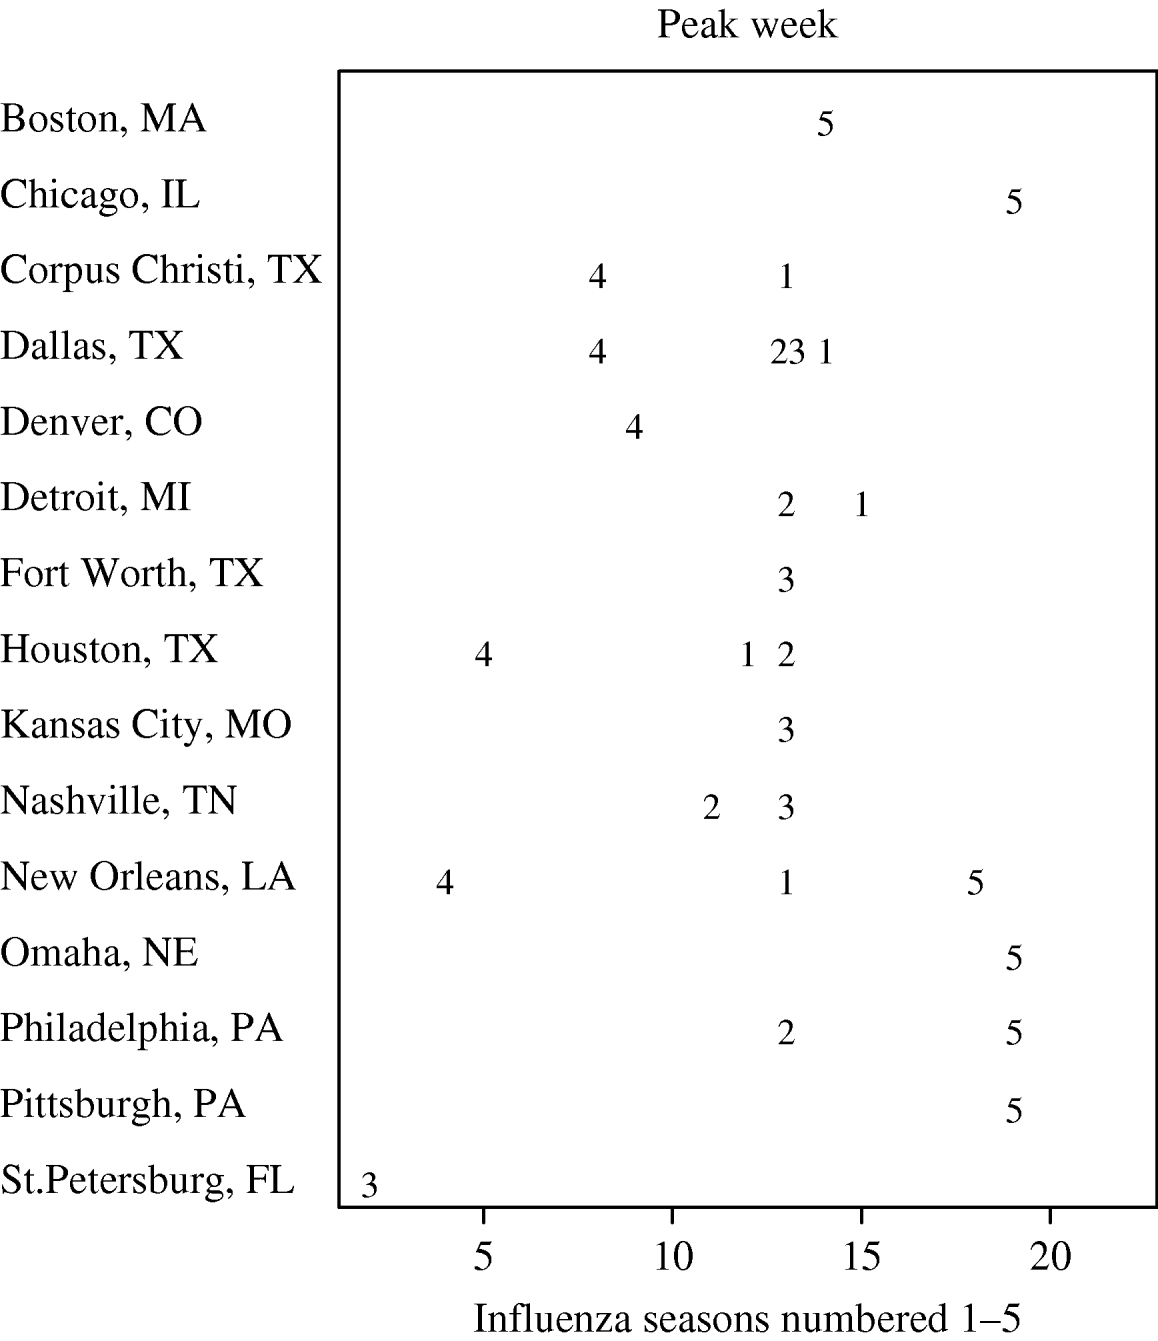
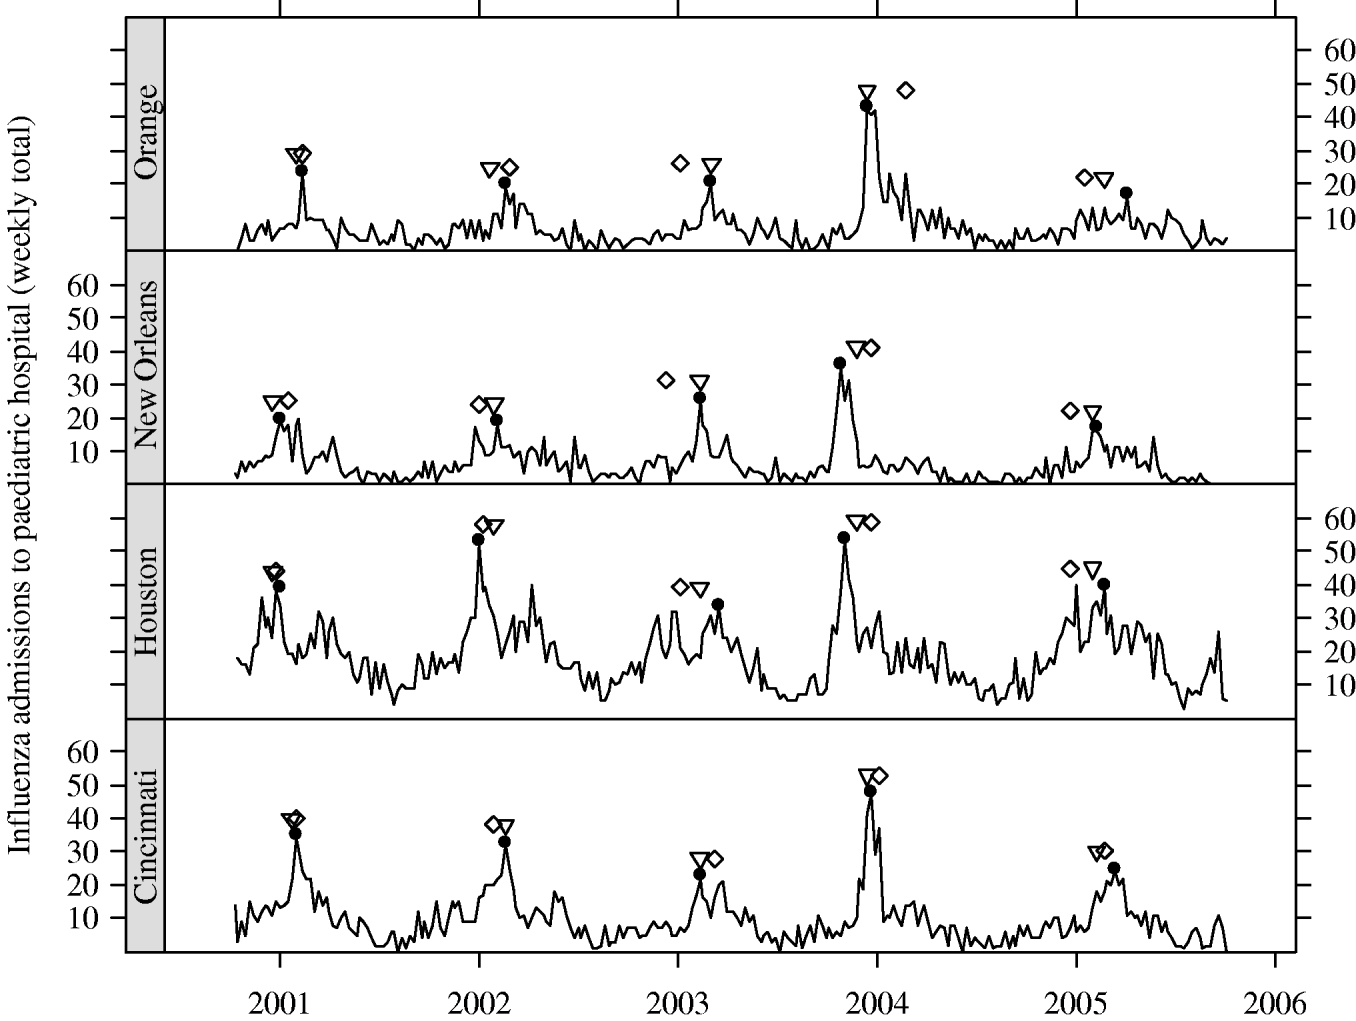
In Figure 3, we present the cities with the five earliest peak weeks in each season. Cities in Texas tended to be earlier in all but the 2004–2005 season. Epidemics in Texas were estimated to be about 3 weeks earlier than in other cities (−3·16 weeks, 95% CI −4·69 to −1·64). However, relative to the Texas cities, the epidemics in cities at similar southern latitudes in California tended to have later peaks. In fact, cities in California were never amongst the earliest (Fig. 3). In Figure 4, we show the series of hospital in-patient visits for four cities, Orange (CA), Cincinnati (OH), Houston (TX) and New Orleans (LA).
Earliest five peak weeks for each influenza season.
Series of weekly hospital counts for four cities. Peak week for: influenza (●), regional viral isolate (▽), respiratory syncytial virus (⋄).
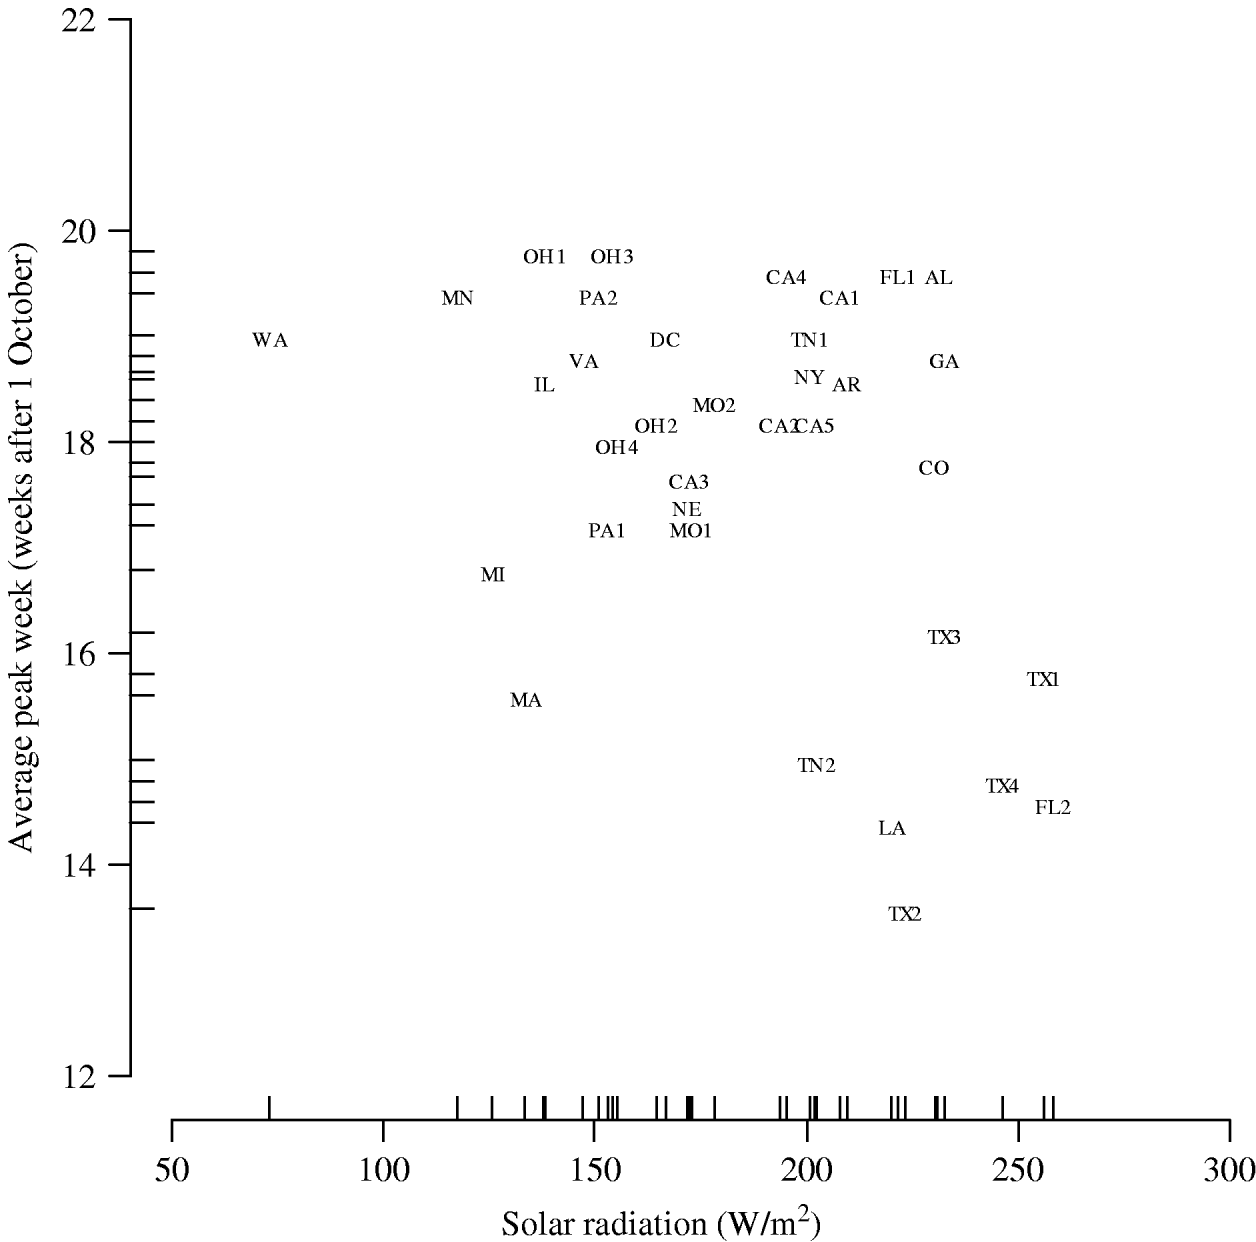
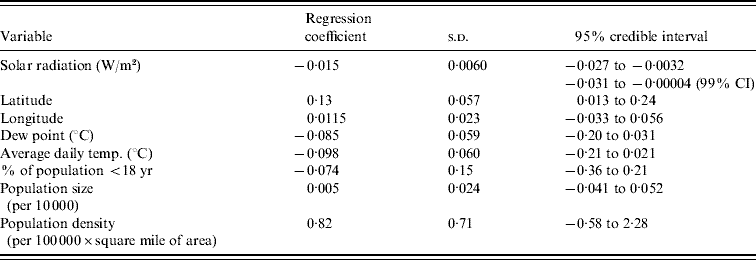
The results of the multilevel modelling, assessing the association of each climate variable with the peak week of influenza visits, are shown in Table 1. Solar radiation is negatively associated with peak week (−0·015 weeks per W/m2, 95% CI −0·027 to −0·0032). Figure 5 displays the graph of peak week vs. solar radiation averaged over the five influenza seasons. We did not find a similar significant relationship between peak week and temperature (−0·098 weeks/°C, 95% CI −0·21 to 0·021) and peak week and dew point (−0·085 weeks/°C, 95% CI −0·20 to 0·031). The socio-demographic variables were not associated with the week of peak influenza activity (Table 1).
Peak week vs. solar radiation averaged over the five influenza seasons. (See Fig. 2 legend for abbreviations.)
Relationship between climate, geographical and socio-demographic variables and timing of epidemic
To assess the sensitivity of the results to the choice of prior, we re-ran the analyses with three additional sets of priors for the variance parameters but the change in the results was minimal. Only average temperature and average dew point appeared marginally significant when using a gamma prior for the precisions. We also assessed sensitivity of the results to the time period of averaging for the climate variables. Rather than averaging weekly measurements over 1 October to 31 December, we re-ran the analyses using two alternatives: averages over 29 October to 31 December and averages over 26 November to 31 December. These changes did not alter the significance for any of the variables.
DISCUSSION
In this study we have shown that, for the five influenza seasons between 2000 and 2005, cities with higher average solar radiation values over the time period October–December tended to have earlier influenza epidemics. Similarly, we found that latitude was positively associated to peak week but longitudinal position was not. Neither temperature nor dew point was significantly related to the week of peak influenza activity.
In previous studies, patterns of influenza spread have been associated with latitude, on the global scale, and longitude, at a finer geographic resolution in Japan and Europe [Reference Finkelman17, Reference Paget34, Reference Sakai35]. Although we found a relationship between latitude and timing of peak influenza activity, this association may be explained, to some extent, by our finding of a negative association between solar radiation and peak timing. Although our objective was to determine whether the spatial variation in the timing of peak influenza activity could be related to the geographical variation in solar radiation, temperature and dew point, we note that these results do not support many of the current hypotheses that attempt to explain the winter timing of influenza epidemics. For example, if the timing of influenza epidemics were strongly related to indoor crowding, drier indoor conditions, colder outdoor temperatures, ultraviolet inactivation of the virus or reduced levels of circulating vitamin D3, we would expect to see earlier epidemics in the northern cities of the USA. Even at the global scale, Finkelman et al. observed that countries closer to the equator had earlier epidemics than countries that were further from the equator, a finding that also goes against commonly held beliefs regarding the determinants of the winter timing of annual influenza epidemics [Reference Finkelman17].
A study by Viboud et al. revealed a higher incidence of influenza during the cold phases of the El Niño/Southern Oscillation, relative to the warm phases [Reference Viboud7]. Other evidence in support of the role of temperature and relative humidity comes from animal studies in which lower temperatures and humidity were linked to higher rates of aerosol (but not contact) transmission of the influenza virus [Reference Polozov5, Reference Lowen6, Reference Lowen8]. Although our study focused on the spatio-temporal variation of epidemic timing (i.e. not incidence) within an influenza season, we did not find a significant relationship with temperature or dew point and the observed significant relationships with solar radiation and latitude would imply that, if there were a significant relationship, we would find higher temperatures and dew point associated with earlier epidemics.
While the overall spatio-temporal trends of peak influenza activity give evidence of the role of solar radiation and latitude as predictors of epidemic timing, the specific patterns in the geographical variation of peak influenza activity deserve further attention. Viboud et al. used state-specific counts of excess mortality due to pneumonia and influenza to examine the timing of influenza epidemics for the 48 contiguous states of the USA (and the District of Columbia) for the study period 1972 to 2002 and found that influenza epidemics most often started in the state of California and the more populous states had a greater tendency towards synchrony in the timing of epidemics [Reference Viboud23]. In our study, we found an association with latitude but this observed association may have been partly driven by the early epidemics in a few south-eastern cities (e.g. cities in eastern Texas were earlier by an average of 3 weeks).
Unlike other studies, in which air travel, connections to Asia and Australia and population size have been offered as determinants of influenza spread [Reference Viboud23, Reference Brownstein, Wolfe and Mandl36], we did not find an association between city population size or density and epidemic timing and the cities with the greatest share of overseas visitors, namely New York City and Los Angeles [37], did not have earlier epidemics. While it is true that these conclusions are based on only 5 years of data, lifestyle and air travel have changed in the last 30 years and, as a result, the important determinants of influenza spread may also have changed somewhat during that period.
Although the results concerning the relationship between solar radiation and epidemic timing are robust, given that observations from the same city and observations from the same year are correlated, this study was limited by a relatively small sample size of 35 cities, each with just five seasons of in-patient visit data. Furthermore, we had a greater number of cities in the more humid eastern region of the country and those cities in western USA were mostly situated in the south. The inclusion of a greater number of cities in the northern extremes of latitude and in the more arid western regions may have revealed a more pronounced effect of latitude and may have enabled the detection of a significant association with temperature and dew point. In addition, a longer period of study may have permitted an examination of the interaction between the environmental factors and the influenza season's predominant strain.
In our analyses, we did not adjust for multiple comparisons, but our main study objective involved an assessment of the association of only five variables with epidemic timing, thus the expected number of false positives is <1. Moreover, solar radiation was significant at the 0·01 level and with a threshold for significance set at 0·01 for each test, the significance level for the family of five tests is <0·05 (i.e. 5×0·01).
Epidemiological studies of influenza are often limited by a broad case definition and the lack of viral confirmation for cases. Influenza-like illness encompasses many respiratory illnesses, including RSV and influenza. Children (i.e. aged <18 years), in particular, have different clinical presentations which may lead to misclassification. To avoid misclassification and confusing RSV peak weeks for influenza peak weeks, we included only in-patient visits with ICD-9 codes belonging to a subset of codes that have been shown to be specific for influenza [Reference Marsden-Haug19]. In addition, when there were several candidates for peak week, we used the CDC regional viral isolate peaks and city-specific RSV peaks (estimated from the PHIS data) to guide the choice of peak that would best represent the true influenza peak. In children aged <5 years, RSV accounts for a greater proportion of respiratory infection than does influenza. However, the contribution of RSV and influenza is about equal in children aged 5–14 years [Reference Fleming38]. Thus, it is plausible that restricting the case definition to children aged ⩾5 years will lead to more accurate identification of influenza cases. Unfortunately, only about one third of the cases fitting our influenza case definition were aged ⩾5 years. Consequently, the series of weekly counts of cases in this age group was particularly noisy for hospitals with smaller total counts and epidemic peaks were not easily identified. Rather than basing our analyses on children aged ⩾5 years, we validated a subset of our peak-week measurements identified from the all-ages series with those from the ⩾5 years series. To do this, we determined the peak weeks for each season for eight hospitals with larger total counts and using a multilevel model with a dichotomous independent variable (i.e. ‘all-ages’=0, ‘⩾5 years’=1) we did not find a significant difference between the 8 hospital×5 season=40 peak-week measurements from the two datasets, giving greater reassurance that we are indeed identifying influenza and not RSV peak weeks. Even so, healthcare utilization data encompasses a complex behavioural component and as these data were not collected for the specific purpose of this research, the results are subject to the standard limitation of analysing administrative data.
We chose to average meteorological variable measurements over the 3-month period of October–December and considered two other time periods for averaging in a sensitivity analysis but averages over shorter periods may be revealing. Further, future research should investigate the effects of other environmental factors, such as precipitation and diurnal temperature range, as previous studies have found evidence of their effect on influenza spread [Reference Chew18, Reference Liu39]. Although solar radiation was found to be significantly related to peak timing, the relationship between these variables can be further refined. In particular, future research could provide more detailed insight into possible threshold effects of these meteorological variables on the peak timing of epidemics.
Peak week of the epidemic was used as the marker of epidemic timing in our study because it is one of the most easily identified features of the distribution of incident cases in a given season. Although we used the week corresponding to the crude peak, when there was not a single, well-defined peak, estimates of the peak week from time-series analytical methods or estimates of the mean week may have better captured the week corresponding to the centre of the epidemic. Onset and end of the epidemic may be more difficult to discern, particularly for data at a fine geographical resolution where the series of counts of influenza cases are noisy. If more stable series of counts can be formed, for example, by combining in-patient data from multiple hospitals in a city, identification of onset and end of the epidemic may be more accurately estimated and markers of spread based on these may be considered. For example, a composite measure of magnitude and duration may reveal interesting patterns in influenza spread.
In this study, using data at a fine spatial resolution, we observed a significant positive relationship between latitude and epidemic timing, indicating that, in the USA, cities at lower latitudes tend to have earlier epidemics relative to cities at higher latitudes. This complements the findings of Finkelman et al. that revealed a positive relationship between latitude and epidemic timing on the global scale [Reference Finkelman17]. In addition, the significant inverse relationship between solar radiation and epidemic timing potentially offers a biological basis for the observed significance of latitudinal position. Future studies may help to elucidate the possible biological mechanisms underlying solar radiation that may contribute to the spatio-temporal patterns of influenza spread in temperate regions.
ACKNOWLEDGMENTS
This work was supported by R21AI073591-01 from the National Institute of Allergy and Infectious Diseases, R21LM009263-01 from the National Library of Medicine, National Institutes of Health, and PAN-83152 from the Canadian Institutes of Health Research. The authors are grateful to Dr Marc Lipsitch for helpful suggestions and comments. Thanks are also due to Dionne Graham for help in acquiring the hospitalization data.
DECLARATION OF INTEREST
None.


