


Impact statement
Whereas only a few marine species have gone globally extinct due to human activities, an increasing number of ocean-dwelling lifeforms are on decline. However, most scientific surveys and monitoring efforts only cover the last several decades and are thus insufficient to fully assess long-term human impacts on the marine biosphere. The late Quaternary fossil record and other geohistorical archives fill this gap by documenting marine biodiversity losses that have already taken place, pinpointing ecological shifts that exceed natural variability and improving our ability to identify species facing extinction threats. Whereas data and strategies focusing on present-day biodiversity will remain the critical dimension of conservation and ecosystem management, geohistorical approaches can augment those efforts by documenting biodiversity losses and threats that would not and could not have been discovered otherwise and by providing direct insights into the transition of the pre-human biosphere into its current state.
Introduction
Extinctions and extinction threats linked to human activities are on the rise, prompting warnings about the arrival of the sixth mass extinction (e.g., Leakey, Reference Leakey1996; Kolbert, Reference Kolbert2014; Ceballos et al., Reference Ceballos, Ehrlich, Barnosky, García, Pringle and Palmer2015; Régnier et al., Reference Régnier, Achaz, Lambert, Cowie, Bouchet and Fontaine2015; Plotnick et al., Reference Plotnick, Smith and Lyons2016; Dasgupta and Ehrlich, Reference Dasgupta, Ehrlich, Dasgupta, Raven and McIvor2019; Cowie et al., Reference Cowie, Bouchet and Fontaine2022). However, the current biodiversity crisis has deep historical roots (e.g., Soulé, Reference Soulé1985; Wilson, Reference Wilson1985; Jackson et al., Reference Jackson, Kirby, Berger, Bjorndal, Botsford, Bourque, Bradbury, Cooke, Erlandson, Estes and Hughes2001; Pandolfi et al., Reference Pandolfi, Bradbury, Sala, Hughes, Bjorndal, Cooke, McArdle, McClenachan, Newman, Paredes and Warner2003; Lotze et al., Reference Lotze, Lenihan, Bourque, Bradbury, Cooke, Kay, Kidwell, Kirby, Peterson and Jackson2006; Frank, Reference Frank2022) that extend back far beyond the temporal span of the modern instrumental records, bio-inventorying efforts and long-term ecological monitoring programs, especially in marine ecosystems (see Figure 1 in Kosnik and Kowalewski, Reference Kosnik and Kowalewski2016). While data on present-day ecosystems are invaluable (e.g., Strong et al., Reference Strong, Barrientos, Duda, Sapper, Lessios and Maintyre1997; Franke et al., Reference Franke, Buchholz and Wiltshire2004; Vinod et al., Reference Vinod, Asokan, Joshi, Narayanakumar, Zacharia, Varghese, Jasmine, Anasu Koya, Kunhikoya, Ansar and Nikhiljith2020), they mostly cover the last few decades (Vellend et al., Reference Vellend, Brown, Kharouba, McCune and Myers‐Smith2013; Dornelas et al., Reference Dornelas, Gotelli, McGill, Shimadzu, Moyes, Sievers and Magurran2014; Blowes et al., Reference Blowes, Supp, Antão, Bates, Bruelheide, Chase, Moyes, Magurran, McGill, Myers-Smith and Winter2019) and their predominantly local spatial focus translates into patchy global coverage. In short, neontological data inform us about the most recent eco-environmental changes in selected regions, even though those changes may have been ongoing for much longer and affecting other regions of the world.
Comparison of four major invertebrate phyla (arthropods, cnidarians, echinoderms and molluscs) across marine, brackish, freshwater, and terrestrial systems as recorded in the IUCN Red List Database (IUCN, 2023a). (a) The total number of species reported in the database for each of the four systems (numbers indicate the total number of species). (b) The Red List status of invertebrate species grouped into four broad categories (‘Extinct’, ‘Endangered’, ‘Lower Risk’, and ‘Unknown’) tallied separately for each system. The broad categories were derived by pooling IUCN categories as follows: (1) “Unknown” – “Data Deficient”; (2) “Extinct” – “Extinct”, “Extinct in the Wild”; (3) “Endangered” – “Critically Endangered”, “Endangered”, “Vulnerable”; and (4) “Lower Risk” – “Near Threatened”, “Lower Risk/near threatened”, “Lower Risk/conservation dependent”, “Lower Risk/least concern”, “Least Concern”. See Supplementary Material for additional information.

Placing neontological observations in the context of the long-term dynamics of ecosystems is a prerequisite for assessing human impacts on our biosphere (Pandolfi et al., Reference Pandolfi, Staples and Kiessling2020). Conservation palaeobiology is an emerging geohistorical approach developed towards this goal (e.g., Flessa, Reference Flessa2002; Kowalewski, Reference Kowalewski and Geller2004; Froyd and Willis, Reference Froyd and Willis2008; Dietl and Flessa, Reference Dietl and Flessa2011, Reference Dietl and Flessa2020; Tyler and Schneider, Reference Tyler and Schneider2018; Kiessling et al., Reference Kiessling, Raja, Roden, Turvey and Saupe2019; Turvey and Saupe, Reference Turvey and Saupe2019; Dillon et al., Reference Dillon, Pier, Smith, Raja, Dimitrijević, Austin, Cybulski, De Entrambasaguas, Durham, Grether, Haldar, Kocáková, Lin, Mazzini, Mychajliw, Ollendorf, Pimiento, Regalado Fernández, Smith and Dietl2022; Nawrot et al., Reference Nawrot, Dominici, Tomašových and Zuschin2023). By using geohistorical archives (e.g., sediment cores, surficial skeletal assemblages, archaeological middens, geochemical proxies, ancient DNA) from the most recent centuries and millennia, conservation palaeobiology aims to document temporal trajectories in eco-environmental patterns, assess the timing, magnitude and forcing of past ecosystem changes and elucidate processes associated with the transition of the pre-human biosphere to its current state. In addition, conservation palaeobiology provides a direct strategy for assessing deeper historical roots that underlie current extinction threats (e.g., habitat loss and fragmentation, range contractions, population declines) and may ultimately result in future extinctions (Saupe et al., Reference Saupe, Farnsworth, Lunt, Sagoo, Pham and Field2019).
Over the last several decades, geohistorical approaches have been applied to study human impacts on terrestrial (e.g., Gorham et al., Reference Gorham, Brush, Graumlich, Rosenzweig and Johnson2001; Behrensmeyer and Miller, Reference Behrensmeyer, Miller and Louys2012; Wood et al., Reference Wood, Wilmshurst, Worthy, Holzapfel and Cooper2012; Lyons et al., Reference Lyons, Amatangelo, Behrensmeyer, Bercovici, Blois, Davis, DiMichele and Eronen2016; Barnosky et al., Reference Barnosky, Hadly, Gonzalez, Head, Polly, Lawing, Eronen, Ackerly, Alex, Biber and Blois2017; Jackson et al., Reference Jackson, Gray, Shuman, Dietl and Flessa2017; Koch et al., Reference Koch, Fox-Dobbs and Newsome2017; Terry, Reference Terry2018; Smith et al., Reference Smith, Elliott Smith, Villaseñor, Tomé, Lyons and Newsome2022), freshwater (e.g., Brown et al., Reference Brown, Kowalewski, Neves, Cherry and Schreiber2005; Smol, Reference Smol2008; Erthal et al., Reference Erthal, Kotzian and Simões2011; Kusnerik et al., Reference Kusnerik, Means, Portell, Kannai, Monroe, Means and Kowalewski2022; Czaja et al., Reference Czaja, Covich, Becerra-López, Cordero-Torres, Estrada-Rodríguez, Jones, Ornelas-García, Pineda-López and Álvarez2023) and marine (e.g., Kowalewski et al., Reference Kowalewski, Serrano, Flessa and Goodfriend2000, Reference Kowalewski, Wittmer, Dexter, Amorosi and Scarponi2015; Jackson et al., Reference Jackson, Kirby, Berger, Bjorndal, Botsford, Bourque, Bradbury, Cooke, Erlandson, Estes and Hughes2001; Kidwell, Reference Kidwell2007; Aronson, Reference Aronson, Dietl and Flessa2009; Tomašových and Kidwell, Reference Tomašových and Kidwell2017; Hyman et al., Reference Hyman, Frazer, Jacoby, Frost and Kowalewski2019; Cybulski et al., Reference Cybulski, Husa, Duprey, Mamo, Tsang, Yasuhara, Xie, Qiu, Yokoyama and Baker2020; Albano et al., Reference Albano, Steger, Bošnjak, Dunne, Guifarro, Turapova, Hua, Kaufman, Rilov and Zuschin2021; Dillon et al., Reference Dillon, McCauley, Morales-Saldaña, Leonard, Zhao and O’Dea2021; Hong et al., Reference Hong, Yasuhara, Iwatani, Chao, Harnik and Wei2021; Rivadeneira and Nielsen, Reference Rivadeneira and Nielsen2022; Meadows et al., Reference Meadows, Grebmeier and Kidwell2023; Scarponi et al., Reference Scarponi, Rojas, Nawrot, Cheli and Kowalewski2023) ecosystems. The above citations are only a fraction of novel studies aimed at establishing pre-Anthropocene baselines or improving the management and restoration of natural habitats by employing geohistorical data. Here, we focus on documenting how geohistorical approaches can improve our understanding of extinctions and extinction threats in the marine realm.
Most of the recent extinctions have been documented for terrestrial organisms, which are the main focus of extinction studies, while relatively less is known about other taxa, especially marine invertebrates (McKinney, Reference McKinney1998; Régnier et al., Reference Régnier, Achaz, Lambert, Cowie, Bouchet and Fontaine2015; but see Cowie et al., Reference Cowie, Bouchet and Fontaine2022). Nonetheless, despite a multitude of anthropogenic impacts such as deoxygenation, heat stress, acidification, overfishing and pollution that led to significant range contractions and extirpations at regional scales (Scheffer et al., Reference Scheffer, Carpenter and de Young2005; Jackson, Reference Jackson2008; Pusceddu et al., Reference Pusceddu, Bianchelli, Martín, Puig, Palanques, Masqué and Danovaro2014), only a few species of marine organisms have been deemed extinct (del Monte-Luna et al., Reference del Monte-Luna, Castro-Aguirre, Brook, De La Cruz-Agüero and Cruz-Escalona2009; Dulvy et al., Reference Dulvy, Pinnegar, Reynolds and Turvey2009; Régnier et al., Reference Régnier, Achaz, Lambert, Cowie, Bouchet and Fontaine2015; Briggs, Reference Briggs2017; Cowie et al., Reference Cowie, Bouchet and Fontaine2022; del Monte-Luna et al., Reference del Monte-Luna, Nakamura, Vicente, Pérez-Sosa, Yáñez-Arenas, Trites and Lluch-Cota2023). Nevertheless, many marine ecosystems have been degraded, and many marine organisms face extinction threats (e.g., Edgar et al., Reference Edgar, Samson and Barrett2005; Lotze et al., Reference Lotze, Coll, Magera, Ward-Paige and Airoldi2011; McCauley et al., Reference McCauley, Pinsky, Palumbi, Estes, Joyce and Warner2015; Penn and Deutsch, Reference Penn and Deutsch2022). Consequently, the relatively low number of marine extinctions may reflect the dearth of conservation assessments for marine species, especially when compared to the notably more extensively studied terrestrial organisms, especially vertebrates (Webb and Mindel, Reference Webb and Mindel2015; but see Cowie et al., Reference Cowie, Bouchet and Fontaine2022).
A comparison of four widespread and diverse invertebrate phyla (Arthropoda, Cnidaria, Echinodermata, and Mollusca) listed in the International Union for Conservation of Nature’s (IUCN) Red List database (IUCN, 2023a) is consistent with previous studies (e.g., Webb and Mindel, Reference Webb and Mindel2015) in demonstrating that terrestrial and freshwater invertebrates (arthropods and molluscs) are represented much more comprehensively than their marine and brackish counterparts (Figure 1a). In fact, only one marine and no brackish invertebrate species are reported as having gone extinct after 1,500 CE (the year IUCN uses as a cut-off for listing species as extinct; Figure 1b). However, consistent with the recent literature, the database identifies numerous marine invertebrates as endangered, indicating that our neontological knowledge of marine extinction threats is growing. Here, we will consider how geohistorical archives can augment our understanding of marine extinctions and extinction threats.
One obvious caveat applies to the IUCN analysis above. The IUCN sampling coverage varies greatly across systems, and thus, the absence of extinctions in the systems with a more limited IUCN assessment may reflect undersampling. In particular, the brackish system (n = 95 species) is poorly sampled. When other systems are sample standardised to the sample size of the smallest system (n = 95 species), the probability of detecting at least one extinction event is relatively high for freshwater systems (~1% of the assessed species classified as extinct) and high for terrestrial systems (~2.5% of the assessed species classified as extinct) but low for the marine system (~0.1% assessed species classified as extinct). The probabilities of detecting at least one extinction are 0.63, 0.91 and 0.11, respectively (see Supplementary Material). A total of 95 species should be enough to detect extinct species in brackish systems (detection probability >0.99) only if extinction rates exceeded 5%. This caveat itself involves a caveat, however. The above estimates rely on an assumption that assessed species are a random sample of all species in a system.
Extinction terminology
To minimise terminological ambiguity, we provide explicit definitions of extinction types. In its strictest formal definition, extinction is typically understood as a complete and irreversible disappearance of a species on a global scale. However, geographic range contractions, population declines or shifts in functional traits can undermine ecosystem health and services as much as global extinctions. Past mass extinctions may have been mass rarity events, with rarity being practically equivalent to extinctions, in terms of both ecological consequences as well as the resulting fossil record of biodiversity (Hull et al., Reference Hull, Darroch and Erwin2015). Building on terminology reviewed in previous studies (Estes et al., Reference Estes, Duggins and Rathbun1989; Carlton et al., Reference Carlton, Geller, Reaka-Kudla and Norse1999; McConkey and O’Farrill, Reference McConkey and O’Farrill2015; McCauley et al., Reference McCauley, Pinsky, Palumbi, Estes, Joyce and Warner2015), we distinguish here three main categories of extinctions.
Extinction – A total disappearance of a species. Also referred to as “global extinction” (Estes et al., Reference Estes, Duggins and Rathbun1989).
Extirpation – A local or regional disappearance of a species still occurring elsewhere (“local extinction” sensu Estes et al., Reference Estes, Duggins and Rathbun1989). Extirpations can lead to the fragmentation of geographic ranges and range contractions. However, not all extirpations lead to the decline in geographic range extent. For example, human harvesting of large limpets such as Scutellastra mexicana resulted in the demise of many (but not all) local populations along Mexico’s coast (Carballo et al., Reference Carballo, Yáñez, Bautista‐Guerrero, García‐Gómez, Espinosa, Tortolero‐Langarica and Michel‐Morfín2020). Consequently, the northern latitudinal range of this species has not contracted notably despite those numerous extirpations. Similarly, the latitudinal range of the iconic marine mammal (Dugong dugon) was not reduced by its human-driven extirpation from the Spermonde Archipelago in central-western Sulawesi (Moore et al., Reference Moore, Ambo-Rappe and Ali2017).
Ecological Extinction – Ecological decline of a species that is still present but very rare and no longer plays a significant ecological function or interacts significantly with other species (McConkey and O’Farrill, Reference McConkey and O’Farrill2015). Ecological extinctions may lead to the extinctions of other species in the community (Säterberg et al., Reference Säterberg, Sellman and Ebenman2013). Ecological extinction is usually driven by “decimation”, a dramatic decline in population density. Such decline can also lead to a drop below an abundance level at which a species can be economically harvested, referred to as “commercial extinction” (Carlton et al., Reference Carlton, Geller, Reaka-Kudla and Norse1999; McCauley et al., Reference McCauley, Pinsky, Palumbi, Estes, Joyce and Warner2015). A significant decline in abundance tends to correlate with range contractions (Worm and Tittensor, Reference Worm and Tittensor2011). Ecological extinction can also be driven by changes in functional traits of a species. For example, the loss of larger size classes and older age cohorts can diminish the role a species plays in the ecosystem (e.g., Norkko et al., Reference Norkko, Villnäs, Norkko, Valanko and Pilditch2013; Hočevar and Kuparinen, Reference Hočevar and Kuparinen2021). In many studies, the term “functional extinction” is equivalent to “ecological extinction” (e.g., McConkey and O’Farrill, Reference McConkey and O’Farrill2015; Ebenman et al., Reference Ebenman, Säterberg, Sellman, Moore, De Ruiter, McCann and Wolters2017), but it has also been used to denote a permanent lack of reproductive or recruitment success (see Jarić et al., Reference Jarić, Gessner and Solow2016 and references therein).
Extinction Debt – This conceptual addendum to the extinction terminology posits that biodiversity loss lags anthropogenic environmental pressures (e.g., habitat fragmentation; Tilman et al., Reference Tilman, May, Lehman and Nowak1994; but see MacArthur, Reference MacArthur1972). Human-driven ecosystem perturbations can increase the probability of species extinction and induce “extinction debts” when population sizes decline below their functioning thresholds (Malanson, Reference Malanson2008). However, intrinsic species traits (e.g., dispersal capacity, longevity, genetic plasticity), (meta)population dynamics (e.g., degree of connectivity) and species interactions can delay species disappearance. Thus, ecosystems tend to accumulate extinction debts during and after a perturbation (Hanski and Ovaskainen, Reference Hanski and Ovaskainen2002). As species go extinct, the “debt” is progressively paid off, and ecosystems shift towards a new equilibrium state. Although neontological data suggest that the time needed to pay off the debt, known as “relaxation time”, can range from only a few years to several centuries (Forman and Godron, Reference Forman and Godron1986), the fossil record demonstrates that a lag between environmental perturbations and resulting extinctions can reach even 2 million years (O’Dea et al., Reference O’Dea, Jackson, Fortunato, Smith, D’Croz, Johnson and Todd2007; O’Dea and Jackson, Reference O’Dea and Jackson2009). The magnitude of the debt in an ecosystem depends on the number of affected species. Whereas both theoretical and empirical approaches for detecting extinction debts have been developed (Kuussaari et al., Reference Kuussaari, Bommarco, Heikkinen, Helm, Krauss, Lindborg, Öckinger, Pärtel, Pino, Rodà and Stefanescu2009; Figueiredo et al., Reference Figueiredo, Krauss, Steffan‐Dewenter and Sarmento Cabral2019), quantifying extinction debts and relaxation times has proven challenging. The extinction-debt investigations have focused on continental settings, and only a few studies have dealt with marine ecosystems (see Briggs, Reference Briggs2011). Yet, the concept of extinction debt is valuable in its potential to identify extinction threats, forecast future extinctions and assess the common drivers (the trifecta of habitat destruction, climate change and invasive species).
The concept of extinction debt may be spatially and temporally scalable (e.g., “mass extinction debt” concept in Spalding and Hull, Reference Spalding and Hull2021), allowing to use geohistorical data for predicting future extinction risks. Palaeontological and other geohistorical investigations can act synergistically with ecological monitoring or theoretical models by providing historical estimates of the onset of ecosystem decline and magnitude of extinction debt that accumulated in the past. Documenting when the ecosystem decline started and estimating the extent of losses that have already occurred can help to evaluate relaxation times more precisely. Finally, documenting historical changes in ecosystems, which often reflect responses to natural (non-anthropogenic) processes, can also allow us to disentangle natural and anthropogenic drivers of extinctions.
Geohistorical perspectives on extinctions and extinction threats
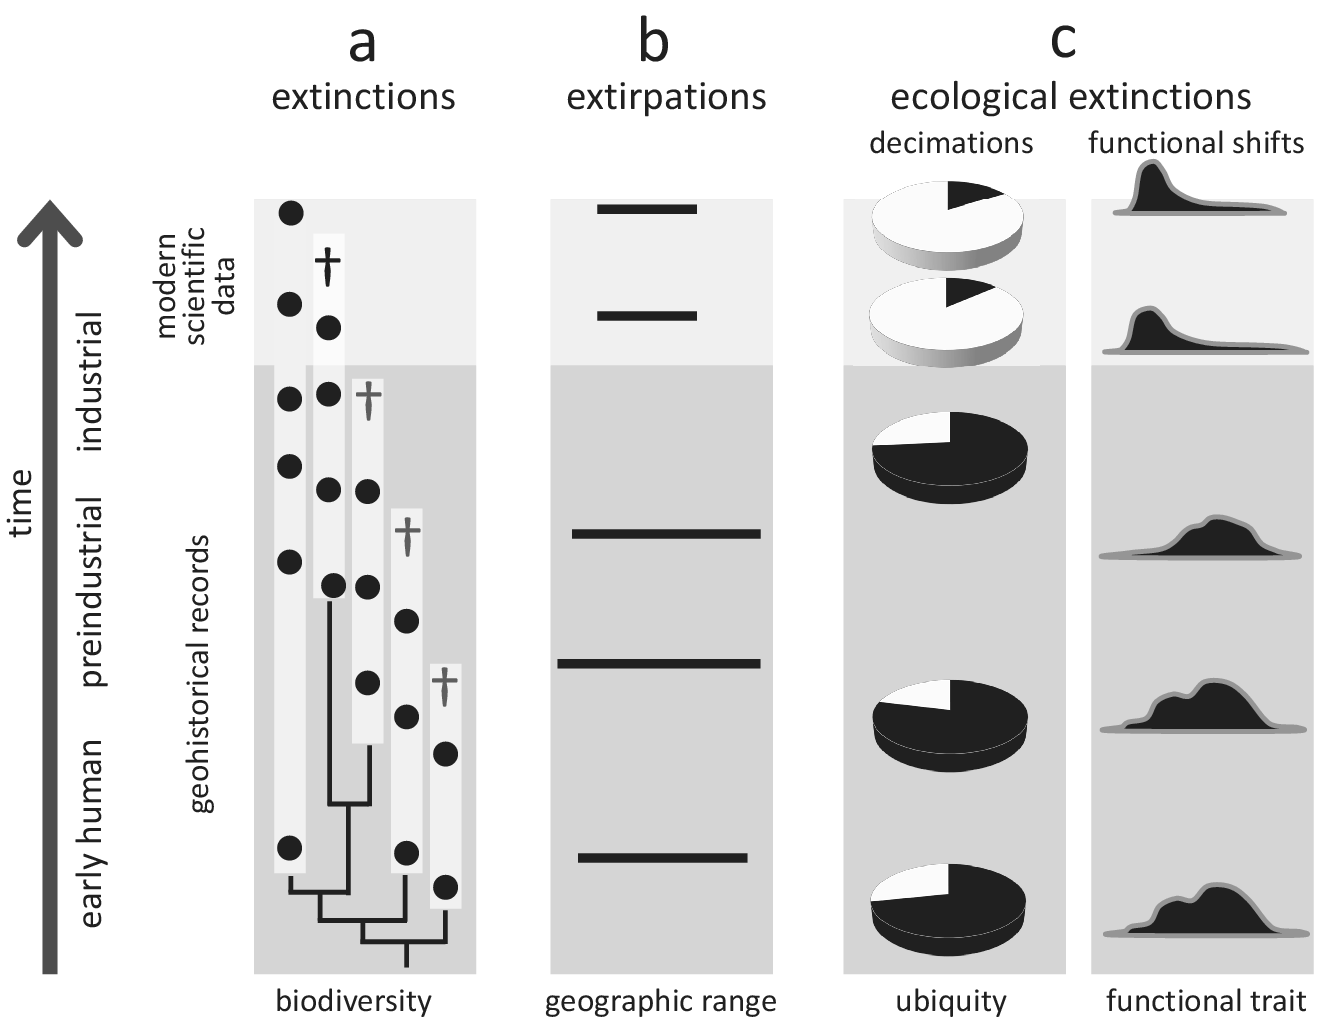
The value of geohistorical approach resides in its potential to detect extinctions, extirpations and ecosystem changes not discoverable by neontological data. For example, modern biomonitoring data focused on a particular clade may indicate that one of the two species disappeared (50% extinction), but the fossil record may demonstrate that three additional species existed in pre-industrial times. Thus, the within-clade extinction magnitude may be 80% rather than 50% of the species (Figure 2a). Seabirds inhabiting oceanic islands are a good example of underestimating human-driven extinctions, with more than 20 species lost worldwide during the Holocene (Tyrberg, Reference Tyrberg2009; Ramirez et al., Reference Ramirez, Illera, Rando, Gonzalez-Solis, Alcover and Lalueza-Fox2010). For instance, out of four shearwater species (genus Puffinus) breeding on the Canary Islands, two went extinct during the Holocene (Ramirez et al., Reference Ramirez, Illera, Rando, Gonzalez-Solis, Alcover and Lalueza-Fox2010; Rando and Alcover, Reference Rando and Alcover2010). However, these extinctions are not included in the IUCN Red List database, which uses 1500 CE as the cut-off year, even though those extinctions were linked to aboriginal colonisation of the archipelago and the introduction of exotic species following European settlement in the fourteenth century (Rando and Alcover, Reference Rando and Alcover2008, Reference Rando and Alcover2010). More generally, birds inhabiting islands, including both marine and land species, represent a remarkable example of how geohistorical data can transform our understanding of the timing and magnitude of human-driven extinctions. Based on zooarchaeological data, it has been estimated that as many as 2,000 bird species from Pacific tropical islands may have been driven to extinction by prehistoric human activities (Steadman, Reference Steadman1995, Reference Steadman2006).
Conceptual illustration of how geohistorical data augment our understanding of global extinctions, extirpations, and ecological extinctions. In all examples, geohistorical knowledge indicates significant losses that would not be discoverable using modern scientific data alone. (a) Extinctions - an example of a clade for which the extinction rate is much higher once geohistorical data are considered (see text for a case example of the seabirds Puffinus). White bars indicate estimated stratigraphic ranges based on fossil occurrences (black circles), crosses indicate terminal extinction events; (b) Extirpations - an example of range contraction that becomes apparent only after geohistorical data are included (see text for case examples of seals and marine molluscs); (c) Ecological extinctions - examples of decimations (declines in population density) and functional shifts (e.g., shortened life spans, diminished body size) that become apparent once the fossil record is considered (see text for a case example of Crassostrea virginica in Chesapeake Bay, USA).
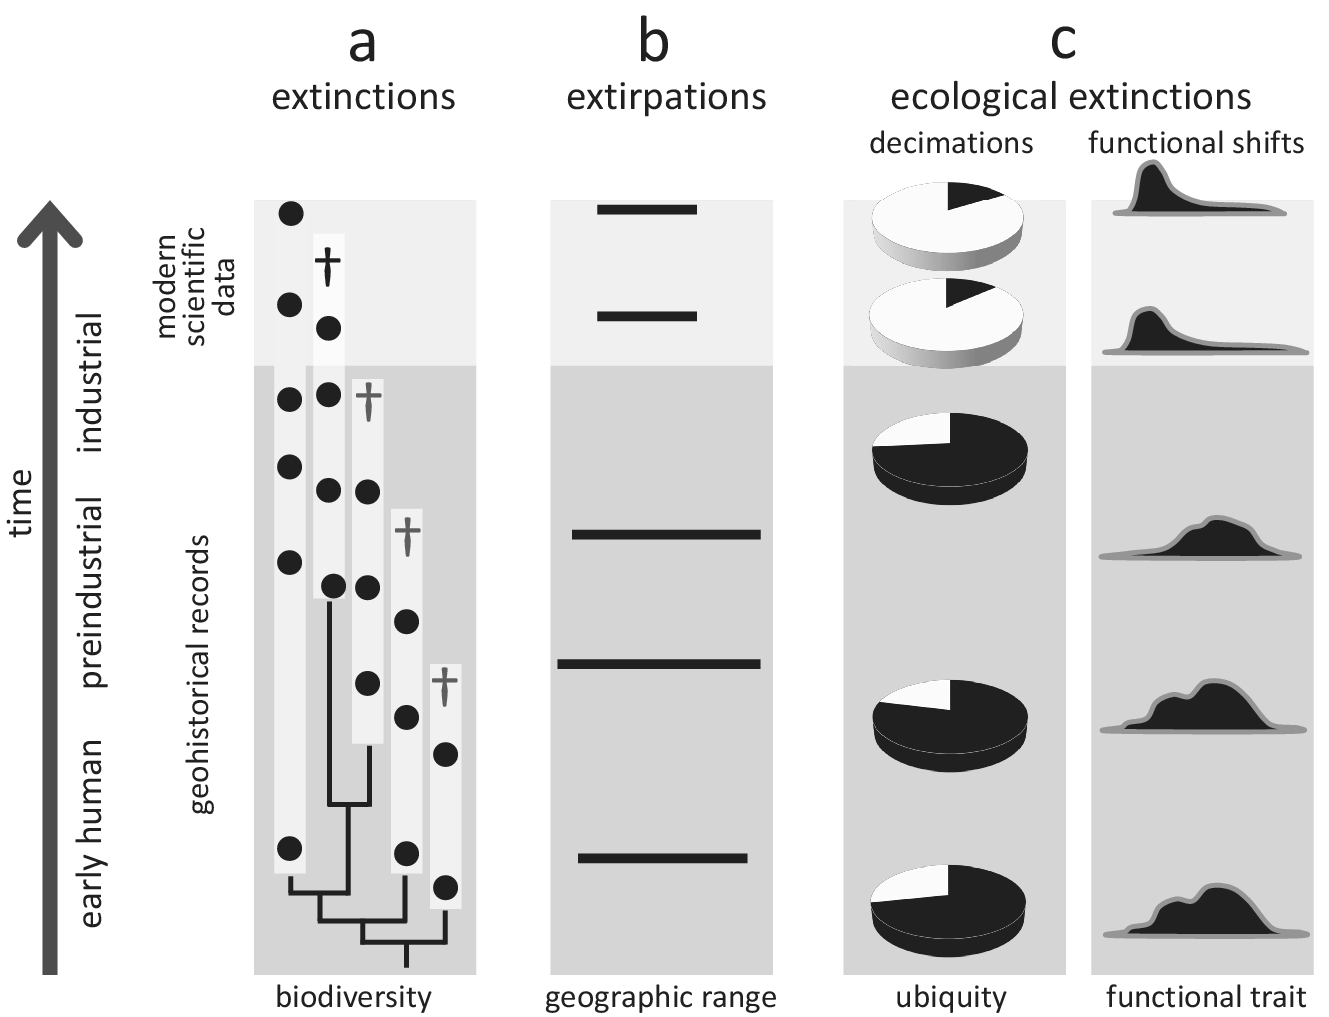
Similarly, archaeological and palaeontological data have proven useful in documenting past extirpation events and historical shifts in geographic ranges of marine taxa, providing evidence for the presence of aquatic species in regions from which they disappeared long before we started to collect modern scientific data (Figure 2b). For example, palaeobiological records from the Baltic Sea documented biogeographic shifts in several species of marine mammals during the Holocene (Sommer and Benecke, Reference Sommer and Benecke2003). One of these species, the harp seal (Pagophilus groenlandicus), has been extirpated twice from the area (at the end of the Middle Holocene and then again during the Medieval Warm Period), and, in both cases, human activities and climate changes may have been contributing factors (Glykou et al., Reference Glykou, Lougas, Piličiauskienė, Schmölcke, Eriksson and Lidén2021). These inferences were based on integrated analyses of zooarchaeological, palaeoecological, radiometric and geochemical data (Glykou et al., Reference Glykou, Lougas, Piličiauskienė, Schmölcke, Eriksson and Lidén2021). Similarly, radiocarbon-dated bones suggest that gentoo and chinstrap penguins expanded their breeding distribution southwards in the Antarctic peninsula within the past several decades (Emslie et al., Reference Emslie, Fraser, Smith and Walker1998). In contrast, the Adélie penguin has occupied the area for centuries, including many currently abandoned colonies. Still, the presence of this species may have been intermittent, possibly due to climatic fluctuations related to the Little Ice Age (Emslie et al., Reference Emslie, Fraser, Smith and Walker1998). The extirpation of Adélie penguin colonies and the expansion of gentoo and chinstrap penguins may have been related to rapid regional warming (Emslie et al., Reference Emslie, Fraser, Smith and Walker1998), likely linked to global climate changes. These types of historical records are even more readily available for marine invertebrates. For example, the analysis of mollusc shell assemblages from radiometrically dated sediment cores revealed that the commercially important oyster Ostrea edulis, which was once dominant along Scottish coasts, disappeared from the Firth of Forth in the nineteenth century due to bottom trawling (Thurstan et al., Reference Thurstan, Hawkins, Raby and Roberts2013). Those examples document extirpations that were likely linked to human activities, but many would have remained undetected without geohistorical data.
The historical perspective is particularly valuable in the case of ecological extinctions and resulting shifts in ecosystem functioning, which may be both pervasive and underreported in the marine realm (McCauley et al., Reference McCauley, Pinsky, Palumbi, Estes, Joyce and Warner2015). In such cases, geohistorical data can correct modern perceptions of changes in the distribution and functional role of species (Figure 2c) and facilitate identifying extinction threats. For example, palaeoecological, historical and modern survey data demonstrated that the decline of Caribbean acroporid corals began in the 1950s, two decades before the onset of systematic monitoring efforts in the region (Cramer et al., Reference Cramer, Jackson, Donovan, Greenstein, Korpanty, Cook and Pandolfi2020). Extensive U-Th dating indicated that acroporid corals from the Great Barrier Reef also had started declining before monitoring efforts were initiated (Clark et al., Reference Clark, Roff, Zhao, Feng, Done, McCook and Pandolfi2017). These efforts allowed for establishing more reliable baselines for future monitoring (Clark et al., Reference Clark, Roff, Zhao, Feng, Done, McCook and Pandolfi2017). Similarly, comparisons of modern and Pleistocene populations of the oyster Crassostrea virginica in Chesapeake Bay sampled from comparable environments revealed that this species could live much longer, grow to significantly larger sizes and achieve higher population densities than previously recognised based on monitoring surveys (Kusnerik et al., Reference Kusnerik, Lockwood, Grant, Tyler and Schneider2018; Lockwood and Mann, Reference Lockwood and Mann2019). Without considering the Pleistocene fossil record, the magnitude of recent changes in lifespan and population structure of this species, attributed to the preferential harvest of larger oysters and disease-related die-offs (Andrews, Reference Andrews1996; Lockwood and Mann, Reference Lockwood and Mann2019), would have been underestimated. These changes in the functional ecology of oyster reefs affected their filtering capacity, estimated to be an order of magnitude greater in the past (Lockwood and Mann, Reference Lockwood and Mann2019), and thus had a major impact on ecosystem services.
As discussed further below, archaeological data, palaeontological records and historical documents provide numerous examples of human-driven declines in species abundance or shifts in species functional traits. In many cases, decimations and functional losses took place or were initiated long before we started collecting rigorous scientific data (e.g., Jackson et al., Reference Jackson, Kirby, Berger, Bjorndal, Botsford, Bourque, Bradbury, Cooke, Erlandson, Estes and Hughes2001; Lotze et al., Reference Lotze, Lenihan, Bourque, Bradbury, Cooke, Kay, Kidwell, Kirby, Peterson and Jackson2006; Dulvy et al., Reference Dulvy, Pinnegar, Reynolds and Turvey2009).
Fidelity of geohistorical archives
The use of geohistorical archives to assess extinctions and extinction threats relies on the assumption that the subset of biota preserved in palaeontological, archaeological and other geohistorical records is an adequate and representative surrogate for all taxa. Numerous case studies and meta-analyses suggest that geohistorical archives provide meaningful estimates of key ecosystem properties, including diversity, community composition, relative abundances, food web structure or even spatial ecological gradients (e.g., Kidwell, Reference Kidwell2001, Reference Kidwell2007; Kidwell and Holland, Reference Kidwell and Holland2002; Tomašových and Kidwell, Reference Tomašových and Kidwell2009; Tyler and Kowalewski, Reference Tyler and Kowalewski2017, Reference Tyler and Kowalewski2023; Roopnarine and Dineen, Reference Roopnarine, Dineen, Tyler and Schneider2018; Hyman et al., Reference Hyman, Frazer, Jacoby, Frost and Kowalewski2019; Pruden et al., Reference Pruden, Dietl, Handley and Smith2021). In this context, it is useful to ask how accurately fossil archives would depict the conservation status of species included in the IUCN Red List database.
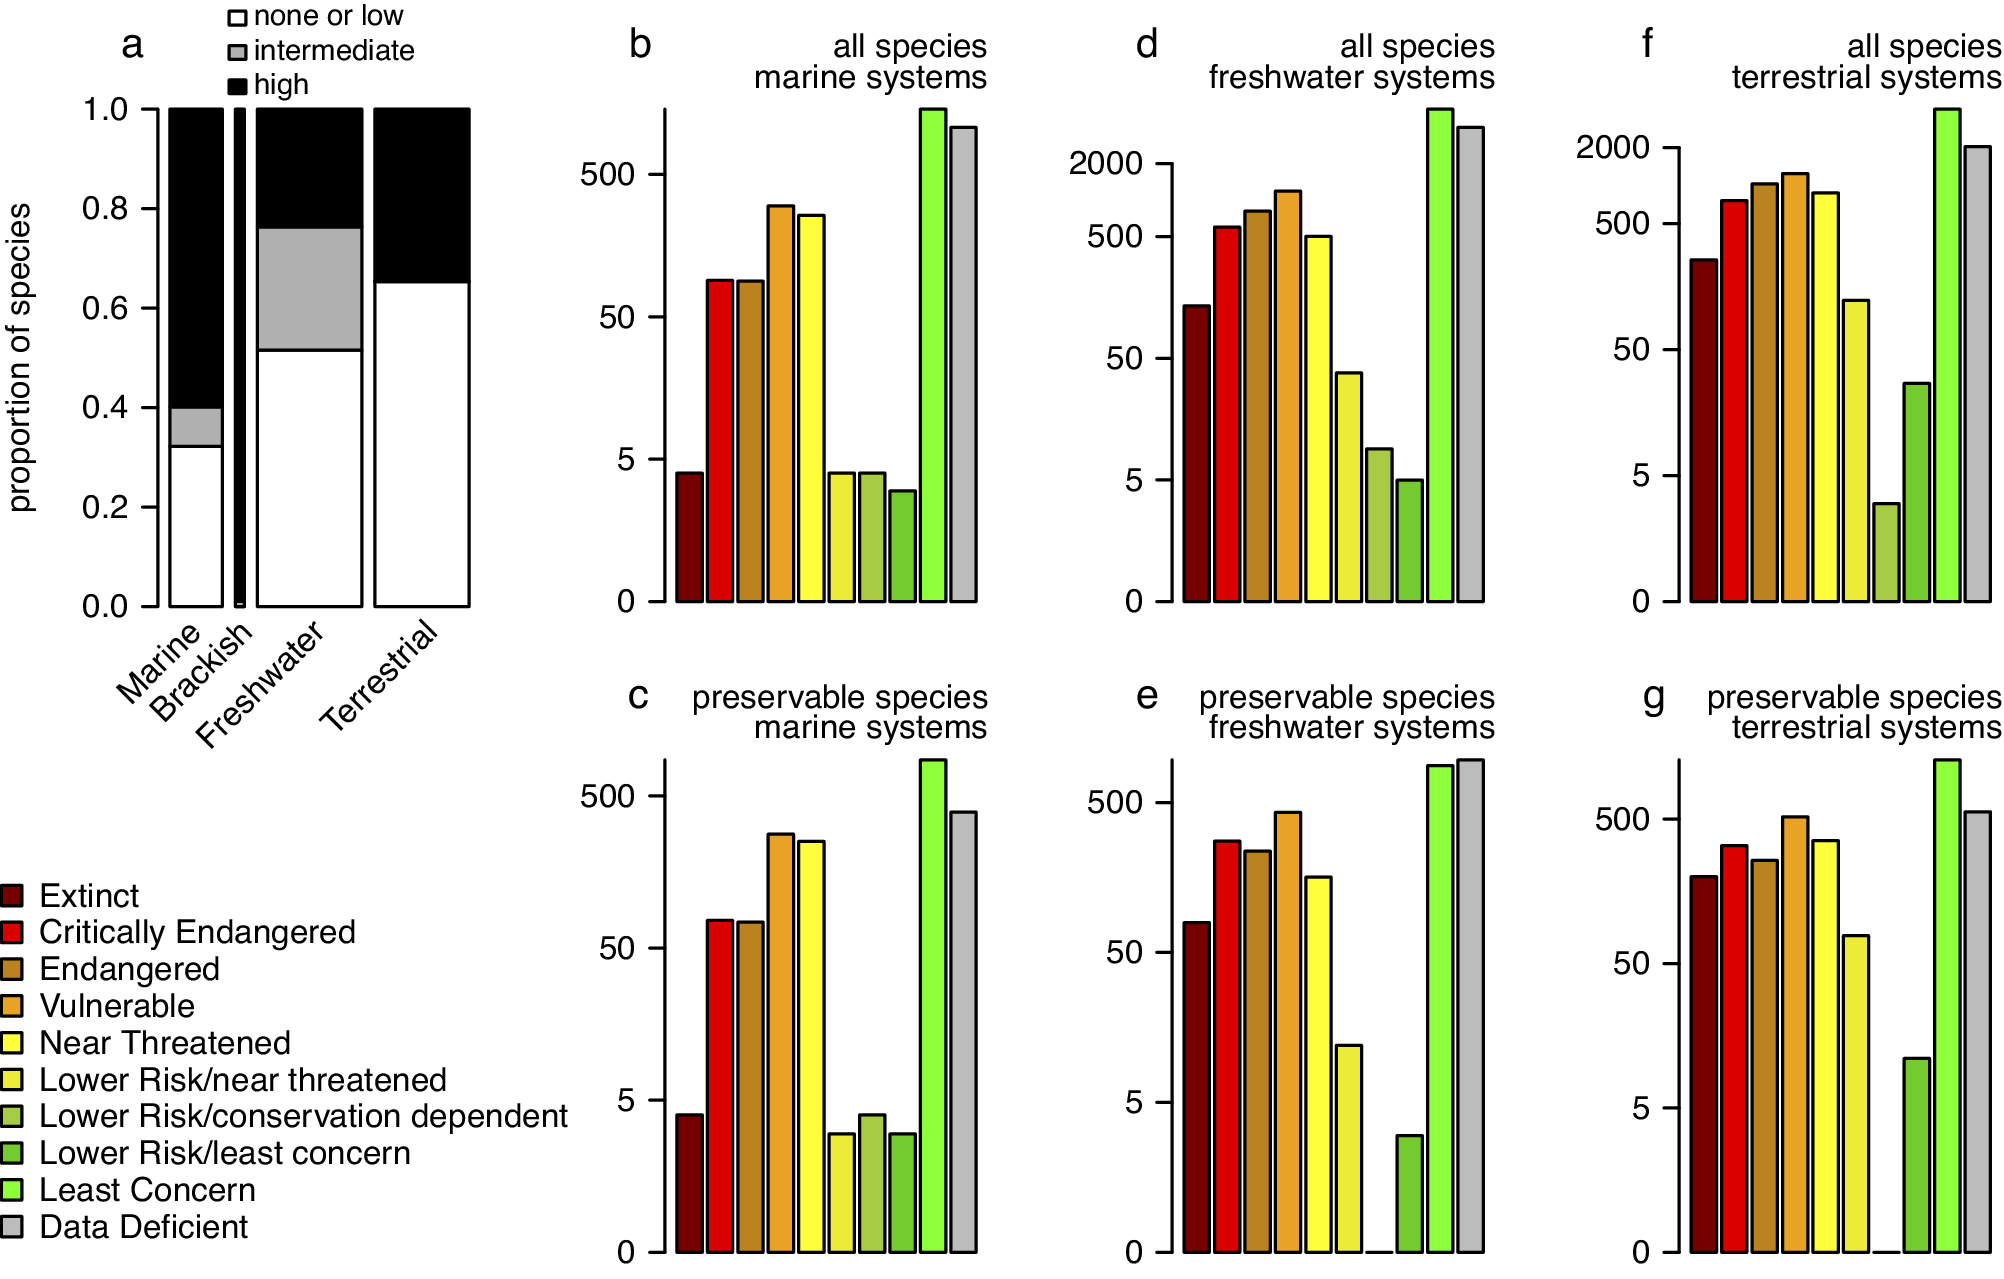
For the four major invertebrate taxa considered here (Figure 1), each species can be scored in terms of its fossilisation potential based on the presence and attributes of a preservable skeleton. Here, we classified all species (Supplementary Appendix 4) into three preservational categories: 0 – none or low (organisms with no biomineralised skeleton or with microscopic skeletal parts only), 1 – intermediate (organisms with weakly biomineralised skeletons or with multi-elemental skeleton prone to disarticulation), 2 – high (organisms with heavily biomineralised skeletons). The preservational potential categories were assigned at the “order” level, based on dominant skeletal type within a given group. Category 2 was used as “preservable taxa” in the analysis presented on Figure 3 (see Supplementary Material for additional details). These data can be used to evaluate if the current Red List assessment of all taxa is tracked adequately by the subset of taxa that could be recovered from the fossil record. We compared the distribution of species across the IUCN categories in the subset of taxa with a high fossilisation potential to the distribution based on the entire dataset (Figure 3). The analyses excluded brackish species because nearly all of them belong to the preservable category, and thus, the data subset is nearly identical to the entire dataset. For marine invertebrate species listed in the Red List, most species have a high potential of preservation (Figure 3a), which is not surprising given that most mollusc species and some arthropod and cnidarian groups have sturdy biomineralised skeletons and high fossilisation potential. Even for freshwater and terrestrial species, a substantial subset of taxa should be frequently preserved as fossils. Consequently, the preservable species are a robust predictor of all species when it comes to their conservation status, including marine (Figure 3b vs. 3e), freshwater (Figure 3c vs. 3f) and terrestrial (Figure 3d vs. 3g) systems. Note that the observed high fidelity is statistically inevitable: data subsets are expected to correlate with entire datasets unless a given subset is a very small portion of all data or represents a highly biased sample of that dataset. However, this is the gist of the argument: in most cases, a preservable subset of taxa is fractionally large enough and unbiased enough to be expected to represent a reasonable proxy of the whole.
(a) Proportions of taxa with none/low, intermediate, and high preservation potential grouped into marine, brackish, freshwater, and terrestrial systems with data restricted to four invertebrate phyla (arthropods, cnidarians, echinoderms, and molluscs). The bar width is scaled to the square root of the total numbers of species (the numbers reported on Figure 1a). (b–f) The barplots of all IUCN-assessed species (b, d, and f) compared to barplots of a subset of those species that belonged to orders categorised as ‘preservable’ (c, e, and g). (b-c) Marine systems. (d-e) Freshwater systems. (f-g) Terrestrial systems. Different colours represent different IUCN conservation status categories. Brackish systems were excluded because almost all brackish species assessed by IUCN are preservable so the two plots would be virtually identical. All data from the IUCN Red List Database were accessed on 2/20/2023 (IUCN, 2023a).
Whereas taxonomic fidelity of fossil archives is likely to be high, geohistorical samples tend to be affected by temporal mixing (time averaging; reviewed by Kidwell, Reference Kidwell2013; Kidwell and Tomašových, Reference Kidwell and Tomašových2013; Tomašových et al., Reference Tomašových, Dominici, Nawrot and Zuschin2023). As the rates with which skeletal remains are permanently buried is slow relative to the generation times of most organisms, remains of individuals that died at different times tend to accumulate on and within the seabed and can be mixed with older hardparts exhumed from deeper sediment layers by bioturbation or physical reworking. Due to time averaging, even the most finely resolved fossil samples may contain specimens that lived decades, centuries or even millennia apart, and the scale and structure of temporal mixing may vary across sediment layers, core segments or taxa (e.g., Kowalewski et al., Reference Kowalewski, Goodfriend and Flessa1998, Reference Kowalewski, Casebolt, Hua, Whitacre, Kaufman and Kosnik2018; Kosnik et al., Reference Kosnik, Hua, Kaufman and Wüst2009, Reference Kosnik, Hua, Kaufman and Zawadzki2015; Scarponi et al., Reference Scarponi, Kaufman, Amorosi and Kowalewski2013; Terry and Novak, Reference Terry and Novak2015; Nawrot et al., Reference Nawrot, Berensmeier, Gallmetzer, Haselmair, Tomašových and Zuschin2022). In addition to reducing temporal resolution, time averaging can produce spurious patterns in the fossil record by increasing sample-level diversity, decreasing compositional turnover between fossil assemblages and obscuring abrupt regime shifts (Kidwell and Tomašových, Reference Kidwell and Tomašových2013; Tomašových et al., Reference Tomašových, Albano, Fuksi, Gallmetzer, Haselmair, Kowalewski, Nawrot, Nerlović, Scarponi and Zuschin2020). Consequently, reconstructing historical patterns and processes can be challenging and often needs to be augmented by age dating of individual fossils so the data can be properly interpreted (Tomašových et al., Reference Tomašových, Dominici, Nawrot and Zuschin2023). This will be further illustrated by multiple case studies discussed below.
Another challenge involves estimating population density and biomass from fossil archives. The abundance of fossils is controlled not only by productivity but also by net accumulation rates, intensity of mixing processes and the resulting time averaging (Kidwell, Reference Kidwell1986). And whereas numerical estimates of population density are possible in certain cases (e.g., Kowalewski et al., Reference Kowalewski, Serrano, Flessa and Goodfriend2000; Tomašových et al., Reference Tomašových, Gallmetzer, Haselmair, Kaufman, Mavrič and Zuschin2019a), they usually require extensive age dating of individual specimens to “unmix” time-averaged assemblages, or samples from depositional settings characterised by exceptional temporal resolution (e.g., deep sea basins with high sedimentation rates). Similarly, translating skeletal estimates of body size into biomass can also be challenging because it is often difficult to establish a robust correlation between body size estimated from skeletal remains and the biomass of soft tissue (Powell and Stanton, Reference Powell and Stanton1985). Although such models have been developed for some groups, such as molluscs (e.g., Meadows, Reference Meadows2019) or fish (e.g., Granadeiro and Silva, Reference Granadeiro and Silva2000), they are frequently species-specific. Nevertheless, as illustrated in numerous examples below, these limitations can often be minimised, and robust numerical estimates can be derived from palaeontological and archaeological archives.
Finally, palaeontological archives available for sampling tend to be spatially and temporally discontinuous. However, the spatiotemporal coverage of those archives is still orders of magnitude better than the coverage provided by those few ecological monitoring time series that extend back in time for more than just the last few decades. For example, few rigorous quantitative surveys of marine habitats have been conducted in the nineteenth and early twentieth centuries, resulting in a very spotty spatial knowledge of those relatively recent ecosystems. We cannot retrospectively survey the mostly unstudied nineteenth-century ecosystems, but palaeontological and archaeological archives are still accessible to sampling for many of those ecosystems and can serve as surrogate proxies for monitoring data for many regions and time intervals.
Extinctions
Neontological knowledge of marine extinctions
The International Union for Conservation of Nature (IUCN) is a reference standard, with assessments completed for 150,300 species (IUCN, 2023b). In the IUCN Red List, less than 1% of surveyed species are considered extinct in the wild (1,245 of over 150,388 examined; IUCN, 2023c, accessed April 26, 2023). If we consider “possibly extinct” taxa in the Red List, the magnitude does not change substantially (<2%, IUCN, 2023c). As mentioned above (see also Figure 1), most of the extinct species represent terrestrial or freshwater taxa. For the marine and brackish realms, Red List reports only 20 extinct species (Table 1), including 15 vertebrates (9 birds, 4 mammals and 2 fish species), 1 species of algae and, at most (see Cowie et al., Reference Cowie, Bouchet and Fontaine2022), 4 invertebrates (all 4 representing intertidal or brackish gastropods). Of these 20 extinct species, the larger vertebrates – for example, the iconic Steller’s Sea Cow (Hydrodamalis gigas) – were rapidly driven to extinction due to overhunting during the colonial period (Estes et al., Reference Estes, Burdin and Doak2016). In contrast, the only plant classified as extinct (the alga Vanvoorstia bennettiana) went extinct due to land use and pollution (Woinarski et al., Reference Woinarski, Braby, Burbidge, Coates, Garnett, Fensham, Legge, McKenzie, Silcock and Murphy2019).
The list of marine species currently classified as ‘extinct’ according to the IUCN Red List (IUCN, 2023b)

a Lottia edmitchelli is currently recognised as the valid name for this limpet species.
Notably, the extinctions reported so far are restricted to species that lived in coastal or brackish settings, which is not surprising given that coastal zones are the most severely impacted part of the marine realm (Halpern et al., Reference Halpern, Walbridge, Selkoe, Kappel, Micheli, d’Agrosa, Bruno, Casey, Ebert, Fox and Fujita2008), are more easily accessible for inventory studies than offshore settings and have higher sampling coverage than continental margins or bathyal settings (O’Hara et al., Reference O’Hara, Williams, Althaus, Ross and Bax2020). But even in the case of coastal habitats, the human-driven extinctions primarily affected terrestrial dwellers of the coasts and islands, especially along the modern-time colonisation routes. For example, the ground doves from the Mascarene archipelago (the Dodo and its sister taxon, the Solitaire) were wiped out by European colonisers during the early modern time (e.g., Cheke, Reference Cheke, Ewen, Armstrong, Parker and Seddon2008; Cheke and Hume, Reference Cheke and Hume2008), but there are no records of any marine extinctions from the same region. This information is consistent with the notion that marine extinctions substantially lag terrestrial extinctions (Dulvy et al., Reference Dulvy, Pinnegar, Reynolds and Turvey2009; McCauley et al., Reference McCauley, Pinsky, Palumbi, Estes, Joyce and Warner2015). Alternatively, however, the lag may reflect the dearth of conservation assessments in the marine realm (Webb and Mindel, Reference Webb and Mindel2015). That is, we may have been much better at documenting the demise of ground doves and butterflies than sponges and snails.
Although the recent fossil record provides data on marine species that went extinct in the late Quaternary (e.g., the flightless marine duck Chendytes lawi from California; Jones et al., Reference Jones, Coltrain, Jacobs, Porcasi, Brewer, Buckner, Perrine and Codding2021 or shearwater species from the Canary Islands mention above), and thus co-existed with early human populations, the actual causes of the disappearance of those species may be difficult to discern, making the role of humans uncertain. These interpretative challenges potentially affect multiple species of marine invertebrates that went extinct in the late Quaternary, including, for example, the clam Coanicardita californica, the whelk Pusio fortis or the limpet Lottia edmitchelli (Harnik et al., Reference Harnik, Simpson and Payne2012; Cowie et al., Reference Cowie, Bouchet and Fontaine2022). In fact, Cowie et al. (Reference Cowie, Bouchet and Fontaine2022) argued that there is only one well-documented case of human-driven extinction in marine invertebrates (Lottia alveus).
Empty shells: A hidden record of Holocene extinctions?
Empty shells of molluscs have been an important source of biodiversity data, as they are routinely included in taxonomic studies and diversity surveys at local and regional scales (e.g., Mikkelsen and Bieler, Reference Mikkelsen, Bieler, Harper, Taylor and Crame2000; Bouchet et al., Reference Bouchet, Lozouet, Maestrati and Heros2002; Warwick and Light, Reference Warwick and Light2002; Bieler and Mikkelsen, Reference Bieler and Mikkelsen2004; Zuschin and Oliver, Reference Zuschin and Oliver2005). According to Mikkelsen (Reference Mikkelsen2011), the majority of new modern bivalve species named between 2000 and 2009 were described from empty shells. Moreover, a survey of shelled marine gastropod species reported in 2006 revealed that 80% of species descriptions were restricted to shell morphology (Bouchet and Strong, Reference Bouchet, Strong and Polaszek2010). Even when a region is studied over a longer time period, the significance of empty shells for estimating diversity remains impressively high. After 25 years of intensive exploration in New Caledonia, as many as 73% of 1,409 turrid gastropod species were only documented by empty shells, and 34% were known from a single specimen (Bouchet et al., Reference Bouchet, Lozouet and Sysoev2009).
Are all those species known only from empty shells still around? Or are all those species extinct or extirpated, and, if so, what were the causes of their demise and when exactly did they disappear? These alternative explanations are difficult to resolve because many of these species are extremely rare. Nevertheless, the possibility that at least some of the species known only from empty shells are now extinct, or at least locally extirpated, cannot be ruled out (see also Diamond, Reference Diamond1987), especially given that even well-preserved shells accumulating on the seafloor can be hundreds to thousands of years old (e.g., Flessa and Kowalewski, Reference Flessa and Kowalewski1994; Kidwell, Reference Kidwell1998; Dexter et al., Reference Dexter, Kaufman, Krause, Barbour Wood, Simões, Huntley, Yanes, Romanek and Kowalewski2014; Butler et al., Reference Butler, Fraser, Scourse, Richardson, Bryant and Heinemeier2020; Ritter et al., Reference Ritter, Erthal, Kosnik, Kowalewski, Coimbra, Caron and Kaufman2023; Tomašových et al., Reference Tomašových, Dominici, Nawrot and Zuschin2023). To our knowledge, the data on the “empty shell species” are not being systematically collected, and specimens representing those species have not been subject to radiocarbon dating, which could potentially provide useful chronological constraints for those taxa. Currently, it remains unclear whether the prevalence of “empty shell species” in mollusc biodiversity studies reflects a long tail of rare species or represents the yet unacknowledged record of hidden extinctions and extirpations.
Whereas new species descriptions and occurrence records based on “empty shells” are pervasive among molluscs, they are unlikely to occur among many other common groups with biomineralised skeletons. Many of those taxa, such as stony corals and echinoids, are much less diverse than molluscs, so it is less likely that echinoid tests or coral fragments encountered on modern seafloor may represent unknown species. Also, unlike molluscs, for which many species have been defined based on shell characters only, many other marine taxa require soft tissue analysis for species-level identification. This requirement makes it less likely that a new species could be erected based solely on skeletal remains or that they would be used in monitoring surveys to establish the presence of a species. In the case of corals, the further limitation stems from the fact that the diagnostic features of corallites degrade rapidly after death (Greenstein and Pandolfi, Reference Greenstein and Pandolfi1997).
However, molluscs may not be the only group affected by the “empty shells” syndrome. Some subsets of benthic foraminifera and brachiopod species were also identified from dead material only (Logan et al., Reference Logan, Tomasovych, Zuschin and Grill2008; Milker and Schmiedl, Reference Milker and Schmiedl2012). Murray (Reference Murray2007) estimated that dead-only species of benthic foraminifers may have represented ~5% out of the ~2,140 documented species. Moreover, even when the type material of many species is based on live-collected individuals, the present-day species-level distribution maps and estimates of geographic or bathymetric range sizes are frequently based on the combination of live-collected individuals and dead-collected skeletal remains, including surveys of molluscs (e.g., Dijkstra and Maestrati, Reference Dijkstra and Maestrati2010), brachiopods (e.g., Bitner and Logan, Reference Bitner and Logan2016) and bryozoans (e.g., Di Martino and Rosso, Reference Di Martino and Rosso2021). The use of dead individuals in recent surveys may overestimate the present-day geographic or bathymetric ranges of marine species and thus underestimate the frequency of extirpations or ecological extinctions.
Deep-time approaches
Although this review deals with near-time approaches that focus on the late Quaternary transition of the marine biosphere from pre-human to human times, the deep-time fossil record can also be useful in assessing or predicting modern extinctions and extinction threats. In the geological past, short periods of rapid global warming and acidification (103 year) are increasingly employed as ancient analogs of near-future outcomes (e.g., Kiessling et al., Reference Kiessling, Smith and Raja2023). The biological record of these deep-time events can inform us about the most widespread processes that may be driving extinctions during hyperthermal events (e.g., Benton, Reference Benton2018; Foster et al., Reference Foster, Hull, Lunt and Zachos2018). For example, assessing simulated impacts of global warming on marine invertebrates against empirical patterns recovered from the fossil record of several deep-time hyperthermal events suggests that ongoing warming has the potential to annihilate endemic taxa in cold-water habitats within a single century (Reddin et al., Reference Reddin, Aberhan, Raja and Kocsis2022).
Other deep-time approaches have focused on assessing extinction rates and extinction selectivity. In particular, the background extinction rates estimated from the fossil record have been used as a benchmark for assessing if recent species are disappearing at an abnormally high pace (e.g., Pimm et al., Reference Pimm, Russell, Gittleman and Brooks1995; Barnosky et al., Reference Barnosky, Matzke, Tomiya, Wogan, Swartz, Quental, Marshall, McGuire, Lindsey, Maguire and Mersey2011; Harnik et al., Reference Harnik, Simpson and Payne2012; Lamkin and Miller, Reference Lamkin and Miller2016; Cowie et al., Reference Cowie, Bouchet and Fontaine2002). In addition, the spatial and taxonomic selectivities of past extinctions have been used as predictors of extinction vulnerability for present-day species and habitats (e.g., Harnik, Reference Harnik2011; Harnik et al., Reference Harnik, Simpson and Payne2012; Finnegan et al., Reference Finnegan, Anderson, Harnik, Simpson, Tittensor, Byrnes, Finkel, Lindberg, Liow, Lockwood and Lotze2015; Collins et al., Reference Collins, Edie, Hunt, Roy and Jablonski2018). Finally, the deep fossil record has been used to test the predictive power of species-area relationships (SAR) models for estimating extinction rates due to habitat loss (see Preston, Reference Preston1962; Rybicki and Hanski, Reference Rybicki and Hanski2013). For example, in the Pliocene succession of San Joaquin (California), SAR model predictions for biodiversity shifts, expected due to sea-level changes, underestimated the species loss observed in the fossil record (Pruden and Leighton, Reference Pruden, Leighton, Tyler and Schneider2018).
Extirpations
A complete extirpation of a species from a given region is difficult to prove because once the species is rare, it would hardly be recorded anymore. A recent reassessment of the IUCN Red List indicated that overfishing drove over one-third of all sharks and rays towards global extinction (Dulvy et al., Reference Dulvy, Pacoureau, Rigby, Pollom, Jabado, Ebert, Finucci, Pollock, Cheok, Derrick and Herman2021), but while such commercial extinctions are well documented, the complete disappearance from a given region is rarely certain. For example, following the collapse of the once economically important angel shark Squatina squatina in the northern Adriatic Sea, the species was never caught in scientific surveys. However, fishermen reported that the species was still observed but rarely (Fortibuoni et al., Reference Fortibuoni, Borme, Franceschini, Giovanardi and Raicevich2016). Although geohistorical data cannot assist with those challenges, they can be invaluable by identifying extirpation events that occurred before systematic bio-inventorying efforts started.
Unknown or poorly known extirpation events can be detected using data derived from archaeological middens, the late Quaternary fossil record or ancient DNA. These methods can be particularly effective when used jointly. For example, archaeological and ancient DNA data demonstrated that both right and grey whales occurred in the Strait of Gibraltar region during the Roman period and that grey whales still occurred along the Asturian coast during pre-Roman times (Rodrigues et al., Reference Rodrigues, Charpentier, Bernal-Casasola, Gardeisen, Nores, Pis Millán, McGrath and Speller2018). These data document extirpation events that would remain unknown if our knowledge were to be derived from neontological data alone.
Geohistorical data can also aid in assessing the potential role of humans in driving extirpation events. For example, combined use of ancient DNA and radiocarbon dating revealed that the genetic diversity of Atlantic grey whale, restricted today to the North Pacific, declined gradually in the mid-Holocene long before the onset of intensive commercial whaling, indicating that this extirpation event was likely precipitated by Holocene climate changes or other ecological causes (Alter et al., Reference Alter, Meyer, Post, Czechowski, Gravlund, Gaines, Rosenbaum, Kaschner, Turvey, van der Plicht and Shapiro2015). This is in contrast to the case of right whales, which were the main whaling target in the North Atlantic until becoming commercially extinct in the mid-eighteenth century (Rodrigues et al., Reference Rodrigues, Charpentier, Bernal-Casasola, Gardeisen, Nores, Pis Millán, McGrath and Speller2018).
The disappearance of less charismatic animals widely preserved in the fossil and archaeological record can be readily documented by geohistorical data (e.g., benthic mollusc shells, fish otoliths and bones). For example, data derived from historical records, archaeological middens, death assemblages (i.e., surface accumulations of skeletal remains) and radiometrically dated sediment cores demonstrate that oyster reefs underwent extirpation in the late nineteenth and twentieth centuries in many temperate regions, including the coast of Victoria, Australia (Ford and Hamer, Reference Ford and Hamer2016), Tasmania (Edgar and Samson, Reference Edgar and Samson2004), eastern Scotland (Thurstan et al., Reference Thurstan, Hawkins, Raby and Roberts2013) and the northeastern Adriatic Sea (Gallmetzer et al., Reference Gallmetzer, Haselmair, Tomašových, Mautner, Schnedl, Cassin, Zonta and Zuschin2019). Similarly, an analysis of death assemblages revealed that epifaunal suspension feeders (scallops, brachiopods) were abundant on the southern California mainland shelf during the late Holocene (with standing density of at least 20 individuals/m2) but were subsequently extirpated (except for shelf-edge relic populations), most likely, due to the nineteenth-century increase in sedimentation and turbidity induced by agricultural land use (Tomašových and Kidwell, Reference Tomašových and Kidwell2017).
Geohistorical insights not only can help us to detect extirpation events but can also be used to reconstruct shifts in functional traits and life history characteristics of species with rapidly declining populations, thus providing baseline data needed to improve the management of such species during restoration efforts. For example, sclerochronological analyses of prehistoric otoliths revealed major changes in growth rate and maturation time of an endangered marine fish Totoaba macdonaldi, endemic to the Gulf of California, caused by upstream diversions of the Colorado River flow (Rowell et al., Reference Rowell, Flessa, Dettman, Román, Gerber and Findley2008), illustrating the value of such historical approaches for revising our understanding of the ecology of endangered species now only represented by remnant populations.
On occasions, especially when aided by geochronological age dating, geohistorical data can refute human-induced stressors as a cause of extirpation. For example, age dating of valves of the semelid deposit-feeder bivalve Ervilia purpurea in the Persian Gulf implied a boom-and-bust population dynamics, suggesting that its current absence in the living assemblage of the region is unlikely to be linked to the onset of oil platform production in the twentieth century (Albano et al., Reference Albano, Filippova, Steger, Kaufman, Tomašových, Stachowitsch and Zuschin2016).
In summary, a growing body of literature demonstrates that conservation palaeobiology approaches not only allow us to detect unknown extirpation events and provide information for species and ecosystem management but also make it possible to assess the role that human activities may have played in driving those events.
Ecological extinctions
Decimations
In contrast to extinctions or extirpations that are difficult to detect conclusively, geohistorical archives provide direct records of local or regional population size trajectories of formerly abundant species that became decimated. And given that the late Quaternary fossil record of marine environments is globally widespread and well-resolved stratigraphically, it can provide an impressive spatiotemporal coverage of formerly abundant organisms that started to decline decades, centuries or even millennia before rigorous bio-inventorying efforts ensued.
For example, sedimentary cores collected across multiple regions of the northern Adriatic Sea documented that over the past two centuries, multiple, formerly abundant suspension-feeding or herbivorous molluscs declined in abundance due to trawling, pollution and eutrophication (Gallmetzer et al., Reference Gallmetzer, Haselmair, Tomašových, Mautner, Schnedl, Cassin, Zonta and Zuschin2019; Tomašových et al., Reference Tomašových, Gallmetzer, Haselmair, Kaufman, Mavrič and Zuschin2019a, Reference Tomašových, Albano, Fuksi, Gallmetzer, Haselmair, Kowalewski, Nawrot, Nerlović, Scarponi and Zuschin2020). In fact, a regional shell bed, formed by shells of mollusc species that were decimated during the nineteenth and early twentieth century, is still present just below the seafloor across large portions of the NE Adriatic shelf (Gallmetzer et al., Reference Gallmetzer, Haselmair, Tomašových, Mautner, Schnedl, Cassin, Zonta and Zuschin2019; Tomašových et al., Reference Tomašových, Gallmetzer, Haselmair, Kaufman, Mavrič and Zuschin2019a). This is a forceful testament to a highly diverse regional benthic ecosystem that perished before we started assembling a rigorous scientific knowledge of the region’s seafloor. These major regional changes to benthic ecosystems could not have been detected based on biomonitoring surveys, which only started in the twentieth century.
In many cases, geohistorical studies not only document species declines that predate modern biomonitoring efforts but can provide estimates of the natural range of variability, which can then be used to gauge the significance of human-induced decimations. For example, the decline in the diversity and percent cover of reef corals induced by pollution, heat stress, overfishing and acidification are well documented (Jackson et al., Reference Jackson, Kirby, Berger, Bjorndal, Botsford, Bourque, Bradbury, Cooke, Erlandson, Estes and Hughes2001; Pandolfi et al., Reference Pandolfi, Bradbury, Sala, Hughes, Bjorndal, Cooke, McArdle, McClenachan, Newman, Paredes and Warner2003; Aronson and Precht, Reference Aronson and Precht2006; Precht et al., Reference Precht, Aronson, Gardner, Gill, Hawkins, Hernández-Delgado, Jaap, McClanahan, McField, Murdoch and Nugues2020). But how do they compare to natural variability in coral cover? After all, Holocene-scale studies document significant declines in abundance and carbonate production of corals over the past millennia that were unrelated to anthropogenic impacts and driven by climatic and sea-level fluctuations (Perry and Smithers, Reference Perry and Smithers2010; Toth et al., Reference Toth, Aronson, Vollmer, Hobbs, Urrego, Cheng, Enochs, Combosch, Van Woesik and Macintyre2012, Reference Toth, Kuffner, Stathakopoulos and Shinn2018; Yan et al., Reference Yan, Zhao, Lau, Roff, Leonard, Clark, Nguyen, Feng, Wei, Deng and Chen2019; Leonard et al., Reference Leonard, Lepore, Zhao, Rodriguez‐Ramirez, Butler, Clark, Roff, McCook, Nguyen, Feng and Pandolfi2020). These natural changes can serve as a benchmark to demonstrate that the magnitude and extent of losses of coral habitats and their diversity driven by human activities do typically exceed the natural range of variability (Pandolfi and Jackson, Reference Pandolfi and Jackson2006; Cybulski et al., Reference Cybulski, Husa, Duprey, Mamo, Tsang, Yasuhara, Xie, Qiu, Yokoyama and Baker2020; O’Dea et al., Reference O’Dea, Lepore, Altieri, Chan, Morales-Saldaña, Muñoz, Pandolfi, Toscano, Zhao and Dillon2020; see also Cramer et al., Reference Cramer, O’Dea, Clark, Zhao and Norris2017, Muraoka et al., Reference Muraoka, Cramer, O’Dea, Zhao, Leonard and Norris2022). Similarly, sedimentary cores from the coastal Adriatic habitats indicated that shifts in mollusc communities during the ice ages over the last 125,000 years were much less dramatic than changes in relative species abundance that took place in the last centuries (Kowalewski et al., Reference Kowalewski, Wittmer, Dexter, Amorosi and Scarponi2015). These data also demonstrated that those mollusc communities were spectacularly resilient to major climate and sea-level changes in the late Quaternary (Kowalewski et al. Reference Kowalewski, Wittmer, Dexter, Amorosi and Scarponi2015; Scarponi et al., Reference Scarponi, Nawrot, Azzarone, Pellegrini, Gamberi, Trincardi and Kowalewski2022) but not to late Holocene human impacts (Scarponi et al., Reference Scarponi, Rojas, Nawrot, Cheli and Kowalewski2023). These examples highlight the unique value of geohistorical estimates in assessing if a given human-induced ecosystem shift is a truly significant event or falls within the natural range of long-term ecosystem variability.
Even for species with low preservation potential, long-term population dynamics can often be inferred from indirect proxies, especially if such species modify their environment in a way that leaves strong signatures in the sedimentary record. For example, geochemical biomarkers such as sterols and stable nitrogen isotopes (δ15N) derived from bird guano and preserved in coastal pond sediments can be used to track shifts in colony size of nesting seabirds and seaducks (e.g., Hargan et al., Reference Hargan, Gilchrist, Clyde, Iverson, Forbes, Kimpe, Mallory, Michelutti, Smol and Blais2019; Duda et al., Reference Duda, Robertson, Lim, Kissinger, Eickmeyer, Grooms, Kimpe, Montevecchi, Michelutti, Blais and Smol2020). By applying this approach to dated lake sediment cores, Duda et al. (Reference Duda, Robertson, Lim, Kissinger, Eickmeyer, Grooms, Kimpe, Montevecchi, Michelutti, Blais and Smol2020) demonstrated that the world’s largest colony of a threatened Leach’s Storm-petrel (Hydrobates leucorhous; Baccalieu Island, Canada) was smaller than today and fluctuated in size for most of its 1,700-year history, putting recent declines observed since the 1980s in a broader historical context. Lake sediment records of nitrogen isotopes and other geochemical proxies have also been used to reconstruct centennial-scale changes in population size of anadromous fish such as sockeye salmon (Oncorhynchus nerka) and link those changes to climate and fishing pressures (Finney et al., Reference Finney, Gregory-Eaves, Sweetman, Douglas and Smol2000).
Relative estimates of decimations
It is instructive to examine specific strategies used to quantify decimations and identify ecological extinctions. In general, geohistorical studies compare living communities with either surficial death assemblages or Holocene records from cores and outcrops (e.g., Kidwell, Reference Kidwell2007; Kowalewski et al., Reference Kowalewski, Wittmer, Dexter, Amorosi and Scarponi2015; Albano et al., Reference Albano, Filippova, Steger, Kaufman, Tomašových, Stachowitsch and Zuschin2016; Hyman et al., Reference Hyman, Frazer, Jacoby, Frost and Kowalewski2019; Sander et al., Reference Sander, Hass, Michaelis, Groß, Hausen and Pogoda2021). These efforts are often supplemented with radiometric dating, stable isotope analyses or ancient DNA sampling (e.g., Kowalewski et al., Reference Kowalewski, Serrano, Flessa and Goodfriend2000; Sivan et al., Reference Scarponi, Nawrot, Azzarone, Pellegrini, Gamberi, Trincardi and Kowalewski2006; Tomašových et al., Reference Tomašových, Gallmetzer, Haselmair, Kaufman, Mavrič and Zuschin2019a; Dillon et al., Reference Dillon, McCauley, Morales-Saldaña, Leonard, Zhao and O’Dea2021). In addition, some studies also combine fossil and archaeological records to detect formerly abundant or habitat-forming species known to be rare or absent today (Rick et al., Reference Rick, Reeder-Myers, Hofman, Breitburg, Lockwood, Henkes, Kellogg, Lowery, Luckenbach, Mann and Ogburn2016; Fariñas-Franco et al., Reference Fariñas-Franco, Pearce, Mair, Harries, MacPherson, Porter, Reimer and Sanderson2018).
When using geohistorical records, decimations can be inferred indirectly by measuring the decline in the relative abundance of a species in a series of palaeontological samples (Figure 2c). This approach is straightforward to implement in practice and can show that a given taxon declined in ecological importance relative to other taxa but does not provide numerical estimates of pre-impact population size or average density – information that may be crucial for guiding restoration efforts.
Despite those limitations, changes in relative abundance among preservable marine taxa not only provide records of ecological extinctions predating modern bio-inventorying but can also potentially reveal selective decimations that preferentially affected certain functional groups and shifted communities into new functional states (Kidwell, Reference Kidwell2008; Steger et al., Reference Steger, Bošnjak, Belmaker, Galil, Zuschin and Albano2021). For example, the youngest stratigraphic record indicates that, during the last two centuries, the species sensitive to pollution or hypoxia (including foraminifera, ostracods, molluscs and corals) declined in abundance and geographic extent, while those that were tolerant to various stresses concurrently increased in dominance (Gooday et al., Reference Gooday, Jorissen, Levin, Middelburg, Naqvi, Rabalais, Scranton and Zhang2009). These patterns were observed in many regions of the world, primarily based on data from sediment cores collected in river-dominated coastal environments. The non-exhaustive examples include hypoxia-related changes in (1) benthic foraminifera from the Louisiana shelf (Blackwelder et al., Reference Blackwelder, Hood, Alvarez-Zarikian, Nelsen and McKee1996; Osterman et al., Reference Osterman, Poore, Swarzenski and Turner2005; Platon et al., Reference Platon, Gupta, Rabalais and Turner2005), the North Sea (Polovodova et al., Reference Polovodova, Nordberg and Filipsson2011; Dolven et al., Reference Dolven, Alve, Rygg and Magnusson2013; Nordberg et al., Reference Nordberg, Asteman, Gallagher and Robijn2017), the Tagus Delta (Bartels-Jónsdóttir, Reference Bartels-Jónsdóttir2006) and the Gulf of St. Lawrence (Thibodeau et al., Reference Thibodeau, de Vernal and Mucci2006; Genovesi et al., Reference Genovesi, De Vernal, Thibodeau, Hillaire-Marcel, Mucci and Gilbert2011); (2) ostracods from the Chesapeake Bay (Cronin and Vann, Reference Cronin and Vann2003); (3) molluscs from the Gulf of Trieste (Tomašových et al., Reference Tomašových, Albano, Fuksi, Gallmetzer, Haselmair, Kowalewski, Nawrot, Nerlović, Scarponi and Zuschin2020); and (4) corals from China’s Greater Bay Area (Cybulski et al., Reference Cybulski, Husa, Duprey, Mamo, Tsang, Yasuhara, Xie, Qiu, Yokoyama and Baker2020). Whereas many of these habitats were also exposed to eutrophication or oxygen depletion due to natural climatic variability over the past millennia, the magnitude of the resulting ecosystem changes was typically much less pronounced when compared to changes induced by recent anthropogenic impacts (Cooper and Brush, Reference Cooper and Brush1993; Osterman et al., Reference Osterman, Poore, Swarzenski, Senn and DiMarco2009; Li et al., Reference Li, Bianchi, Yang, Osterman, Allison, DiMarco and Yang2011).
Numerical estimates of decimations
In contrast to relative assessment, numerical estimates of decimation provide direct estimates of the decline in abundance, often estimated comparatively as changes in the population density (number of specimens per unit of area) or other units that can be simultaneously measured for modern and fossil taxa. Such numerical estimates are much more informative than relative assessments but are much more challenging to derive and require multiple assumptions that can be partly constrained by age dating and by other methods (species lifespan estimates, rates of disintegration of skeletal remains in the surface layer, and net sediment accumulation rate; Tomašových et al., Reference Tomašových, Dominici, Nawrot and Zuschin2023). Nevertheless, multiple examples of numerical assessments have been published over the last two decades, demonstrating that these strategies are feasible and can provide quantitative estimates of changes in marine populations. These strategies tend to be idiosyncratic, being tailored to unique aspects of each case study. And even though those estimates tend to be approximate, they allow us to detect major ecosystem changes. Moreover, in cases of major shifts in species abundance, often by multiple orders of magnitude, the somewhat elevated imprecision of numerical estimates derived from geohistorical archives is typically inconsequential. It is also noteworthy that numerical estimates are typically derived in a maximally conservative manner (e.g., Kowalewski et al., Reference Kowalewski, Serrano, Flessa and Goodfriend2000).
One of the earliest direct estimates was derived for benthic ecosystems of the Colorado River delta, which was drastically altered due to the construction of numerous dams in the upstream parts of the river (Fradkin, Reference Fradkin1996). A combination of field surveys, field sampling, numerical dating and oxygen isotope analyses of shell material provided a strategy for estimating the past population density of benthic molluscs (Kowalewski et al., Reference Kowalewski, Serrano, Flessa and Goodfriend2000). Using the maximally conservative estimates that yielded minimised estimates of past population density, geohistorical data suggested that during the last millennium, the intertidal population density averaged at least 50 adult molluscs m−2. In contrast, the surveys of the modern intertidal zone yielded an estimate of 3 molluscs m−2, suggesting an almost 20-fold decline in mollusc abundance. These data also indicated that restoration efforts did not bring the local benthic productivity back to its pre-industrial levels. Subsequent conservation palaeobiology studies in the delta area also demonstrated that geohistorical approaches can be used to estimate how the shutdown of the river affected water flow (Dettman et al., Reference Dettman, Flessa, Roopnarine, Schöne and Goodwin2004), life history of aquatic organisms (Rowell et al., Reference Rowell, Flessa, Dettman, Román, Gerber and Findley2008), predation processes (Cintra-Buenrostro et al., Reference Cintra-Buenrostro, Flessa and Guillermo2005) and net carbon emission (Smith et al., Reference Smith, Auerbach, Flessa, Flecker and Dietl2016).
Similarly, Lockwood and Mann (Reference Lockwood and Mann2019) compared the density of living oyster populations from the Chesapeake Bay to fossil populations of the Pleistocene age. However, due to time averaging, live and fossil populations were not directly comparable because Pleistocene shells of oysters occurring together in situ likely record a mix of multiple generations, thus providing misleadingly high estimates of standing population density. Because dating methods available for Pleistocene deposits do not offer a sufficient resolution to correct for time averaging, dead–live ratios in modern oyster reefs were used to derive adjusted (and highly conservative) estimates of Pleistocene population densities. The resulting density estimates for live oysters in the Pleistocene record were an order of magnitude higher than those obtained for modern oyster populations from the same area. The Pleistocene estimates also notably exceeded the threshold density of 50 oysters m−2 used in Chesapeake Bay as a benchmark for a fully recovered oyster population.
Age dating of skeletal remains provides key information on parameters needed to reconstruct population density because age-frequency distributions are informative about disintegration rates, net sediment accumulation rates and time averaging. For example, Tomašových et al. (Reference Tomašových, Gallmetzer, Haselmair, Kaufman, Vidović and Zuschin2017) investigated whether high densities of the opportunistic, hypoxia-tolerant bivalve Varicorbula gibba – induced by eutrophication in the northern Adriatic Sea during the late twentieth century – were novel or had analogs over the past 500 years. Taking into account the disintegration rate of bivalve remains and net sediment accumulation rate (estimated on the basis of age model), assuming a maximum lifespan equal to 5 yr. in a core with cross-sectional area of 0.04 m2, they estimated that maxima in abundances of this species correspond to a standing density of 1,250–1,500 individuals/m2, a density similar to times of V. gibba outbreaks observed today. In contrast, radiometric age dating revealed that one of the major contributors to carbonate sands in the northern Adriatic Sea, the bivalve Gouldia minima, which was abundant in the last few thousand years, declined to almost zero abundance over the past two centuries due to the anthropogenically driven loss of algal and seagrass meadows (Tomašových et al., Reference Tomašových, Gallmetzer, Haselmair, Kaufman, Mavrič and Zuschin2019a). A similar approach used to infer past population densities also detected unusually high densities of the deposit-feeding bivalve Nuculana taphria on the southern California shelf during the Holocene, followed by a two-order-of-magnitude decline in its abundance during the twentieth century (Tomašových et al., Reference Tomašových, Kidwell, Alexander and Kaufman2019b).
A different approach relies on using accumulation rates of skeletal elements, estimated based on core age models, as a proxy for species abundance. For example, Dillon et al. (Reference Dillon, McCauley, Morales-Saldaña, Leonard, Zhao and O’Dea2021) compared shark denticle assemblages from a mid-Holocene Caribbean reef with those found in modern death assemblages. In this case, Uranium-Thorium and calibrated radiocarbon dating of coral pieces were used to estimate the time encompassed by the sediment samples and calculate reef accretion rates. The denticle accumulation rates standardised for reef accretion rates suggested that sharks were over three times more numerous before humans began using marine resources in Caribbean Panama. Similar strategy was used to document historical declines in sea urchin (Cramer et al., Reference Cramer, O’Dea, Clark, Zhao and Norris2017) and parrotfish populations (Muraoka et al., Reference Muraoka, Cramer, O’Dea, Zhao, Leonard and Norris2022) on Caribbean coral reefs, as well as long-term fluctuations in pelagic fish populations based on scale and otolith deposition rates (e.g., Field et al., Reference Field, Baumgartner, Ferreira, Gutierrez, Lozano-Montes, Salvatteci, Soutar, Checkley, Oozeki and Roy2009; Finney et al., Reference Finney, Alheit, Emeis, Field, Gutiérrez and Struck2010; Jones and Checkley, Reference Jones and Checkley2019).
In addition to direct numerical estimates, the magnitude and timing of population decline in the past can be estimated using numerical age dating. For example, dating revealed that the bivalve Glycymeris nummaria appeared in the Eastern Mediterranean in large numbers 5,000–5,500 years ago and almost ceased to exist 1,500–1,000 years ago, probably due to the ongoing impoverishment of nutrient flux and reduction in marine productivity when the sea level rise in the late Holocene slowed down and reached modern levels (Sivan et al., Reference Scarponi, Nawrot, Azzarone, Pellegrini, Gamberi, Trincardi and Kowalewski2006).
The above examples suggest that numerical estimates of decimations as well as the timing of proliferation and decimation events can be estimated from geohistorical records, given assumptions about lifespan, disintegration of skeletal remains and net sediment accumulation rate. These declines can assist us in identifying extinction threats that have deep historical roots.
Shift in functional traits
A decline in ecosystem services provided by a species can occur not only due to decimation but also because of shifts in its functional traits (Figure 2c). The most common functional losses involve demographic changes, which can result in the loss of large-size classes and older or more reproductively active age cohorts. Although such changes are rarely invoked in the context of ecological extinctions, in size-structured populations, different life stages or age classes can interact with different subsets of species in a community and play different ecological roles, and thus, their selective removal may lead to functional loss (Ebenmman et al., Reference Ebenman, Säterberg, Sellman, Moore, De Ruiter, McCann and Wolters2017). For instance, experimental evidence suggests that deep-burrowing adult stages of large, long-lived bivalves provide key ecosystem functions in soft-sediment habitats but take years to recover following local disturbances such as seasonal hypoxia (Norkko et al., Reference Norkko, Villnäs, Norkko, Valanko and Pilditch2013). Decrease in body size and other life-history changes induced by fishing may shift the ecological niches and functional roles of harvested species, destabilising food webs and potentially triggering trophic cascades (Hočevar and Kuparinen, Reference Hočevar and Kuparinen2021).
Life-history changes can be inferred using geohistorical approaches by surveying size frequency distributions of fossil populations and by examining growth rates and longevity, which can be assessed using sclerochronological approaches (e.g., Goodwin et al., Reference Goodwin, Flessa, Schone and Dettman2001; Rowell et al., Reference Rowell, Flessa, Dettman, Román, Gerber and Findley2008; Lockwood and Mann, Reference Lockwood and Mann2019). In addition, the fossil and archaeological records provide numerous examples of studies documenting major shifts in functional traits that could be linked to human activities, especially selective harvesting (e.g., Limburg et al., Reference Limburg, Walther, Hong, Olson and Storå2008; O’Dea et al., Reference O’Dea, Shaffer, Doughty, Wake and Rodriguez2014; Rick et al., Reference Rick, Reeder-Myers, Hofman, Breitburg, Lockwood, Henkes, Kellogg, Lowery, Luckenbach, Mann and Ogburn2016; Ruga et al., Reference Ruga, Meyer and Huntley2019; Assumpção et al., Reference Assumpção, Caron, Erthal, Barboza, Pinotti and Ritter2022; reviewed by Sullivan et al., Reference Sullivan, Bird and Perry2017). Whereas in many cases human activities resulted in shorter lifespans and slower growth rates of marine organisms, this was not always the case. For example, archaeological data suggest that the construction of clam gardens (intertidal rock-walled terraces) by indigenous people resulted in the increased growth rates and size at the time of death of maricultured clams (e.g., Toniello et al., Reference Toniello, Lepofsky, Lertzman-Lepofsky, Salomon and Rowell2019).
The Chesapeake oyster study mentioned above (Lockwood and Mann, Reference Lockwood and Mann2019) provides a forceful case example in which the Pleistocene fossil record was used to show that populations of oysters in the past included a higher proportion of large individuals, with the largest size classes notably exceeding the largest live oysters observed today. Integration of data on population density and demography of Pleistocene oysters suggested that filtration rates for those populations were an order of magnitude higher than those estimated for modern populations (Lockwood and Mann, Reference Lockwood and Mann2019), thus providing direct estimates of the decline in ecosystem services due to shifts in functional traits.
Concluding remarks
The review of the marine conservation palaeobiology literature demonstrates the potential of geohistorical approaches for assessing recent extinctions and extinction threats while also highlighting the strengths and limitations of those approaches.
Firstly, the existing literature demonstrates that, despite spatial and temporal gaps, geohistorical archives provide a comprehensive spatial and environmental coverage of marine systems at coarser observational scales. That is, the palaeontological and archaeological samples can be acquired for many regions and habitats of the world. This is particularly valuable in those areas that either lack any past ecological surveys or have been surveyed only in the last few decades. In all such regions, skeletal remains are likely to exist on the seafloor and should allow for bio-inventorying of taxa that were common in the area in the last centuries or millennia.
Secondly, the conservation palaeobiology studies demonstrate that geohistorical approaches are applicable to many groups of organisms, including molluscs, corals, ostracods, foraminifera, fish and marine mammals, to list just a few examples. Moreover, they represent a substantial fraction of all taxa and often can serve as surrogate proxies for the entire communities to which they belong (e.g., Tyler and Kowalewski, Reference Tyler and Kowalewski2017, Reference Tyler and Kowalewski2023; Kokesh et al., Reference Kokesh, Kidwell and Walther2022; and references therein). This is important because taxa with an excellent fossil record, such as molluscs, may help elucidate biodiversity dynamics in marine ecosystems during and before the early modern times. And whereas the biodiversity losses following human migrations are well documented for conspicuous, iconic taxa (e.g., megafaunal extinctions in North America; Meltzer, Reference Meltzer2020), a more comprehensive understanding that encompasses all taxa remains elusive (see also Cowie et al., Reference Cowie, Bouchet and Fontaine2022).
Thirdly, rapid advances in dating techniques and instrumentation allow for dating smaller aliquots at a faster pace and lower costs, making it feasible to date hundreds of specimens in single projects. Age dating of shells or bones will continue to uncover extinctions and extirpations in the recent past and help us to assess if humans may have played a significant role in those events. And whereas conservation palaeobiology studies often encounter difficulties in determining the human role in past extinction events, the age distributions of dated specimens can potentially estimate the precise timing of extinctions and extirpation events and provide numerical assessments of decimations, which in turn can help us to identify extinction threats. The literature also suggests that geohistorical archives are a great resource for understanding the recent past and identifying human-driven changes that have already occurred but would be difficult to elucidate without palaeontological or archaeological data.
Finally, most geohistorical studies, including many examples highlighted in this review, indicate that many ecosystems have deteriorated in terms of taxonomic and functional diversity, spatial range and continuity, and functional ecology of individual species. Those geohistorical data indicate that marine ecosystems have been accumulating a human-driven extinction debt for centuries or even millennia.
In summary, despite various limitations and assumptions that underlie conservation palaeobiology strategies, geohistorical archives represent a wealth of data that complement ecological and conservation efforts and will likely continue to play an important role in assessing extinctions, extirpations, ecological extinctions, extinction debts and extinction threats.
Future research directions
Conservation palaeobiology is a relatively new research direction so the trivial notion that we need more case studies is germane here. This is especially so for the marine realm, for which only a few groups of organisms, most notably molluscs and corals, have been studied more extensively using geohistorical approaches. And even in the case of molluscs or corals, the geohistorical coverage is still limited and primarily focused on coastal systems. However, given the rapid growth of conservation palaeobiology research, we expect that new case studies will be added at an accelerating pace. In addition to the obvious need for more case studies across regions, ecosystem types and organismal groups, several research themes are particularly noteworthy.
-
• Global scale meta-analyses – Currently, there are too few case studies for any marine ecosystem type or any fine-scale groups (e.g., genera, families) of marine organisms to allow for any robust meta-analyses on global or multi-regional scales (with a notable exception of a live-dead meta-analysis of benthic mollusks, see Kidwell, Reference Kidwell2008). However, with new case studies being added every year, there is a good prospect that such larger-scale comparative analyses will become feasible in the foreseeable future. Already there exist multiple geohistorical case studies focused on closely related marine species making it possible to seek common patterns and processes, as in the case of declines in abundance of acroporid corals in the Caribbean (Cramer et al., Reference Cramer, Jackson, Donovan, Greenstein, Korpanty, Cook and Pandolfi2020) and Great Barrier Reef (Clark et al., Reference Clark, Roff, Zhao, Feng, Done, McCook and Pandolfi2017). In both regions, the decline started decades before the onset of monitoring efforts in the 1970s and 1980s.
-
• Geochronology – There is a steady increase in the number of studies that use age dating (especially U-Th, 14C), and these dating methods are becoming increasingly affordable and require smaller aliquots thus allowing for dating smaller specimens (e.g., Bright et al., Reference Bright, Ebert, Kosnik, Southon, Whitacre, Albano, Flores, Frazer, Hua, Kowalewski, Martinelli, Oakley, Parker, Retelle, Ritter, Rivadaneira, Scarponi, Yanes, Zuschin and Kaufman2021). The dating of large samples of marine skeletal remains is needed for many systems and groups of organisms to better understand the temporal resolution and coverage of geohistorical data (Zuschin, Reference Zuschin2023). For example, recent efforts to date echinoids yielded disparate estimates of time averaging: subdecadal for large sand dollars (Kowalewski et al., Reference Kowalewski, Casebolt, Hua, Whitacre, Kaufman and Kosnik2018) but multi-centennial for minute clypeasteroids (Nawrot et al., Reference Nawrot, Berensmeier, Gallmetzer, Haselmair, Tomašových and Zuschin2022). The echinoid conundrum illustrates the need for extensive dating across taxa and depositional systems to develop a more robust understanding of the temporal resolution of geohistorical data.
-
• “Empty shell” species – Recent studies on molluscs and foraminifera suggest that some unknown fraction of the present-day marine species were described from skeletal remains of organisms. Given that many skeletal remains can reside on seafloors for centuries or millennia, the “empty shell” species may alternatively represent a record of rare extant species, species that went extinct due to natural processes, or species that disappeared due to human activities. Studies that would focus on understanding how pervasive are "empty shell” species for various groups of marine organisms, as well as projects focused on dating those species to assess their time distribution, could advance our understanding of the present-day biodiversity in the marine realm and improve estimates of recent extinctions.
-
• Terrestrial–marine transitions - In coastal areas, targeted geohistorical research in the marine realm could be used to compare marine and terrestrial extinctions and extirpations for the same coastal system. Exploring marine extinctions in regions where early terrestrial extinctions attributed to humans have been already documented – as in the example of the ground doves from the Mascarene archipelago wiped out by colonisers during the early modern time – would be particularly fruitful.
-
• Translating research into action – The biggest challenge of conservation palaeobiology revolves around practical applications of geohistorical data. This is a two-pronged issue of being able to translate scientific knowledge into appropriate conservation actions and understanding what type of geohistorical data would be most useful to practitioners (Dietl et al., Reference Dietl, Smith and Durham2019; Kiessling et al., Reference Kiessling, Raja, Roden, Turvey and Saupe2019). This issue is not specific to extinction-focused studies but any geohistorical studies that aim to inform conservation efforts. Whereas translating research into conservation actions is beyond the scope of this review, it should be considered explicitly in any studies that aim to use historical data to assist present-day conservation efforts.
Open peer review
To view the open peer review materials for this article, please visit http://doi.org/10.1017/ext.2023.22.
Supplementary material
The supplementary material for this article can be found at http://doi.org/10.1017/ext.2023.22.
Data availability statement
No new data are reported in this review. The IUCN Red List dataset used to generate Figures 1 and 3 are reposited on GitHub, and access links are provided in Supplementary Material.
Acknowledgements
We thank the IUCN community for developing, maintaining, and allowing access to the Red List database, a subset of which has been used here to generate Figures 1 and 3. We thank three anonymous reviewers, Jonathan Payne (Associate Editor) and John Alroy (Editor) for constructive comments that substantial improved this review.
Author contribution
Conceptualisation: M.K., R.N., D.S, A.T., M.Z.; Writing—original draft: M.K., R.N., D.S, A.T., M.Z.; Writing—review and editing: M.K., R.N., D.S, A.T., M.Z.
Financial support
The project benefited from resources provided by the Conservation Paleobiology Network funded by the US National Science Foundation grant EAR 1922562. MK thanks the University of Florida Foundation Thompson Fund for partial support of this project. AT thanks the Slovak Research and Development Agency (APVV 22–0523) and the Slovak Scientific Grant Agency (VEGA 02/0106/23) for funding.
Competing interest
The authors declare no competing interests exist.


 Open access
Comments
No accompanying comment.