





1. Introduction
Fast radio bursts (FRBs) are bright (Jansky-level) flashes of short duration ( $\sim$
1 ms). They were first discovered in 2007 (Lorimer et al. Reference Lorimer, Bailes, McLaughlin, Narkevic and Crawford2007) and nowadays thousands of FRB events have been reported (CHIME/FRB Collaboration et al. 2026). As a consequence of the propagation of the signal through an ionised medium, radio waves undergo dispersion, causing a delay of the arrival time at lower frequencies. This delay depends on the electron density along the path between the source and the observer, and is parametrised by the dispersion measure
$\sim$
1 ms). They were first discovered in 2007 (Lorimer et al. Reference Lorimer, Bailes, McLaughlin, Narkevic and Crawford2007) and nowadays thousands of FRB events have been reported (CHIME/FRB Collaboration et al. 2026). As a consequence of the propagation of the signal through an ionised medium, radio waves undergo dispersion, causing a delay of the arrival time at lower frequencies. This delay depends on the electron density along the path between the source and the observer, and is parametrised by the dispersion measure $\mathrm{DM}\propto \int n_{e}dl$
. FRBs exhibit high DM values, which are incompatible with the dispersion caused solely by the Milky Way medium, and localisation studies have indeed confirmed that their origin is extragalactic (e.g. Tendulkar et al. Reference Tendulkar2017; Bannister et al. Reference Bannister2019). However, the progenitor and emission mechanisms producing FRBs are still unclear (e.g. Cordes & Chatterjee Reference Cordes and Chatterjee2019; Petroff et al. Reference Petroff, Hessels and Lorimer2019; Bailes Reference Bailes2022; Zhang Reference Zhang2023, for reviews). It is well established that a fraction of FRBs show repeating burst activity (e.g. Spitler et al. Reference Spitler2016; CHIME/FRB Collaboration et al. 2019, 2026), but it is unclear whether all FRBs do repeat and if repeating and non-repeating FRBs arise from the same processes (e.g. CHIME/FRB Collaboration et al. 2023; Kirsten et al. Reference Kirsten2024). Owing to their extragalactic origin and diverse intervening environments they propagate through, FRBs are useful cosmological probes (e.g. Macquart et al. Reference Macquart2020; Bhandari & Flynn Reference Bhandari and Flynn2021; Wu et al. Reference Wu, Zhang and Wang2022; James et al. Reference James2022; Zhang et al. Reference Zhang2023; Zhao et al. Reference Zhao, Wang, Zhang, Zhang and Zhang2023). Therefore, delivering catalogues of FRBs is fundamental to investigate their origin, plan follow-up observing campaigns, and constrain cosmological parameters.
$\mathrm{DM}\propto \int n_{e}dl$
. FRBs exhibit high DM values, which are incompatible with the dispersion caused solely by the Milky Way medium, and localisation studies have indeed confirmed that their origin is extragalactic (e.g. Tendulkar et al. Reference Tendulkar2017; Bannister et al. Reference Bannister2019). However, the progenitor and emission mechanisms producing FRBs are still unclear (e.g. Cordes & Chatterjee Reference Cordes and Chatterjee2019; Petroff et al. Reference Petroff, Hessels and Lorimer2019; Bailes Reference Bailes2022; Zhang Reference Zhang2023, for reviews). It is well established that a fraction of FRBs show repeating burst activity (e.g. Spitler et al. Reference Spitler2016; CHIME/FRB Collaboration et al. 2019, 2026), but it is unclear whether all FRBs do repeat and if repeating and non-repeating FRBs arise from the same processes (e.g. CHIME/FRB Collaboration et al. 2023; Kirsten et al. Reference Kirsten2024). Owing to their extragalactic origin and diverse intervening environments they propagate through, FRBs are useful cosmological probes (e.g. Macquart et al. Reference Macquart2020; Bhandari & Flynn Reference Bhandari and Flynn2021; Wu et al. Reference Wu, Zhang and Wang2022; James et al. Reference James2022; Zhang et al. Reference Zhang2023; Zhao et al. Reference Zhao, Wang, Zhang, Zhang and Zhang2023). Therefore, delivering catalogues of FRBs is fundamental to investigate their origin, plan follow-up observing campaigns, and constrain cosmological parameters.
The Northern Cross (NC; Bianchi et al. Reference Bianchi, Perini and Setti2023) is a T-shaped transit interferometer consisting of two perpendicular arms oriented to N-S and E-W, built in the 1960s in Medicina ( $\sim$
30 km to Bologna, Italy). In the past, it was used to scan the sky at 408 MHz and delivered catalogues of extragalactic radio sources (e.g. Colla et al. Reference Colla1970; Fanti et al. Reference Fanti, Fanti, Ficarra and Padrielli1974; Pedani & Grueff Reference Pedani and Grueff1999). In the recent years, the NC has undergone a major upgrade that enabled the detection of FRBs (see Locatelli et al. Reference Locatelli2020 and references therein). With this upgrade, the NC is becoming a leading facility in Europe for the observation of FRBs. Since the first FRB detection with the NC in 2021 (Trudu et al. Reference Trudu2022), a total of 31 events from 6 different FRBs have been detected as of the end of 2025 (Trudu et al. Reference Trudu2022; Pelliciari et al. Reference Pelliciari2023, Reference Pelliciari2024; Geminardi et al. in preparation), demonstrating the capability of the instrument. With the completion of the NC refurbishment, the Next Generation Croce del Nord (NG-Croce) will have improved capabilities, with higher sensitivity, possibility of performing multi-beam observations, and a transient buffer for real-time detection (Naldi et al. Reference Naldi2025).
$\sim$
30 km to Bologna, Italy). In the past, it was used to scan the sky at 408 MHz and delivered catalogues of extragalactic radio sources (e.g. Colla et al. Reference Colla1970; Fanti et al. Reference Fanti, Fanti, Ficarra and Padrielli1974; Pedani & Grueff Reference Pedani and Grueff1999). In the recent years, the NC has undergone a major upgrade that enabled the detection of FRBs (see Locatelli et al. Reference Locatelli2020 and references therein). With this upgrade, the NC is becoming a leading facility in Europe for the observation of FRBs. Since the first FRB detection with the NC in 2021 (Trudu et al. Reference Trudu2022), a total of 31 events from 6 different FRBs have been detected as of the end of 2025 (Trudu et al. Reference Trudu2022; Pelliciari et al. Reference Pelliciari2023, Reference Pelliciari2024; Geminardi et al. in preparation), demonstrating the capability of the instrument. With the completion of the NC refurbishment, the Next Generation Croce del Nord (NG-Croce) will have improved capabilities, with higher sensitivity, possibility of performing multi-beam observations, and a transient buffer for real-time detection (Naldi et al. Reference Naldi2025).
The synergy between the NC and other national and international FRB detectors is becoming relevant for follow-up monitoring, localisation, spectral studies, and statistical analyses (e.g. Pilia et al. Reference Pilia2020; Casentini et al. Reference Casentini, Verrecchia, Tavani, Pilia and Pacciani2025; Shah et al. Reference Shah2025). In this paper, we present the Italian Northern Cross Atlas for Radio Transients (INCART Footnote a ), a public database that provides the scientific community with access to the Northern Cross – fast radio burst (NC–FRB) data products.
The paper is organised as follows. In Section 2, we summarise typical observation setup, data processing, and analysis for NC–FRB data. In Section 3, we present INCART and describe the procedures leading to the archived data products. In Section 4, we discuss the key issue of large data volumes, and how this is handled by the NC and other FRB detectors. In Section 5 we summarise our work and the prospects for the NG-Croce.
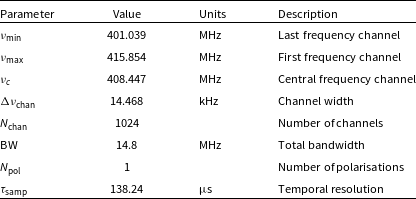
Properties of current NC filterbank-format data.

2. Observations and data processing
The NC operates in P-band, with a central frequency of 408 MHz and an effective bandwidth of $\sim$
15 MHz. In the current configuration, only the N-S arm is working, whereas the E-W arm is under refurbishment. The N-S arm includes 64 reflective parabolic cylinders,Footnote
b
each one focusing the incoming radiation towards groups of dipoles along the focal line. As detailed in Locatelli et al. (Reference Locatelli2020), the acquired signal is digitised and processed. The processing chain includes correction for cable mismatch, data channelisation, correction for delays, and combination of the response of the dipoles into a single beam. The resulting beam-formed data are converted into total intensity data stored in a custom time-frequency format, which have a typical size of
$\sim$
15 MHz. In the current configuration, only the N-S arm is working, whereas the E-W arm is under refurbishment. The N-S arm includes 64 reflective parabolic cylinders,Footnote
b
each one focusing the incoming radiation towards groups of dipoles along the focal line. As detailed in Locatelli et al. (Reference Locatelli2020), the acquired signal is digitised and processed. The processing chain includes correction for cable mismatch, data channelisation, correction for delays, and combination of the response of the dipoles into a single beam. The resulting beam-formed data are converted into total intensity data stored in a custom time-frequency format, which have a typical size of $\sim$
250 GB as obtained from an observing run of 1 hour with the present NC working configuration. Finally, these data are equalised and rescaled using digifil from the DSPSR library (van Straten & Bailes Reference van Straten and Bailes2011), converting them into a standard SigProc (Lorimer Reference Lorimer2011) filterbank format suitable for transient search analysis. Currently, the NC–FRB filterbank-format data are saved with 1 024 frequency channels of width 14.468 kHz each and a temporal resolution of
$\sim$
250 GB as obtained from an observing run of 1 hour with the present NC working configuration. Finally, these data are equalised and rescaled using digifil from the DSPSR library (van Straten & Bailes Reference van Straten and Bailes2011), converting them into a standard SigProc (Lorimer Reference Lorimer2011) filterbank format suitable for transient search analysis. Currently, the NC–FRB filterbank-format data are saved with 1 024 frequency channels of width 14.468 kHz each and a temporal resolution of $138.24 \; \unicode{x03BC}\mathrm{s}$
(see Table 1). With this procedure, the data size is reduced to
$138.24 \; \unicode{x03BC}\mathrm{s}$
(see Table 1). With this procedure, the data size is reduced to $\sim$
50 GB.
$\sim$
50 GB.
The antenna gain calibration is performed by deriving corrections from the observation of a bright calibrator at transit, with Cassiopeia A (Cas A) routinely used for the NC. Although the radio frequency interference (RFI) level is typically low, various tools can be used to excise the bulk of RFI, such as RFIFIND (Ransom et al. Reference Ransom, Eikenberry and Middleditch2002) and IQRM (Morello et al. Reference Morello, Rajwade and Stappers2022). De-dispersion trials are performed over wide DM ranges to search for possible transients through HEIMDALL (Barsdell et al. Reference Barsdell, Bailes, Barnes and Fluke2012). This provides estimates of the arrival time, duration (as boxcar width), signal-to-noise ratio (SNR), and DM of the candidates. The candidate events are validated by FETCH (Agarwal et al. Reference Agarwal, Aggarwal, Burke-Spolaor, Lorimer and Garver-Daniels2020), which employs convolutional neural networks trained to distinguish spurious from genuine signals.
3. The INCART database
We aim to provide the community with access to the NC–FRB data. Raw voltages and beam-formed data are necessary for independent reprocessing, especially to recover potential bursts that may have been undetected due to limitations of the current pipelines. In practice, in the perspective of data storage and in view of the NG-Croce upgrade, preserving and distributing these data for both FRB detections and non-detections is unsustainable in the long term. On the other hand, a catalogue reporting physical quantities derived from the burst analysis is essential, but alone it does not enable independent verification of these values.
The INCART database serves both as a catalogue of FRB properties and as a repository of short time chunks of fully processed filterbank datasets containing the FRB event. This design minimises storage requirements, ensures long-term scalability, provides science-ready data products, and offers the possibility for users to analyse the FRB properties with independent methods. INCART is tailored for the NC–FRB project and provides a basic querying system, with search options by FRB name and observation date. In contrast, the Istituto Nazionale di Astrofisica (INAF) Radio Data ArchiveFootnote c is the national infrastructure that archives and distributes data from all Italian radio facilities, developed prior to and independently from INCART for general purposes. For consistency between the two services, the same cutout filterbank datasets available in INCART, accompanied by metadata for instrumental, observational, and provenance information, will also be accessible in the Radio Archive, which offers a more advanced and flexible querying system.
The products retrievable via INCART are the result of the NC archivist pipeline, which was developed for the specific purpose of preparing sets of data curated with homogeneous methods. Therefore, archivist was also run on previously published NC–FRB data (Trudu et al. Reference Trudu2022; Pelliciari et al. Reference Pelliciari2023, Reference Pelliciari2024) for consistency with the whole collection. In Sections 3.1, 3.2 we describe the implemented procedure.
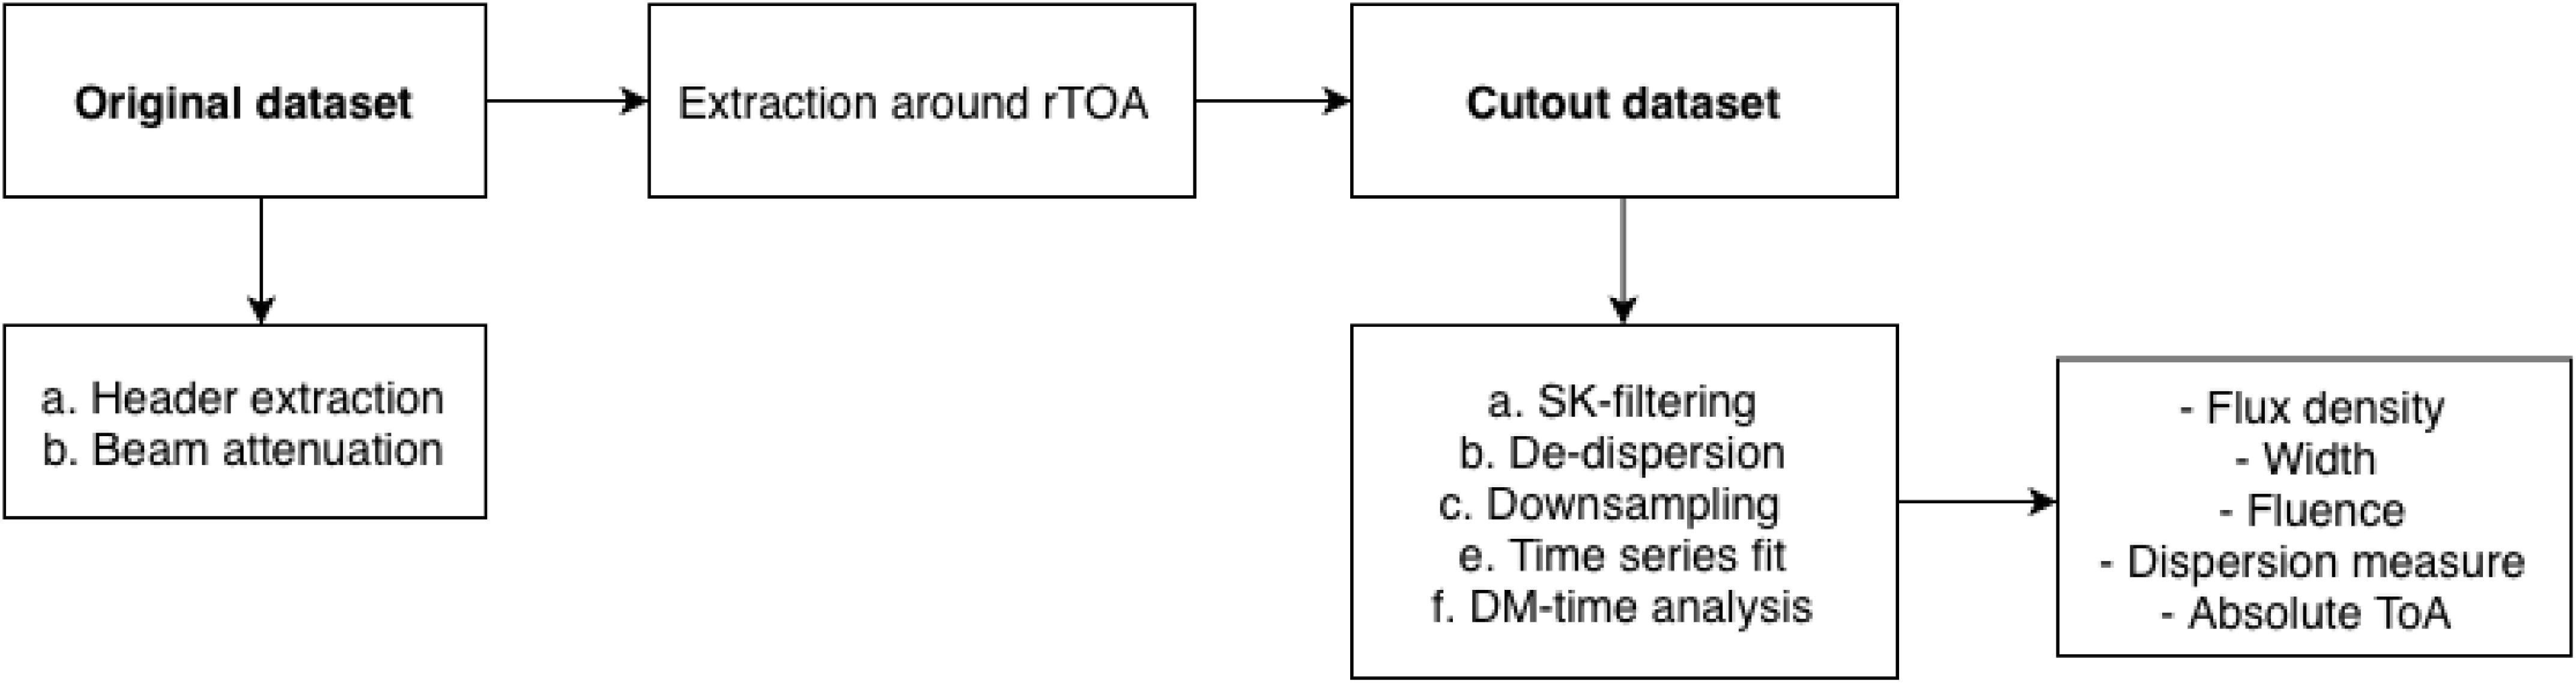
Flowchart of data analysis steps performed by the NC archivist pipeline (Section 3.1).

3.1. FRB analysis steps
The archivist v. 1.0 pipeline requires the processed filterbank dataset (Section 2) containing the confirmed FRB event, which we will refer to as the ‘original’ dataset. The fundamental input parameters, which can be obtained for example from HEIMDALL, are (i) the time of arrival relative to the observation start (rToA), which is referred to the maximum frequency channel ( $\nu_\mathrm{ max}$
, Table 1), (ii) width (W), which is the FWHM of the burst profile, and (iii) DM. The input values of W and DM need to be representative priors, but they are then refined by the analysis. In the following, we describe the steps displayed in the flowchart of Figure 1, which lead to the final data products accessible in INCART. The detailed calculations performed by archivist are reported in Section 3.2.
$\nu_\mathrm{ max}$
, Table 1), (ii) width (W), which is the FWHM of the burst profile, and (iii) DM. The input values of W and DM need to be representative priors, but they are then refined by the analysis. In the following, we describe the steps displayed in the flowchart of Figure 1, which lead to the final data products accessible in INCART. The detailed calculations performed by archivist are reported in Section 3.2.
-
1. Metadata from the header of the original dataset are saved in a logfile. The logfile will be progressively updated with additional metadata that are not included in the header and results of the FRB analysis.
-
2. The sensitivity of transit telescopes towards a specific direction varies in time during an observing run. The attenuation of the signal needs to be corrected by a factor $f_\mathrm{beam}(\mathrm{rToA})$
, which is computed from the total observing time and the NC beam parameters (see e.g. Geminardi et al. Reference Geminardi2025 for details).
$f_\mathrm{beam}(\mathrm{rToA})$
, which is computed from the total observing time and the NC beam parameters (see e.g. Geminardi et al. Reference Geminardi2025 for details). -
3. Based on the input W and DM values, the original dataset is cut out in time around rTOA. This ‘cutout’ dataset contains a few seconds of observation centred on the FRB event, typically reducing the data size from
$\sim$
50 GB to
$\sim$
30 MB, and enabling sustainable preservation and easy distribution. Subsequent steps will be performed on the cutout dataset. -
4. Possible RFI is identified using a spectral kurtosis filter (Vrabie et al. Reference Vrabie, Granjon and Serviere2003; Nita et al. Reference Nita, Gary and Hellbourg2019), and individual time–frequency samples exceeding a
$5\sigma_\mathrm{SK}$
threshold are masked. Given that the analysis is performed on a short cutout centred on the burst, this approach is adequate and does not require flagging of entire frequency channels or time intervals. The typical fraction of masked samples is
$\xi_\mathrm{SK} \lesssim 1\%$
. -
5. Data are de-dispersed around the input DM. A proper downsampling is then applied taking into account the input burst width and cutout length, preserving a sufficient number of temporal bins to fit the FRB profile and estimate the noise level. Specifically, downsampling is performed with the local_resize_mean function within the scikit-image python package (van der Walt et al. Reference van der Walt2014), yielding to a number of temporal bins scaling as a power of 2 within a narrow (a few hundreds of ms) time window. Such procedure optimises the SNR, while typically decreasing the temporal resolution from
$\sim$
0.1 to
$\sim$
1 ms. -
6. All frequency channels are averaged to obtain the de-dispersed time series, which is then normalised by the peak value for clearer inspection. The time series is fitted with a Gaussian function, providing best-fit values of its centre, amplitude (A), and standard deviation (
$\sigma$
). The obtained A and
$\sigma$
are used to compute the SNR, which provides flux density and fluence measurements after conversion from instrumental to physical units. -
7. The representative DM used in previous steps is the result of FRB searching algorithms (Section 2) and is thus adequate for the burst characterisation. For refinement and uncertainty estimation, values within the range
$\mathrm{DM} \pm 0.1\times \mathrm{DM}$
are tested. This range is sampled with 256 steps (providing sufficient DM resolution, while keeping the computational cost manageable), and the data are de-dispersed at each DM. We consider the DM that maximises the SNR, DM
$_\mathrm{max}$
, as the best estimate. -
8. Using rToA, the absolute topocentric ToA (referred to
$\nu_\mathrm{max}$
) is computed. This is scaled to
$\nu \rightarrow \infty$
by correcting for the dispersive delay assuming
$\mathrm{DM= DM}_\mathrm{max}$
.





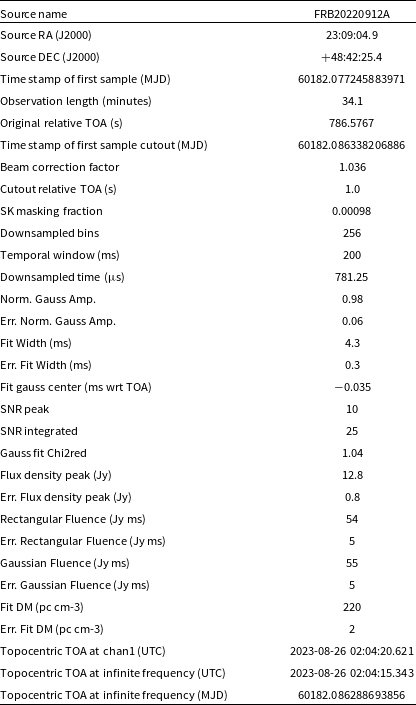
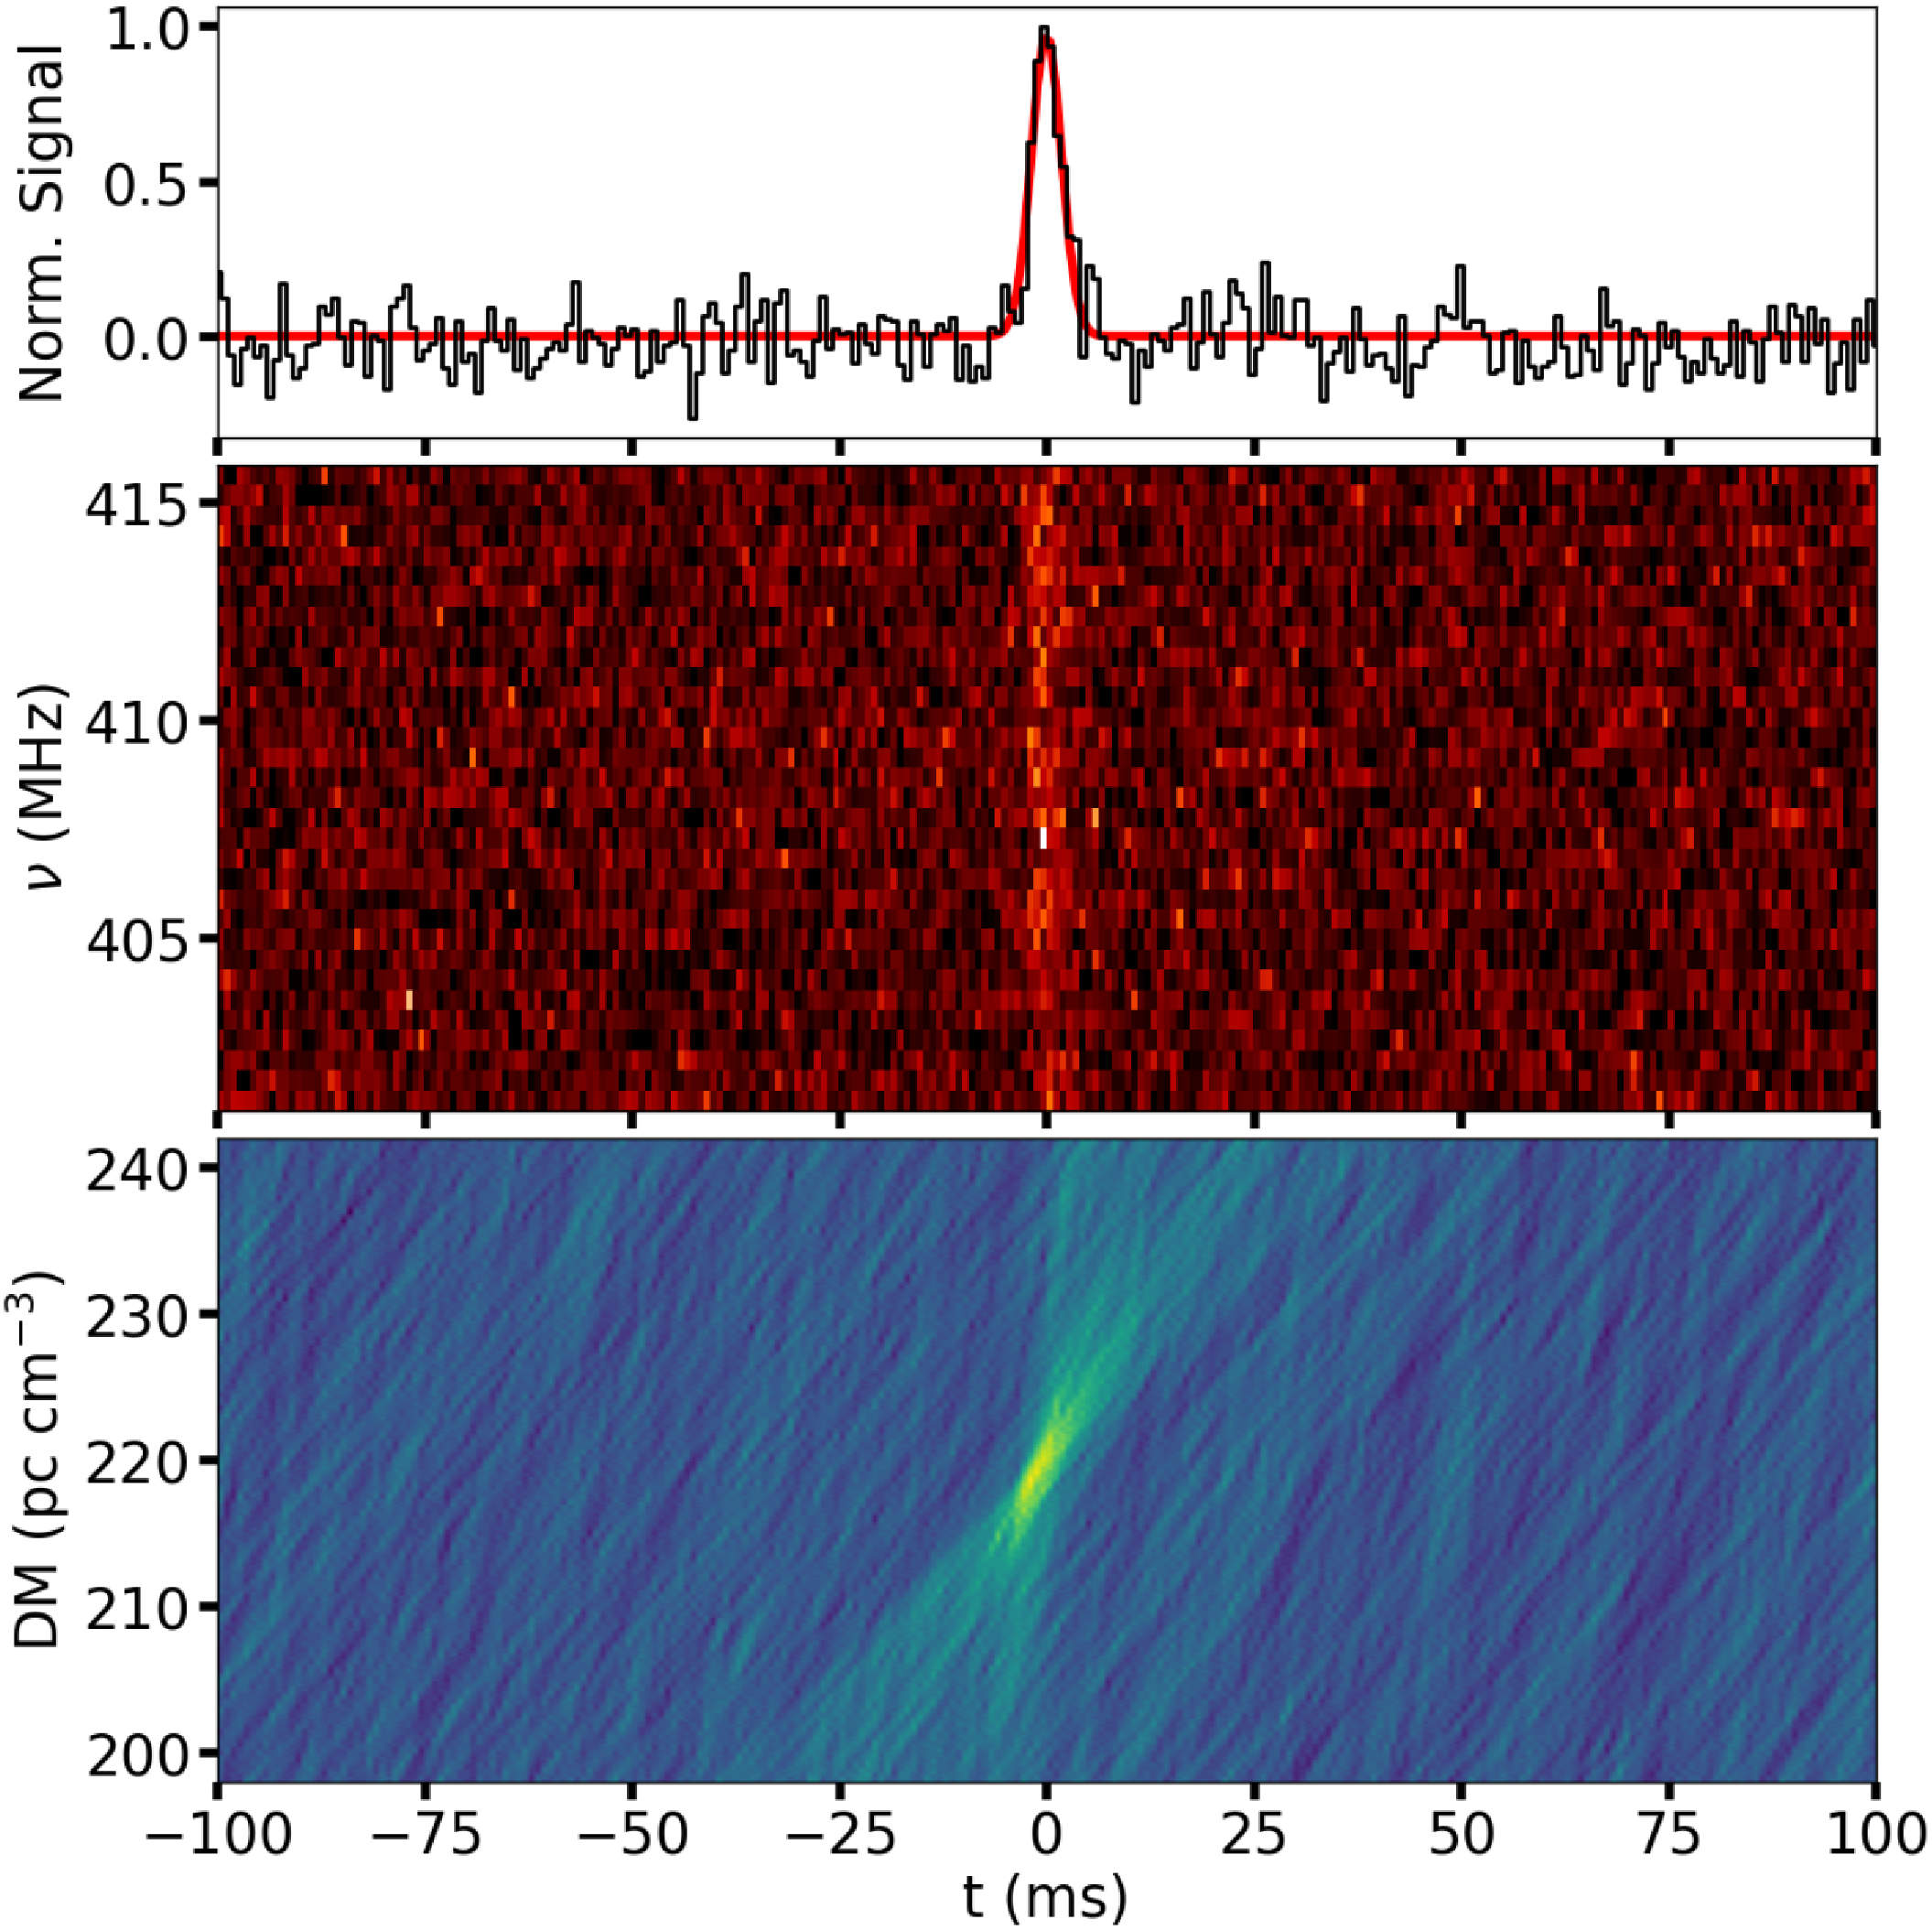
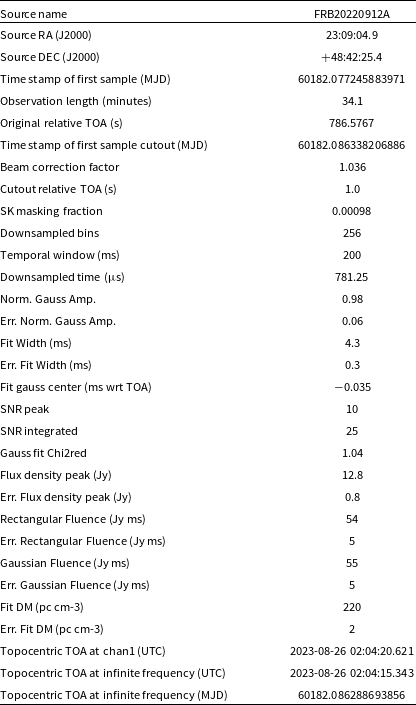
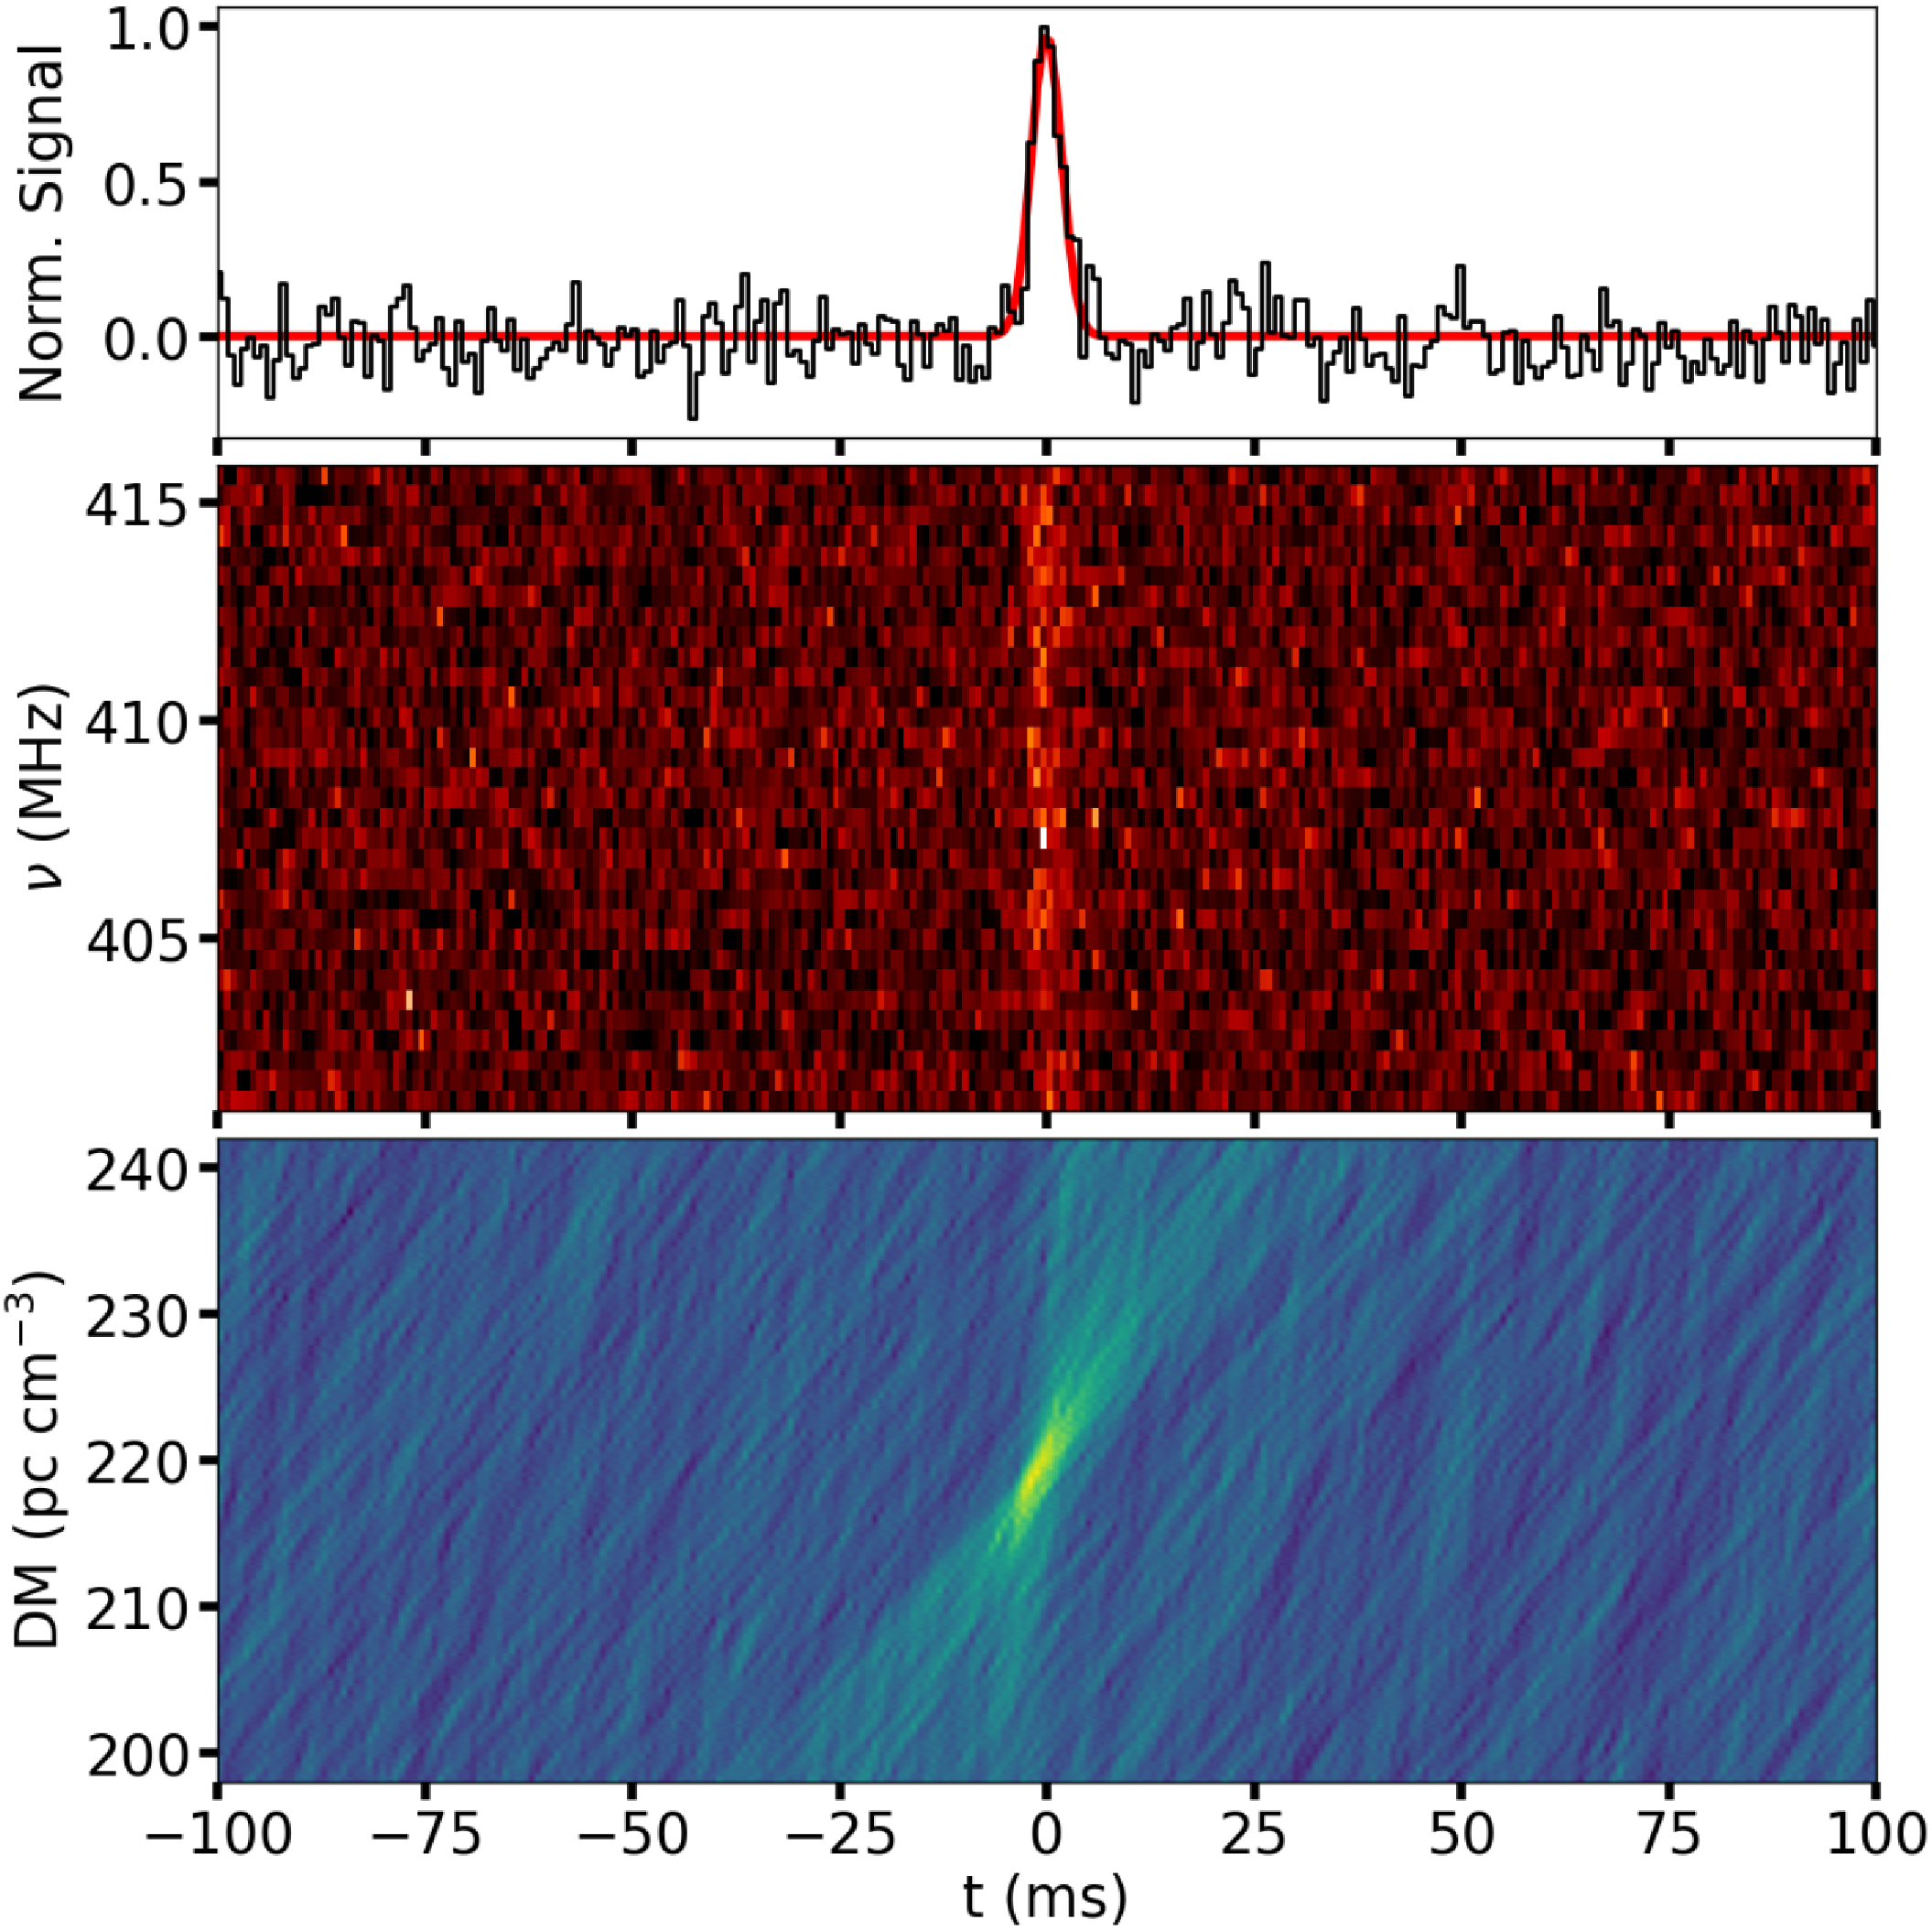
The products stored in INCART are the cutout filterbank dataset as obtained from step 3, the logfile, and sets of plots showing the normalised de-dispersed time series, dynamic spectrum, and time-DM (‘butterfly’) diagram. Examples of the logfile and output plots for the repeating source FRB20220912A (observation date: 26 August 2023) are shown in Table 2 and Figure 2.
3.2. Procedures and equations
In this section, we report the detailed procedures performed by the NC archivist v. 1.0 pipeline following the steps described in Section 3.1. We assume that the FRB time series can be described by a Gaussian profile in the form:
 \begin{equation} G(t)=Ae^{-\frac{1}{2}\left( \frac{t-\mathrm{rToA}}{\sigma } \right)^2}, \end{equation}
where A is the amplitude (in units of $\mathrm{s}^{-1}$
),
$\mathrm{s}^{-1}$
), $\sigma=W/\sqrt{8\ln{2}}$
is the standard deviation (with
$\sigma=W/\sqrt{8\ln{2}}$
is the standard deviation (with $W=\mathrm{FWHM}$
, in units of s), and rToA is the time of arrival relative to the observation starting time. Integrating G(t) over time in
$W=\mathrm{FWHM}$
, in units of s), and rToA is the time of arrival relative to the observation starting time. Integrating G(t) over time in $\mathrm{ rToA}\pm N\sigma$
, the resulting area is:
$\mathrm{ rToA}\pm N\sigma$
, the resulting area is:
 \begin{equation} \mathcal{A}_\mathrm{Gauss}= \int^{\mathrm{rToA}+ N\sigma}_{\mathrm{rToA}- N\sigma} G(t)\mathrm{d}t=A\sqrt{2\pi}\sigma f(N), \end{equation}
where $f(N)= 1$
for
$f(N)= 1$
for $N\rightarrow \infty$
. In our analysis, the time series is normalised to its peak value, implying that the fitted amplitude is expected to be
$N\rightarrow \infty$
. In our analysis, the time series is normalised to its peak value, implying that the fitted amplitude is expected to be $A\sim 1 \; \mathrm{s}^{-1}$
for FRBs with a single burst. The goodness of the fit is evaluated through the reduced
$A\sim 1 \; \mathrm{s}^{-1}$
for FRBs with a single burst. The goodness of the fit is evaluated through the reduced $\chi^2$
. We considered integration limits with
$\chi^2$
. We considered integration limits with $N=2$
, thus setting
$N=2$
, thus setting $\,f(2)\sim 0.95$
in Equation (2) (see below the motivation for this choice).
$\,f(2)\sim 0.95$
in Equation (2) (see below the motivation for this choice).
The fitted parameters are used to compute the FRB flux density and fluence. The flux density of the peak is obtained as
 \begin{equation} S_{p} = \mathrm{SNR}_{p} \times \sigma_\mathrm{therm}, \end{equation}
where $\mathrm{SNR}_{p}=A/\sigma_\mathrm{std}$
is the ratio of the amplitude to the standard deviation of the noise computed in off-burst bins (that is, beyond the considered integration limits), and
$\mathrm{SNR}_{p}=A/\sigma_\mathrm{std}$
is the ratio of the amplitude to the standard deviation of the noise computed in off-burst bins (that is, beyond the considered integration limits), and $\sigma_\mathrm{therm}$
is the thermal noise (in units of Jy). The thermal noise is computed from the radiometer equation (Lorimer & Kramer Reference Lorimer and Kramer2012) as:
$\sigma_\mathrm{therm}$
is the thermal noise (in units of Jy). The thermal noise is computed from the radiometer equation (Lorimer & Kramer Reference Lorimer and Kramer2012) as:
 \begin{equation} \sigma_\mathrm{therm} = \frac{\mathrm{SEFD}}{A_\mathrm{rec} \sqrt{N_\mathrm{pol}\times \mathrm{BW} \times (1-\xi) \times t_\mathrm{samp}}}, \end{equation}
where SEFD is the system equivalent flux density, $A_\mathrm{rec}=4\times \mathrm{N}_\mathrm{cyl}$
is the number of receivers based on the number of working cylinders,
$A_\mathrm{rec}=4\times \mathrm{N}_\mathrm{cyl}$
is the number of receivers based on the number of working cylinders, $N_\mathrm{pol}$
is the number of recorded polarisations, BW is the bandwidth,
$N_\mathrm{pol}$
is the number of recorded polarisations, BW is the bandwidth, $\xi$
is the fraction of masked time-frequency samples (we assumed
$\xi$
is the fraction of masked time-frequency samples (we assumed $\xi=\xi_\mathrm{SK}$
, based on step 4 in Section 3.1), and
$\xi=\xi_\mathrm{SK}$
, based on step 4 in Section 3.1), and $t_\mathrm{samp}$
is the considered sampling time. For the NC,
$t_\mathrm{samp}$
is the considered sampling time. For the NC, $\mathrm{SEFD}=8400\pm 420$
Jy (Trudu et al. Reference Trudu2022),
$\mathrm{SEFD}=8400\pm 420$
Jy (Trudu et al. Reference Trudu2022), $N_\mathrm{pol}=1$
, and
$N_\mathrm{pol}=1$
, and $\mathrm{ BW}=14.8$
MHz (Table 1).
$\mathrm{ BW}=14.8$
MHz (Table 1).
Example of main entries in the logfile for FRB20220912A (observation of 26 August 2023, see Figure 2).
For a comparison with previous works on NC–FRBs (Trudu et al. Reference Trudu2022; Pelliciari et al. Reference Pelliciari2024; Geminardi et al. Reference Geminardi2025), we derived the fluence via two different methods. In the first method, the ‘rectangular’ fluence is computed as the area of a rectangle having sides equal to $S_{p}$
and W, being:
$S_{p}$
and W, being:
 \begin{equation} F_\mathrm{rect} = S_{p} \times W. \end{equation}
In the second method, we took into account the whole duration of the burst, which provides a more effective SNR estimate, rather than using only the peak. Such SNR is given by:
 \begin{equation} \mathrm{SNR}_\mathrm{int} = \frac{\mathcal{A}_\mathrm{Gauss}}{\sigma_\mathrm{std}\sqrt{N_\mathrm{bin}}t_\mathrm{samp}}, \end{equation}
where $N_\mathrm{bin}=W/t_\mathrm{samp}$
is the number of temporal bins covering the burst FWHM, thus allowing a proper comparison between the FRB and noise level. The corresponding thermal noise,
$N_\mathrm{bin}=W/t_\mathrm{samp}$
is the number of temporal bins covering the burst FWHM, thus allowing a proper comparison between the FRB and noise level. The corresponding thermal noise, $\sigma_\mathrm{therm, int}$
, is obtained as in Equation (4) by substituting
$\sigma_\mathrm{therm, int}$
, is obtained as in Equation (4) by substituting $t_\mathrm{samp}$
with W to take into account the burst duration. The ‘Gaussian’ fluence is thus computed as:
$t_\mathrm{samp}$
with W to take into account the burst duration. The ‘Gaussian’ fluence is thus computed as:
 \begin{equation} F_\mathrm{Gauss} = \mathrm{SNR}_\mathrm{int} \times \sigma_\mathrm{therm, int} \times W. \end{equation}
As a rough estimate, the accuracy in the calculation of the fluence via the two methods described above is provided by the ratio of the rectangular ( $\mathcal{A}_\mathrm{rect}=A\times W$
) to Gaussian areas:
$\mathcal{A}_\mathrm{rect}=A\times W$
) to Gaussian areas:
 \begin{equation} \frac{\mathcal{A}_\mathrm{rect}}{\mathcal{A}_\mathrm{Gauss}}=\sqrt{\frac{4\ln2}{\pi}} \frac{1}{f(N)} \sim \frac{0.94}{f(N)}. \end{equation}
Under the assumption that the profile in Equation (1) is a good representation of the data, Equation (8) shows that for $N= 2$
the two methods are approximately equivalent.
$N= 2$
the two methods are approximately equivalent.
Example of diagnostic plots for FRB20220912A (observation of 26 August 2023, see Table 2). Top: De-dispersed downsampled time series normalised to the burst peak. The red line shows the Gaussian fit to the burst profile. Centre: Dynamic spectrum. For clearer inspection, a downsampling of 32 frequency channels is applied. Bottom: Butterfly diagram showing the distribution of the time series around different DM values.
The logfile reports the peak flux density and fluences calculated with the rectangular and Gaussian methods as described above. Within INCART, these values are multiplied by $f_\mathrm{beam}(\mathrm{rToA})$
to correct for the beam attenuation (step 2 in Section 3.1). The errors on
$f_\mathrm{beam}(\mathrm{rToA})$
to correct for the beam attenuation (step 2 in Section 3.1). The errors on $S_\mathrm{peak}$
and W are obtained from the fitting uncertainty on A and
$S_\mathrm{peak}$
and W are obtained from the fitting uncertainty on A and $\sigma$
, respectively. Following the standard propagation error formula, we computed errors on the fluences.
$\sigma$
, respectively. Following the standard propagation error formula, we computed errors on the fluences.
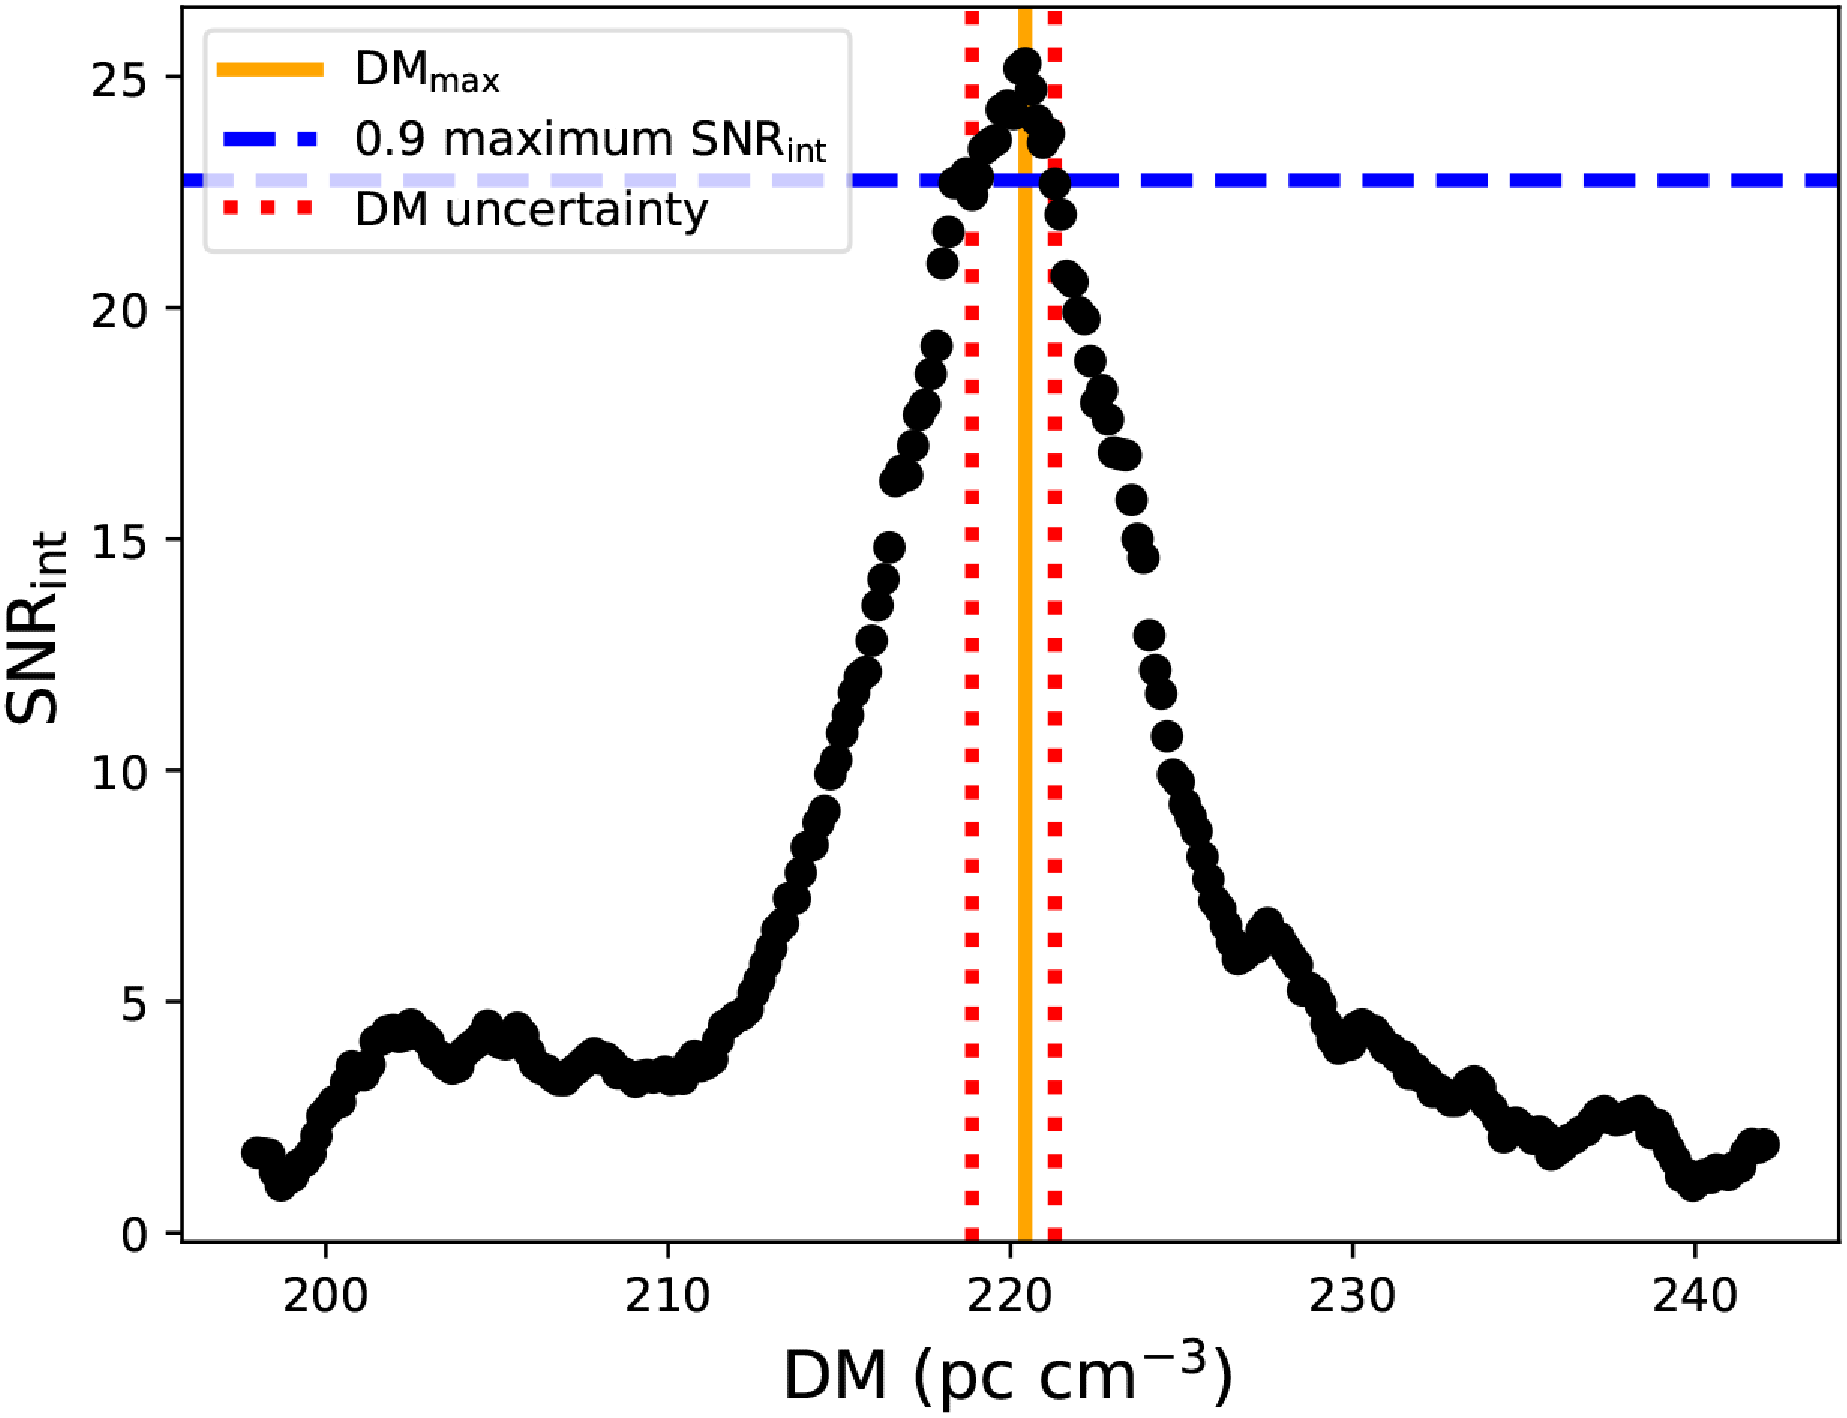
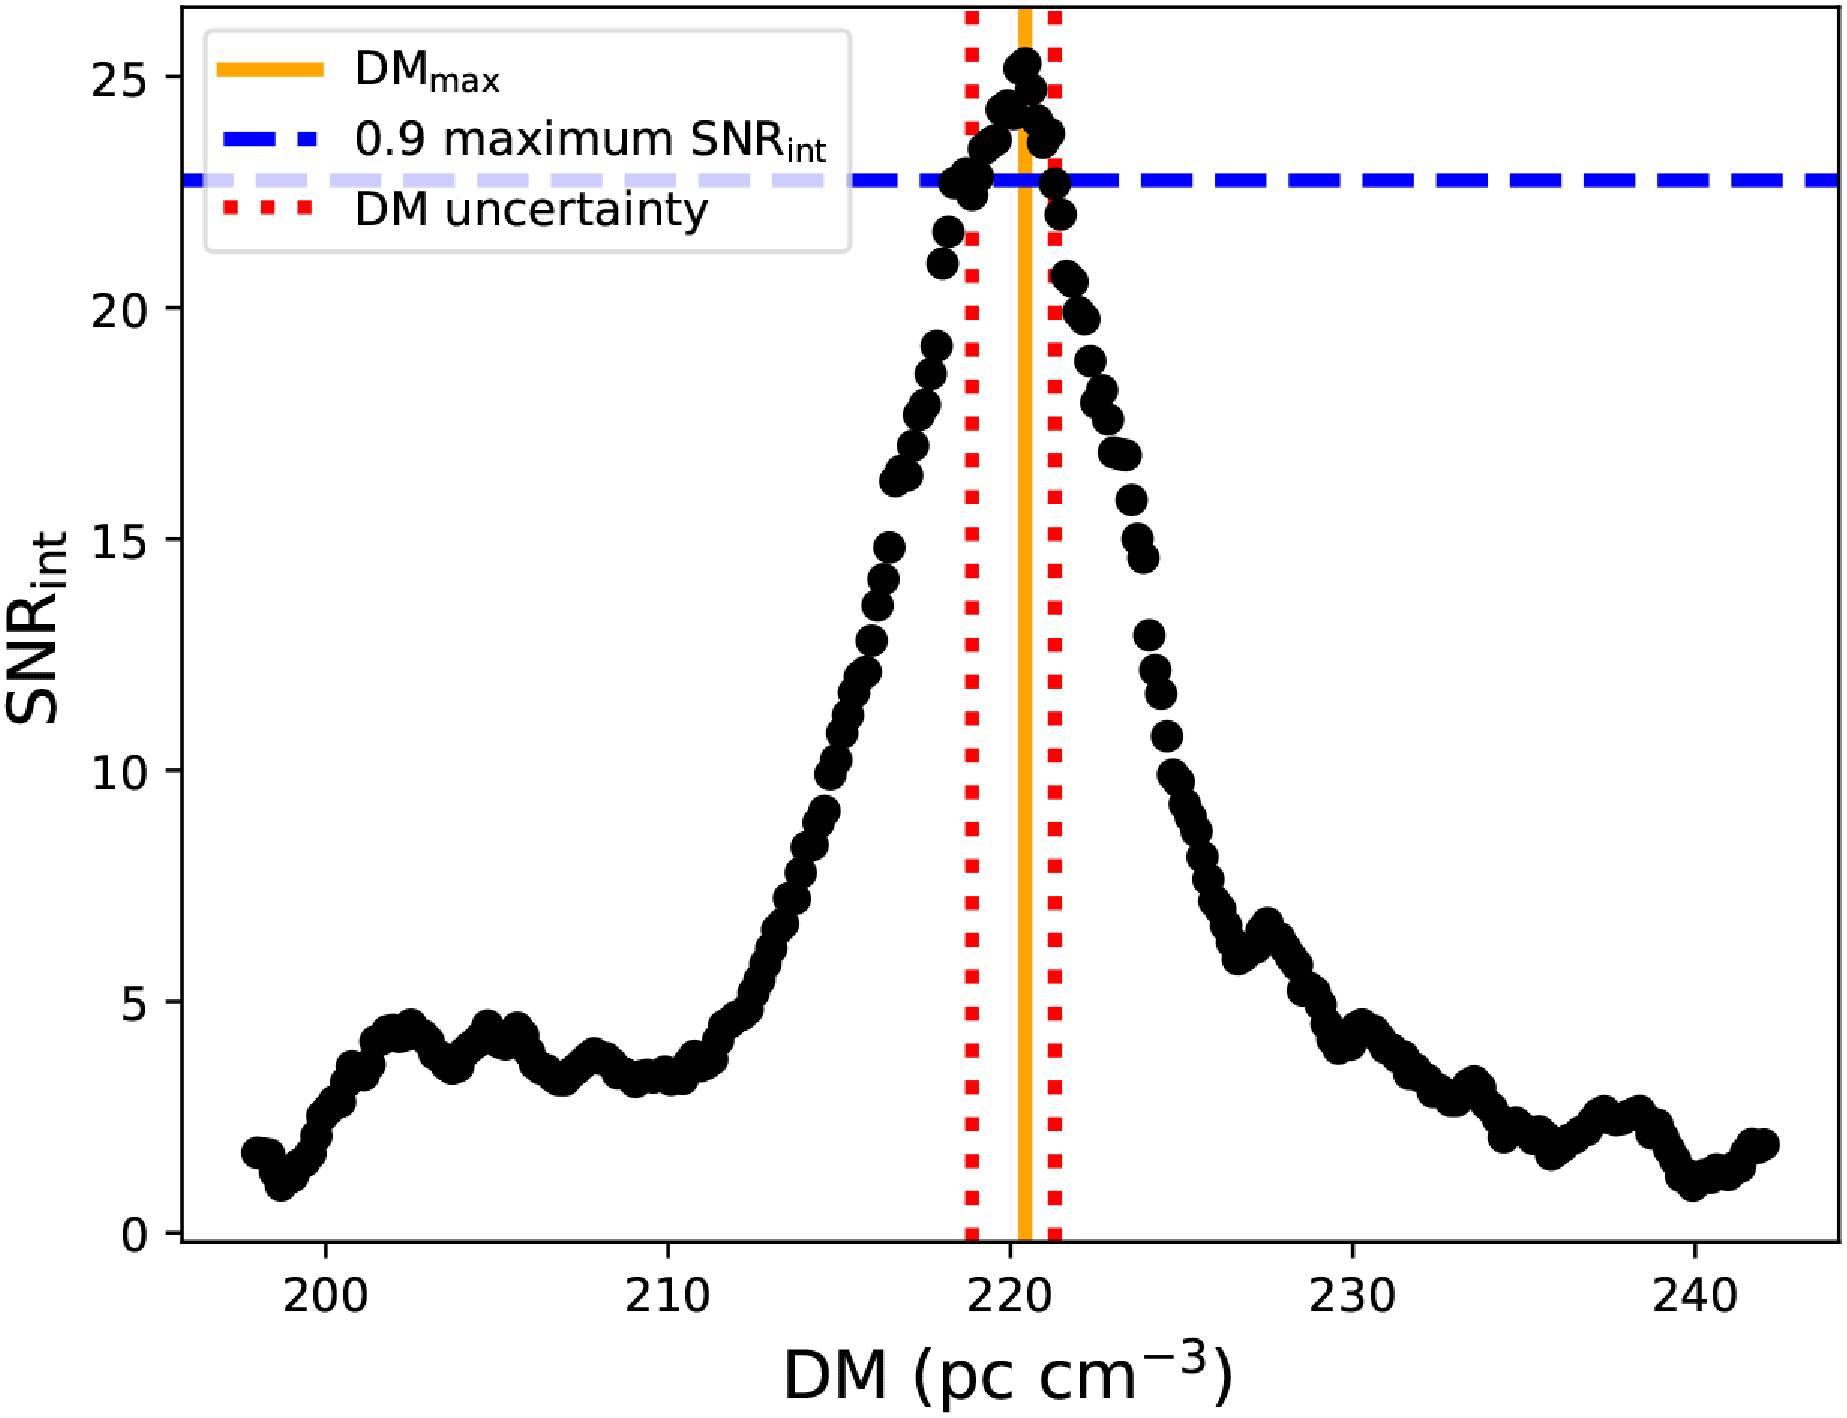
The DM-time analysis producing the butterfly diagram (step 7 in Section 3.1) shows the signal intensity as a function of time and trial DM values, obtained by de-dispersing the data over a range of DMs. This yields a DM value, $\mathrm{DM}_\mathrm{max}$
, which maximizes SNR_int. To estimate the uncertainty on
$\mathrm{DM}_\mathrm{max}$
, which maximizes SNR_int. To estimate the uncertainty on $\mathrm{DM}_\mathrm{max}$
, we considered the distribution of SNR_int, and derived the range of DM where the maximum SNR_int value decreases by 10%Footnote
d
(see Figure 3). If such DM range is not symmetric with respect to
$\mathrm{DM}_\mathrm{max}$
, we considered the distribution of SNR_int, and derived the range of DM where the maximum SNR_int value decreases by 10%Footnote
d
(see Figure 3). If such DM range is not symmetric with respect to $\mathrm{DM}_\mathrm{ max}$
, the error is obtained as the largest value between the lower and upper limit. This procedure yields relative DM uncertainties of the order of
$\mathrm{DM}_\mathrm{ max}$
, the error is obtained as the largest value between the lower and upper limit. This procedure yields relative DM uncertainties of the order of $\sim$
0.1–1%.
$\sim$
0.1–1%.
Example of SNR_int-DM distribution for FRB20220912A (Figure 2, Table 2). The value of DM $_\mathrm{max}$
(orange solid line) is the DM maximising SNR_int (step 7 in Section 3.1). The corresponding uncertainty range (red dotted lines) consists of the DM values providing a decrease of the maximum SNR_int by the 10% (blue dashed line).
$_\mathrm{max}$
(orange solid line) is the DM maximising SNR_int (step 7 in Section 3.1). The corresponding uncertainty range (red dotted lines) consists of the DM values providing a decrease of the maximum SNR_int by the 10% (blue dashed line).
The obtained $\mathrm{DM}_\mathrm{max}$
is used to derive the absolute arrival time of the burst in a topocentric reference system at infinite frequency. In modified Julian day (MJD) units, the absolute ToA at the highest frequency channel (
$\mathrm{DM}_\mathrm{max}$
is used to derive the absolute arrival time of the burst in a topocentric reference system at infinite frequency. In modified Julian day (MJD) units, the absolute ToA at the highest frequency channel ( $\nu_\mathrm{max}$
in Table 1) is computed as
$\nu_\mathrm{max}$
in Table 1) is computed as
 \begin{equation}\mathrm{ToA}_\mathrm{\nu_\mathrm{max}} = \frac{t_{0}}{\mathrm{MJD}} + \frac{\mathrm{rToA}}{86400}. \end{equation}
The ToA is finally corrected by the dispersive delay and referred to $\nu \rightarrow \infty$
as
$\nu \rightarrow \infty$
as
 \begin{equation}\mathrm{ToA}_\mathrm{\infty} = \frac{\mathrm{ToA}_{\nu_\mathrm{max}}}{\mathrm{MJD}} - \frac{k}{86\,400} \times \frac{\mathrm{DM_{max}}}{\nu_\mathrm{ max}^2}, \end{equation}
where $k=4148.808 \; \mathrm{s\; MHz^2 \; cm^3\; pc^{-1}\; }$
is the dispersion constant relating the delay with DM and
$k=4148.808 \; \mathrm{s\; MHz^2 \; cm^3\; pc^{-1}\; }$
is the dispersion constant relating the delay with DM and $\nu$
.
$\nu$
.
3.3. Caveats and improvements
The header of the cutout dataset is partly inherited from the original dataset. There could be missing or wrong entries that need to be properly fixed, and this is done in the logfile to avoid manipulating the rigid filterbank-format structure. In this section, we focus on some caveats regarding the NC–FRB data.
The recorded observation start time reported in the header of the cutout dataset is the one of the original dataset. For independent calculation of the absolute ToA, which would be otherwise not possible, a keyword indicating the cutout starting time is added in the logfile. For 4 out of 29 datasets the starting time was not correctly written in the header due to technical issues during the data acquisition. In such cases, the observation date was fixed in the logfile, but the absolute ToA of the FRB cannot be properly recovered, therefore a warning note and a value of $\mathrm{ToA}=-1$
are reported.
$\mathrm{ToA}=-1$
are reported.
The current version (v. 1.0) of archivist performs the fitting of the burst profile with a single Gaussian function. However, the shape of FRB profiles may depart from a simple Gaussian function, exhibiting for example decaying tails or secondary bursts (e.g. Thornton et al. Reference Thornton2013; Champion et al. Reference Champion2016; Zhu et al. Reference Zhu2020; Jankowski et al. Reference Jankowski2023). In general, the Gaussian profile is an adequate representation of the NC–FRB profiles observed to date, as also indicated by the typical $\chi_\mathrm{red}^2 \sim 1$
. Nonetheless, as shown in Figure 4 as an example, the profile of FRB20220912A observed on 22 August 2023 exhibits a decaying tail. In this case, the Gaussian profile is not able to fully reproduce the tail, yielding a worse
$\chi_\mathrm{red}^2 \sim 1$
. Nonetheless, as shown in Figure 4 as an example, the profile of FRB20220912A observed on 22 August 2023 exhibits a decaying tail. In this case, the Gaussian profile is not able to fully reproduce the tail, yielding a worse $\chi_\mathrm{red}^2 \sim 1.74$
. More complex fitting functions could become necessary as the number of bursts detected by the NC with non-Gaussian morphologies increase. Accordingly, future releases of archivist may include alternative models to better reproduce the observed profiles.
$\chi_\mathrm{red}^2 \sim 1.74$
. More complex fitting functions could become necessary as the number of bursts detected by the NC with non-Gaussian morphologies increase. Accordingly, future releases of archivist may include alternative models to better reproduce the observed profiles.
Diagnostic plots for FRB20220912A (observation of 22 August 2023). The FRB profile shows a decaying tail that is not adequately reproduced by the considered Gaussian profile.

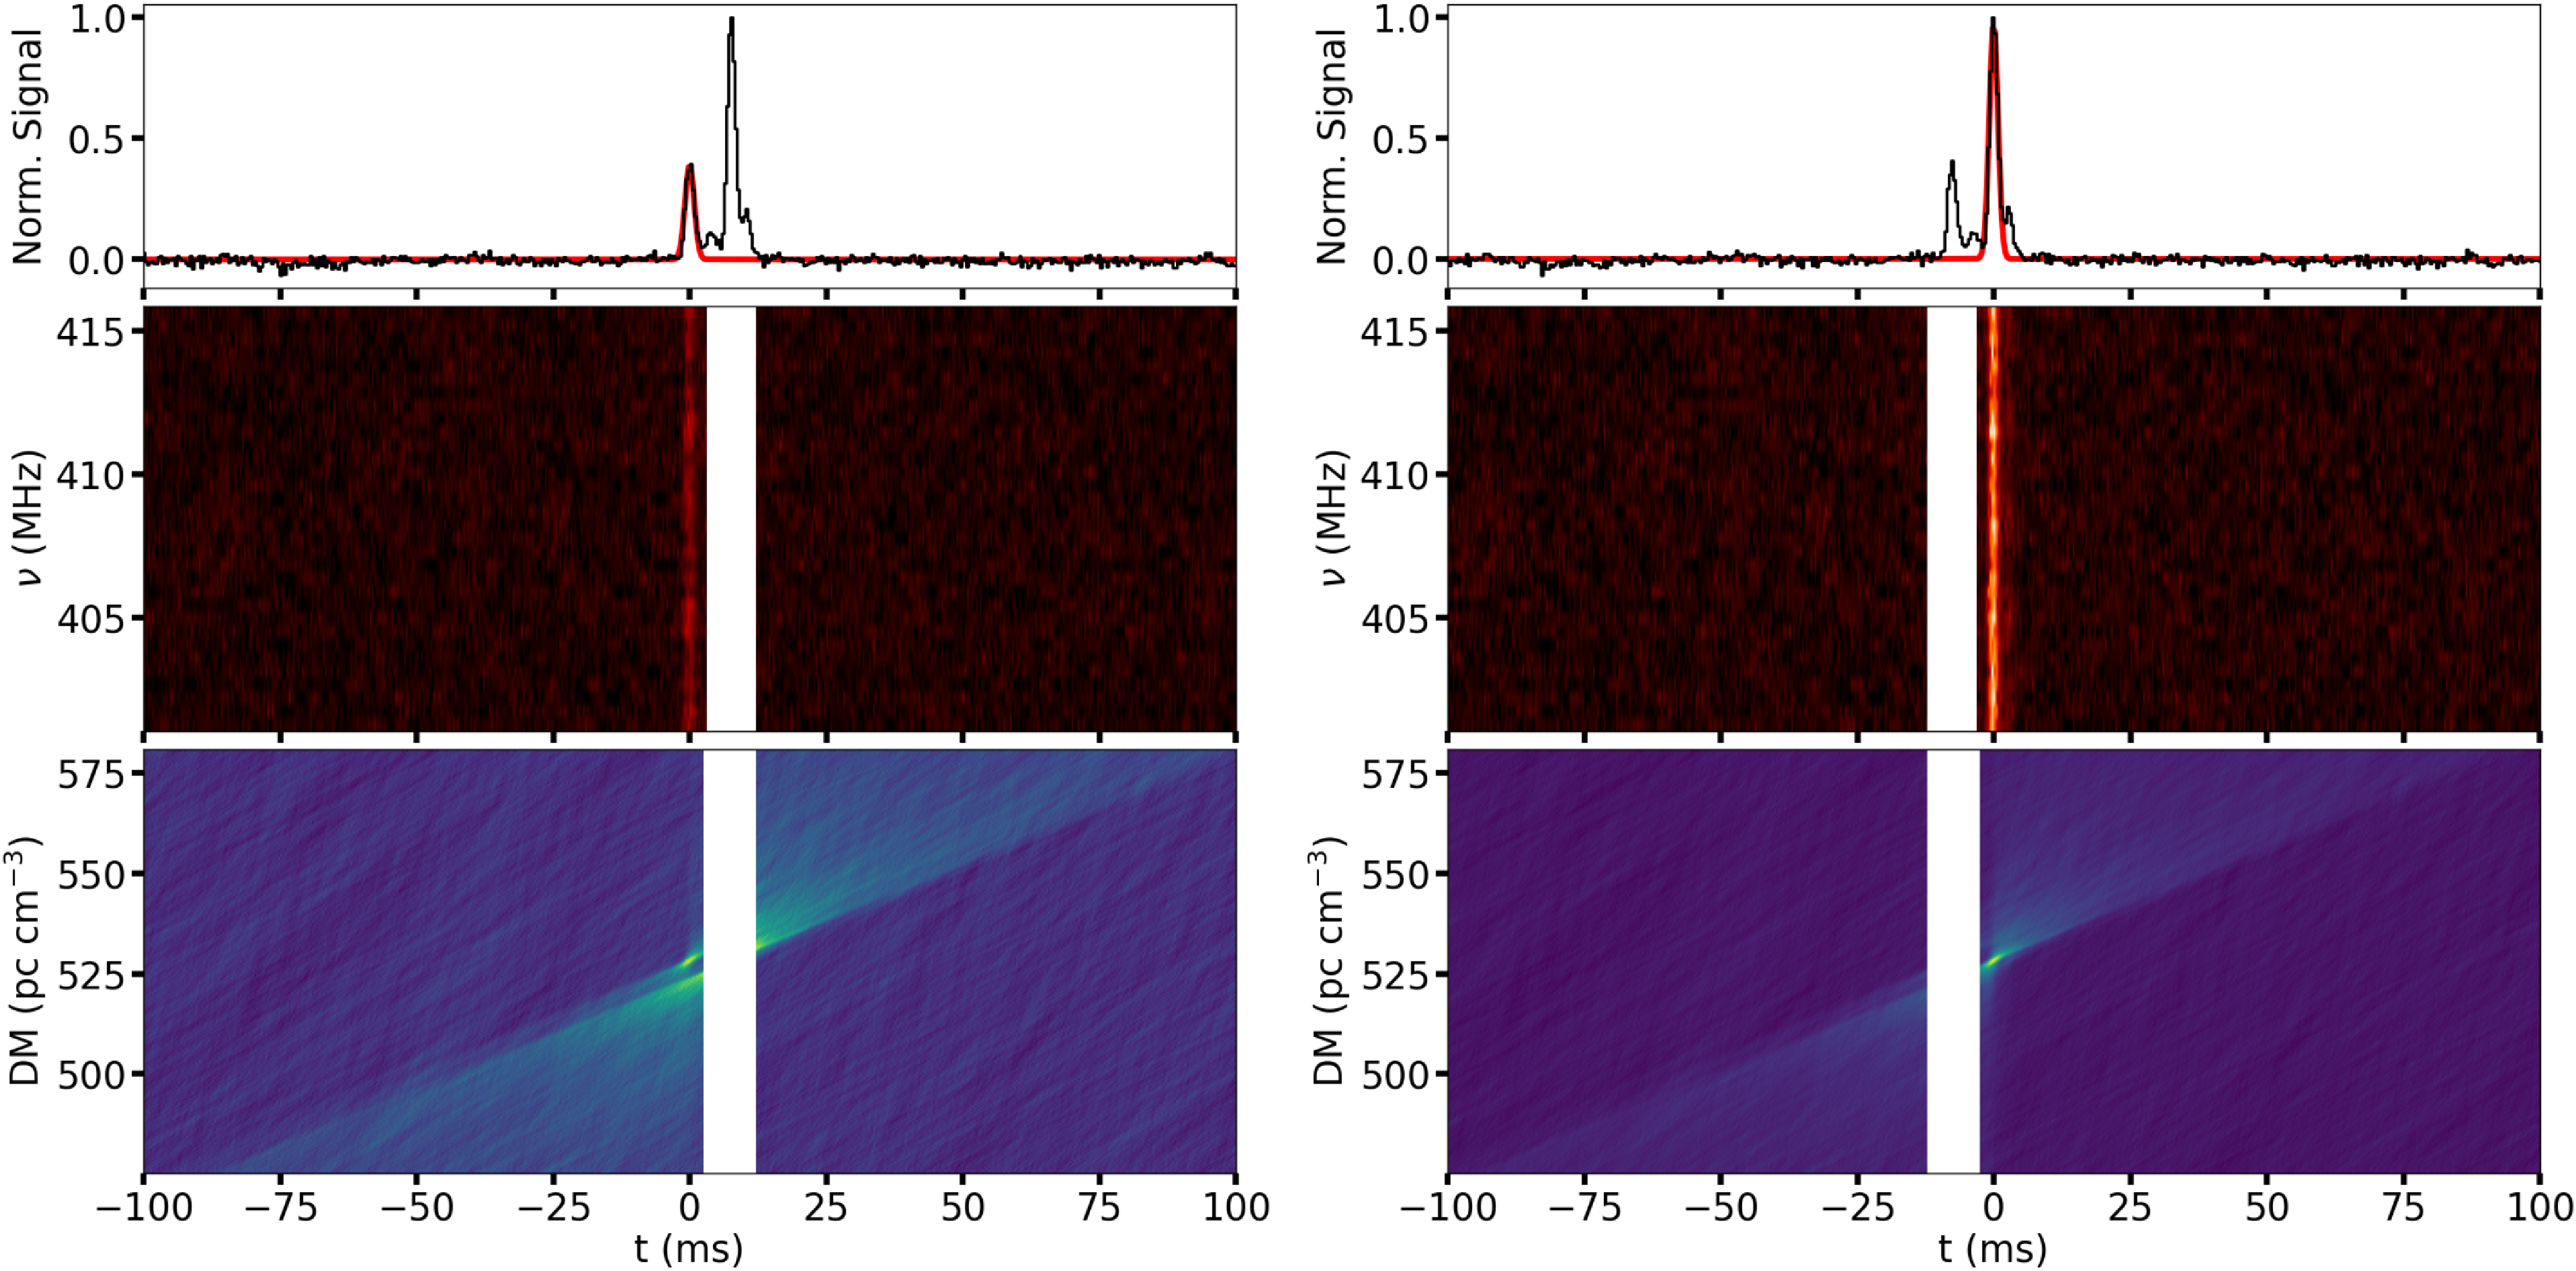
When dealing with sub-bursts, archivist includes the possibility of temporal masking, which reduces contamination and improves the fit goodness of a specific burst. As a representative example, we reported in Figure 5 the case of FRB20240114A (observation of 17 March 2024), which shows multiple close sub-bursts. We fitted the two brightest bursts separately with a Gaussian function, while masking the other peaks to improve the fidelity of the fit. The two secondary bursts remain currently unmodelled in our analysis. Although not implemented in archivist, a possible strategy for dealing with close sub-bursts is the simultaneous fitting of multiple Gaussian components.
Diagnostic plots for FRB20240114A (observation of 17 March 2024) showing sub-structure in the time series. The two main bursts were fitted separately after masking. The white stripes in the dynamic spectrum and butterfly diagram indicate the masked time bins during fitting of each considered burst.

We stress that the FRB shape depends on the temporal resolution. While the performed temporal downsampling improves the burst SNR, possible sub-structures might be smoothed. Studying the burst profiles at high resolution is beyond the scope of the present work, but this will be possible for INCART users thanks to the availability of cutout data saved at the temporal resolution of $\tau_\mathrm{samp}=138 \; \mathrm{ \unicode{x03BC} s}$
.
$\tau_\mathrm{samp}=138 \; \mathrm{ \unicode{x03BC} s}$
.
4. Discussion
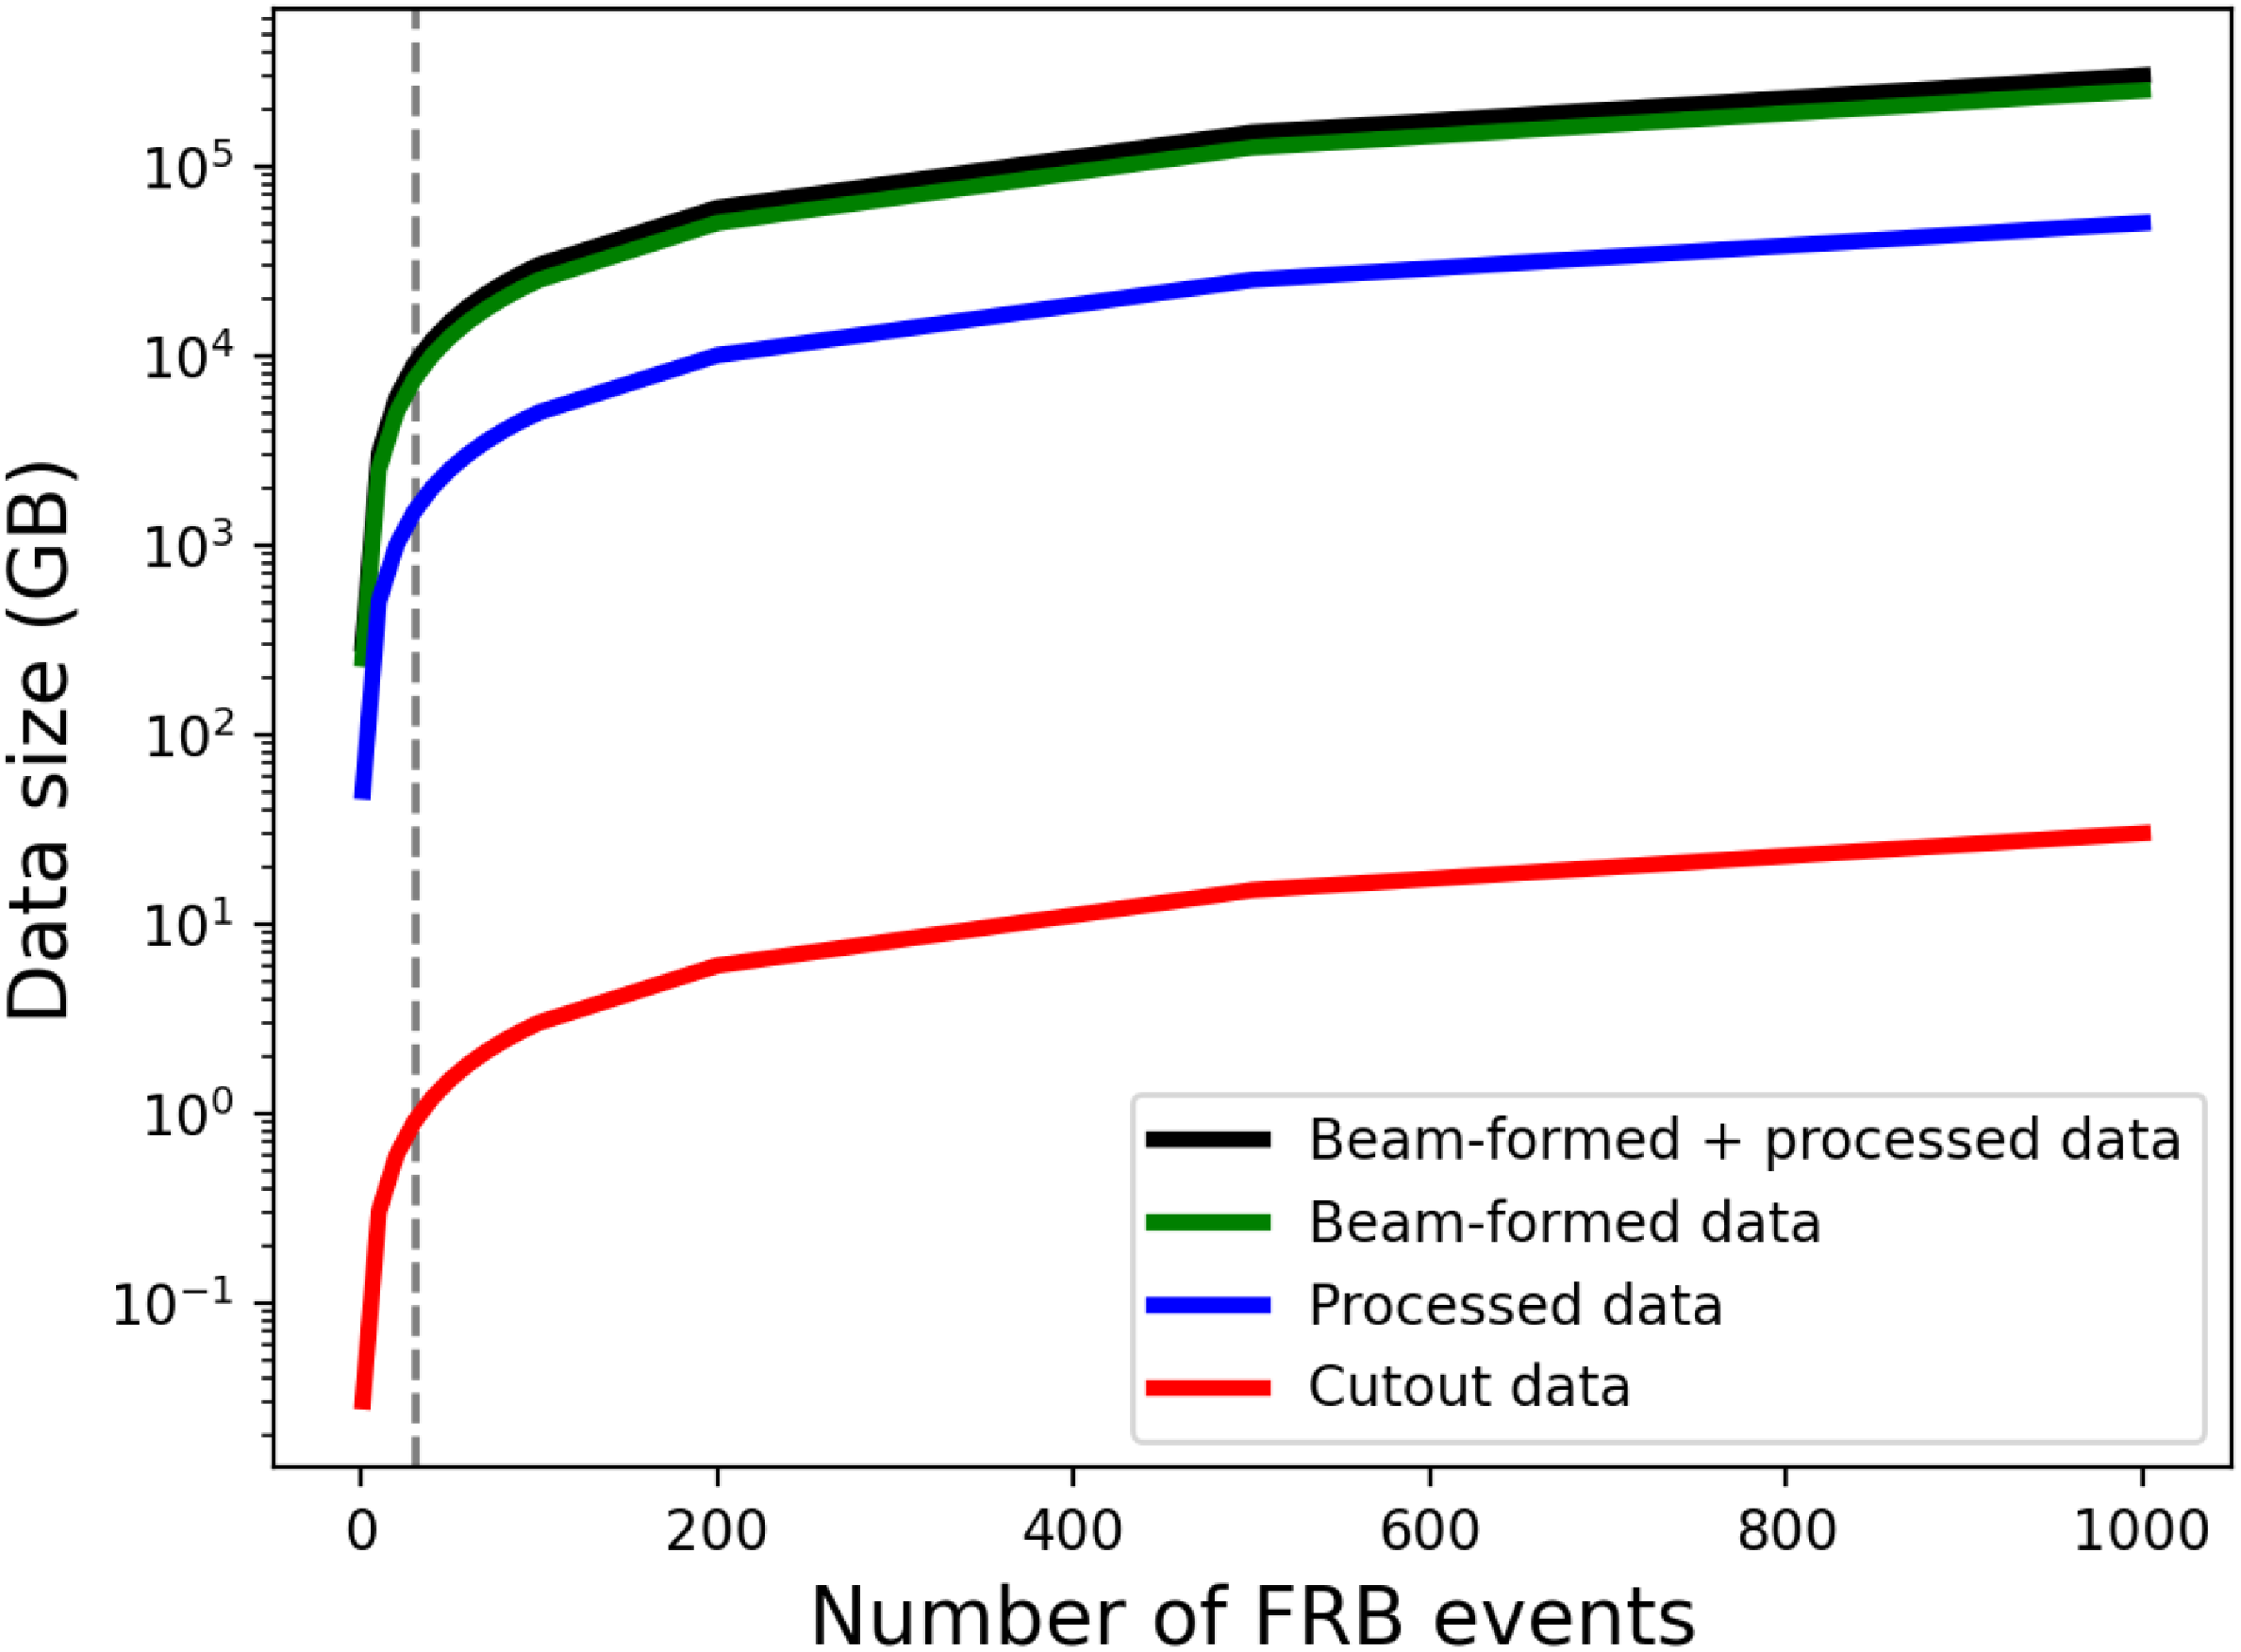
Data storage is nowadays a key challenge of all radio observatories. Depending on the data format, several techniques have been developed to efficiently reduce the data size. The data stored in INCART are in filterbank format and consist of short cut outs (a few seconds) around the burst. This procedure of temporal extraction from the entire observation allows us to save a remarkably large amount of disk space, as shown in Figure 6. Based on the current data rate (see Section 2), we estimate that with 900 FRB events (a factor of 30 higher than the present NC detections), the beam-formed plus processed filterbank datasets would occupy a volume of $\sim$
260 TB (with the processed data being
$\sim$
260 TB (with the processed data being $\sim$
40 TB). Such number of detections are expected to be reached within
$\sim$
40 TB). Such number of detections are expected to be reached within $\sim$
6 yr after the NC upgrade completion (Locatelli et al. Reference Locatelli2020). The cutout strategy, with consequent removal of beam-formed and processed datasets, reduces the data size by a factor of
$\sim$
6 yr after the NC upgrade completion (Locatelli et al. Reference Locatelli2020). The cutout strategy, with consequent removal of beam-formed and processed datasets, reduces the data size by a factor of $\sim$ $10^4$
, thus optimising the data volume for long-term storage.
$10^4$
, thus optimising the data volume for long-term storage.
Expected data size with increasing number of FRB detections from the NC. Curves report data sizes for total beam-formed plus processed (black), beam-formed (green), processed (blue), and cutout (red) data based on typical single data size of present NC observations. The vertical line refers to the number of FRBs detected as of the end of 2025.

Different solutions have been adopted by other international FRB detectors for data access, which is typically limited to short fractions of the total observing time to contain the large data volume. For a comparison with INCART, we provide an overview of the services offered by some facilities. The Canadian Hydrogen Intensity Mapping Experiment (CHIME; Bandura et al. Reference Bandura, Stepp, Gilmozzi and Hall2014; CHIME Collaboration et al. Reference CHIME2022) provides open access both to a databaseFootnote e presenting derived physical quantities and to the Canadian Advanced Network for Astronomical Research (CANFARFootnote f ) collecting dynamic spectra in hierarchical data format (HDF5) for diagnostic inspection. For some events, HDF5 advanced data products are also made public for independent re-analysis (CHIME/FRB Collaboration et al. 2024). The MeerTRAP project (Sanidas et al. Reference Sanidas, Weltevrede, Perera, Preston and Sanidas2018) performs a real-time, commensal transient search with MeerKAT and reports discovery products via publications and the SARAOFootnote g archive. However, a public database similar to those by CHIME and the NC has not yet been announced. The Australian Square Kilometre Array Pathfinder (ASKAP) monitoring through the Commensal Real-time ASKAP Fast Transients (CRAFT; Scott et al. Reference Scott2025) survey provides a public archiveFootnote h with dynamic spectra as NumPy-format arrays and diagnostic products. For selected events, raw voltages and processed data enabling independent re-analysis are also available. Finally, Zhang et al. (Reference Zhang2020) developed a database tailored for the Parkes radio telescope. Specifically, the stored data products include small data segments containing single pulse signals (both candidate transient phenomena and RFI) obtained from reprocessing of archival observations with advanced homogeneous methods. In summary, regardless of the variety of formats for the data products, INCART aligns with the strategies adopted by other services, aiming at limiting the data volume and offering manageable datasets.
5. Summary and conclusions
In this work, we presented INCART, a public online repository that provides the community with access to advanced data products of FRB events detected by the NC radio telescope. Specifically, INCART collects the catalogue of NC-FRBs, which can be consulted online or downloaded in FITS format, and manageable processed datasets in filterbank format suitable for independent analysis of the FRB properties. As the physical parameters were derived through homogenous procedures (Sections 3.1, 3.2) that might not be optimal for complex bursts, such independent analysis may include, for instance, fitting the FRB with alternative profiles beyond a simple Gaussian, or investigating possible sub-structure at high temporal resolution (Section 3.3). Moreover, the usage of the NC-FRB data products in synergy with those from other detectors enables, for example, multi-epoch and multi-frequency studies of FRBs.
The large data volume to be stored, which is a common challenge for all radio facilities and especially FRB detectors observing at high temporal resolution, is handled by saving in INCART only short time segments of interest. This strategy guarantees the optimisation of the disk space for long-term storage (Section 4). Furthermore, in the view of the planned transient real-time buffer (Naldi et al. Reference Naldi2025), improved real-time searching algorithms are under development (Camilleri et al. Reference Camilleri2026), which will also reduce the short-term data size.
In conclusion, the scalable design of INCART will also ensure access to the FRB data products of the NG-Croce in the next years. The incoming upgrade of the NC will significantly improve the instrumental capabilities, allowing the exploitation of all N-S cylinders, the E-W arm, and the multi-beam observing mode. These will lead to improvements in sensitivity, field of view, and localisation, further enhancing the scientific role of the NC-FRB project and the value of its data products for the community.
Acknowledgements
The authors thank the referee for carefully reading our manuscript and providing valuable comments and suggestions. LB acknowledges F. Bedosti, G. Lorenzo, A. Magro, and N. Ragno for IT support and suggestions. The research activities described in this paper were carried out with contribution of the NextGenerationEU funds within the National Recovery and Resilience Plan (PNRR), Mission 4 – Education and Research, Component 2 – From Research to Business (M4C2), Investment Line 3.1 – Strengthening and creation of Research Infrastructures, Project IR0000026 – Next Generation Croce del Nord. This research made use Astropy, a community-developed core Python package for Astronomy (Astropy Collaboration et al. Reference Collaboration2013; Astropy Collaboration et al. Reference Collaboration2018), Matplotlib (Hunter Reference Hunter2007), NumPy (Harris et al. Reference Harris2020), SciPy (Virtanen et al. Reference Virtanen2020). This research made use of SigPyProc (https://github.com/FRBs/sigpyproc3), a Python package for FRB and pulsar data analysis.
Data availability statement
The data and corresponding products (catalogues, diagnostic plots, logfiles) described in this work can be retrieved via INCART. The same data are also accessible via the INAF Radio Data Archive. A simplified version of the archivist pipeline performing key steps of the FRB analysis chain will be shared upon request.
 max
max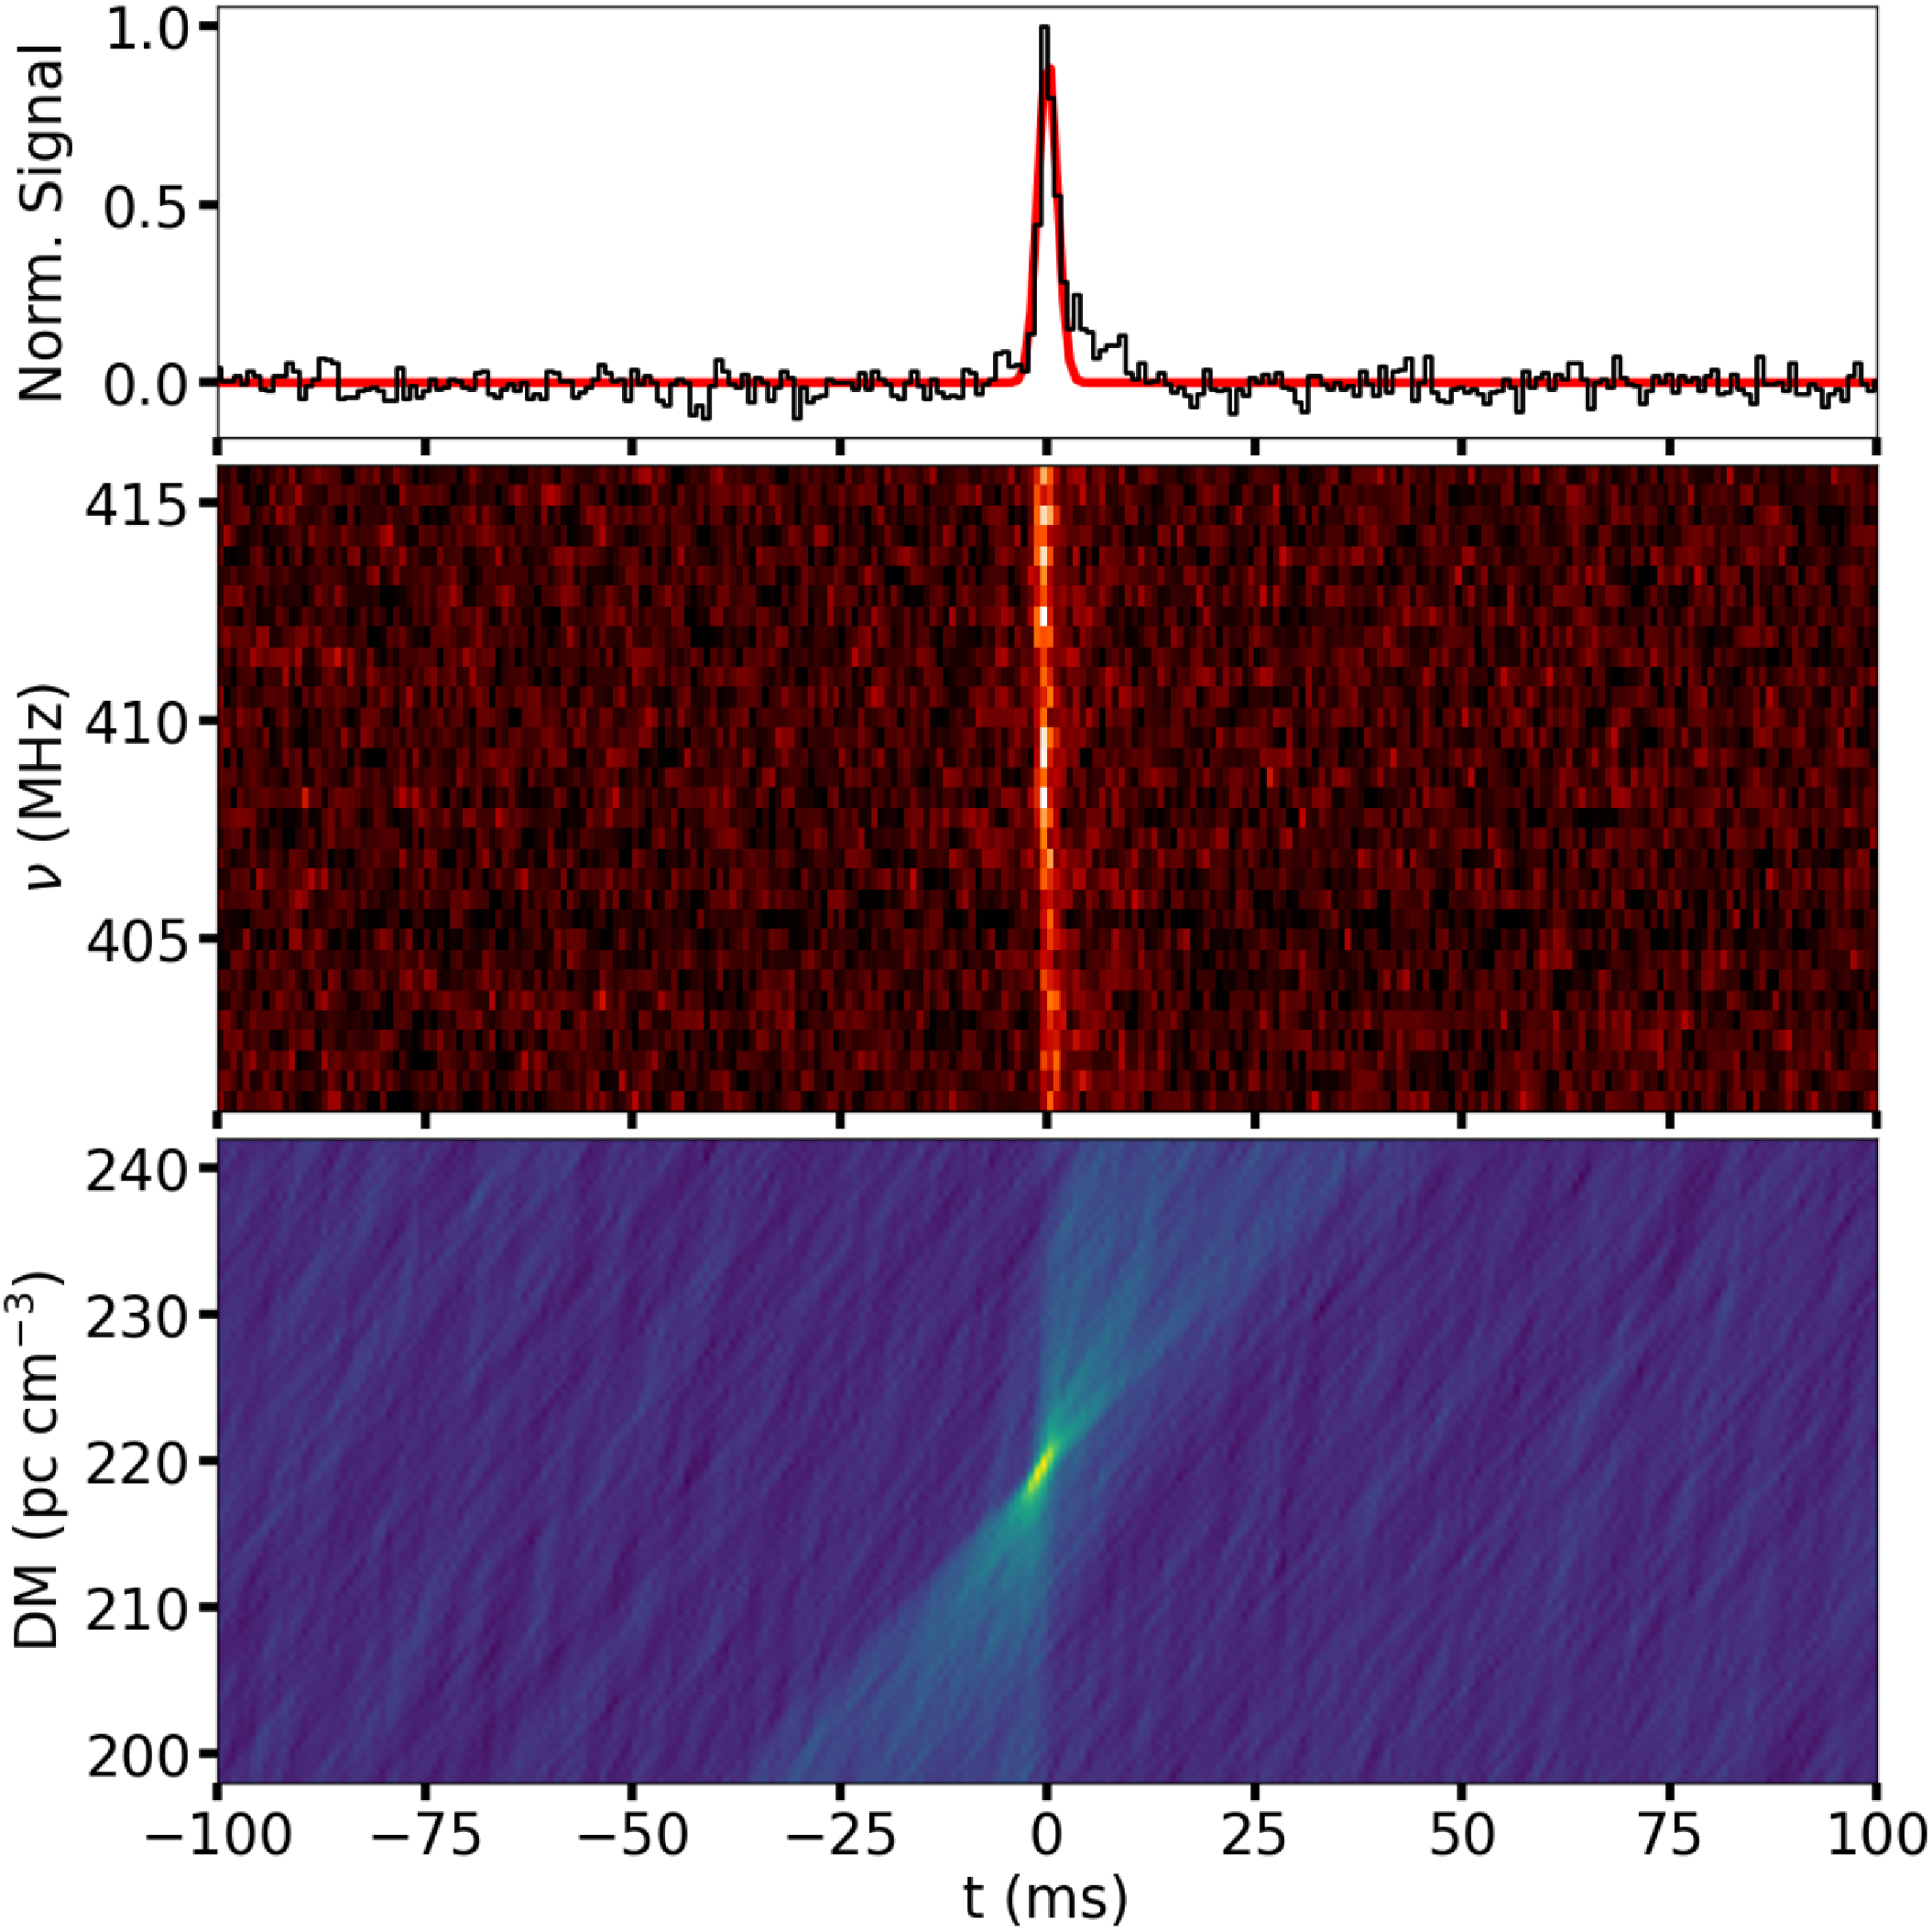

 Open access

