


1. Introduction
The world population is predicted to approach 11 billion by 2100 [The World Bank (2022)]. This is more than a 50% increase compared to today's population. The largest growth is expected in sub-Saharan Africa (SSA) with a quadrupling of the population by 2100. Reducing population growth is important from the perspective of reducing environmental pressures and respecting planetary boundaries [Crist et al. (Reference Crist, C. and R.2017)], and in the light of the link between high population growth on the one hand and economic stagnation, maternal mortality, and political unrest on the other hand [Bongaarts (Reference Bongaarts2016)]. The demographic transition model is one of the most influential theories explaining global population dynamics from high birth and death rates to low birth and death rates [Thompson (Reference Thompson1929)]. According to this model, reducing fertility rates is crucial in slowing-down population growth. Different theories exist on the key factors that influence fertility decline, including theories that emphasize (i) risk and mortality, (ii) the cultural diffusion of fertility norms, and (iii) the economic costs and benefits of investing in self and children [Shenk et al. (Reference Shenk, Towner, Kress and Alam2013)]. Research suggests that important synergies exist between these theories. The economic and investment theory emphasizes increased demand for human capital to be the main trigger for fertility decline. At the macro-level, declining fertility rates have been shown to be correlated with an increase in the investment in human capital in countries who passed the demographic transition [Galor (Reference Galor2012)]. At the household level, parents make trade-offs on how many children to have and how much to invest in each of them [Kugler and Kumar (Reference Kumar and Kugler2011)]. This mechanism, which has become an important motivation for family planning policies in many countries with high prevailing fertility rates, has been called the quantity–quality (QQ) trade-off.
The literature documents this QQ trade-off with both theoretical as well as empirical studies. Theoretical studies propose a wide range of microeconomic models on the QQ trade-off, first introduced by Becker (Reference Becker1960). Empirical studies analyzing the QQ trade-off often focus on education as an indicator of the quality of childrearing and find mixed results [Clarke (Reference Clarke2018)]. It is crucial, from both a theoretical and policy perspective, to investigate whether this QQ trade-off exists at household level in SSA, because if high fertility rates and low schooling rates go hand in hand, future generations will be less educated and have more children. Moreover, in many parts of the world, parents have specific preferences for boys over girls, and these preferences may differ for husbands and wives [Norling (Reference Norling2018)]. This gender bias to the disadvantage of girls may also occur in making QQ decisions. This can contribute to high fertility rates and impede the demographic transition in SSA because if girls are less educated than boys, female empowerment and women's opportunity cost to raise more children will remain low in future generations [Atake and Gnakou Ali (Reference Atake and Gnakou Ali2019)]. No study has yet revealed the existence of a gender bias in the QQ trade-off.
The literature indicates that fertility behavior is the result of the ability of women to implement their fertility intentionsFootnote 1 [Hin et al. (Reference Hin, Gauthier, Goldstein and Bühler2011), Günther and Harttgen (Reference Günther and Harttgen2016), Cleland et al. (Reference Cleland, Machiyama and Casterline2019), Yeatman et al. (Reference Yeatman, Trinitapoli and Garver2020)]. However, in rural SSA there is still a large gap between fertility intentions and fertility outcomes due to a large prevalence of unwanted fertility [The World Bank (2022)]. It is therefore important to study fertility behavior in general, and the existence of a QQ trade-off in specific, from not only a fertility outcome, but also a fertility intention perspective. To our knowledge, no study has yet looked at the QQ trade-off from an intention perspective. Most empirical studies assume that intentions are exogenously given and focus on analyzing changes in the constraints [Zakharenko (Reference Zakharenko2021)].
This is the first study that examines the existence of (i) a QQ trade-off from an intention perspective and (ii) a possible twofold gender bias in these intentions by gender of the child and/or by gender of the parent. We rely on Galor's (Reference Galor2012) modified theoretical collective household model to understand the QQ trade-off conceptually and to derive testable predictions, which we test empirically using a discrete choice experiment (DCE). A DCE is a survey-based method to reveal people's latent intentions. The DCE was conducted among 426 respondents in the age category 18–25 years in six rural districts in the Southern Nations, Nationalities, and People's Region of Ethiopia, with the aim of studying fertility intentions ex ante (i.e., before completing the reproductive lifetime). In our DCE, both men and women are asked to choose between different hypothetical scenarios, which describe the number of boys and girls and how they would be raised in terms of education. We use mixture-amount models to design the experiment, mixed logit models to evaluate the fertility intentions, and Wald tests and marginal rates of substitution to analyze the existence of the QQ trade-off. This paper brings some particular innovations and contributions to the literature on fertility in low- and middle-income countries.
First, different methods have been used to study the QQ trade-off in childrearing, with most studies focusing on fertility outcomes and unidirectional effects. A first group of studies focus on the effect of fertility on education, either using (i) randomized control trials, e.g., looking at the effect of policy reforms on fertility to quantify the effect of fertility on quality of childrearing [Ananat et al. (Reference Ananat, Gruber, Levine and Staiger2009), Ananat and Hungerman (Reference Ananat and Hungerman2012), Zhong (Reference Zhong2017)]; or (ii) quasi-experimental approaches with regression discontinuity designs or instrumental variables such as fertility shocks (i.e., instruments related to the ability to control conception), the occurrence of twins or the gender composition of children [Miller (Reference Miller2009), Angrist et al. (Reference Angrist, Lavy and Schlosser2010), Black et al. (Reference Black, Devereux and Salvanes2010), Becker et al. (Reference Becker, Cinnirella and Woessmann2010), Kugler and Kumar (Reference Kumar and Kugler2011), Millimet and Wang (Reference Millimet and Wang2011), Marteleto and de Souza (Reference Marteleto and de Souza2012), Ponczek and Souza (Reference Ponczek and Souza2012), Fitzsimons and Malde (Reference Fitzsimons and Malde2014)]. A second group of studies focus on the effect of parental education on fertility [Buyinza and Hisali (Reference Buyinza and Hisali2014), Shapiro and Tenikue (Reference Shapiro and Tenikue2017), Colleran and Snopkowski (Reference Colleran and Snopkowski2018)]. We could identify only one study that analyzes the QQ trade-off in both directions simultaneously, which is the study by de la Croix and Perrin (Reference de la Croix and Perrin2018) that uses structural equation modelling. Our study takes a different approach and uses a DCE to analyze the QQ trade-off from an intention perspective, which is important as intentions are a key determinant in household-level decisions [Fishbein and Ajzen (Reference Fishbein and Ajzen2011)]. We estimate the QQ intentions jointly, which is in line with the notion that decisions toward quantity and quality of childrearing are made simultaneously [Cinnirella (Reference Cinnirella, Diebolt, Rijpma, Carmichael, Dilli and Störmer2019)]. We focus on education as an indicator for the quality of childrearing because other quality indicators are often considered to be a precondition for children's school performance. Moreover, we contribute to the current empirical evidence focusing on SSA, which is scarce and only analyzes the QQ trade-off from a fertility outcomes perspective. Some recent studies in SSA find evidence for the QQ trade-off [Temel (Reference Temel2013), Bougma et al. (Reference Bougma, LeGrand and Kobiané2015), Vogl (Reference Vogl2016), Ito and Tanaka (Reference Ito and Tanaka2017)] whereas others point to a lack of evidence [Eloundou-Enyegue and Giroux (Reference Eloundou-Enyegue and Giroux2012), Kravdal et al. (Reference Kravdal, Kodzi and Sigle-Rushton2013), Alidou and Verpoorten (Reference Alidou and Verpoorten2019)].
Second, fertility intentions may be gendered in two ways, according to the gender of the child and according to the gender of the parent. The gender gap in preference for sons or daughters is extensively studied empirically in South-(East) Asia. However, research in SSA is limited. Regarding the gender of the child, the evidence points to a preference for boys' education over girls' education in SSA, including Ethiopia [Kazeem et al. (Reference Kazeem, Jensen and Stokes2010), Mani et al. (Reference Mani, Hoddinott and Strauss2013), Tesfu and Gurmu (Reference Tesfu and Gurmu2013), Taş et al. (Reference Taş, Reimão and Orlando2014), Kuépié et al. (Reference Kuépié, Shapiro and Tenikue2015), Bérenger and Verdier-Chouchane (Reference Bérenger and Verdier-Chouchane2016), Vimefall et al. (Reference Vimefall, Andrén and Levin2017)]. However, there is mixed evidence on preference for boys or girls in Ethiopia and SSA in general [Basu and De Jong (Reference Basu and De Jong2010), Fuse (Reference Fuse2010), Mekonnen and Worku (Reference Mekonnen and Worku2011), Rossi and Rouanet (Reference Rossi and Rouanet2015), Berlie and Alamerew (Reference Berlie and Alamerew2018), Eliason et al. (Reference Eliason, Baiden, Tuoyire and Awusabo-Asare2018), Flato (Reference Flato2018), Norling (Reference Norling2018), Chao et al. (Reference Chao, Gerland, Cook and Alkema2019)]. Regarding the gender of the parent, few studies consider individual-level preferences. Some recent studies in SSA find that men report higher fertility, son, and human capital preference than women [Sahn et al. (Reference Sahn, Stifel, Sahn and Stifel2010), Norling (Reference Norling2018), Ibrahim and Arulogun (Reference Ibrahim and Arulogun2019)]. To our knowledge, there is only one study on child-gendered preferences in the QQ trade-off in SSA in particular [Alidou and Verpoorten (Reference Alidou and Verpoorten2019)]. This study estimates a causal relation, considers only gender preferences in education, and uses historical data. Our paper goes beyond previous studies by jointly analyzing intentions for quantity and quality and focusing on twofold gender biases, based on experimental data.
Third, to measure fertility intentions, previous studies have employed direct questions such as the ideal or desired family size, the wanted fertility, the wanted status of recent births, and desire for more children [Bongaarts (Reference Bongaarts2011)]. These measures have several drawbacks: nonresponse, rationalization, problems with comparison, and influence by factors other than family size intention [Field et al. (Reference Field, Molitor, Schoonbroodt and Tertilt2016)]. To our knowledge, we are the first to apply a DCE method to study fertility intentions and thereby circumvent these disadvantages in analyzing fertility intentions. The strength of the DCE method is that strategic bias and yeah saying is less likely and that it allows to analyze trade-offs in intentions. The DCE is designed using a mixture-amount model. This model is highly appropriate to jointly disentangle the intention for different types of education (i.e., the mixture or quality) and the preferred family size (i.e., the amount or quantity), and is based on pioneering work of some authors [Raghavarao and Wiley (Reference Raghavarao and Wiley2009), Khademi and Timmermans (Reference Khademi and Timmermans2012), Ruseckaite et al. (Reference Ruseckaite, Goos and Fok2017), Goos and Hamidouche (Reference Goos and Hamidouche2019), Zijlstra et al. (Reference Zijlstra, Goos and Verhetsel2019)].
Finally, the focus on Ethiopia to study the existence of the QQ trade-off is particularly relevant. Ethiopia is the 12th most populous country in the world and the 2nd in SSA, coupled with low school completion rates (completion rate of 54% in primary, 29% in secondary, and 8% in tertiary education) and a large gender gap in school enrolment rates (expected years of schooling of 8.3 years for girls and 9.1 years for boys) [The World Bank (2022)]. The majority of households face budget constraints, child labor is still common and the provision of high-quality public education is low, implying that the opportunity cost of education is high [Alidou and Verpoorten (Reference Alidou and Verpoorten2019)]. With a current total fertility rateFootnote 2 of 4.1 births per woman, Ethiopia is believed to have reached the end of the second stage of the demographic transition and to enter the third or late transitional stage. How fast the transition will go and how large the resulting population expansion will be crucially depend on how fast fertility rates will drop.
The remainder of the paper is structured as follows: section 2 presents the conceptual framework linking fertility intentions to behavior and outlines the theoretical framework to understand the theoretical basis of the QQ trade-off and to derive testable predictions. Section 3 describes the dataset, the DCE design, and estimation strategy. Section 4 presents results on the fertility intentions and the QQ trade-off. Section 5 discusses the results and provides policy recommendations. Section 6 summarizes and concludes.
2. Concepts and theory
2.1 Linking fertility intentions to outcomes
Fertility intentions can indicate the degree of voluntary control over reproductive outcomes, and are therefore important for analyzing individual fertility behavior [Hin et al. (Reference Hin, Gauthier, Goldstein and Bühler2011), Günther and Harttgen (Reference Günther and Harttgen2016), Cleland et al. (Reference Cleland, Machiyama and Casterline2019), Yeatman et al. (Reference Yeatman, Trinitapoli and Garver2020)]. Different theories exist about the link between intentions and actual behavior [see Kodzi et al. (Reference Kodzi, Johnson and Casterline2010) for an overview]. We draw on the theory of reasoned action and planned behavior (Figure 1), which explains the mechanism leading to the formation of intentions and the interrelation between intentions and subsequent behavior [Fishbein and Ajzen (Reference Fishbein and Ajzen2011)]. This theory states that attitudes toward behavior, subjective norms, and perceived behavioral controlFootnote 3 jointly affect the intention to act, which are, to the extent that people are in reality capable of attaining their intentions or have actual control, expected to result in the behavior in question. The three factors affecting intentions are determined by individual, social, and information-related factors. According to this theory, intentions explain most of the variability in observed behavior.
Conceptual framework based on Fishbein and Ajzen (Reference Fishbein and Ajzen2011).

The theory of reasoned action and planned behavior has been used and adapted in the fertility literature [Miller et al. (Reference Miller, Severy and Pasta2004), Liefbroer (Reference Liefbroer2011), Ajzen and Klobas (Reference Ajzen and Klobas2013)]. Personal attitudes are similar to the concept of fertility desires. Perceived norms resemble norms of social groups (e.g., neighborhood, religion, ethnicity, etc.). Perceived behavioral control equals the control one believes to have taking into account the availability and knowledge of contraceptives; financial, time, and institutional constraints; and rates of child mortality. Intentions can be thought of as desires to have children taking into account personal attitudes, perceived norms, and perceived behavioral control. In the empirical section of the paper, we measure these fertility intentions.
2.2 Theoretical quantity–quality framework
Three micro-economic theories exist that aim to explain the main triggers for the fertility decline along the demographic transition: (i) the risk and mortality theory, (ii) the cultural diffusion theory, and (iii) the economic and investment theory. The QQ trade-off originates from the latter theory which was founded by Becker (Reference Becker1960).Footnote 4 Becker argues that technological progress leads to an increased demand for human capital and a corresponding increase in the opportunity cost of parenthood, resulting in a reallocation of these resources from the quantity to the quality component of childrearing, and hence a QQ trade-off. Despite the critique on the Beckerian school that budget and time resources are not the only constraints people face [Blake (Reference Blake1968), Sawhill (Reference Sawhill1977)], the original theoretical underpinnings are useful to understand the QQ trade-off conceptually. We point to other possible perceived constraints in the conceptual discussion above and take these implicitly into account in the empirical analysis by measuring intentions in our DCE.
Becker's theory was later extended by Becker and Lewis (Reference Becker and Lewis1973), Willis (Reference Willis1973), Becker and Tomes (Reference Becker and Tomes1976), Becker et al. (Reference Becker, Murphy and Tamura1990), and Moav (Reference Moav2005) [see Doepke (Reference Doepke2015) for an overview]. Whereas former theories model the demographic transition from stagnation to modern economic growth as discontinuous changes, recently much more attention goes to the unified growth theory that models this transition in a single framework. We present a simple extension to the unified growth model of Galor (Reference Galor2012) to understand the QQ trade-off conceptually and to derive testable predictions which we analyze empirically. We extend the model in two dimensions. First, we extend the model to allow for gendered intentions for the number of children and their educational level. We do not assume an a priori asymmetry in gender intentions, unlike other models who relate son intentions to a gender wage gap or low female labor participation and gender differences in education to the time cost for childbearing which only accrue to women [Echevarria and Merlo (Reference Echevarria and Merlo1999), Hazan and Zoabi (Reference Hazan and Zoabi2015), Guo and Yu (Reference Guo and Yu2017), Japaridze (Reference Japaridze2019), Dao et al. (Reference Dao, Avila and Greulich2021)]. Second, following the suggestion of Retherford (Reference Retherford1985), we allow for satiated intentions for the number of children and education, because we assume that having more children or education does not necessarily result in more utility, unlike previous studies who assume that the utility parents derive from childrearing follows a logarithmic distribution.
Consider a two-parent collective household model where both parents have their own preferences. Both parents get utility from their own consumption (c), the number of surviving children and their gender mix (ni), and the gender-specific human capital (hi) where i refers to boys (b) or girls (g):

where δ is the weight of children in the utility function, ζ, θ, ϑ, κ, μ, ν, ρ, ϱ are the preferences for the number of sons and daughters and their human capital respectively, λ is the preference for human capital and δ, λ ∈ [0,1] and ζ, θ, ϑ, κ, μ, ν, ρ, ϱ ∈ ${\rm {\opf N}}_0^ +$ . Parents are willing to invest both money and time in childrearing, in competition with alternative uses of time and money. Hence, parents maximize their utility subject to their budget and time constraints:


where y is the household's potential income, τ is the fraction of the household's unit-time endowmentFootnote 5 for raising children with education level (quality) e i, with τ q the fraction of the household's unit-time endowment required to raise a child, regardless of quality, and τ e is the fraction of the household's unit-time endowment required for each unit of education per child. An individual with gender i's level of human capital (hi) is assumed to be a function of the level of education of gender i (ei) and the rate of technological progress (t)Footnote 6:

For simplicity and in line with our empirical focus on fertility intentions at a certain point in time, we assume that fertility decisions are made at once. Making the maximization process a sequential process to emphasize the role uncertainty plays in parental choice, similar to Namboodiri (Reference Namboodiri1972), Japaridze (Reference Japaridze2019), and Hazan and Zoabi (Reference Hazan and Zoabi2015), would not alter the outcomes of the model. The optimal solution to this problem, obtained by maximizing the utility in equation 1 subject to equations 3 and 4 implies that:

The proof is given in Appendix B. The optimal solution reveals four testable predictions. The first testable prediction of the model is the inverse relationship (i.e., trade-off) between quantity (n) and quality (e) which depends on preferences for quantity and quality and is non-linear. The second testable prediction is that this QQ trade-off can be different for boys or girls. In particular, equation 5 shows that fertility (n) will decrease when the gender education gap (eg/eb) improves toward more schooling for boys and/or girls and vice versa. The third testable prediction of this model is that parents may make a different QQ trade-off because we do not assume a unitary household model. The fourth and last testable prediction is that men and women have a different gender bias toward boys and girls when making the QQ trade-off.
In the empirical section of the paper, we investigate these four testable predictions using cross-sectional data from a DCE in rural Ethiopia where the demographic transition is ongoing. Since there is still a high prevalence of unwanted fertility in SSA, we study this QQ trade-off from an intention perspective by estimating intentions for quantity (n) and quality (e) simultaneously in contrast to previous studies who study the existence of a QQ trade-off between quantity (n) and quality (e) using data on fertility outcomes for both variables and unidirectional models.
3. Materials and methods
3.1 Research area and sampling
We use primary survey and DCE data from the Southern Nations, Nationalities, and People's Region in Ethiopia. We collected data in six districts in the Gamo Gofa and Segen People's Zones in this region (Figure 2). This is a predominantly rural area with high ethnic diversity (85 ethnic groups) [Central Statistical Agency (2012)]. The total fertility rate is 4.9 in the Gamo Gofa Zone and 5.6 in the Segen People's Zone [Central Statistical Agency (2012), Teklu et al. (Reference Teklu, Sebhatu and Gebreselassie2013)]. Net school attendance in the region is 73.8% for primary school and 16.4% for secondary school. The educational system in Ethiopia is visualized in Figure C1 in Appendix C.
Map of the study area in the Gamo Gofa Zone and Segen People's Zone within the Southern Nations, Nationalities, and People's Region in Ethiopia.

The sample comprises 434 respondents in the age category 18–25 years. The choice of the lower age limit is based on the sensitivity of under-18 marriage—the legal minimum age for marriage in Ethiopia is 18 years [Ethiopian Society of Population Studies (2008)]—and on the ethics of interviewing under-18s. The choice of the upper bound of the age group is based on the median age of first childbirth of 19.5 years in Ethiopia. Our focus minimizes bias due to rationalization for already having a certain number of children [Bongaarts (Reference Bongaarts2011)]. In addition, as fertility intentions have been shown to vary considerably over an individual's lifetime due to high existential uncertainty in SSA [Trinitapoli and Yeatman (Reference Trinitapoli and Yeatman2018)], we chose to elicit intentions of parents at the time they make the most crucial decisions. We used a three-stage sampling strategy. In the first stage, we selected 31 villages in the 6 districts in a stratified random way, with stratification based on district and agro-ecology (low, mid-, and highlands). In the second stage, we listed all households with members in the targeted age category in each of these 31 villages, and randomly selected a fixed number of 14 households from this list in each village. In the third stage, we randomly selected one of the household members relevant to each category within each selected household.
3.2 Choice experiment design
We investigate (i) latent fertility intentions using a DCE method that allows to analyze trade-offsFootnote 7, and (ii) self-expressed fertility intentions through follow-up questions to respondents on the preferred number of children after implementation of the DCE. A DCE is a method to reveal people's latent intentions in the form of a survey. It is based on the characteristic theory of value which states that individuals do not derive utility from a good/service as such, but from the characteristics of this good/service [Lancaster (Reference Lancaster1966)]. For example, parents do not derive utility from childrearing as such, but from the quantity and quality of children. It is a commonly used method in agricultural economics, health economics, and natural resource economics. In practice, respondents are confronted with several choice cards including two or more mutually exclusive alternatives (i.e., options) that are defined by a set of features (i.e., attributes) with varying levels, within and across the choice cards. By repeatedly asking respondents to reveal their most preferred option, one can—based on the random utility theory proposed by Thurstone (Reference Thurstone1927)—determine which attributes and levels contribute most to the respondents' utility and analyze potential trade-offs between attributes.
3.2.1 Attributes and attribute levels
Given the focus on the QQ trade-off in fertility intentions, the attributes include the number of children and how they would be raised in terms of education. As we measure intentions which are based on perceived constraints, no constraints are added as attributes. The number of children is represented as the sum of the number of boys and girls, and education as eight attributes related to schooling: the number of boys/girls not receiving any schooling and the number of boys/girls attaining a certificate at the end of primary, secondary, or tertiary schooling (Table 1). Secondary schooling includes both high school and preparatory school. Tertiary schooling comprises both technical and vocational schooling (TVET) and university because both entail higher costs due to (i) school fees (while primary and secondary schooling are free of charge) and (ii) transportation to and/or accommodation in larger cities where TVET and university institutions are located. The choice to focus on completing a certain level of education is based on the high drop-out ratio in primary (46%) and secondary school (71%) [The World Bank (2022)].
Attributes and their levels in the DCE

The attributes consist of discrete levels ranging from 0/1 to 12 children. The maximum total number of children is set at 12, a choice guided by the observed household size in the study area. Therefore, a constraint is added in the design of the DCE ensuring that the sum of the number of girls and boys distributed over the 4 education levels should not exceed 12. This results in 162,425 possible attribute-level combinations or alternatives.
3.2.2 Mixture-amount modeling
In our study, any given family with at least one child is interpreted as a mixture of the eight components listed in Table 1. Because we are also interested in the impact of the total number of children on the respondents' intention, we used a mixture-amount model as a starting point to design our DCE and to analyze the resulting data. The use of mixture models and mixture-amount models is not common in the context of DCEs, the exceptions being Ruseckaite et al. (Reference Ruseckaite, Goos and Fok2017), Raghavarao and Wiley (Reference Raghavarao and Wiley2009), Goos and Hamidouche (Reference Goos and Hamidouche2019), Khademi and Timmermans (Reference Khademi and Timmermans2012), Zijlstra et al. (Reference Zijlstra, Goos and Verhetsel2019), and Pradhan et al. (Reference Pradhan, Lal, Dash and Singh2017).
Because there is no software for designing DCEs for mixture-amount models, we adopted a construction similar to that of Zijlstra et al. (Reference Zijlstra, Goos and Verhetsel2019) and constructed our DCE in two steps using JMP Pro 14 [SAS Institute Inc. (2018)] and SAS 9.4 [SAS Institute Inc. (2013)]. First, for each value n of the total number of children in Table 1, we created a candidate list for the mixture proportions in JMP using an {8, n} simplex lattice design for the 8 components in Table 1. This ensured that, in all of the alternatives in our DCE, the sum of the 8 components matched the total number of children, and resulted in a candidate list of 5,960 possible alternatives. Second, we computed the 60 choice sets with the highest information content in terms of the D-optimality criterion using the OPTEX procedure in SAS. A D-optimal design guarantees precise parameter estimates by minimizing the determinant of the variance–covariance matrix of the parameter estimates [Rose and Bliemer (Reference Rose and Bliemer2009)]. To create the experimental design with the OPTEX procedure, we had to specify a specific mixture-amount model. We chose a third-order Scheffé model for the eight mixture components combined with a polynomial model of order five for the amount effect:

The third-order Scheffé model for the mixture variables allows for potential curvature in the relationship between the mixture components and the utility. We added a polynomial model of order five for the amount variable to ensure that the DCE contains intermediate levels for the number of children.
Three adjustments of the candidate list were necessary to avoid unrealistic choice cards in the D-optimal experimental design. First, our initial designs for the DCE included multiple choice sets with extreme options (1 child or 12 children). We solved this by forcing the OPTEX procedure in SAS to include alternatives with at least three proportions different from zero for amount variables larger than two. Second, a large number of choice sets did not include children with primary education. This was solved by excluding possible alternatives in which at least 50% of the children did not have a primary school certificate. Third, we excluded alternatives with an extremely high proportion of boys or girls by adding the constraint that the binomial probability for the proportions had to be larger than 0.1. The final experimental design based on equation 6 and involving 60 choice sets can be found in Table C.1 in Appendix C.
In our DCE, we did not add an opt-out option because this could lead to a lack of information as previous research has shown that parents might have self-expressed reasons related to situational influences (e.g., the decision of God) rather than personal dispositional factors [Farina et al. (Reference Farina, Gurmu, Hasen and Maffioli2001)]. A second reason is that this research has to be interpreted as an ex ante study which assumes that the respondents do want children in the future.
3.3 Implementation
To administer the DCE to the respondents without imposing a too high cognitive burden, we partitioned the 60 choice sets into five blocks of 12 profiles each and randomly assigned the respondents to 1 of the 5 blocks. We used visual aids since the adult literacy ratio in Ethiopia is only 39% [Central Statistical Agency & ICF International (2016)]. Appropriate images were examined during focus group discussions in four non-sampled villages in the research area. Figure 3 visualizes one of the choice cards, showing that by using the mixture-amount model, a large number of attributes can be included while keeping the choice cards simple.
Example of one of the choice cards.

We conducted the DCE during the period August–October 2019. Six enumerators collected the data, using tablets and the free software application “Open Data Kit.” First, oral informed consent was asked after which a cheap talk script was used in which the objective, the method, and the attributes were explained to ensure that respondents consider their personal attitudes, perceived norms, and perceived behavioral control when choosing their preferred option based on their intentions. Confidentiality and anonymity were assured. To reduce measurement error and informational bias, the DCE started with two test cards including one card with a dominant scenario, while the order of the remaining choice cards was randomized between respondents. Subsequently, 12 choice cards from 1 of the 5 blocks were presented. As a robustness check, the DCE ended with two duplicates per respondent.
3.4 Analysis
DCEs are embedded in the random utility theory which states that utility is a latent construct that exists in consumers mind but cannot be observed directly [Thurstone (Reference Thurstone1927), McFadden (Reference McFadden and Zarembka1974), Manski (Reference Manski1977)]. This latent utility depends on the attributes of a good/service and the individual's socio-economic characteristics. Following this framework, the latent utility can be split up into an observable and an unobservable part. Choosing one alternative over others implies that the utility of the chosen alternative exceeds the utility associated with the other alternatives. We observe whether an alternative is chosen or not in terms of a binary dependent variable. Typically, a logit model is used to analyze these binary choices. We use the mixed logit model (MXLM),Footnote 8 which is the most common discrete choice model and allows for intentions to be heterogeneous among respondents [Revelt and Train (Reference Revelt and Train1998)]. The parameter estimates of the MXLM quantify the average respondent's intentions. We estimate different model specifications of the MXLM, using the hierarchical Bayes optionFootnote 9 in JMP using 10,000 iterations, 5,000 of which were for burn-in. We estimate a first model which is a basic mixture-amount model to investigate the QQ trade-off and the possible bias by the gender of the child. In a second specification, we add the variable Gender of the parent as an interaction term to evaluate the existence of a bias by gender of the parent. In both models, we drop one of the linear terms (Girls no schooling) to make the choice model estimable, as explained by Goos and Hamidouche (Reference Goos and Hamidouche2019).
To select the model with the best fit, we test different mixture-amount models, including those described by Scheffé (Reference Scheffé1958), Khuri (Reference Khuri2006), Kowalski et al. (Reference Kowalski, Cornell and Vining2000), Pal and Mandal (Reference Pal and Mandal2012), and Prescott (Reference Prescott2004), all with a multiplicative effect of the amount variable to test the QQ trade-off; and quadratic or higher order effects for the variable Number of children to mimic the relationship between the parents' utility and the number of children based on the normal distribution of family size in the world [The World Bank (2022)]. We select the best mixture-amount model based on the Bayesian information criterion (BIC), as recommended by Schwarz (Reference Schwarz1978), but we report also the Akaike information criterion corrected for small sample sizes (AICc). This results in the selection of the following model:

We perform a robustness check to control for attribute non-attendance (i.e., not considering a certain attribute in making a choice) and scale heterogeneity (i.e., making inconsistent choices across the choice cards). A description of the methods and results of the robustness checks can be found in Appendix A. We find that the experiment is robust to both attribute non-attendance and scale heterogeneity.
To evaluate the existence of a QQ trade-off, we perform a joint Wald testFootnote 10 for the interaction terms between the quantity and quality attributes. To visualize the QQ trade-off, we calculate the marginal rates of substitution (equation 8) which measures the willingness of individuals to give up one attribute of a good or service in exchange for another such that the utility of the good or service remains constant. In our study, it is calculated as:


with MRS the marginal rate of substitution, U the utility, ni the number of boys or girls following a certain level of schooling, and n the total number of children (as defined in Table 1). The marginal rates of substution should be interpreted at the highest utility level as respondents are assumed to maximize their utility during the DCE. We visualize the utility indifference curves for no schooling and primary schooling combined, and secondary and tertiary schooling combined. We do this because the QQ trade-off cannot be directly deducted from the primary and secondary schooling variables, as it remains unclear whether a decreasing slope (e.g., for secondary schooling) indicates respondents' willingness to have a lower (i.e., primary) schooling in return for more children (and thus make a QQ trade-off) or a higher (i.e., tertiary) schooling in return for more children (and thus do not make a QQ trade-off) due to the mixture-amount design. The choice to combine the levels of education in this way is because secondary and tertiary education are both not compulsory and are therefore only supposed to be attended when there is an expected return from sending children to secondary or tertiary education [Girma and Kedir (Reference Girma and Kedir2005)].
To analyze the existence of a gender bias for boys or girls in the QQ trade-off, we perform a joint Wald test for the equality of the interaction terms between the quantity and quality attributes of boys versus girls. In addition, we maximize the utility to identify the optimal mixture via the Wolfe reduced-gradient optimization algorithm in JMP. To evaluate the existence of a bias by gender of the parent, we perform a joint Wald test for the equality of the interaction terms between the quantity and quality attributes of men versus women.
4. Results
4.1 Descriptive statistics
Respondents are on average 21 years old, and men are on average older than women (Table 2). The majority of respondents (64%) are Protestant and 29% have completed secondary school, with more women having completed the first cycle of secondary school than men. Respondents are mainly students (36%) or are employed in the agricultural (22%) or non-agricultural sector (21%). The vast majority of respondents is not married (77%) and has no children (80%). More men (27%) are currently married than women (19%). Respondents with children have on average two children. The average self-expressed preferred family size is four children with, on average, a higher stated preference for boys than for girls (a preferred sex ratio of 1.118) (Table 3). A large share of the respondents (88%) has knowledge about contraception, 60% have never used contraception, and 18% are currently using it. The awareness about contraception is significantly higher among male respondents than among female respondents while the use of contraception does not differ with respondents' gender. About 95% of respondents state to have access to contraception in the village, of which 39% state to have never experienced a shortage of contraceptives in the village.
Socio-demographic characteristics of the respondents, by gender
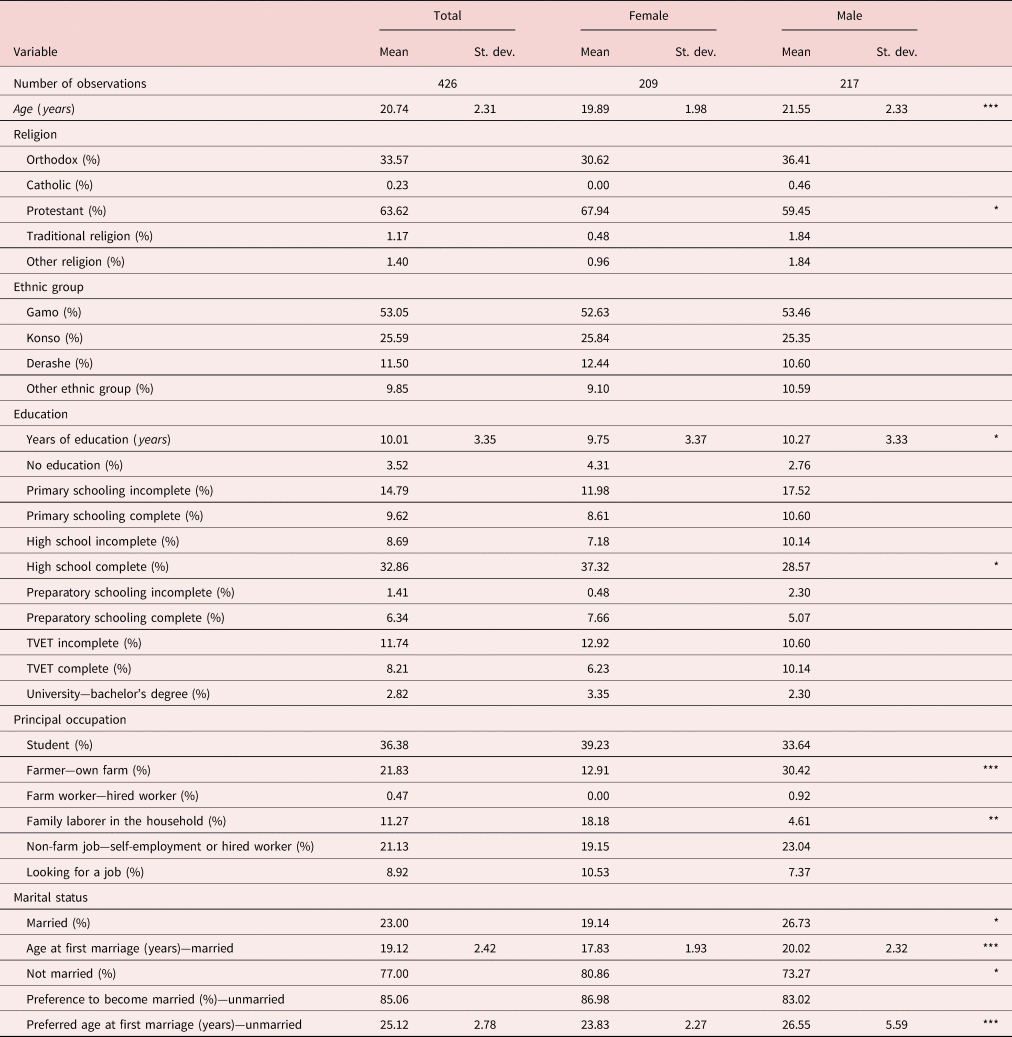
Note: The category other religion includes Akale, Mekane eyesus, and Hawariyat. The category other ethnic group includes Kusume, Wolaita, Gofa, Zavse, Gidicho, and Kore. Comparison between the male and female subgroups is based on: (a) for ratio data: an ANOVA test with post-hoc Tukey test (if the normality and homoscedasticity assumption is valid) or a Kruskal–Wallis test with post-hoc Dunn's test accounting for the false discovery rate (if the normality and homoscedasticity assumption do not hold) and (b) for nominal data: a pairwise χ 2 test accounting for the false discovery rate. Significant differences of the mean of the male versus female subgroups are shown with *p < 0.1, **p < 0.05, ***p < 0.01.
Respondents' characteristics and preferences concerning childrearing and contraception, by gender
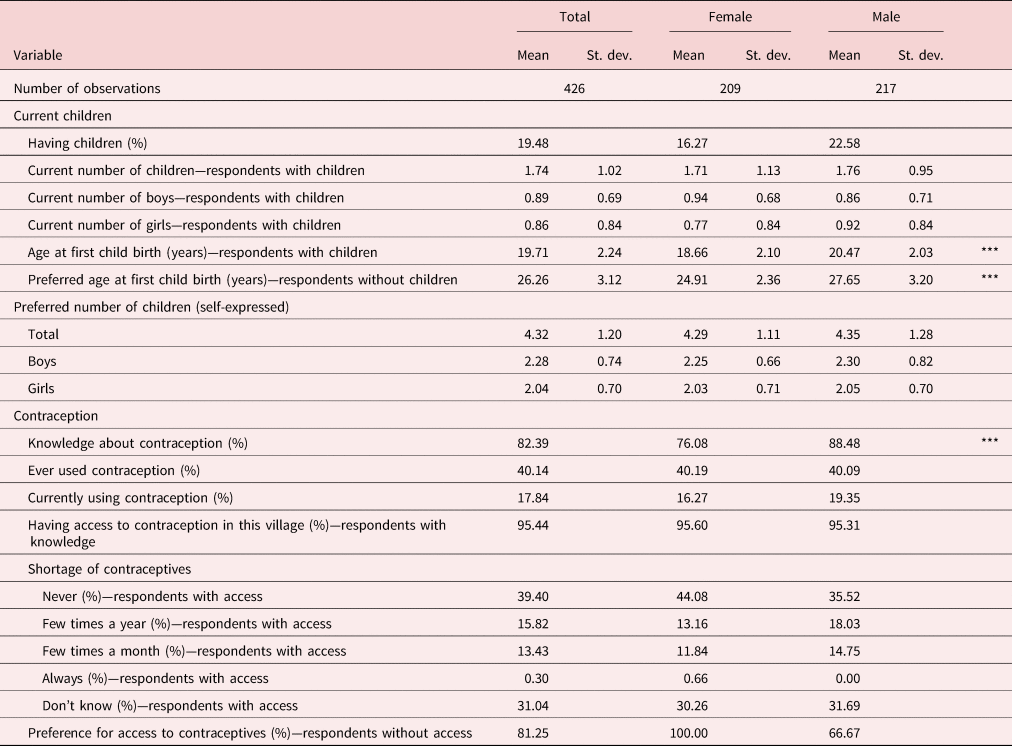
Note: Comparison between the male and female subgroups is based on: (a) for ratio data: an ANOVA test with post-hoc Tukey test (if the normality and homoscedasticity assumption is valid) or a Kruskal–Wallis test with post-hoc Dunn's test accounting for the false discovery rate (if the normality and homoscedasticity assumption do not hold) and (b) for nominal data: a pairwise χ2 test accounting for the false discovery rate. Significant differences of the mean of the male versus female subgroups are shown with *p < 0.1, **p < 0.05, ***p < 0.01.
4.2 Heterogeneity in fertility intentions and the QQ trade-off by gender of the child
To analyze fertility intentions, first, the MXLM is estimated for the entire sample (Table 4). The results show that parents derive utility from all the attributes. Thus, quantity, quality, and gender are important in fertility intentions. To facilitate the output interpretation of the non-linear model specification, Figure C2 in Appendix C visualizes the interaction effects between the number of children and the eight educational levels. For most of the graphs, at any given schooling attribute percentage, utility is lower if the number of children increases, showing that respondents' utility decreases if the number of children increases. Further, the utility follows a decreasing course when the percentage Girls no schooling and Boys no schooling increases, while the utility increases when the percentage Girls tertiary schooling and Boys tertiary schooling increases, with the highest utility for four to eight children. This shows the high preference for tertiary education and the low preference for no education.
Parameter estimates of the plain MXLM
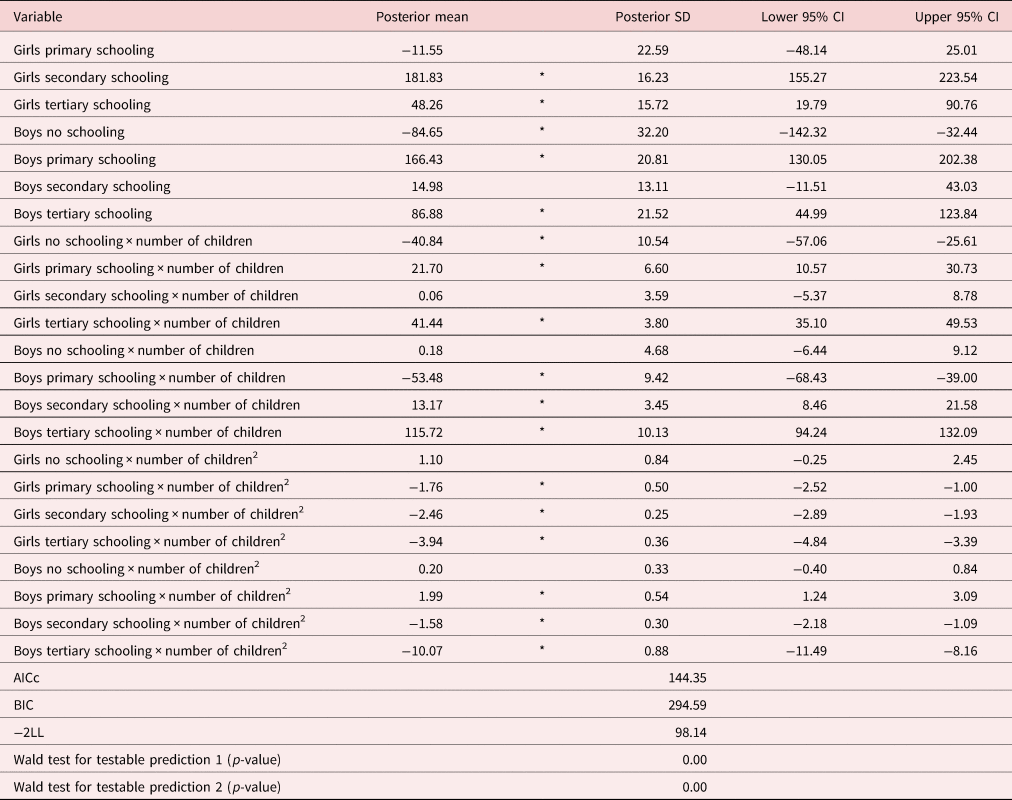
Note: Significant effects of the posterior mean on a 5% level are indicated with *. The posterior SD refers to the posterior standard deviation. Testable prediction 1 is that the quantity (n) and quality (e) are inversely related. Testable prediction 2 is that this QQ trade-off can be different for boys or girls.
The Wald test for testable prediction 1 indicates that respondents do make a QQ trade-off. To visualize this QQ trade-off, Figure 4 shows that respondents make a QQ trade-off until respondents reach 3.0–5.7 children. For example, Figures 4a and b show that respondents are willing to have fewer children if more children can reach secondary or tertiary education (so fewer children who do not finish any or only primary schooling due to the mixture characteristic of the experiment), or as respondents' willingness to accept a lower level of education for their children in return for more children until the point where 3.0–5.7 children is reached. Beyond this turning point, respondents are only willing to have more (fewer) children, if their children can reach a higher (lower) level of education.
Utility indifference curves of all respondents for the different schooling components (y-axis) and the number of children (x-axis) to visualize the marginal rates of substitution ceteris paribus. The brightest red lines show the highest constant-utility curves. Note: all results need to be interpreted with respect to Girls no schooling.

Regarding the existence of a bias by gender of the child, the Wald test for testable prediction 2 indicates that respondents do make a different trade-off for boys and girls. Figure 4 shows that respondents are willing to trade-off a higher share of girls' secondary or tertiary education in return for more children compared to boys until the turning point. Figure 5 confirms that respondents have a higher preference for boys, both in terms of quality (as their ideal mixture consists of 100% boys following tertiary education) and quantity (as the percentage of boys over all the educational levels equals 100%). In addition, Figure 5 reveals that the utility-maximizing number of children is situated at 5.75 children.
Optimal mixture and amount variable for all respondents. Note: all results need to be interpreted with respect to Girls no schooling.

4.3 Heterogeneity in fertility intentions and the QQ trade-off by gender of the parent
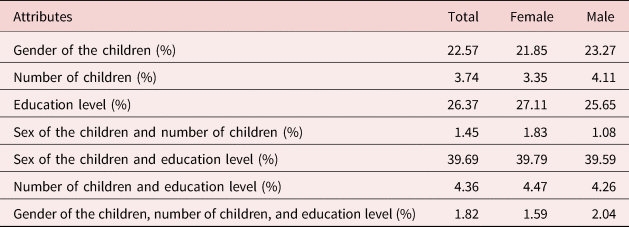
To analyze the heterogeneity in fertility intentions between male and female respondents, the MXLM with the variable Gender of the parent as a covariate is estimated (Table 5). Regarding the existence of a bias by gender of the parent, the Wald test shows that there are significant differences in the intentions between male and female respondents. Figures C.2 and C.3 in Appendix C visualize the interaction effects between the number of children and the eight education levels, showing similar patterns in the utility levels for male and female respondents but a wider variance in utility levels for female respondents.
Parameter estimates of the plain MXLM with interaction effects of the dummy variable Gender of the parent
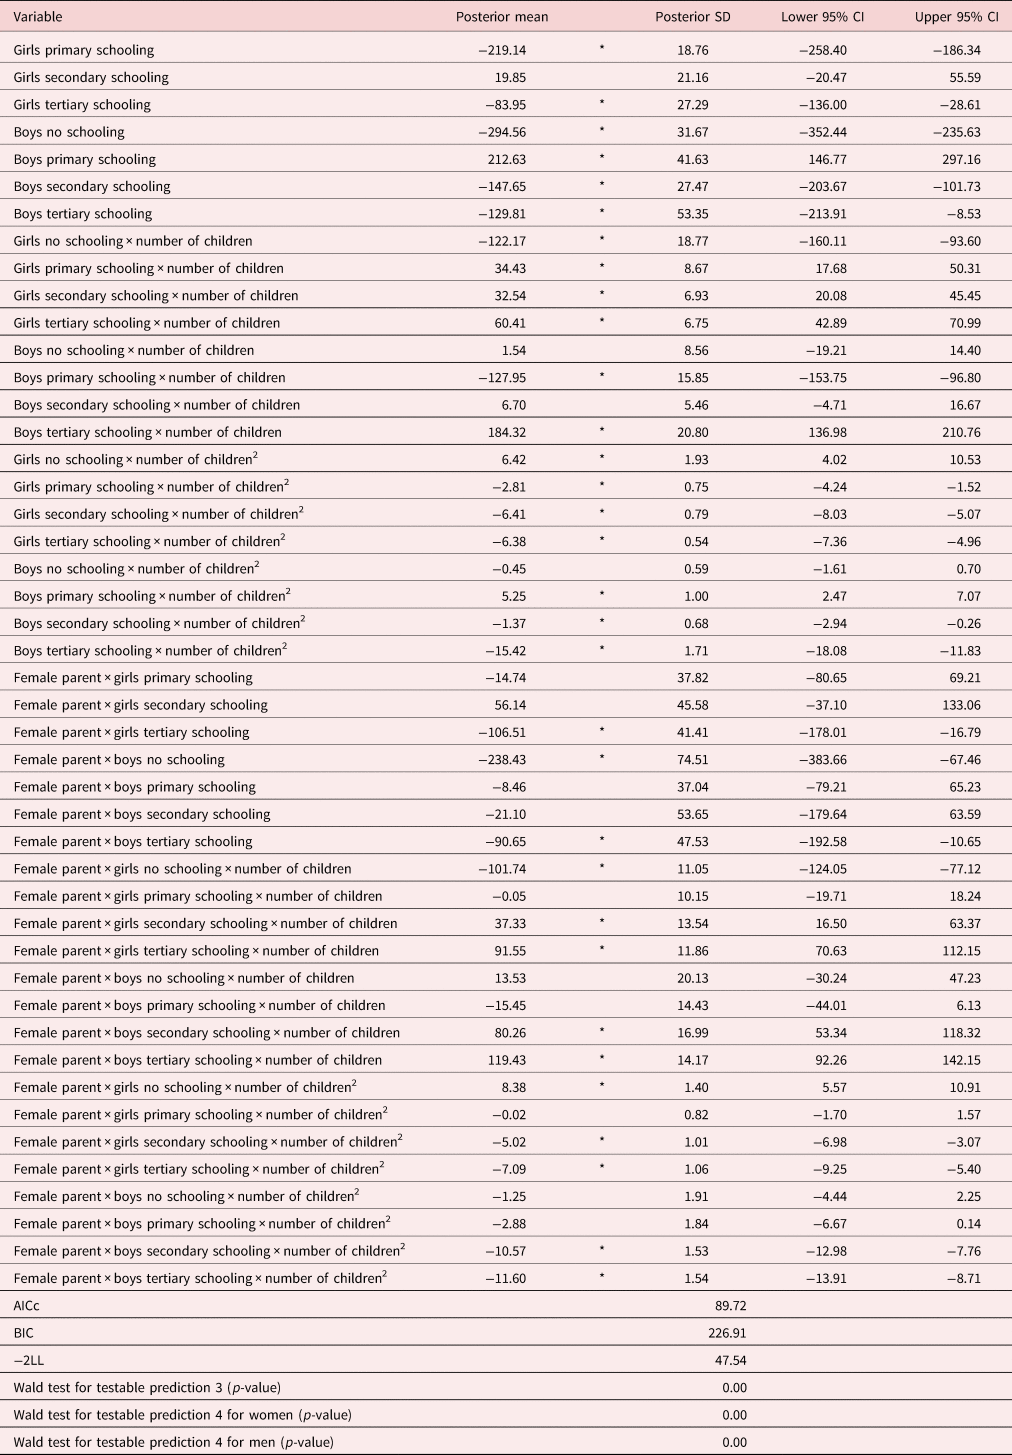
Note: Significant effects of the posterior mean on a 5% level are indicated with *. The posterior SD refers to the posterior standard deviation. Testable prediction 3 is that parents make a different QQ trade-off. Testable prediction 4 is that men and women make a different QQ trade-off for boys and girls.
Visualizing the QQ trade-off using the marginal rates of substitution reveals that both male and female respondents make a similar QQ trade-off until respondents reach a certain number of children (ranging from 2.7 to 4.9 for male respondents and 3.8 to 4.8 for female respondents) except that women are less willing to trade-off education for children (shown by the larger marginal rate of substitution) (Figures 6 and 7). Again, beyond this turning point, respondents are only willing to have more (or less) children, if their children can reach a higher (lower) level of education.
Utility indifference curves of male respondents for the different schooling components (y-axis) and the number of children (x-axis) to visualize the marginal rates of substitution ceteris paribus. The brightest red lines show the highest constant-utility curves. Note: all results need to be interpreted with respect to Girls no schooling.

Utility indifference curves of female respondents for the different schooling components (y-axis) and the number of children (x-axis) to visualize the marginal rates of substitution ceteris paribus. The brightest red lines show the highest constant-utility curves. Note: all results need to be interpreted with respect to Girls no schooling.

The Wald test confirms the existence of a bias for the gender of the child by gender of the parent. Figures 6 and 7 reveal that male respondents are willing to trade-off a larger amount of the quality component for one more child for girls compared to boys, which is not the case for female respondents. Figures 8 and 9 confirm that respondents have a higher intention for boys (as their ideal mixture consists of 100% boys following tertiary education). In addition, it shows that the utility-maximizing number of children is higher for male respondents (5.98 children) than for women (5.62 children).
Optimal mixture and amount variable for male respondents. Note: all results need to be interpreted with respect to Girls no schooling.

Optimal mixture and amount variable for female respondents. Note: all results need to be interpreted with respect to Girls no schooling.

5. Discussion
Our analysis documents the existence of a QQ trade-off in fertility intentions at a lower quantity of children. The QQ trade-off is gendered in two ways. First, the results show that respondents have a preference for boys over girls, both in terms of the quantity and quality of childrearing. Second, we find that men generally have a higher willingness to trade-off secondary or tertiary schooling in return for more children. In addition, both men and women have a preference for sons and for tertiary education for boys over education of girls.
Our findings show that the QQ trade-off as described in the theoretical considerations in section 2 holds, but not over the whole range of hypothetical numbers of children. The QQ trade-off only applies until a certain number of children, between three and six, is reached. Hence, our results imply that stimulating education will have no clear effect on fertility. As a result of the U-shaped utility indifference curves, fertility levels will either rise or fall. These empirical findings document that theoretical models on fertility need further fine-tuning to better capture nuances in fertility intentions and in QQ trade-offs.
The focus of our study on analyzing the QQ trade-off using a DCE by jointly estimating QQ intentions provides additional insights to the current literature on the QQ trade-off. Previous studies focus on actual fertility outcomes rather than fertility intentions and use external instruments or natural experiments to study the effect of fertility on quality of childrearing. Only one study focused on a gendered QQ trade-off by identifying the causal relationship between family size and schooling by gender of the child using twinning as instrument [Alidou and Verpoorten (Reference Alidou and Verpoorten2019)]. Compiling 86 surveys from 34 countries in SSA, they find no effect of family size on schooling by gender of the child, except for the subsample with families of three children they find a positive effect on boys' schooling and for the subsample with families with at least four children they reveal a negative effect on girls' schooling. A recent review of studies on the QQ trade-off shows that estimates are not conclusive and can be non-linear [Clarke (Reference Clarke2018)]. We do find a QQ trade-off in fertility intentions and confirm that this trade-off can be non-linear. In addition, our study is the first to reveal that the trade-off only applies when the number of children is less than three to six and entails a twofold gender bias. Concerning the latter, it is important to point to some imbalances between men and women in terms of age (men are 1.65 years older) and marriage (men are 7.59pp more likely to be married). However, studies show mixed evidence about the effect of age and marriage on fertility intention and outcome [Toulemon and Testa (Reference Toulemon and Testa2005), Alemayehu et al. (Reference Alemayehu, Haider and Habte2010), Kodzi et al. (Reference Kodzi, Johnson and Casterline2012), Rutaremwa et al. (Reference Rutaremwa, Galande, Nviiri, Akiror and Jhamba2015), Ibrahim and Arulogun (Reference Ibrahim and Arulogun2019)]. Because of our focus on the gender bias, we only considered the latter background factor in this study.
In addition, our results reveal that the average utility-maximizing number of children in the research area is 5.75. This is slightly higher than the current observed total fertility rate of 4.90 in the Gamo Gofa Zone and 5.60 in the Segen People's Zone [Teklu et al. (Reference Teklu, Sebhatu and Gebreselassie2013)] and higher than the average self-expressed preferred family size of 4.32. The gap we observe between the latent and self-expressed preferred number of children is in line with the reported gap between the ideal and actual family size in the literature that ranges between one and two children [Bongaarts and Casterline (Reference Bongaarts and Casterline2013), Günther and Harttgen (Reference Günther and Harttgen2016), Trinitapoli and Yeatman (Reference Trinitapoli and Yeatman2018)]. This gap can be explained by (i) an inherent higher family size intentionFootnote 11 or (ii) by an unmet demand for contraception [Bongaarts and Casterline (Reference Bongaarts and Casterline2013), Günther and Harttgen (Reference Günther and Harttgen2016)]. The latter likely plays a role in our research area, given that 24% of female respondents have no knowledge about contraception, that 5% of respondents indicates to have no access at all to contraceptives in the villages and another 30% indicates that access to contraceptives is problematic which is in line with the national unmet demand for contraception of 21% [The World Bank (2022)]. This might result in an inability of women to implement their fertility intentions into fertility outcomes. Yet, fertility intentions in the research area are high as well. Current family planning programs are mainly centered around the availability and awareness on contraception. The effectiveness of family planning policies and programs could improve through a complementary focus on reducing the prevailing family size norm and through more effective targeting of support in access to contraception to men and women with an actual demand for contraception. For effective family planning, demand for less children must precede the will to control fertility.
Our findings result in several policy implications. First, the existence of the U-shaped utility indifference curves shows that a focus on education and fertility is complementary. Policies that stimulate (preferences for) education (e.g., via increased availability, accessibility, and affordability) could be associated with changes in fertility preferences that go in either direction, and thereby could increase or decrease the total fertility rate. This is in line with other studies arguing that free education or education based on a general taxation system can unintentionally result in an increased total fertility rate [de la Croix and Doepke (Reference de la Croix and Doepke2004), Azarnert (Reference Azarnert2008)]. In order for low fertility rates and high schooling rates to go hand in hand and for the demographic transition to accelerate in the study area, policies should be designed to foster preferences for both smaller families and child education. Second, women's ideal family size is lower than men's, implying that stimulating women's reproductive empowerment and women's bargaining power within the household could contribute to a decreased total fertility rate. A recent report by the UNFPA states that women's bargaining power is low in Ethiopia [UNFPA (2021)]: 55% of women lack autonomy in decision-making regarding health care, contraception, and sex, and this decreases with women's education. In addition, empirical evidence in Uganda shows that higher female decision-making power is correlated with fertility intentions that follow women's intentions more closely [Van Hoyweghen et al. (Reference Van Hoyweghen, Van den Broeck and Maertens2022)]. Third, we observe a gendered preference for more boys and a gendered preference for boys' education over girls' education that applies to both men and women. These gendered preferences, along with a documented positive correlation between low female education and high fertility [Becker et al. (Reference Becker, Cinnirella and Woessmann2013), Brée and De La Croix (Reference Brée and De La Croix2019)], call for attention to increasing preferences for education, in particular girls' education, to decrease fertility in the long run.
Our research demonstrates the usefulness of the DCE method for analyzing trade-offs in fertility intentions. While DCE results may suffer from several possible sources of bias, including attribute non-attendance, scale heterogeneity, hypothetical bias (i.e., inconsistent behavior because of non-real choices that the respondents must make), informational bias (i.e., influenced behavior due to the provision of information), and social desirability bias, we find that our results are robust to attribute non-attendance and scale heterogeneity. Hypothetical and information bias was mitigated by a cheap talk script, by randomizing the order of the choice cards between respondents, and by screening the data for implausible responses [Loomis (Reference Loomis2014)]. Social desirability bias could have influenced our research outcomes, but this is not specific to our method as also direct questions on fertility intentions would suffer such bias. We could have used social desirability scales or rating of item desirability to estimate the degree of social desirability but did not do this to limit the cognitive burden and length of the DCE [Larson (Reference Larson2019), Lopez-Becerra and Alcon (Reference Lopez-Becerra and Alcon2021)]. Instead, we tried to minimize this bias by hiring local enumerators to implement the DCE and by emphasizing that there are no right or wrong answers during the cheap talk script. In addition, the outcome of the DCE is sensible to the design choices [Hanley et al. (Reference Hanley, Shogren and White2019)]. We optimized the design by consultation of DCE experts and adjustments of the candidate list to avoid unrealistic choice cards. Another particular limitation of this research relates to the inability to derive standard deviations for the optimal number of children with the used software.
Suggestions for further research are to disentangle personal attitudes from perceived norms and perceived behavioral control by adding these concepts explicitly as different attributes in a DCE. Further, the effect of parental education could be assessed to see if a higher parental education results in a reinforcing effect through a higher intention for higher education.
6. Conclusion
Different theories exist on the key factors explaining fertility decline. The Beckerian school emphasizes the importance of the demand for human capital as a trigger for fertility decline. They argue that when the demand for human capital increases, parents make a QQ trade-off because of resource constraints. We analyze the existence of this QQ trade-off by analyzing ex ante fertility intentions. In addition, we analyze a possible gender bias in making this QQ trade-off which could be twofold, by gender of the respondent and by gender of the child. This is done through a DCE and a survey in six rural districts in southern Ethiopia. Our study confirms the existence of a QQ trade-off when the number of children is less than six. Moreover, we find gendered intentions for boys in both the quantity and quality of childrearing, by both men and women, but men intend to trade-off more education in return for an extra child than women do.
Hence, our study shows that preferences for education are inversely related to family size preferences during stage three of the demographic transition model (i.e., the late transitional stage). SSA countries are assumed to currently go through the second or third stage of the demographic transition model. To spur the decline in fertility rates, strategies are needed that foster both preferences for child education and for smaller families, as our results show that higher preferences for education can positively or negatively associate with fertility intentions. The revealed gender bias to the disadvantage of girls can possibly impede a further decline in fertility rates. Therefore, a focus on increasing preferences for girls' education is particularly important in light of accelerating the demographic transition in SSA.
Supplementary material
The supplementary material for this article can be found at https://doi.org/10.1017/dem.2022.28.
Conflict of interest
None.
Appendix A: robustness checks
A.1 Attribute non-attendance (ANA)
ANA occurs when respondents do not consider a certain attribute in making a trade-off between the alternatives. To check for ANA, we used two methods. First, the DCE included the question of possible ignorance of an attribute after each choice card (i.e., choice card stated ANA) and after the whole DCE (i.e., serial stated ANA). Afterwards, we compared the “standard” MXLM with an MXLM with dummy variables for the most ignored attributes to investigate whether these respondents have different intentions. Second, we checked for ANA using the endogenous attribute non-attendance logit model (EAAlogit) via the eaalogit command in Stata. Since the EAAlogit could not estimate the plain mixture-amount model with the main effects, we gradually built up the non-attendance pattern. We then compared the EAAlogit model with a conditional logit model because both models assume preference homogeneity. We estimated the conditional logit model via the Firth penalized-likelihood estimation procedure in JMP.
With regard to serial stated ANA, Table A.1 shows that 84% of the respondents stated that they took all attributes into account during the DCE. Moreover, 47% of the respondents stated that they considered all attributes equally important. In addition, the attributes Gender of the children and No schooling were somewhat ignored (by 7% and 7% of the respondents respectively) and considered least important (20% versus 27% respectively). Therefore, we analyzed these two possibly ignored attributes via an MXLM with the addition of dummy variables for these two attributes (Table A.3). This shows that, compared with the “standard” MXLM, respondents who indicated that they did not consider certain attributes when making their choice, have almost no significantly different intentions (indicated by the interaction terms of the dummy variables and the attributes). This holds except for respondents who stated that they had ignored the attribute Gender of the children; they have an even higher intention for girls going to primary, secondary, and tertiary education and boys going to tertiary education. They also have a lower intention for the number of children. Respondents who indicated that they had ignored the attribute No schooling have a higher intention for the number of girls going to tertiary education and boys to secondary education. Moreover, they have a lower intention for the number of children. This shows that there is only a low level of evidence for ANA according to serial stated ANA.
Results of serial stated ANA

The results of choice task stated ANA show that 40% of choices were based on gender of the children and education level (Table A.2). Twenty-six percent of the respondents explicitly took the education level into account and 23% of the choices were based on gender differences of the alternatives. This is consistent with the results of the serial stated ANA, as the attributes considered most important are also reported as the least ignored/least important, with the exception of the number of children.
Choice task stated attribute attendance
Inferred ANA via the EAAlogit model reveals that the significance levels, the sign, and the magnitude of the variables are similar when compared with the “standard” conditional logit model (Table A.3). However, three gamma coefficients (γ) are significant, indicating that there is some evidence for ANA. This is the case for the Girls tertiary schooling, Boys tertiary schooling, and Number of children with corresponding probabilities of ANA of 19%, 21%, and 35%, respectively (based on the gamma coefficients; calculations not shown here). Nevertheless, for the EAAlogit model, the effects of Girls tertiary schooling, Boys tertiary schooling, and Number of children increase and the AICc and BIC improve compared to the “standard” conditional logit model.
Parameter estimates of the “standard” MXLM and the “standard” conditional logit model for comparison with the models to account for ANA

Overall, there is little evidence for ANA. However, there is little agreement between the results of stated and inferred ANA. The reason could be that the design of the DCE is based on a mixture model, which makes it very difficult to ignore one of the attributes due to the collinearity (i.e., linear dependence) of the variables. Therefore, our experiment is assumed to be quite robust to ANA and we did not take ANA into account in the further analysis.
A.2 Scale heterogeneity
Scale heterogeneity occurs when the error variance is not constant across respondents due to a different ability to understand and perform the DCE. To investigate the presence of scale heterogeneity, we used two methods. First, we included two duplicates of the choice cards after the DCE. Afterwards, we compared the “standard” MXLM with an MXLM with dummy variables for the respondents who gave different answers on the duplicates, to investigate a discrepancy in intentions. Second, we analyzed scale heterogeneity via the scaled MXLM (also called the generalized multinomial logit model II) with the “gmnl” command in Stata. We then compared the scaled MXLM (accounting for both preference and scale heterogeneity) with the “standard” MXLM (accounting only for preference heterogeneity).
Regarding the first method, the use of duplicates, the results show that 90% of the respondents gave the same answer to the duplicated choice card. Table A.4 shows that, compared to the “standard” MXLM, the respondents who gave different answers to the duplicates have different preferences for Girls tertiary schooling, Boys no schooling, and Boys tertiary schooling (indicated by the interaction terms of the dummy variables and the attributes). This suggests that there is evidence of scale heterogeneity.
Parameter estimates of the “standard” MXLM for comparison with the models to account for scale heterogeneity

Second, the results of the scaled MXLM show that the significance, sign, and magnitude of the variables are similar to the “standard” MXLM (Table A.4). However, the scale parameter (τ) is significant which provides evidence for some scale heterogeneity. Nevertheless, if the scale parameter is included in the model, the AICc and BIC do not improve for the scaled MXLM compared to the “standard” MXLM.
Overall, there is a small indication of scale heterogeneity. However, we accounted for scale heterogeneity in the design by starting the DCE with a trial of two test cards to minimize the differences in ability to understand the task. Moreover, Hess and Rose (Reference Hess and Rose2012) argue that it is not completely possible to disentangle preference and scale heterogeneity with current models. Therefore, we did not take into account scale heterogeneity in the further analysis.
Appendix B: solution of the theoretical model
The maximization problem to be solved is:

Subject to:

The solution proceeds in two steps. First, solve for n. From equation B.2:

Substitution in equation B.1 gives:

The first-order condition for nb is:

The first-order condition for ng is:

Solving this equation results in:


where using mathematical simulations for γ, δ, ζ ∈ [0,1] and α, β ∈ ${\rm {\opf N}}_0^ +$ holds that:

Hence, a first testable prediction of the model is the inverse relationship (i.e., trade-off) between quantity (n) and quality (e) which depends on preferences for quantity and quality and is non-linear. A second testable prediction is that this QQ trade-off differs for boys or girls. A third testable prediction of this model is that parents may make a different QQ trade-off because we assume collective household model. A final testable prediction is that men and women make a different QQ trade-off for boys and girls.


 Open access