


1. Introduction
Consider the dynamics of a competition or contest with multiple winners, where contesters are ranked by their performance, and a select fraction of top performers are rewarded with prizes. A critical factor in these competitions is the strategic bets each contester makes, heavily influenced by uncertain factors. Take, for example, a research grant competition, where applicants submit proposals, and their success hinges on aligning with the funding body’s undisclosed preferences for topics or research methodologies. Each applicant, in essence, gambles on these preferences. This logic extends to other scenarios like government service procurements or job interviews, where strategic positioning is key.
This paper conducts a study of the strategic choices behind these bets in different competitive environments. We categorize these environments into two types: inclusive environments, characterized by low-intensity competition with a higher proportion of winners, and exclusive environments, marked by high-intensity competition where only a few emerge victorious. Our primary finding, supported by both theoretical analysis and experimental data, suggests a distinct pattern: In inclusive environments, players are inclined to coordinate their bets, leading to herding behavior. Conversely, in exclusive environments, participants are more likely to diverge, spreading their bets across various options.
To illustrate the intuition behind this finding, consider a competitive scenario involving three contestants and two potential bets. For example, the bets could involve submitting a proposal for either an empirical (E) or a theoretical (T) research project. The grant-awarding body, which is interested exclusively in one type of proposal, selects between the two options with equal probability. Winners receive a payoff of 1, while those not selected receive nothing.
In an inclusive environment, where the body intends to fund two out of three proposals, priority is given to submissions aligned with the body’s interest. Among the remaining submissions, the body selects randomly to ensure two winners. If all three contestants submit identical proposals (all choose E or all choose T), two winners are chosen at random from the three submissions.
In any equilibrium of this game, all three contestants would choose the same bet, each achieving an expected payoff of 2/3. For example, if all contestants choose T, any unilateral deviation – where a contestant chooses E instead – would reduce their expected payoff to 1/2, as their success would now depend entirely on the grant body’s preference aligning with their distinct choice.
A mixed strategy equilibrium also exists, in which contestants randomize between E and T with equal probabilities. However, if the probability of one state of the world – say T – were slightly greater than 1/2, the game would have a unique Nash equilibrium where all players choose T.
Suppose the scenario evolves such that the granting body decides to award a grant to only one of the three submissions. In this configuration, a uniform strategy where all players opt for the same bet ceases to be an equilibrium. By diverging from the common choice, a player could increase her payoff from 1/3 to 1/2. The only pure Nash equilibriaFootnote 1 in this setup involve one player choosing E while the other two opt for T, or vice versa. This phenomenon highlights a critical insight: In moderate competitions we should protect ourselves from potential failure, whereas in intense competition we should leverage the potential success.
To explain this insight, consider a researcher that is already informed about the bets made by all her competitors, and that the group is split between the two options very unequally, say, 95% choose T and 5% choose E. If the competition is moderate, e.g., 75% of the proposals will be awarded a grant,Footnote 2 our researcher should protect herself from potential failure (in her guessing). If she herds with the majority, no matter whether her guess is correct or not, she will be awarded the grant with a probability of close to 75% (though less than 75% if her guess is incorrect, and more than 75% if it is correct). If she goes with the minority, she is granted the prize with a probability of 100% if her guess is successful, and with zero probability if it is not. Since there is an equal probability of her guess being correct and incorrect, herding with the majority to protect herself against failure is the superior option. Consider now the case of intense competition, in which only 5% of the submissions will be awarded. In this case, going with the majority offers no protection at all. If she fails, she is awarded with probability zero. If she succeeds, she is awarded with a probability slightly greater than 5%. However, if she joins the minority and succeeds, she will be awarded with probability 1. Hence if competition is intense, she is better off leveraging her potential success rather than protecting herself from failure.
While we provide in the appendix a more general result that builds on the above insight, our main interest in this paper is testing this insight experimentally. In game theoretic terms, our insight above implies that in the inclusive environment, there are two Nash equilibria in the guessing game, in both of which all players choose the same bet. In contrast, in exclusive environments, they split equally between the two bets (almost equally if the number of players is odd). Clearly, playing these equilibria in both environments requires coordination. Ex ante, before players have made their decisions, they do not know what other players have chosen (or will choose). Even if they understand the benefits of herding in the inclusive environment, and believe that everyone else understands it, they still cannot know whether herding means choosing bet A or bet B. Hence, subjects need to play the game repeatedly within the same group, receive feedback about what other players did, form beliefs, and act based on these beliefs. Support for this insight would then be convergence to a unanimous choice of bet in the inclusive environment and a major split in the exclusive one. The experimental design is straightforward yet revealing. Participants are asked to guess the outcome of a bet between two named individuals, ‘Jane’ and ‘Jill,’ repeated across 30 rounds. After each round, we display the results of the bet, all previous rounds’ guess distributions both in absolute numbers and percentages, and the participants’ performance and earnings overall and in every round played so far. Participants with a correct prediction are ranked above the rest. In the inclusive variant, the top 80% of participants are declared winners, while in the exclusive variant, only the top 20% are rewarded. Results show a pronounced tendency for guess convergence in the inclusive environment, and a tendency for differentiation in the exclusive environment.
This paper contributes to the literature by exploring how the inclusivity of environments influences herding behavior. Previous research has focused on uncertainty and information access as key drivers of herding, with less attention given to the effects of the degree of competition on the prospects of herding. Our study introduces the concept of environmental inclusivity as a determinant of herding or divergence, providing empirical evidence to support this novel perspective.
The paper is structured as follows: Section 2 reviews the relevant empirical and theoretical literature on herding in competitive environments. Section 3 describes the experimental design. Section 4 presents the experimental results. Section 5 outlines a simple reinforcement learning model, while the formal Nash equilibrium analysis of the static game is detailed in Appendix C. Finally, Section 6 discusses our findings and concludes the paper.
2. Related literature
2.1. Market entry games and coordination in competitive environments
This paper contributes to the literature on coordination in large groups, an area significantly influenced by the work of Amnon Rapoport. His series of papers on market entry games (Rapoport, Reference Rapoport1995; Rapoport & Seale, Reference Rapoport, Seale, Plott and Smith2008; Rapoport et al., Reference Rapoport, Seale, Erev and Sundali1998, Reference Rapoport, Seale and Winter2000, Reference Rapoport, Seale and Winter2002) serves as a key inspiration for our study. These studies emphasize the critical role of coordination in competitive environments, applicable to scenarios such as traffic congestion, retail competition, and school applications. Notably, they reveal that aggregate player behavior in large-scale games quickly aligns with equilibrium predictions, despite individual deviations.
While our strategic environment differs from that of market entry games, both contexts underscore the unexpected role of coordination in competitive, non-cooperative settings and the tendency for experimental behavior to converge towards Nash equilibria. Rapoport’s work also highlights how individual decision-making processes adapt to changing conditions, providing valuable insights into cognitive mechanisms in strategic environments.
2.2. Theories of herding and contrarian behavior
Various theoretical models have been proposed to explain herding and contrarian behavior, primarily focusing on the influence of uncertainty. Banerjee (Reference Banerjee1992) introduced a seminal model explaining herding, where an agent, observing the decisions of others, chooses to make the same decision, assuming that others may possess relevant information. This can lead to a scenario where agents ignore their own information, resulting in less informative decisions and potentially leading to inefficient equilibrium states. Banerjee termed this phenomenon the ‘herd externality.’
Herding behavior is also prevalent in financial markets. Investors may change planned investment decisions after observing others, thinking that the herd behavior could reflect relevant information. Scharfstein and Stein (Reference Scharfstein and Stein1990) describe how investment managers, categorized into ‘smart’ (with informative signals) and ‘dumb’ (with noisy signals), mimic each other to appear knowledgeable. This imitation is driven by the desire to align with others, as shared failures have less impact on their reputations. Compensation schemes further incentivize imitation, promoting financial herding (Bikhchandani & Sharma, Reference Bikhchandani and Sharma2000).
C. Avery and Zemsky (Reference Avery and Zemsky1998) applied this model to stock markets, showing that multidimensional uncertainty can cause herding. When three or more dimensions of uncertainty exist regarding an asset, herd behavior becomes likely, leading to indistinguishable markets composed of well-informed and poorly informed traders, potentially resulting in asset price bubbles.
Contrarian behaviorFootnote 3 arises when investors deliberately choose to go against the herd, especially in situations of extreme uncertainty. Contrarianism has typically been studied in cases of information asymmetry, particularly when private information is available (e.g., Medrano & Vives, Reference Medrano and Vives2001), or when agents have doubts regarding the rationality of others, and contrarian behavior then emerges in an attempt to compensate for the potential mistakes of others (Drehmann et al., Reference Drehmann, Oechssler and Roider2005) Meanwhile, herding tends to occur with signals indicating extreme states or limited private information. Herding trades are self-reinforcing, leading to a persistent majority, whereas contrarian trades are self-defeating, as widespread adoption of contrarian behavior eventually nullifies its uniqueness. Both herding and contrarianism contribute to price volatility and reduced liquidity (C.N. Avery & Chevalier, Reference Avery and Chevalier1999; Park & Sabourian, Reference Park and Sabourian2011).
Relative position concerns can also drive herding. Cole et al. (Reference Cole, Mailath and Postlewaite2001) demonstrated that concerns about relative wealth can influence investment decisions, leading to either herding or contrarian behavior. DeMarzo et al. (Reference DeMarzo, Kremer and Kaniel2008) proposed an equilibrium model where agents’ future investment opportunities depend on relative wealth, causing them to herd to minimize the risk of ending up significantly poorer than their peers. This herding behavior distorts asset prices and can create bubbles, particularly if agents have strong relative wealth concerns and heterogeneous preferences
2.3. Experimental and real-world evidence
Experimental literature supports these theoretical findings on herding behavior. Cipriani and Guarino (Reference Cipriani and Guarino2005, Reference Cipriani and Guarino2009) and Drehmann et al. (Reference Drehmann, Oechssler and Roider2005) confirmed that flexible pricing prevents herding, and that multidimensional uncertainty increases herding. Drehmann et al.’s (Reference Drehmann, Oechssler and Roider2005) study, which included financial consultants, showed no significant differences from the general population. Cipriani and Guarino (Reference Cipriani and Guarino2005) initially used university students, but their subsequent study with financial market professionals confirmed the results (Cipriani & Guarino, Reference Cipriani and Guarino2009). Bracht et al. (Reference Bracht, Koessler, Winter and Ziegelmeier2010) provided experimental evidence that poor information generates herding behavior, with highly informed individuals breaking this behavior only in about one-third of cases.
Payoff externalities can also encourage or discourage herding, and are often prevalent in real-world environments in which herding occurs. Drehmann et al.’s (Reference Drehmann, Oechssler and Roider2007) experimental findings demonstrate that network effects offer a prominent example of such externalities. Where they constitute a positive externality, herding is more likely to occur, and to persist for longer, whereas with negative externalities, herding is less likely to persist. Andersson et al. (Reference Andersson, Hedesström and Gärling2014) provide direct experimental evidence that a payoff structure that rewards predictions that are in line with the herd increases the influence of the majority group, while an individual reward for making accurate predictions reduces the majority group’s influence.
Herding behavior has been extensively studied in real-world contexts. Foucault and Frésard (Reference Foucault and Frésard2019) explored the impact of informational costs on product differentiation, identifying herding tendencies in pre-IPO companies and demonstrating that IPOs mitigate these costs, thereby promoting increased differentiation. Research has shown that herding mutual funds often fail to outperform non-herding funds and may underperform relative to anti-herding funds, particularly among managers with significant career concerns (Jiang & Verardo, Reference Jiang and Verardo2018; Koch, Reference Koch2017). Herding behavior has been observed in various domains, such as the influence of ethnic background on long-term savings decisions (Mugerman et al., Reference Mugerman, Sade and Shayo2014), the patterns in online rating dynamics (Sunder et al., Reference Sunder, Kim and Yorkston2019), and the strategic adaptations of business groups during the COVID-19 pandemic (Espinosa-Mendez & Maguieira, Reference Espinosa-Mendez and Maguieira2023).
Contrarian behavior has also been observed in a range of real-world settings. For instance, competitive pressure can drive firms to pursue innovation, with early innovation and patenting enabling firms to expand market share and profit margins (Leyva-de la Hiz et al., Reference Leyva-de la Hiz, Aragon-Correa and Earle2021). Firms experiencing earnings pressure from shareholders or analysts have also exhibited contrarian behavior, particularly in markets where they possess significant power yet face intense competition (Zhang & Gimeno, Reference Zhang and Gimeno2017).
In the context of pension funds, Hamdani et al. (Reference Hamdani, Kandel, Mugerman and Yafeh2017) found that, in the absence of performance-based fees, competitive pressures among fund managers led to herding behavior, often characterized by insufficient risk-taking. Conversely, Mugerman et al. (Reference Mugerman, Steinberg and Wiener2022) demonstrated that heightened salience of risk could increase mutual fund risk exposure, potentially encouraging contrarian behavior. Additionally, Yousaf and Yarovaya (Reference Yousaf and Yarovaya2022) documented evidence of herding in cryptocurrency markets, highlighting its prevalence in emerging financial ecosystems.
Our paper contributes to the existing literature on herding behavior by introducing an experimental perspective that examines herding under varying levels of competitive intensity. By exploring strong and weak competition conditions, our study provides new insights into how reward structures and strategic interactions shape the degree of herding behavior. This approach extends prior theoretical and empirical findings, offering a deeper understanding of the dynamics of herding in competitive environments.
3. Experiment
3.1. Illustrative example – grant proposal game
Before delving into the experiment, we present a simple three-person example to highlight the main strategic considerations in the two environments. We use the conventional three-player game representation, where Player 1 selects a row, Player 2 selects a column, and Player 3 selects a matrix. The three-coordinate payoff vectors represent the (expected) payoffs awarded to Players 1, 2, and 3, respectively.
This example is similar to the one introduced in the Introduction section. The scenario involves three contestants choosing between two potential bets: submitting a proposal for either an empirical (E) or a theoretical (T) research project. The grant-awarding body, which is exclusively interested in one type of proposal, selects between the two options with equal probability. Winners receive a payoff of 1, while those not selected receive nothing.
In the inclusive environment, two grants are awarded out of three. In the exclusive environment, only one grant is awarded out of three. To set up the game (as shown in Figure 1), note the following payoff dynamics:
• Inclusive environment: Players in the majority group (2 out of 3) earn an expected payoff of 3/4, while the minority player expects to earn 1/2. If all players herd on the same choice, each has an expected payoff of 2/3.
• Exclusive environment: The minority player (1 out of 3) earns an expected payoff of 1/2, while each majority player has an expected payoff of 1/4. Herding in this case results in an expected payoff of 1/3 for each player.
Figure 1 illustrates how the Nash equilibrium partitions the set of strategy profiles in the two environments. In the inclusive environment, the Nash equilibria (denoted by **) are the pure strategy profiles (T,T,T) and (E,E,E), where all players herd on the same choice. Conversely, in the exclusive environment, the Nash equilibrium includes the remaining six strategy profiles (denoted by **), where players strategically split their choices to maximize individual payoffs.
The grant proposal game
Notes: The figure illustrates the Nash equilibrium partitions for the grant proposal game in two environments: inclusive (k = 2), where two grants out of three are awarded, and exclusive (k = 1), where only one grant out of three is awarded. In this representation: Player 1 selects a row, Player 2 selects a column, and Player 3 selects a matrix. Each strategy profile corresponds to a specific allocation of payoffs among the three players. The three-coordinate payoff vectors denote the (expected) payoffs received by Players 1, 2, and 3, respectively. Strategy profiles marked with ** indicate Nash equilibria for the environment in question.

The extension of this three-person game for an arbitrary number of players is presented in Appendix C. We note that these n-person games are all symmetric constant sum games.
3.2. Experimental setting
To empirically investigate the strategic environments, we designed an experimental setup where participants, grouped together, engaged in a guessing game.Footnote 4 Each participant guessed the outcome of a bet between two named individuals, ‘Jane’ and ‘Jill,’ repeated across 30 rounds.Footnote 5 Note that the equilibria in both the inclusive and exclusive games depend on coordination among players. As such, a relevant experimental setup requires dynamic interaction, allowing players to gradually coordinate their strategies through a process of learning. To facilitate this learning process, we provided participants with the following information after each round: (1) The outcome of the bet for that round; (2) The distributions of guesses from all previous rounds, displayed in both absolute numbers and percentages; (3) The participant’s performance and earnings, both overall and for each round played so far. This feedback enabled participants to adjust their strategies over time, fostering the coordination necessary to approach equilibrium outcomes.
Each participant was assigned to either the inclusive or exclusive environment. In the inclusive environment, in every round, if the participant’s guess was correct, and he or she was among the top 80% of guessers, the participant received 10 bonus points. The exclusive environment was similar, but the top 20% of guessers received 50 bonus points. At the end of the experiment, a lottery was conducted, in which participants had a 20% probability of receiving a bonus payment based on the points they had earned (at a ratio of 30 points = 1 GBP).Footnote 6
The experiment was conducted using oTree, with all participants of a group present in the same session. Participants were recruited through the online platform Prolific, which also handled payment at the end of the experiment.Footnote 7 Upon enrolling in the experiment, each participant received a link to join the session, and all players in a session played simultaneously. Participation was fully anonymous, and a participant could see the distribution of choices in a given round, but not the choices of any other individual player. This was done to reduce the likelihood of interference from social aspects that could encourage or discourage herding, such as the desire to punish another participant out of spite for making the wrong choice, or the altruistic desire to help others. For screenshots of the experimental interface that was presented to the participants, see Appendix A. To further ensure that our findings were the result of the competitive environment rather than other social and emotional factors, we include in Appendix B the results of another specification of the experiment, in which participants were only told the outcomes of the coin tosses at the conclusion of the entire game. This specification was also conducted in an in-person laboratory environment, reinforcing the validity of our online experimental setting.
3.3. Experimental procedures
• Briefing and consent: Participants were briefed about their rights, emphasizing voluntary participation, anonymity, and data usage limited to academic research.
• Experiment participation: Participants were randomly assigned, approximately half to the exclusive environment, and the remainder to the inclusive environment. Within each environment, participants were randomly assigned, half to the ‘Jill and Jane’ treatment, with the remainder assigned to the ‘Jane and Jill’ treatment.
Results and payment: The final experiment results and corresponding payments were disclosed to participants.
3.4. Reward structure
• Participants were rewarded with points for every correct guess they made, if the overall accuracy of their guesses exceeded a certain threshold. Participants were clearly informed of their earnings immediately following every round.
• These points were converted to British pounds at a predefined rate which was communicated to participants beforehand.Footnote 8
• Following the conclusion of the experiment, a lottery was held, in which 20% of participants were awarded a bonus payment according to the points they had earned throughout the experiment.
• The only difference in reward structure between the two environments is as follows:
- In the inclusive environment, 80% of the participants with the most accurate guesses earned 10 points per correct guess.
- In the exclusive environment, the top 20% earned 50 points per correct guess.Footnote 9
- In every other way, the two environments were identical.
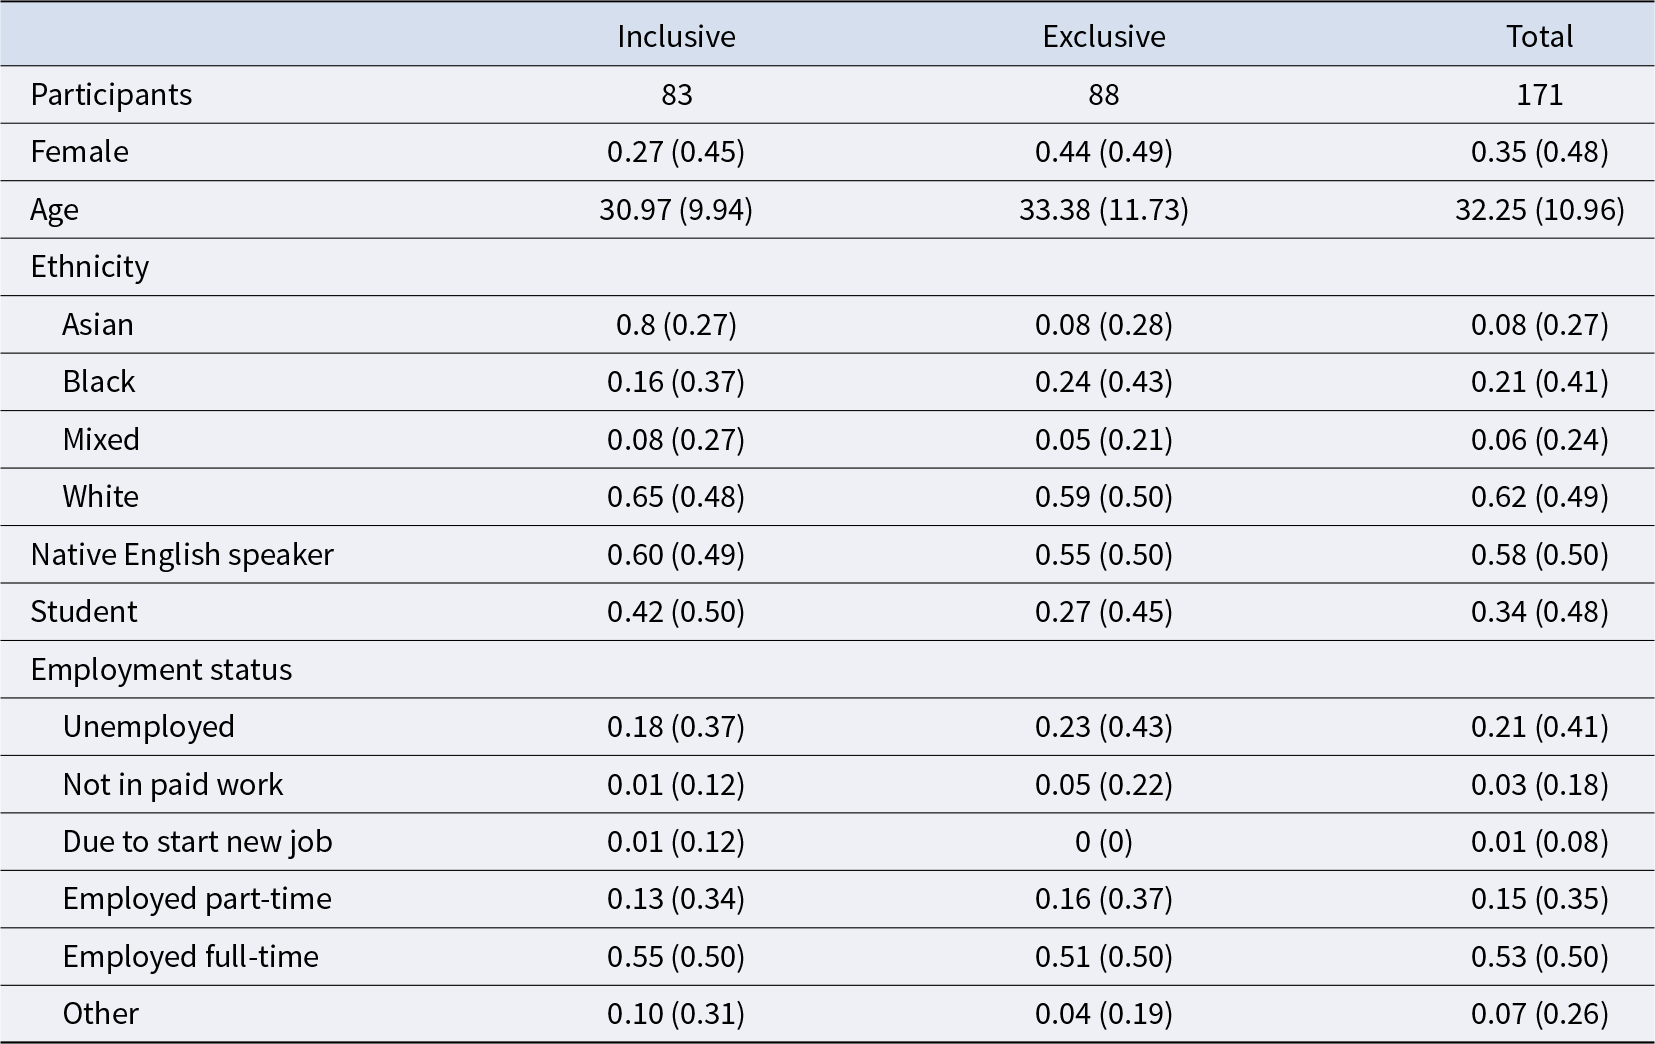
3.5. Participants
A total of 191 participants were recruited through Prolific, of which 20 failed to participate in a satisfactory manner (defined as participating in less than 20 rounds),Footnote 10 giving a sample of 171 participants who provided us with data. Participants were divided into eight groups of 21–25 participants each (see Table 1 for more details). Four groups played in the inclusive environment, and four in the exclusive environment. In each environment, two groups were assigned to the ‘Jane and Jill’ treatment, and the other two to the ‘Jill and Jane’ treatment. Session scheduling ensured consistency in terms of weekdays and hours to minimize potential external influences.
Participant distribution by group

Notes: The table presents the distribution of participants among the environments and treatments. ‘Groups’ indicates the number of groups assigned to the treatment, while ‘Participants’ indicates the total number of participants assigned to each environment-and-treatment combination.
Participants were directed to a virtual waiting room, which is a built-in feature offered by oTree. As soon as the waiting room had filled up with the participants, we launched the session. Upon the completion, participants were given a completion code and redirected back to Prolific, where they automatically received the base participation fee. Participants who had signed up but failed to complete the experiment were not paid, with the exception of those who had encountered technical difficulties, who were awarded full or partial compensation depending on the time and effort spent on the experiment. To ensure proper participation and guarantee that all information provided was fully visible to the participants, participation was restricted to desktop and laptop computers only, and all participants’ input was monitored throughout the experiment using the oTree platform.Footnote 11 Bonus payments were calculated and paid out manually, also through Prolific.
Table 2 shows a summary of the descriptive statistics of the participants in the experiment. These statistics were collected by Prolific, and not all participants provided information for every category. Table 2 shows that there are no statistical differences in the control variables between the treatment groups.
Descriptive statistics
Notes: The table shows the observations in the inclusive and exclusive environments. The table shows the mean and standard deviation (in parentheses) for the demographic characteristics: female indicator (Female); age in years (Age); Ethnicity, with categories including Asian, Black, Mixed, and White; indicator for whether the participant is a native English speaker; indicator for whether the participant is a student; and employment status, including unemployed, not in paid work (and not looking for work), due to start a new job, employed part-time, employed full-time, and other.
3.6. Prediction
We anticipate pronounced herding behavior in the inclusive environment. Specifically, we predict that when a majority choice emerges, the size of this majority will be considerably larger in the inclusive environment, approaching 100% of participants. Conversely, in the exclusive environment, majorities are expected to be smaller, closer to an evenly split 50%.
Furthermore, we foresee greater consistency in choices within the inclusive environment. Participants are likely to cluster around either ‘Jill’ or ‘Jane’ and maintain this choice across rounds. In contrast, the exclusive environment should exhibit more dynamic guess patterns, with participants frequently altering their choices in an attempt to stand apart from a dominant majority.
To quantify these behaviors, we propose the following statistical models:
 \begin{equation*}{\text{(1)}}\quad {\textrm{ clusterin}}{{\textrm{g}}_i} = {\alpha _1} + {\beta _1} \times {\textrm{inclusivit}}{{\textrm{y}}_i} + {\beta _2} \times {x_i} + {_i}\end{equation*}
 \begin{equation*}{\text{(2)}}\quad {{\text{fluctuation}}_i} = {\alpha _2} + {\gamma _1} \times {\text{inclusivit}}{{\text{y}}_i} + {\gamma _2} \times {x_i} + {\zeta _i}\end{equation*}
In these models:
• ‘Clustering’ measures the tendency of individuals to align with either ‘Jill’ or ‘Jane,’ as observed in the majority. Practically, this is defined as the proportion of participants in a given round whose choice aligns with the majority of the previous rounds.
• ‘Fluctuation’ assesses the likelihood of a participant switching their choice between ‘Jill’ and ‘Jane’ from one round to the next. To measure this, we use the proportion of participants in a given round who changed their decision compared to the previous round.
• ‘Inclusivity’ is a binary variable denoting the environment type, which equals 1 in the inclusive environment and 0 in the exclusive environment.
• x represents a range of control variables.
• ε and ζ are error terms for Models (1) and (2), respectively.
We hypothesize that in Model 1 (clustering), the coefficient  ${\beta _1}$will be positive, indicating higher clustering in the inclusive environment. Conversely, in Model 2 (fluctuation), ${\gamma _1}$ is expected to be negative, reflecting increased fluctuation in the exclusive environment. Furthermore, we anticipate the experiment to involve a learning process, so the magnitude of both coefficients is expected to grow in the later rounds of the game compared to its early rounds.
4. Results
4.1. Clustering
Figure 2 simply presents the distribution of bets made by participants that conformed to the majority and the minority in the preceding round. We identified the decision that received the majority of bets in the round before a given round; then, if the participant’s choice in a given round was the same option as the one that received the majority of bets, that decision was assigned to the ‘majority’ group; otherwise, it was assigned to the ‘minority’ group. Naturally, the data only contain rounds 2–30, omitting round 1, as well as any instances immediately following an even 50% split between ‘Jill’ and ‘Jane.’
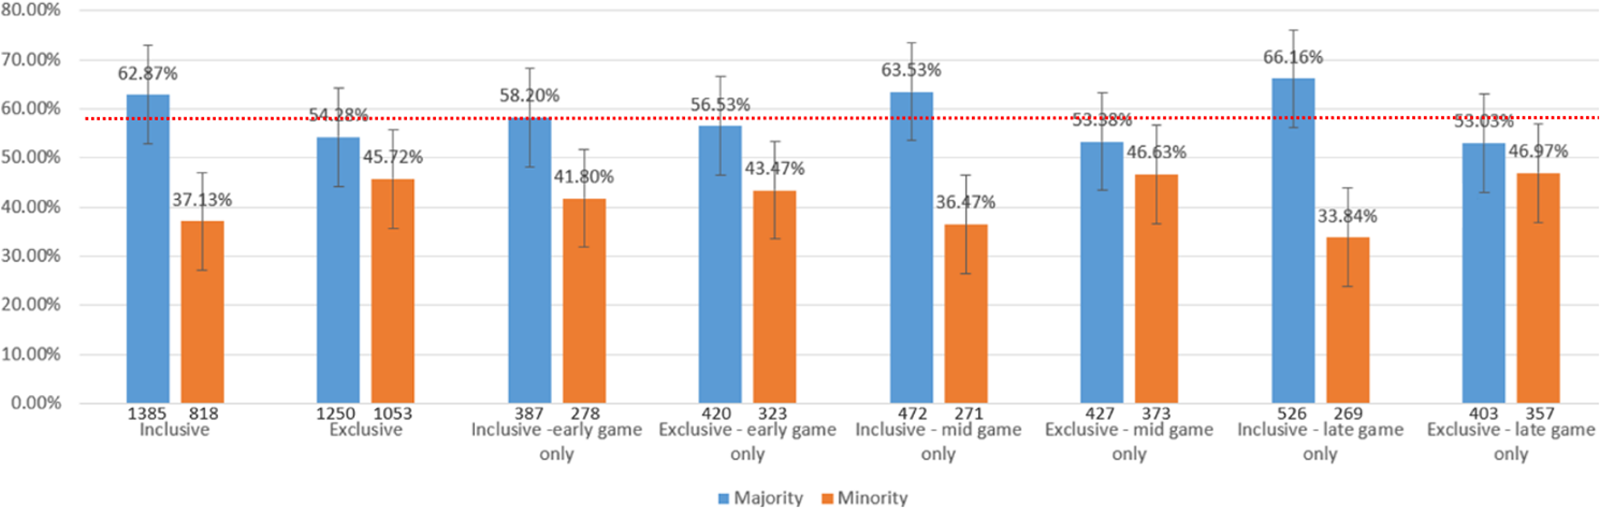
Majority and minority decisions by game stage
Note: This figure shows the distribution (in percentages) of instances in which a player decided to make a bet conforming with the majority and the minority in the preceding round (absolute number of observations appears underneath each column). Capped ranges indicate 95% confidence intervals. From left to right, each two pairs of columns show percentages for all rounds (2–30), for the early game only (rounds 2–10), for the mid-game (rounds 11–20), and for the late game (rounds 21–30) respectively. The share of majority decisions on the left of each column pair (in blue), and the share of minority decisions is on the right (in red). The dashed vertical line indicates the expected majority size (58.04%), derived from a binomial distribution.

The figure reveals that participants in the inclusive environment stuck to the majority choice 1,385 times (62.87%), whereas their counterparts in the exclusive environment only did so 1,250 times (54.28%). This disparity grows stronger as the game progresses. In the early game (rounds 2–10), 58.20% and 56.53% of participants conform to the majority in the inclusive and exclusive environments respectively. By the late game, this grows to 66.16% for the inclusive environment, and shrinks to 53.03% in the exclusive environment.
Note that in both environments there is a certain bias in favor of the majority, which increases in the inclusive environment and decreases in the exclusive one. This bias is potentially driven by the standard force of herding, that is, the perception that the majority knows better than oneself (see Bracht et al., Reference Bracht, Koessler, Winter and Ziegelmeier2010).
Moreover, we calculated the expected value of the majority size using a binomial distribution. Specifically, for 25 participants, the expected majority size is approximately 0.5804, based on the following formula:
 \begin{equation*}\mathop \sum \limits_{k = 0}^{25} {\left( {\frac{1}{2}} \right)^{25}}\left( {\begin{array}{*{20}{c}}
{25} \\
k
\end{array}} \right){\text{max}}\left( {k,25 - k} \right)\end{equation*}
\begin{equation*}\mathop \sum \limits_{k = 0}^{25} {\left( {\frac{1}{2}} \right)^{25}}\left( {\begin{array}{*{20}{c}}
{25} \\
k
\end{array}} \right){\text{max}}\left( {k,25 - k} \right)\end{equation*}Figure 2 illustrates this expected value of the majority size with a dotted horizontal line. This value falls between the observed majority sizes in the exclusive and inclusive environments, providing a useful baseline for comparison. It allows us to evaluate which environment aligns more closely with the equilibrium prediction under the assumption that ‘Jill’ and ‘Jane’ employ random strategies with equal probabilities.
The results indicate that, overall, the expected value lies roughly at the midpoint of the range representing the majority sizes observed in the two environments. This suggests that the equilibrium predictions perform comparably in both contexts. However, in the later stages of the experiment, the Nash equilibrium prediction appears to align more closely with the data in the exclusive environment.
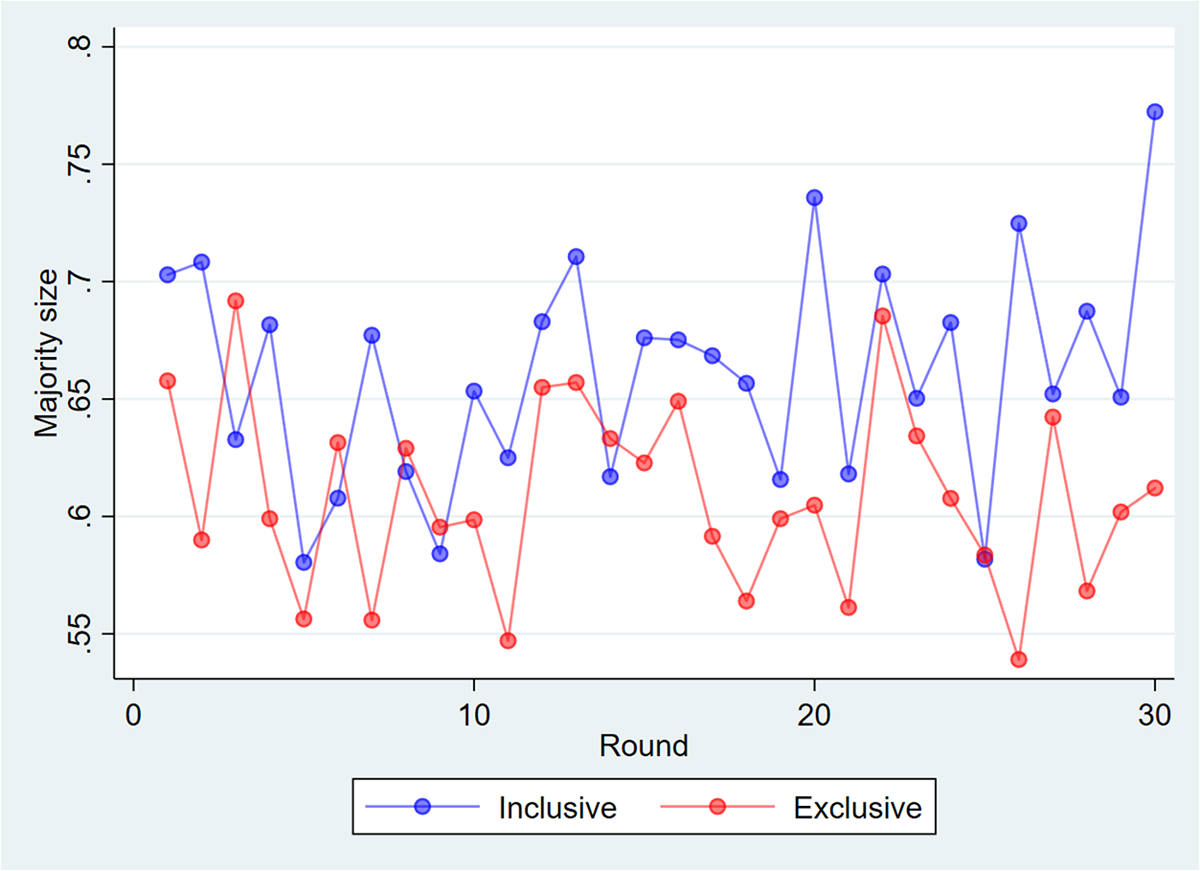
Figure 3 presents the average majority size for participants in the two environments. Majority size is defined as the portion of participants in a given group and round who selected the majority choice. For each round, we identified the guess that received the majority of votes. A majority size of 1 indicates a unanimous selection (of either ‘Jane’ or ‘Jill’) by all participants in a given round. A majority size of 0.5 signifies an equal distribution of participants between both guesses. This figure shows the average majority size for each round of the game for the inclusive and exclusive environments. This reveals a growing divergence in majority size between the two environments, from less than five percentage points in the first round of the game to over 15 percentage points in its final round.
Majority size by round and treatment
Note: This figure shows the average majority size for the inclusive environment (in blue) and the exclusive environment (in red). Each point represents the simple average of four observations (representing the four groups in each environment). The x axis represents the round number, starting from 1 and ending at 30. The y axis represents the majority size (0.5 – half of all participants selected ‘Jane,’ half selected ‘Jill;’ 1.0 – all participants selected ‘Jane,’ or all participants selected ‘Jill’).

In line with our predictions, the inclusive environment displayed a tendency for choices to cluster towards larger majority sizes. In other words, participants exhibited a stronger preference for either ‘Jane’ or ‘Jill.’ Meanwhile, the exclusive environment exhibited a more evenly distributed pattern of guesses. Consistent with our prediction that participants would undergo a learning process, we see that majority sizes in both environments are relatively similar in rounds 1–10. In rounds 11–30, however, there is a noticeable divergence, with majority sizes in the exclusive environment tending to be closer to 0.5 than those in the inclusive environment, and there is not a single round in the second half of the game in which the average majority size in the exclusive environment was larger than in the inclusive environment.
To more formally test this, we ran T testFootnote 12 comparing the majority size in each round between the two treatment groups. The inclusive environment shows larger majority sizes on average, of 66.11%, compared to 60.88% in the exclusive environment. This difference is significant at the 1% level. Furthermore, while in rounds 1–10, the difference between the environments is just 3.35 percentage points, and not statistically significant, in rounds 21–30 the difference more than doubles to 6.88 percentage points, statistically significant at the 1% level.
Table 3 presents the marginal effect coefficients for clustering (that is, whether a participant’s guess in a given round matches the majority choice in the preceding round). The observations are individual decision points; that is, each observation is a decision made by a specific participant in a specific round of the game. The dependent variable is an indicator which equals 1 if the participant’s choice in a given round is identical to the majority choice in the previous round, and 0 if the participant’s choice is identical to the minority choice in the previous round. Columns (1) and (2) show the full results (rounds 2–30, as there is no preceding for round 1) of all games played, without and with additional demographic control variables. Column (3) shows the early-game results (rounds 2–10), Column (4) shows the mid-game results (rounds 11–20), and Column (5) shows the late-game results (rounds 21–30). Column (6) shows the results for the early and mid-game (rounds 2–20), and Column (7) shows the results for the mid and late game (rounds 11–30). All instances where the preceding round was evenly split between ‘Jill’ and ‘Jane’ are omitted.
Clustering (probit)
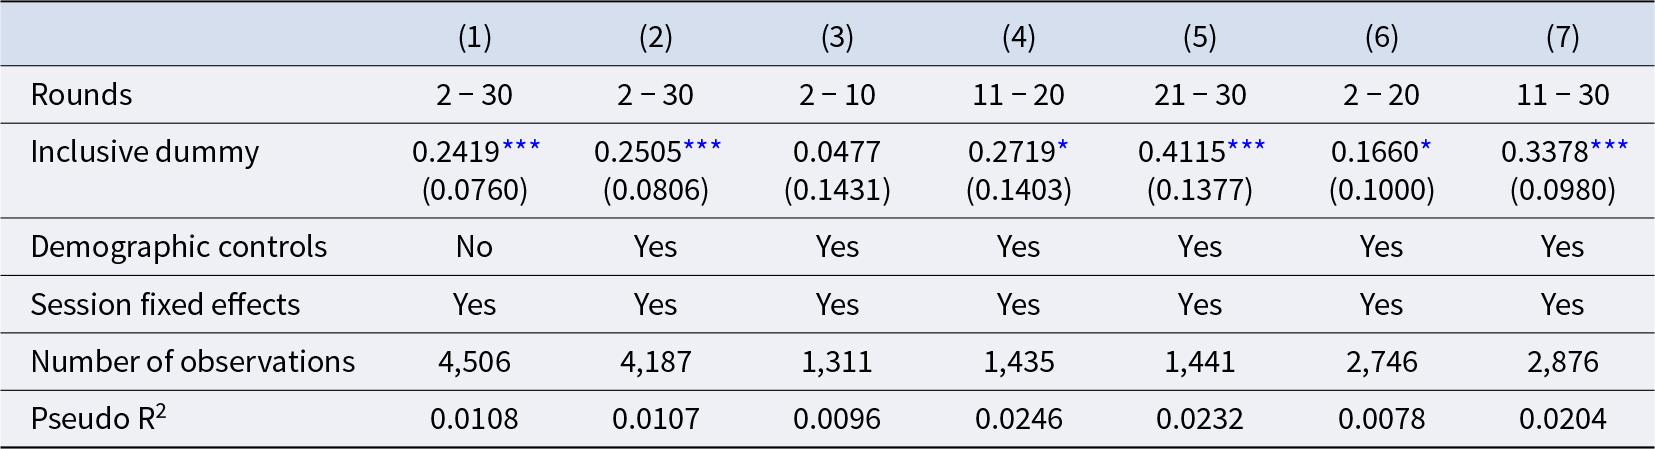
Notes: The table presents probit marginal effect coefficients for the treatment effect on whether participants’ choice conformed to the majority choice in the preceding round. The dependent variable is an indicator variable for whether a participant’s choice belongs to the majority in the previous round. Column (1) shows the basic model with session fixed effects. Column (2) shows the basic model with session fixed effects and additional control variables. Columns (3), (4), and (5) show the coefficient for only the early (rounds 2–10), mid (rounds 11–20), and late game (rounds 21–30) respectively. Column (6) shows the coefficient excluding the late game (rounds 2–20), and Column (7) shows the coefficient excluding the early game (rounds 11–30). The inclusive dummy equals 1 if the environment played is the inclusive environment, and 0 if it is the exclusive environment. Standard errors appear in parentheses.
* and *** denote significance at the 10% and 1% levels respectively.
Consistent with our predictions, the results show that overall, participants in the inclusive environment were 24–25% more likely to stay with the majority, statistically significant at the 1% level. Columns (3–7) illustrate the learning process observed in the game. While in the early game, the difference between the environments is negligible, it rises to 27% in the mid-game phase, and grows to 41% in the late game, with these differences being significant at the 10% and 1% levels respectively. In the mid and late game combined, participants in the inclusive environment are over 33% more likely to stay with the majority, significant at the 1% level.
4.2. Fluctuation
A Z test comparing the share of participants in each round who changed their decision compared to their decision in the preceding round (either from ‘Jill’ to ‘Jane’ or from ‘Jane’ to ‘Jill’) found no statistically significant differences between the two environments. Table 4 displays the marginal effect coefficients for fluctuation (participants’ decision in a given round to change their choice compared to their choice in the preceding round, either from ‘Jill’ to ‘Jane’ or vice versa). The dependent variable is an indicator variable which equals 1 if the participant’s decision changed in a given round compared to the previous round, and 0 if the decision did not change. Since participants were told the outcome of their bets after each round, and people are more likely to ‘double down’ on winning bets (see e.g., Abe et al., Reference Abe, Nakai, Yanagisawa, Murai and Yoshikawa2020; Gilovich et al., Reference Gilovich, Vallone and Tversky1985), we sought to examine the differential effect of a correct bet on the individual’s propensity to change their bet in the following round in the two environments. To this end, we included an independent variable showing the interaction between the environment and the accuracy of the participant’s guess in the previous round. This variable is equal to 1 if the participant’s previous bet was correct and if the participant is playing in the inclusive environment, and 0 otherwise.
Fluctuation (probit)
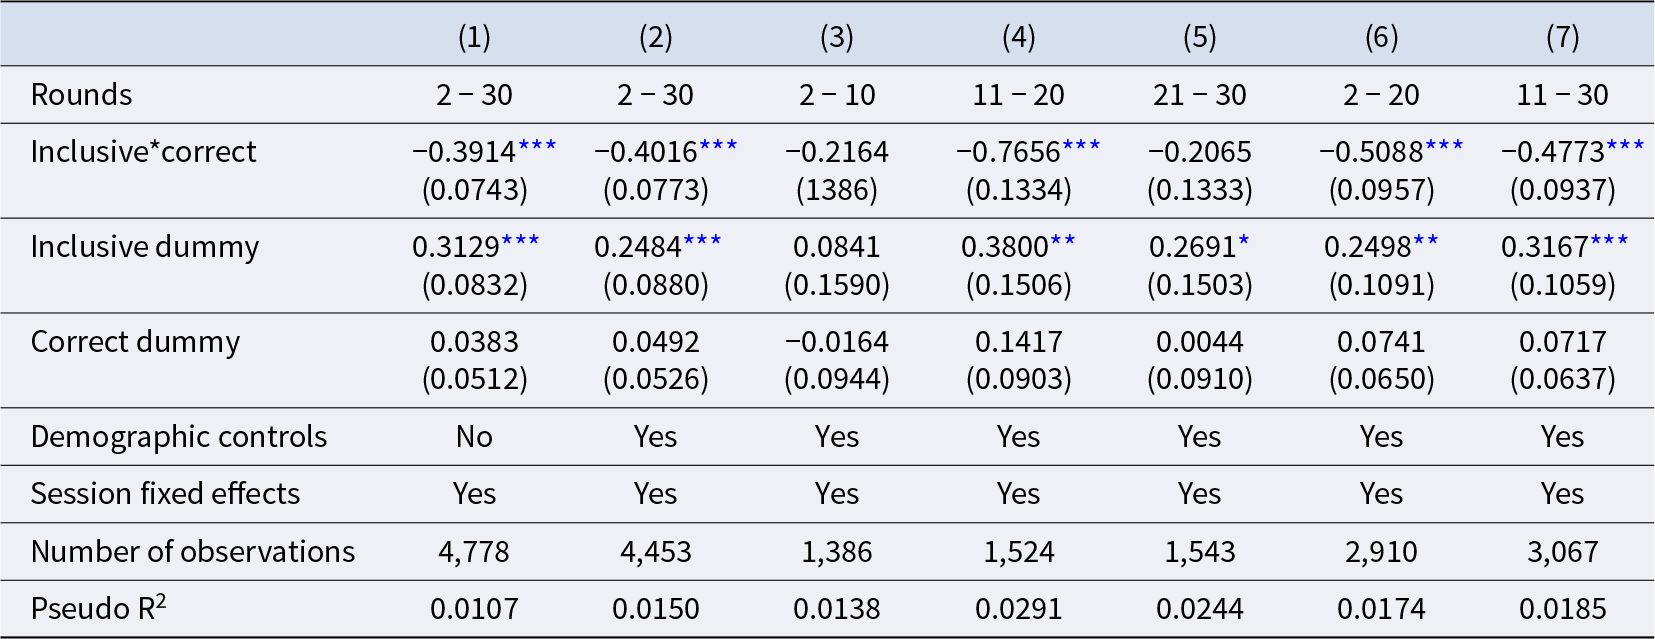
Notes: The table presents probit marginal effect coefficients for the treatment effect on participants’ choice to change their decision compared to the preceding round. The dependent variable is an indicator variable for choosing to change one’s decision relative to the previous round. Column (1) shows the basic model with session fixed effects. Column (2) shows the basic model with session fixed effects and additional control variables. Columns (3), (4), and (5) show the coefficient for only the early (rounds 2–10), mid (rounds 11–20), and late game (rounds 21–30) respectively. Column (6) shows the coefficient excluding the late game (rounds 2–20), and column (7) shows the coefficient excluding the early game (rounds 11–30). The inclusive*correct variable equals 1 if the environment played is the inclusive environment and if the participant’s guess in the previous round was correct, and 0 otherwise. The inclusive dummy equals 1 if the environment played is the inclusive environment, and 0 if it is the exclusive environment. The correct dummy equals 1 if the participant’s bet in the previous round was correct, and 0 if it was incorrect. Standard errors appear in parentheses.
* , **, and *** denote significance at the 10%, 5%, and 1% levels respectively.
Columns (1) and (2) show the full results (rounds 2–30, as there is no preceding for round 1) of all games played, with or without additional demographic control variables. Column (3) shows the early-game results (rounds 2–10), Column (4) shows the mid-game results (rounds 11–20), and Column (5) shows the late-game results (rounds 21–30). Column (6) shows the results for the early and mid-game (rounds 2–20), and Column (7) shows the results for the mid and late game (rounds 11–30).
Interestingly, while the results show an unexpectedly high overall propensity to fluctuate in the inclusive environment, they also show that, having placed a correct bet in a given round, participants in the inclusive environment were considerably more likely to stick to that decision in the following round. The coefficient for the latter effect appears to be considerably greater than that of the former, and varies widely, ranging from 20–76%, and averaging 39% for the entirety of the game. Also notably, we did not observe a straightforward learning process for fluctuation, which was higher in the mid-game stage (rounds 11–20) than in either the early (rounds 2–10) or late game (rounds 21–30). This likely arises due to the fact that participants’ decisions and learning process are influenced by the realization of their bet in the previous round, and not just the distribution of bets. Suppose that while herding starts to form, the majority choice of bet is wrong. Reinforcement will now push some people to join the minority (which guessed correctly in the last period). Indeed, this would be more prevalent among those who have not yet gained intuition about the advantage of being with the majority in this environment. This is in contrast to market entry games (e.g., Rapoport et al., Reference Rapoport, Seale and Winter2000), where the environment is deterministic, facilitating faster coordination. Further supporting this explanation, in our alternative experiment specification, where participants were not told the realization of their bets until the completion of the game, the inclusive dummy consistently receives a negative coefficient (for details, see Appendix B).
5. Reinforcement learning model
We present here a simple reinforcement learning model of the strategic environment.Footnote 13 We compare the behavior observed in the experimental game to the dynamics of the reinforcement learning model.
It is important to note that the Nash equilibrium is a static concept, referring to a stable situation where no player has an incentive to unilaterally deviate. The process by which such equilibria emerge remains an open question in game theory. Some dynamic models, such as best response dynamics, fictitious play, or evolutionary dynamics, are known to converge to Nash equilibria in specific types of games.
We adopt a more suitable approach for an experimental study by designing a reinforcement learning model, following the framework of Erev and Roth (Reference Erev and Roth1998). This model incorporates assumptions about sequential dependencies in players behavior.
Let  $p_t^A,{\text{ }}p_t^B$ be the propensities of playing A and B in period t, respectively.
Let  $q_t^A,{\text{ }}q_t^B$ be the probabilities of playing A and B in period t respectively. ${w_t}$ is the reinforcement weight at period t. This weight declines with t.
1. The probabilities of playing the two options are proportional to their respective propensities as follows: $q_t^A = \frac{{p_t^A}}{{p_t^A + p_t^B}}$, $q_t^B = \left( {1 - q_t^A} \right)$
2. We now have to define how the propensities change over time.
Let  $x\left( t \right)$ be the option chosen by a player in period t, and let $y\left( t \right){\text{ }}$be the option not chosen in period t: $x\left( t \right) \in \left\{ {A,B} \right\}$, $y\left( t \right) \in \left\{ {A,B} \right\}.$
Let us assume for simplicity that  $p_{t + 1}^{y\left( t \right)} = p_t^{y\left( t \right)}$; that is, only the propensity of the choice played changes from one round to the next, while the propensity of playing the option not chosen remains unchanged in the following round.
We then define:
 \begin{equation*}p_{t + 1}^{x\left( t \right)} = p_t^{x\left( t \right)} + {\delta ^ + }{w_t}\left[ {\pi \left( t \right) - \pi \left( {t/y\left( t \right)} \right)} \right]\end{equation*}
 \begin{equation*}{w_{t + 1{\text{ }}}} = \left( {1 - d} \right){w_t}\end{equation*} ${\delta ^ + } = {\text{ }}{\delta ^{}}$ if $\pi \left( t \right) - \pi \left( {\frac{t}{{y\left( t \right)}}} \right) \geq 0$, and 1 if $\pi \left( t \right) - \pi \left( {t/y\left( t \right)} \right) {\text{ }} \lt 0$.
where  $\pi \left( t \right){\text{ }}$is the payoff the player received in period t, $\pi \left( {t/y\left( t \right)} \right)$ is the payoff the player would have received had he played the other option $y\left( t \right)$, and δ is the weight of the impact of loss. d is the discount effect of the learning process.
3. Initial conditions are as follows:
 \begin{equation*}p_1^B = 1\end{equation*} $p_1^A$ can be easily derived from the true distribution of bets participants made in the first round of the experiment.
The parameters of the model are, w 1, d, and ${\text{ }}\delta $. Their values are determined using the experimental data.
To evaluate this model, we conducted a simulation of our experimental setting. In this simulation, a group of 20 simulated participants played 30 rounds of the game, betting between ‘1’ and ‘0’ in each round. The result of the bet was determined randomly by the computer. This was repeated 1,000 times each for the inclusive and exclusive environments.
We used mean squared error function to optimize for the fitness of the model with the experimental results, yielding the following optimal values:  $q_1^1 = 0.675,{\text{ }}{w_1} = 0.05$, d=0.1, δ=0.
Initial probabilities ( $q_1^1$ and $q_1^0$) for round 1 were set to 67.5% for ‘1’ and 32.5% for ‘0,’ to reflect the tendency of participants to prefer the first option presented to them, as observed in the real experiment. The reinforcement weight (w 1) in round 1 was set to 0.05, to prevent the magnitude of the rewards (10 and 50 points in the inclusive and exclusive environments respectively) from dominating the outcome. Learning (d) was set to a slow-intermediate rate of 0.1. The weight impact of gain (δ) was set to 0, as the behaviour of the simulated participants was closest to that of the real participants when they adjusted their propensities exclusively according to loss. Propensities and probabilities in rounds 2–30 were calculated according to our model. We then calculated the average majority size obtained in each round for the inclusive and exclusive environments.
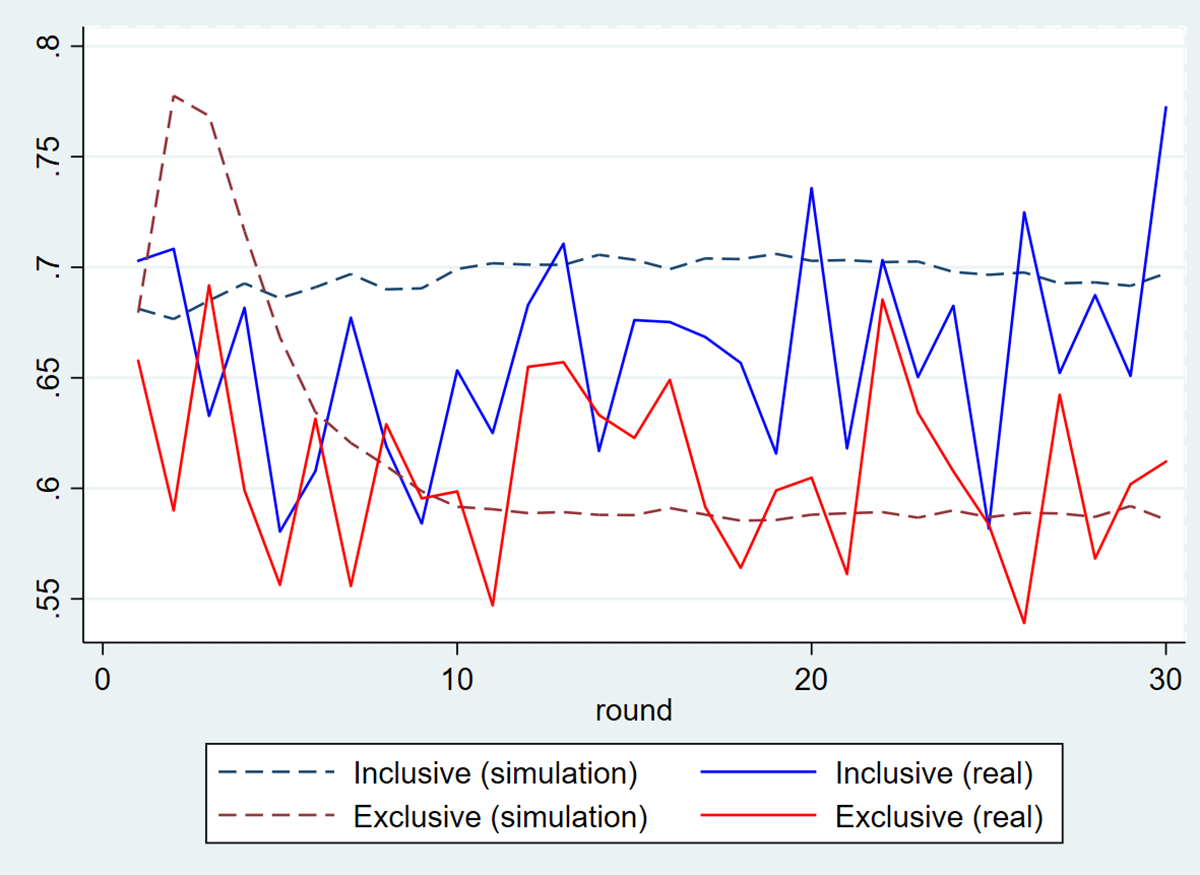
The outcome of the simulation is presented in Figure 4. In both environments, the simulation starts with a majority size of approximately 67.5%. However, they diverge, with the majority size in the inclusive environment growing slightly, reaching approximately 70% by round 11, subsequently staying within the 69.2–70.6% range until round 30. Meanwhile, in the exclusive environment, following an initial jump to 77% in round 2, the majority size gradually shrinks, stabilizing at around 58.8% by round 14.Footnote 14 This initial jump in the exclusive environment occurs as participants overcompensate, with too many seeking to escape the majority in the first round, resulting in the creation of an even bigger majority in subsequent rounds. As part of their learning process, participants gradually overcome this tendency to overcompensate, eventually settling on the smaller majority size as expected.
Majority size by round and treatment (real and simulated)
Note: This figure shows the average majority size for the inclusive environment (in blue) and the exclusive environment (in red). A continuous line represents the true results of the experiment, and a dashed line represents the results of the simulation. Each point represents the simple average of four observations (representing the four groups in each environment). The x axis represents the round number, starting from 1 and ending at 30. The y axis represents the majority size (0.5 – half of all participants selected ‘Jane,’ half selected ‘Jill’; 1.0 – all participants selected ‘Jane,’ or all participants selected ‘Jill’)

The experimental results show a somewhat smaller difference between the two environments than the simulation results, as well as a greater variance between rounds. The variance can be easily explained as occurring due to the considerably smaller sample size in the experimental results (191 participants in eight groups) than in the simulation (50,000 participants in 2,000 groups). The difference in means is more challenging to explain, but the apparent upward trend in the experimental results for the inclusive environment indicates that the learning process may be longer than the 30 rounds played in the game. However, this would likely be impractical to test in our experimental setting, as the repetitive tasks required, in conjunction with the fairly small amounts of money offered, would likely exceed many participants’ attention spans, and could also result in information overload (as participants are shown the outcomes of every single preceding round played).
6. Discussion and conclusion
Amnon Rapoport was perhaps one of the most ‘cognitive’ experimental economists. His primary interest lay in decision-making situations, whether individual or interactive, that pose a cognitive or analytical challenge to the parties involved. This contrasts with many other experimental economists who are more inspired by strategic situations that introduce moral dilemmas or generate emotional reactions in participants. In private conversations with the second author of this paper, Rapoport often emphasized that moral sentiments and emotions are challenging to study due to their susceptibility to multiple interpretations, both from experiment participants and researchers. We speculate that the game we studied here aligns with the nature of those Rapoport was particularly drawn to. Like many of Rapoport’s games, it is far from trivial, yet a relatively short learning process in the lab yields strategic behavior consistent with equilibrium predictions.
Our experimental results underscore the significant influence of the strategic environment on herding and divergence in betting behavior. Consistent with our theoretical predictions, we observed a pronounced inclination for players to align with the majority in an inclusive environment, whereas in an exclusive setting, participants actively sought to distinguish their choices from the group norm. While a complete convergence to the Nash equilibria was not observed, the prevalence of a larger majority group in the inclusive environment was notable. This majority choice demonstrated stability, often persisting throughout the game once established in the early rounds. Conversely, in the exclusive environment, a marked tendency for diversification was evident, with participants not only balancing their guesses more evenly but also more likely to switch between ‘Jane’ and ‘Jill’ after making a winning bet – a behavior less observed in the inclusive setting.
Interestingly, the increasing preference for majority alignment in the inclusive environment as the game progresses is evidence of a learning process with dual aspects: First, it allows players to gradually understand the strategic considerations of the game. Second, it enables them to coordinate a choice around which a majority will gradually grow.
The classic game theoretic hawk-dove game offers an interesting analogy, particularly in the exclusive scenario where players compete intensely for a single funding opportunity. This dynamic creates a situation in which players must balance aggressive (hawk) and conservative (dove) strategies. In this context, divergence is incentivized, and strategic imbalance arises because one player benefits from diverging while the others align. The exclusive environment fosters strategic differentiation by introducing externalities, which may be positive or negative depending on the decision in question.
Beyond the obvious context of contests, the potential applications of the model seem to be much broader, offering insights into social, economic, and political realms. These include the following:
1. Policy design for fostering competition in innovation: Consider a scenario where drug companies are competing to develop a drug using one of two technologies, T1 and T2. One of these technologies allows for much faster development, but firms initially do not know which is superior, assigning equal prior probabilities to each. Each firm must select a technology and begin development. Firms that choose the advanced technology develop faster than those opting for the inferior one, with development order determined randomly within each group. The government can influence the competition by deciding on the number of licenses (or production capacities) to issue, allocated on a first-come, first-served basis. If the government sets a high capacity constraint (allowing more than half of the firms to obtain licenses), the environment mirrors our inclusive scenario, leading all firms to choose the same technology. Conversely, if the government imposes a low capacity constraint (limiting licenses to fewer than half of the competing firms), it ensures that both technologies are tested, as firms split their decisions evenly to hedge their bets and maximize their chances of success.
2. Relative wealth and investment decisions: Whether in the context of economic success, intellectual reputation, or social prominence, status is often relative within a group. The nature of this status – inclusive or exclusive – profoundly influences agents’ strategies. In an inclusive status environment, agents herd their bets seeking to be conventional. If their choice of behavior turns out to be wrong, they are protected against being dragged to the bottom of the social scale as would have happened had they been part of a small minority that acted wrongly. However, when status involves intense competition, people will be motivated to act unconventionally, as the only option to gain status is by being part of a small minority that acted correctly. Hence, in exclusive settings, people tend to diverge in an attempt to stand out. For instance, in a real estate market in the wake of a stock market boom, those who participated in the boom find their purchasing power significantly enhanced, whereas non-participants face reduced affordability. The set of winners is relatively large (inclusive environment), so investors will choose to herd with the market. Conversely, in high-end markets, only the most successful investors can afford luxury properties, while others are left out, indicating a stark difference in outcomes based on investment strategies (exclusive environment). As a result, more investors will go against the market.
3. Financial markets and auction systems: Our findings can inform the design of financial markets and auction systems by providing insights into how competitive intensity affects herding and diversification. This understanding can help distinguish herding behavior that emerges for strategic reasons from that driven by psychological or informational factors. Such insights can aid in creating mechanisms to mitigate irrational market bubbles and promote more stable and efficient markets.
4. Political lobbies: Consider a group of lobbies that seek to make campaign contributions to one of two political leaders, in exchange for the leader adopting a policy favoring their interests. Only one of these leaders can be elected and each has the same chance of being elected. Each lobby has to decide which of the two candidates to support with campaign contributions. To avoid public criticism, the elected leader can only cave in to lobbies’ pressure on a certain number of policies. Again, this example matches well with the games. Here, winning means that a lobby manages to get the elected leader to approve the policy it is interested in. The implications of our model depend on the level of corruption prevailing in the underlying political environment. If the leader is willing to approve a large number of corrupt policies so that most of the lobbies will be served, then the equilibrium will involve herding and all lobbies will support the same leader. With less corruption, only a minority of the lobbies can be served, and campaign contributions will be split between the two candidates more equally.
In conclusion, by understanding how competitive intensity influences strategic decision-making, policymakers can design more effective regulations and incentives that promote a balanced and innovative environment.
Our study provides a comprehensive analysis of how competitive intensity influences strategic decision-making, with broad implications for both theoretical advancements and practical applications. By extending Rapoport’s legacy of cognitive and analytical exploration in experimental economics, this paper contributes to the understanding of strategic behavior in competitive environments.
Supplementary material
The supplementary material for this article can be found at https://doi.org/10.1017/eec.2025.10.
Data availability statement
The replication material for the study is available at https://doi.org/10.17632/ffk9nphmxv.1.
Acknowledgements
We acknowledge the helpful comments and suggestions from the anonymous referees, the Guest Editor Ido Erev, and the Advisory Editor, Roberto A. Weber. We are also grateful for the feedback on previous versions from Sergiu Hart, Ilan Kremer, Daniel Seidmann, and Jörgen Weibull. Eyal Winter wishes to acknowledge financial support from the ESRC through research grant no. ECA7674.
Author contributions
All authors contributed to the study conception and design.
Competing of interest
The authors declare that they have no competing interests.
Ethical standards
This research was conducted in compliance with ethical standards. All experimental procedures involving human participants were approved by the Hebrew University’s Ethics Review Board. Informed consent was obtained from all individual participants involved in the study.


 Open access