

1. Introduction
The east–west-oriented Northern and Southern Permian basins (Figure 1) in northwest Europe began deposition with the terrestrial early Permian Rotliegend Group in sag basins (e.g., Ziegler, Reference Ziegler1990; Glennie et al. Reference Glennie, Higham, Stemmerik, Evans, Graham, Armour and Bathurst2003). Particularly in the Northern Permian Basin north of the Mid North Sea High, the sedimentary and tectonic evolution and sediment transport dynamics are poorly understood. This knowledge gap reflects an absence of outcrops, scarcity of age-diagnostic fossils and limited well penetrations (Stemmerik et al. Reference Stemmerik, Ineson and Mitchell2000; Glennie et al. Reference Glennie, Higham, Stemmerik, Evans, Graham, Armour and Bathurst2003; Kombrink and Patruno, Reference Kombrink and Patruno2022). Sedimentological studies, provenance analyses and palaeogeographic reconstructions have largely been pursued independently, and no previous work has integrated all three within a single, basin-scale framework (e.g., Heward, Reference Heward, Miall and Tyler1991; Stemmerik et al. Reference Stemmerik, Ineson and Mitchell2000; Glennie et al. Reference Glennie, Higham, Stemmerik, Evans, Graham, Armour and Bathurst2003; Patruno et al. Reference Patruno, Kombrink and Archer2022).
Study area (black square) with the nine core-analysed wells (red) and additional analysed wells (black) from the Rotliegend Group and onshore geological stratigraphy after Bouysse (Reference Bouysse2014). Location of transects in Figures 3 and 4 is indicated, together with zircon Groups. The positions and shapes of topographic highs and Permian basins are after Glennie et al. (Reference Glennie, Higham, Stemmerik, Evans, Graham, Armour and Bathurst2003), Scisciani et al. (Reference Scisciani, Patruno, D’Intino and Esestime2021), Houghton et al. (Reference Houghton, Brackenridge, Neilson and Underhill2024), Bauck et al. (Reference Bauck, Faleide, Fossen and Gawthorpe2025), NOD (2025) and Urrez et al. (Reference Urrez, Escalona and Augustsson2025). FGS = Fladen Ground Spur, MH = Mandal High, PBR = Patch Bank Ridge, SH = Sele High, SP = Stavanger Platform, UH = Utsira High.
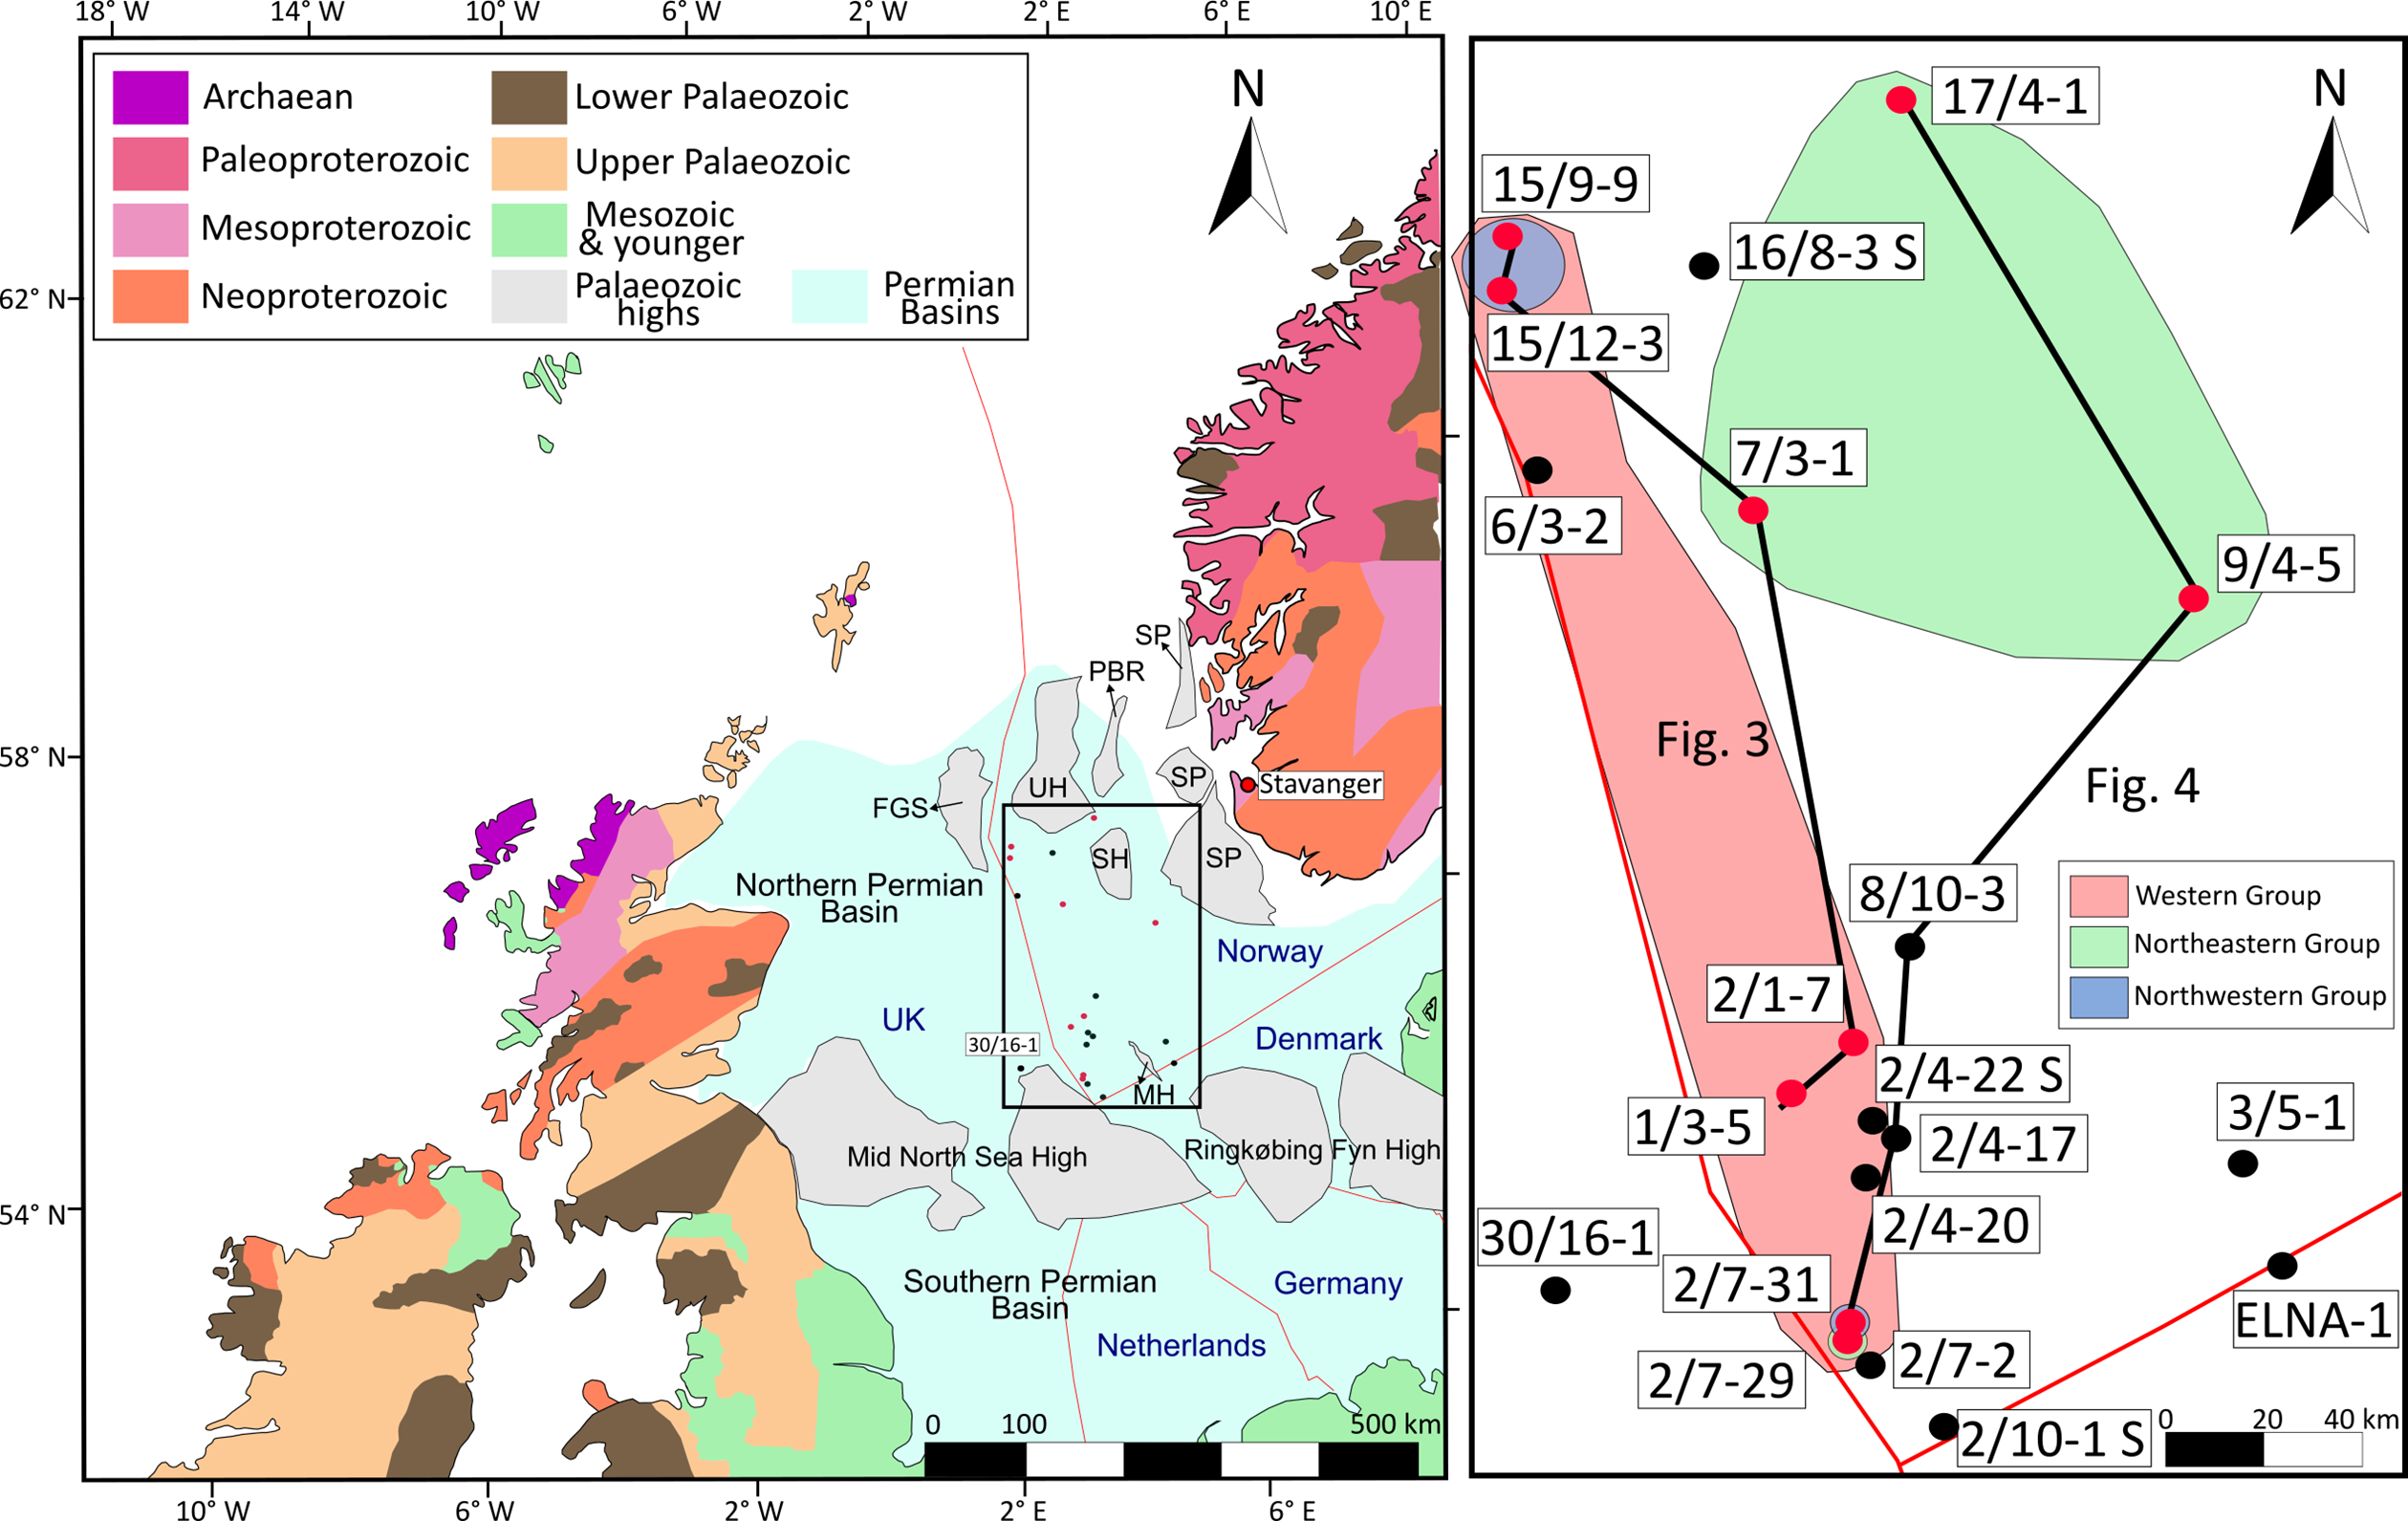
Figure 1. Long description
The map displays the east-west-oriented Northern and Southern Permian basins in Europe. It highlights the study area with a black square and marks nine core-analyzed wells in red and additional analyzed wells in black within the Rotliegend Group. The map includes transects for Figures 3 and 4, along with zircon groups. Topographic highs and Permian basins are outlined based on various geological studies. Key labeled locations include the Fladen Ground Spur, Mandal High, Patch Bank Ridge, Sele High, Stavanger Platform, and Utsira High. The map uses color coding to differentiate between various geological periods such as Archaean, Paleoproterozoic, Mesoproterozoic, Neoproterozoic, Lower Paleozoic, Upper Paleozoic, Mesozoic and younger, and Paleozoic highs.
Understanding sediment transport pathways and associated hydrological evolution is crucial for refining palaeogeographic reconstructions in the Northern Permian Basin and for evaluating the influence of tectonic activity, climate and palaeotopography on sediment dispersal. It also has implications for reservoir-quality predictability. Knowledge about sediment transport directions for the early Permian in the Northern Permian Basin is limited. Based on palaeogeographic reconstructions, Marshall and Hewett (Reference Marshall, Hewett, Evans, Graham, Armour and Bathurst2003) and Glennie et al. (Reference Glennie, Higham, Stemmerik, Evans, Graham, Armour and Bathurst2003) suggested that Rotliegend Group deposits in the North Sea were sourced from locally recycled Devonian Old Red Sandstone Group detritus, the Caledonian mountain ranges in Scotland and Scandinavia and the Mid North Sea–Ringkøbing–Fyn highs. Lundmark et al. (Reference Lundmark, Bue, Gabrielsen, Flaat, Strand and Ohm2014) suggested zircon input to the Norwegian Embla petroleum field from northern sources or reworking of older Palaeozoic deposits.
The partial discrepancy between the reconstruction and zircon studies may be due to limited knowledge about sediment transport pathways in subbasins of the larger sag basin. In addition, usually tectonic crustal configurations that involve the North Sea are presented in their present-day geometry (e.g., Patruno et al. Reference Patruno, Kombrink and Archer2022). However, the crust has undergone phases of extension since the Permian, modifying the original basin and source-area configurations. Without accounting for these changes, palaeogeographic and provenance reconstructions risk oversimplifying sediment transport patterns and misrepresenting source-sink relationships. The Norwegian part of the Northern Permian Basin is part of the extended area. It represents a subsurface laboratory due to its geological position between the Norwegian and British Caledonides, in proximity to the Variscan Orogen, Permian volcanic deposits, the Mid North Sea High and Precambrian cratons in Norway, the UK and Greenland.
Beyond reconstructing sediment sources, linking provenance and facies to reservoir properties is crucial for exploration. Urrez et al. (Reference Urrez, Cedeno, Escalona, Augustsson and Blanconein review) identified a north–south porosity trend in Rotliegend Group reservoirs of the southern-central Norwegian North Sea, with poor quality in the north, anomalously high porosity in the centre and moderate values in the south. This was attributed to the buffering effect of overlying Zechstein Group salt, which reduced mechanical compaction and diagenetic alteration by limiting heat flow. However, the influence of depositional facies and sediment provenance on primary porosity development remains untested.
This study aims to reveal proximal and local sediment transport pathways for the Early Permian in the North Sea, as well as their dependency on tectonic activity in the North Sea. Focus is on the Norwegian Continental Shelf because it lies at the junction of multiple potential sediment sources and remains one of the least understood regions of Permian sediment transport in northwest Europe. Sedimentological and detrital zircon analyses were conducted on cores, and a palinspastic reconstruction was used to better constrain source-to-sink relationships. By combining provenance data with reservoir characteristics, this study also explores how sediment sources and depositional facies may have influenced primary porosity and reservoir-quality development. This study represents the first integrated reconstruction of Early Permian source-to-sink relationships in the Norwegian North Sea, combining detrital zircon provenance, sedimentological and petrophysical analysis, and dynamic plate restoration to link sediment transport with reservoir quality. Beyond the regional context, this study also illustrates how integrating provenance, facies and structural data within a dynamic palinspastic, cross-border framework can resolve sediment transport evolution in deeply buried, tectonically overprinted basins.
2. Geological setting
2.a. The Rotliegend group in the Northern Permian basin
The Norwegian sector of the Northern Permian Basin occupies a key position near the triple junction of Laurentia, Avalonia and Baltica (Pharaoh, Reference Pharaoh1999). This location reflects a complex tectonic history in which pre-existing crustal weaknesses and fault systems influenced basin evolution (Fossen, Reference Fossen2010). The region was affected by the Caledonian orogeny during the Siluro–Devonian and the Variscan orogeny from the Carboniferous to Permian, followed by Late Carboniferous to early Permian crustal stretching, magmatism and volcanism (Urrez et al. Reference Urrez, Escalona and Augustsson2025). During the Palaeozoic, pull-apart and backbulge basins developed as long-lived depocentres, serving as sinks for Rotliegend Group sediment (Urrez et al. Reference Urrez, Escalona and Augustsson2025).
The Rotliegend Group overlies Carboniferous or Devonian sedimentary successions or, locally, crystalline basement (Glennie et al. Reference Glennie, Higham, Stemmerik, Evans, Graham, Armour and Bathurst2003; Patruno et al. Reference Patruno, Kombrink and Archer2022; Urrez et al. Reference Urrez, Escalona and Augustsson2025). The Rotliegend Group was deposited in an intra-cratonic sag basin under arid, low-latitude conditions, dominated by extensive aeolian and playa-lake environments, with prevailing palaeowinds from the north-northwest and fluvial input along basin margins (Heward, Reference Heward, Miall and Tyler1991; Glennie et al. Reference Glennie, Higham, Stemmerik, Evans, Graham, Armour and Bathurst2003; Patruno et al. Reference Patruno, Kombrink and Archer2022). Along the southern margin, close to the Mid North Sea–Ringkøbing–Fyn High, aeolian strata interfinger with fluvial deposits. Along the northern margin, coarse-grained facies indicate local basement erosion and short transport fluvial input from, for example, the adjacent Utsira High (Figure 1; Glennie et al. Reference Glennie, Higham, Stemmerik, Evans, Graham, Armour and Bathurst2003). Sedimentation was further influenced by intra-basinal elements such as the Fladen Ground Spur and marginal highs such as the Utsira High, Patch Bank Ridge and Stavanger Platform, which locally supplied sediment and acted as topographic barriers that controlled sediment transport pathways and depositional patterns (Figure 1; Glennie et al. Reference Glennie, Higham, Stemmerik, Evans, Graham, Armour and Bathurst2003; Bauck et al. Reference Bauck, Faleide, Fossen and Gawthorpe2025).
In the Norwegian sector, two main sub-units of the Rotliegend Group are recognized (Figure 2; Glennie et al. Reference Glennie, Higham, Stemmerik, Evans, Graham, Armour and Bathurst2003; Urrez et al. Reference Urrez, Escalona and Augustsson2025). The lower Rotliegend Group, restricted to the south, has the influence of volcanism and records igneous activity under semi-desertic conditions. The upper Rotliegend Group is laterally extensive and siliciclastic. It ended with a marine transgression that caused deposition of the marine-evaporitic Zechstein Group (e.g., Glennie et al. Reference Glennie, Higham, Stemmerik, Evans, Graham, Armour and Bathurst2003).
(A) Lithostratigraphic framework of the Rotliegend Group in the Norwegian sector after NPD (2014). (B) Schematic depositional interpretation in this study. Facies distributions are conceptual. Permian volcanic pulses (after Stemmerik et al. Reference Stemmerik, Ineson and Mitchell2000) and detrital zircon maximum depositional ages (MDA) from this study provide approximate temporal constraints. Two depositional phases are illustrated: an early hyper-arid erg phase followed by a semi-arid phase with increased hydrological connectivity and development of interdune and playa-lake deposits. They are separated by a regionally correlatable super-bounding surface. Well positions are schematic and not to scale: 2/7-31 (1); 15/12-3 (2); 7/3-1, 2/1-7, 8/10-3 (3–5); 9/4-5 (6); 17/4-1 (7).
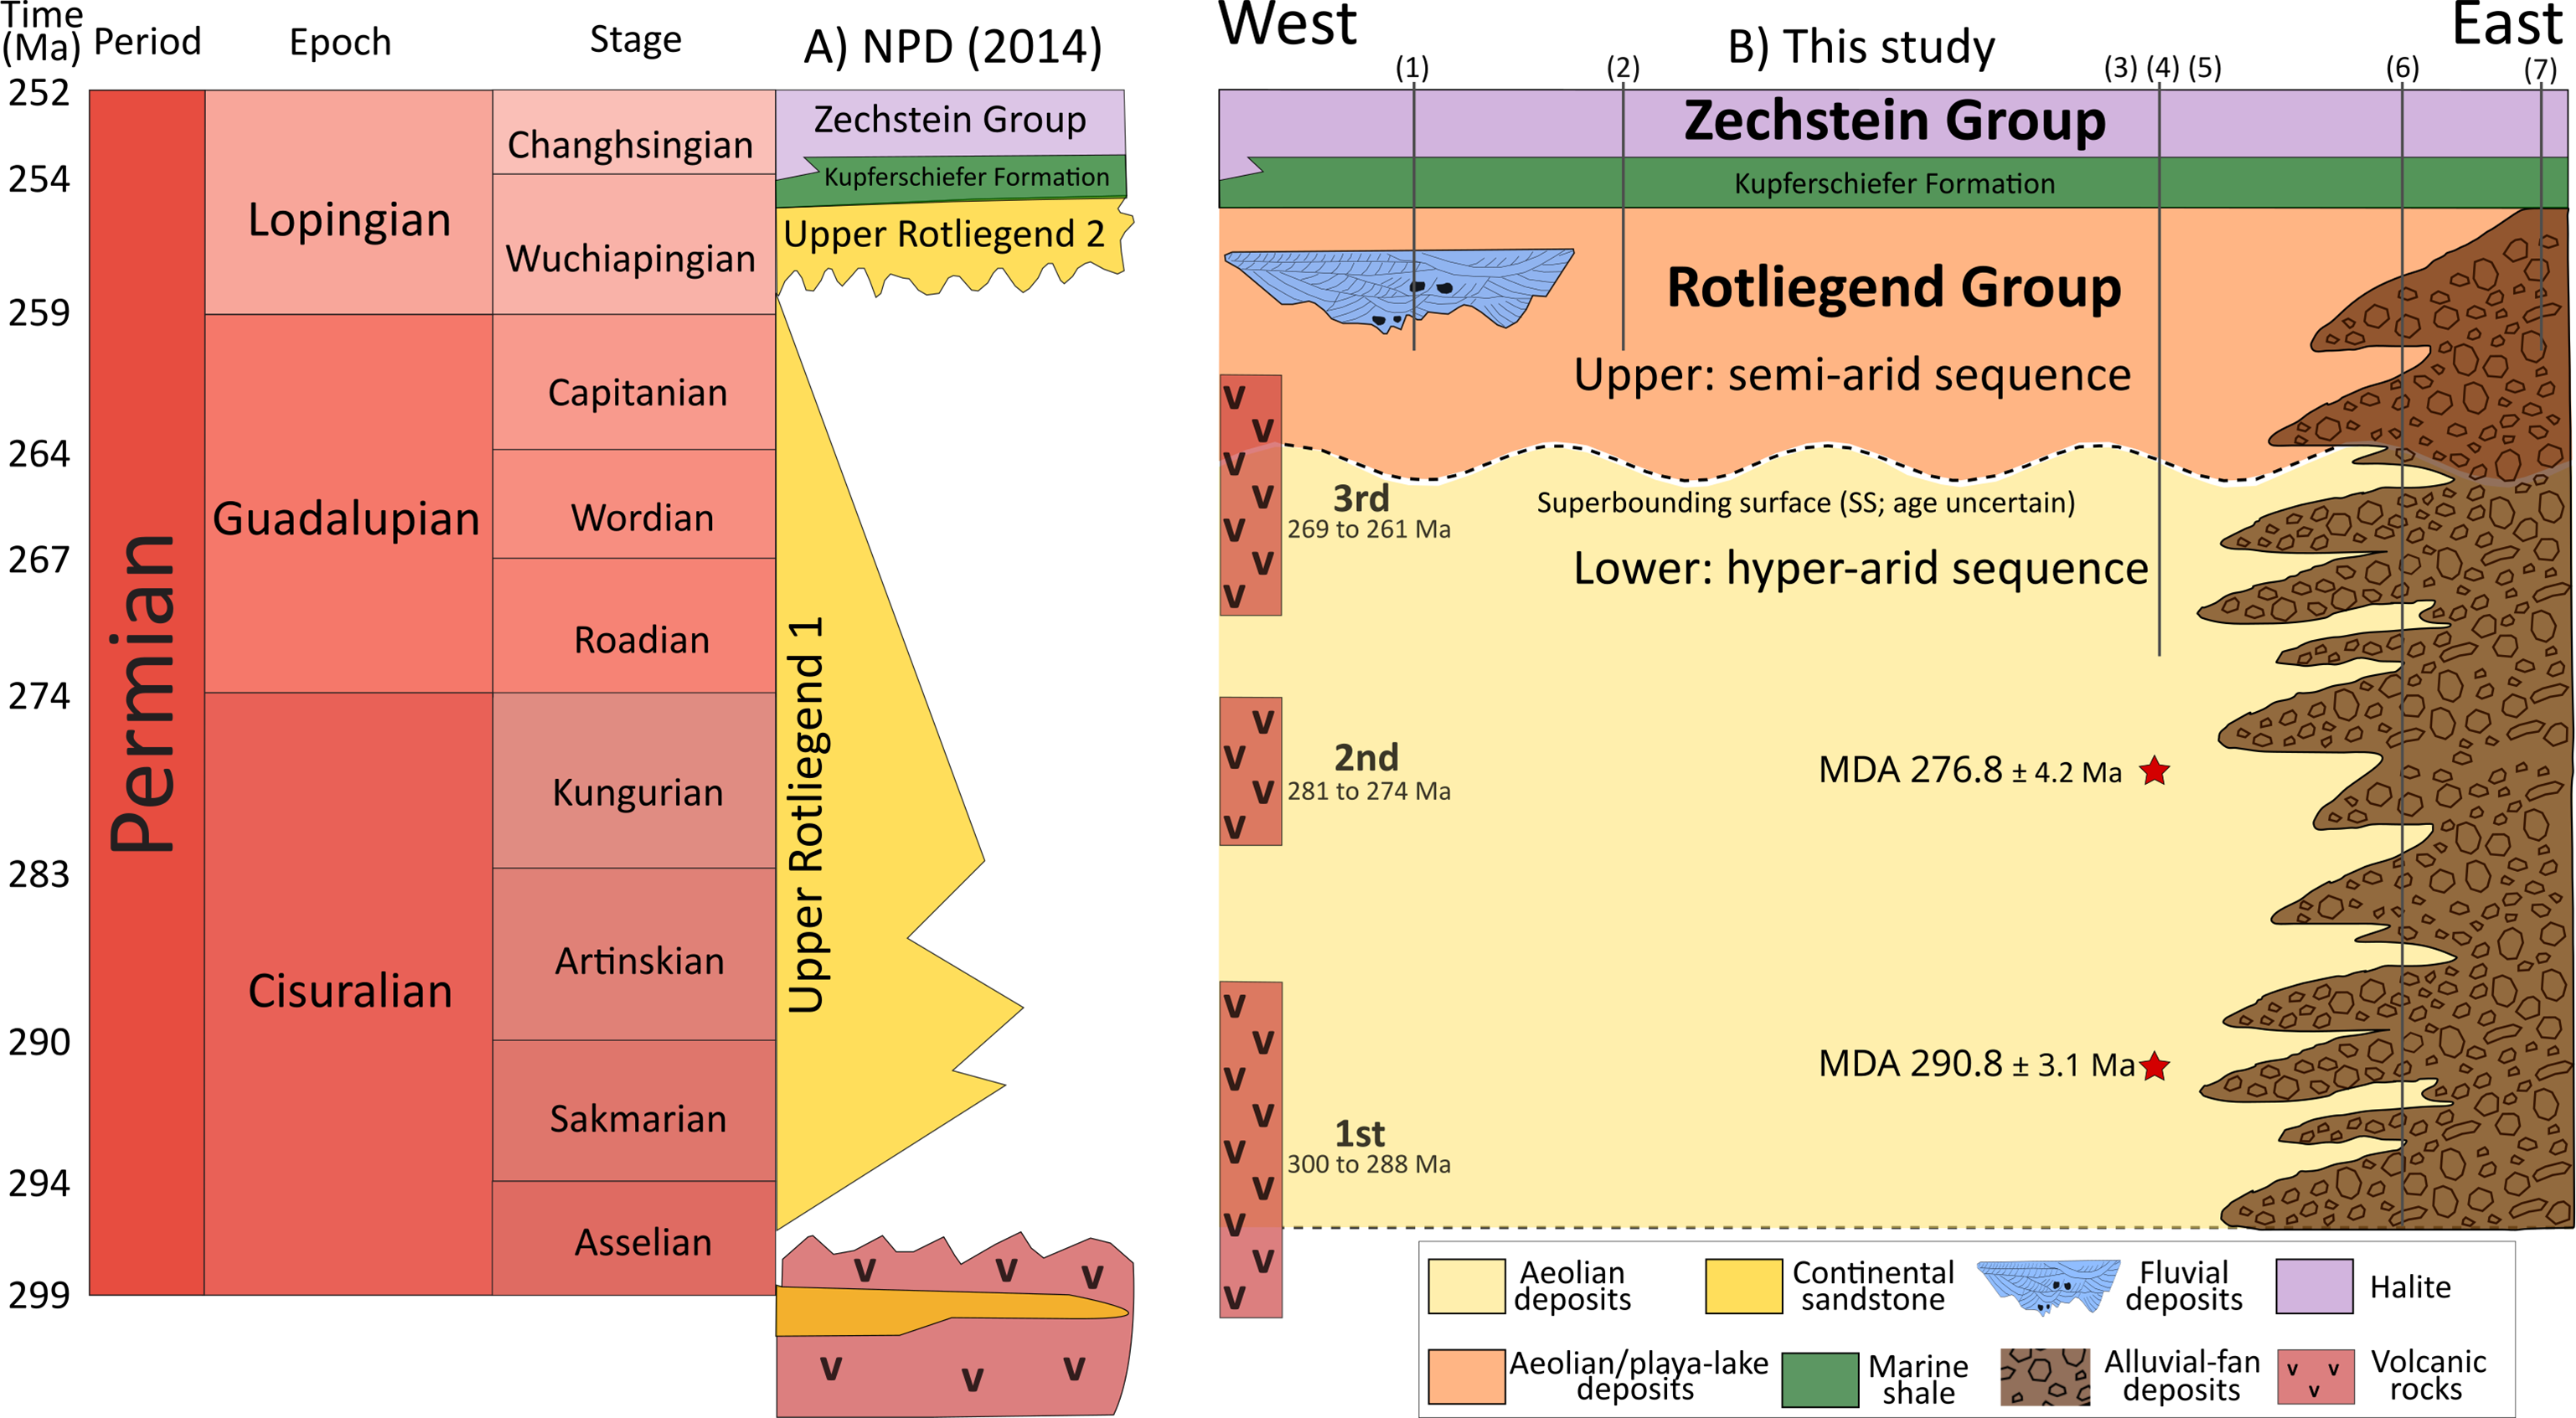
Figure 2. Long description
The diagram consists of two main parts labeled A and B. Part A shows the lithostratigraphic framework of the Rotliegend Group in the Norwegian sector, divided into different stages and epochs of the Permian period. Part B presents a schematic depositional interpretation, highlighting two depositional phases: an early hyper-arid erg phase and a later semi-arid phase with increased hydrological connectivity. The diagram includes various geological formations, volcanic pulses, and detrital zircon maximum depositional ages, providing temporal constraints. Well positions are indicated schematically and are not to scale.
2.b. Potential sediment sources
Potential sediment sources for the Rotliegend Group in the Norwegian sector of the North Sea include Archaean sources in East Greenland, the northwest of Scotland and an offshore basement complex north of Scotland and west of the Shetland Islands, interpreted as part of the Faroe-Shetland Terrane (e.g., Stoker et al. Reference Stoker, Hitchen and Grahan1993; Fonneland et al. Reference Fonneland, Lien, Martinsen, Pedersen and Košler2004; Ritchie et al. Reference Ritchie, Noble, Darbyshire, Millar, Chambers, Ritchie, Ziska, Johnson and Evans2011; Schmidt et al. Reference Schmidt, Morton, Nichols and Fanning2012; Holdsworth et al. Reference Holdsworth, Morton, Frei, Gerdes, Strachan, Dempsey, Warren and Whitham2019). In Norway, Archaean rocks are restricted to the north (Bergh et al. Reference Bergh, Kullerud, Corfu, Armitage, Davidsen, Johansen, Pettersen and Knudsen2007). Isolated Archaean zircon crystals also occur further south in the Western Gneiss Region, in early Palaeozoic sedimentary rocks and in supracrustal units in southern Norway (Lamminen, Reference Lamminen2011; Beyer et al. Reference Beyer, Brueckner, Griffin and O’Reilly2012; Sláma & Pedersen, Reference Sláma and Pedersen2015; Lundmark and Lamminen, Reference Lundmark and Lamminen2016; Slagstad and Kirkland, Reference Slagstad and Kirkland2017).
The Baltic Shield can be a source for Proterozoic material with Svecofennian (1.9–1.75 Ga), Gothian (1.75–1.50 Ga) and Sveconorwegian (1.15–0.9 Ga) orogenic phases (Bingen et al. Reference Bingen, Viola, Möller, Vander Auwera, Laurent and Yi2021). The Sveconorwegian orogen, formed by the collision of Baltica with Amazonia, includes the Transscandinavian Igneous Belt in the east (1.9–1.6 Ga; Kratz et al. Reference Kratz, Gerling and Lobach-Zhuchenko1968; Falkum and Petersen, Reference Falkum and Petersen1980; Bingen et al. Reference Bingen, Nordgulen and Viola2008; Bingen and Solli, Reference Bingen and Solli2009). The basement of the Ringkøbing–Fyn High includes Gothian and Sveconorwegian zircon (Olivarius et al. Reference Olivarius, Friis, Kokfelt and Wilson2015). Palaeoproterozoic basement (2000–1900 Ma) is also present in East Greenland (Fonneland et al. Reference Fonneland, Lien, Martinsen, Pedersen and Košler2004; Szulc et al. Reference Szulc, Morton, Whitham, Hemming and Thomson2022).
Palaeozoic sources could include Caledonian and Variscan orogenic belts, Carboniferous–Permian volcanic rocks between the Central and Horn–Oslo grabens and pre-Permian sedimentary deposits. The Caledonian orogen extended from western Europe through Greenland, Scandinavia and to Svalbard. It formed due to collision of Laurentia, Baltica and Avalonia during the Silurian–Early Devonian (Glennie and Underhill, Reference Glennie, Underhill and Glennie1998; Fossen, Reference Fossen2010; Corfu et al. Reference Corfu, Andersen, Gasser, Corfu, Gasser and Chew2014; Torsvik and Cocks, Reference Torsvik and Cocks2016; Fossen et al. Reference Fossen, Khani, Faleide, Ksienzyk and Dunlap2017). In the Mid North Sea High, 374 ± 3 Ma felsic volcanism has been recorded (Lundmark et al. Reference Lundmark, Gabrielsen, Austrheim, Flaat, Strand and Ohm2012).
Late Carboniferous–Early Permian rifting was accompanied by widespread magmatism across the Northern Permian Basin. In offshore Denmark, three volcanic pulses are documented within the Rotliegend Group succession (Figure 2; Stemmerik et al. Reference Stemmerik, Ineson and Mitchell2000). This activity formed part of a broader rift-related magmatic system extending from the Oslo Rift into the Skagerrak, Kattegat and Central North Sea (Heeremans and Faleide, Reference Heeremans and Faleide2004).
Potentially recycled sedimentary sources include the Devonian Old Red Sandstone Group in western Norway (Templeton, Reference Templeton2015), the British Midland Valley and the Scottish Orcadian Basin, including Orkney and Shetland (McKellar et al. Reference McKellar, Hartley, Morton and Frei2020; Strachan et al. Reference Strachan, Olierook and Kirkland2021), its offshore continuation onto the Orkney–Shetland Platform (Stoker et al. Reference Stoker, Hitchen and Grahan1993) and isolated basins in the British and Norwegian North Sea (Patruno et al. Reference Patruno, Kombrink and Archer2022; Urrez et al. Reference Urrez, Escalona and Augustsson2025). Also, in the Mid North Sea High, detrital zircon-age spectra from Devonian–Permian sedimentary rocks are dominated by Proterozoic zircon ages (Lundmark et al. Reference Lundmark, Bue, Gabrielsen, Flaat, Strand and Ohm2014). Middle–Late Carboniferous reconstructions indicate a predominantly north–south fluvial system (Leeder, Reference Leeder1988) that transported Archaean- and Proterozoic-influenced detritus from northern source regions (e.g., Drewery et al. Reference Drewery, Cliff and Leeder1987; Morton et al. Reference Morton, Chisholm and Frei2021, Reference Morton, Chisholm and Frei2024, Reference Morton, Chisholm and Frei2026), with documented stratigraphic shifts in sediment supply reflecting evolving palaeogeography. This Carboniferous drainage configuration may have influenced early Permian sediment dispersal patterns.
3. Datasets and methodologies
3.a. Lithofacies analysis
Nine wells were logged lithologically in the upper Rotliegend Group of the Norwegian North Sea (Figure 1), with a cumulative core length of over 180 m. The study area extends across the Norwegian sector of the Northern Permian Basin (Figure 1). Logging and sampling were conducted at the Norwegian Offshore Directorate in Stavanger and Stratum in Sandnes, Norway. Following Urrez et al. (Reference Urrez, Escalona and Augustsson2025), the analysis of sedimentary logs, gamma-ray responses and well reports cuttings were integrated to identify 13 lithofacies and 7 facies associations for the upper Rotliegend Group (Tables 1 and 2).
Rotliegend Group lithofacies. Arrows indicate core top. GR = Gamma-ray, API = American Petroleum Institute units
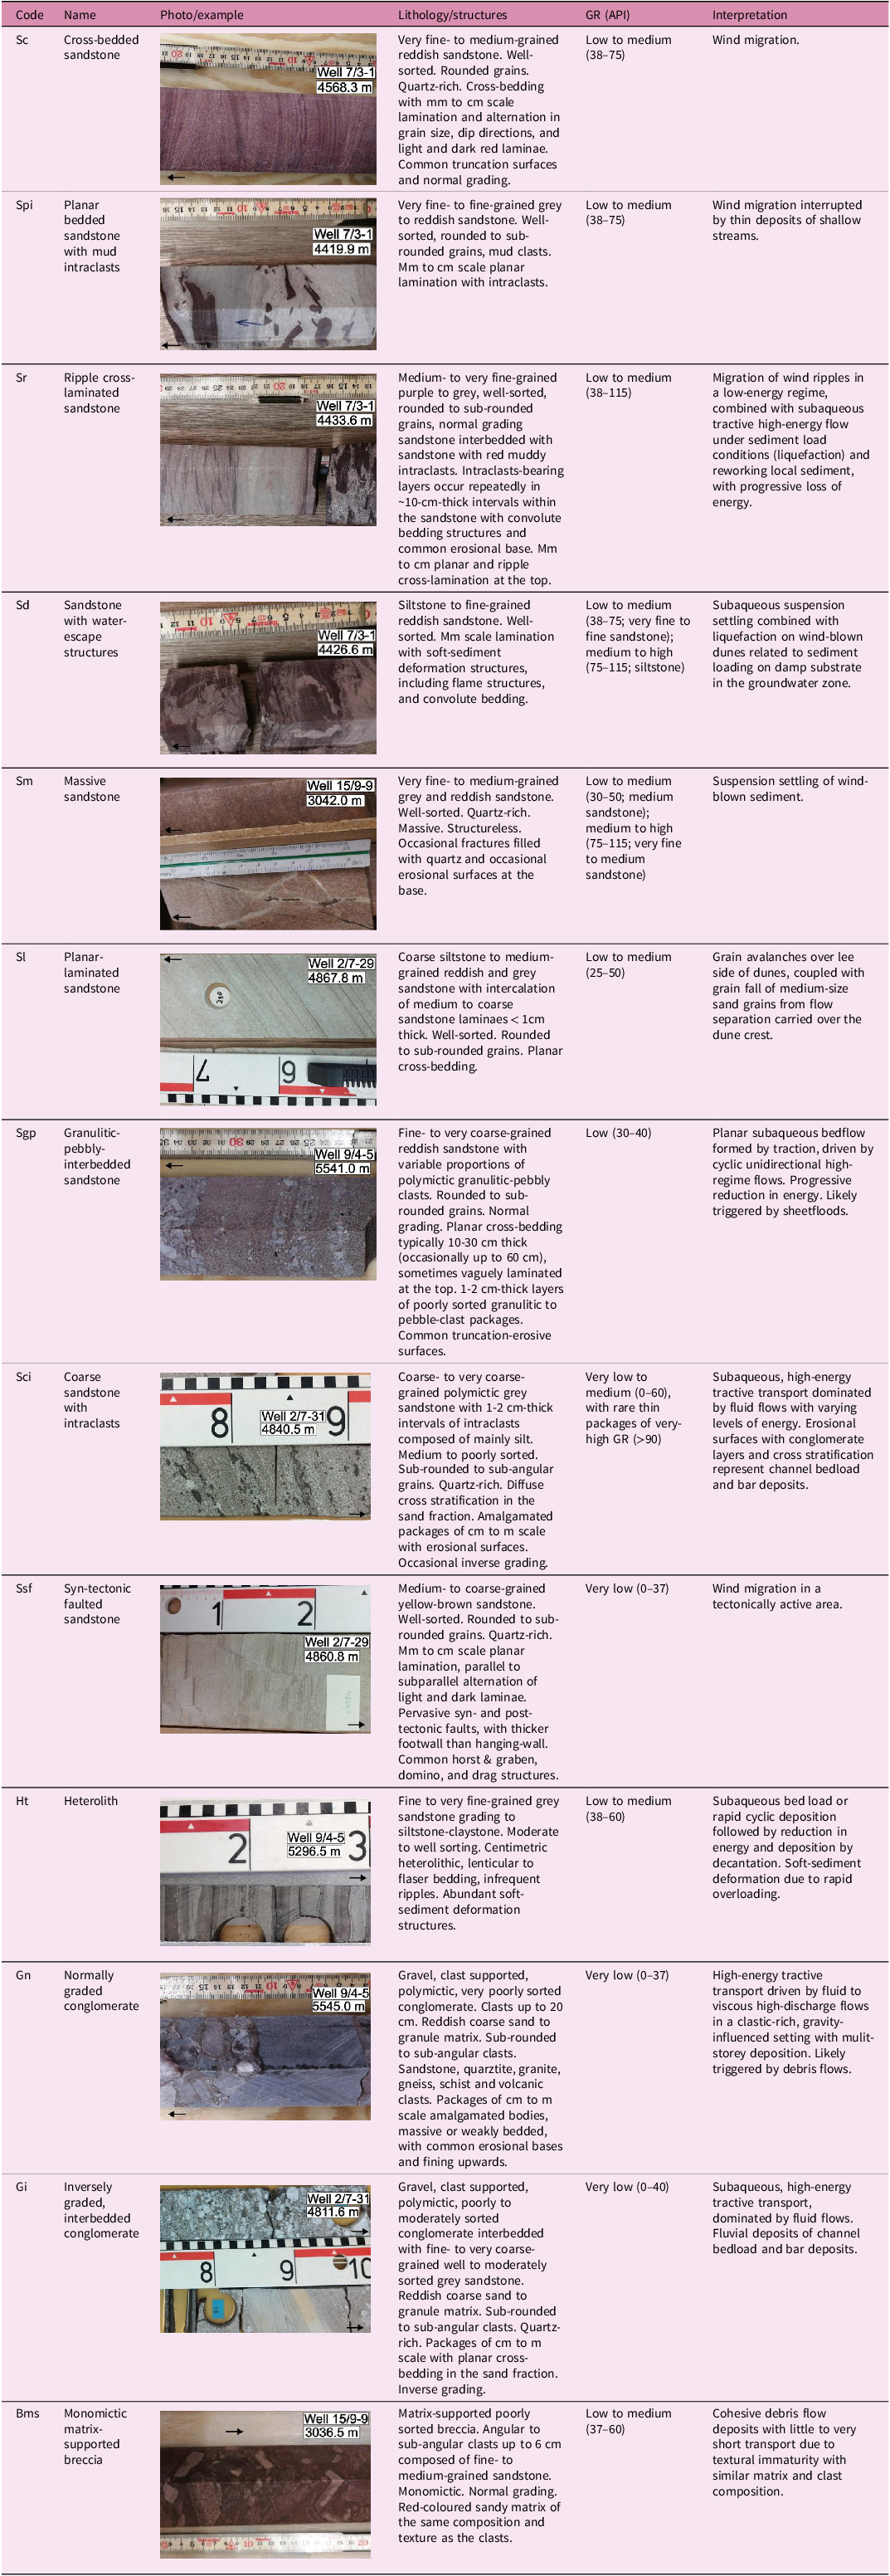
Table 1. Long description
A table comparing lithofacies of the Rotliegend Group across nine wells in the Norwegian North Sea. The table includes columns for core tops, gamma-ray values in API units, and lithofacies descriptions. Each row represents a different lithofacies type, with arrows indicating core tops. The table provides detailed lithological data and gamma-ray responses for the upper Rotliegend Group, helping to identify 13 lithofacies and 7 facies associations. The study area extends across the Norwegian sector of the Northern Permian Basin.
Facies associations based on lithofacies and gamma-ray (GR) log motifs. Illustrated GR log motifs are approximately 35 m thick. Facies-association interpretations are based on Heward (Reference Heward, Miall and Tyler1991), Blair & McPherson (Reference Blair and McPherson1994), Mountney & Howell (2000), Priddy & Clarke (Reference Priddy and Clarke2020), Priddy et al. (Reference Priddy, Pettigrew, Watson, Regis and Clarke2023). API = American Petroleum Institute units
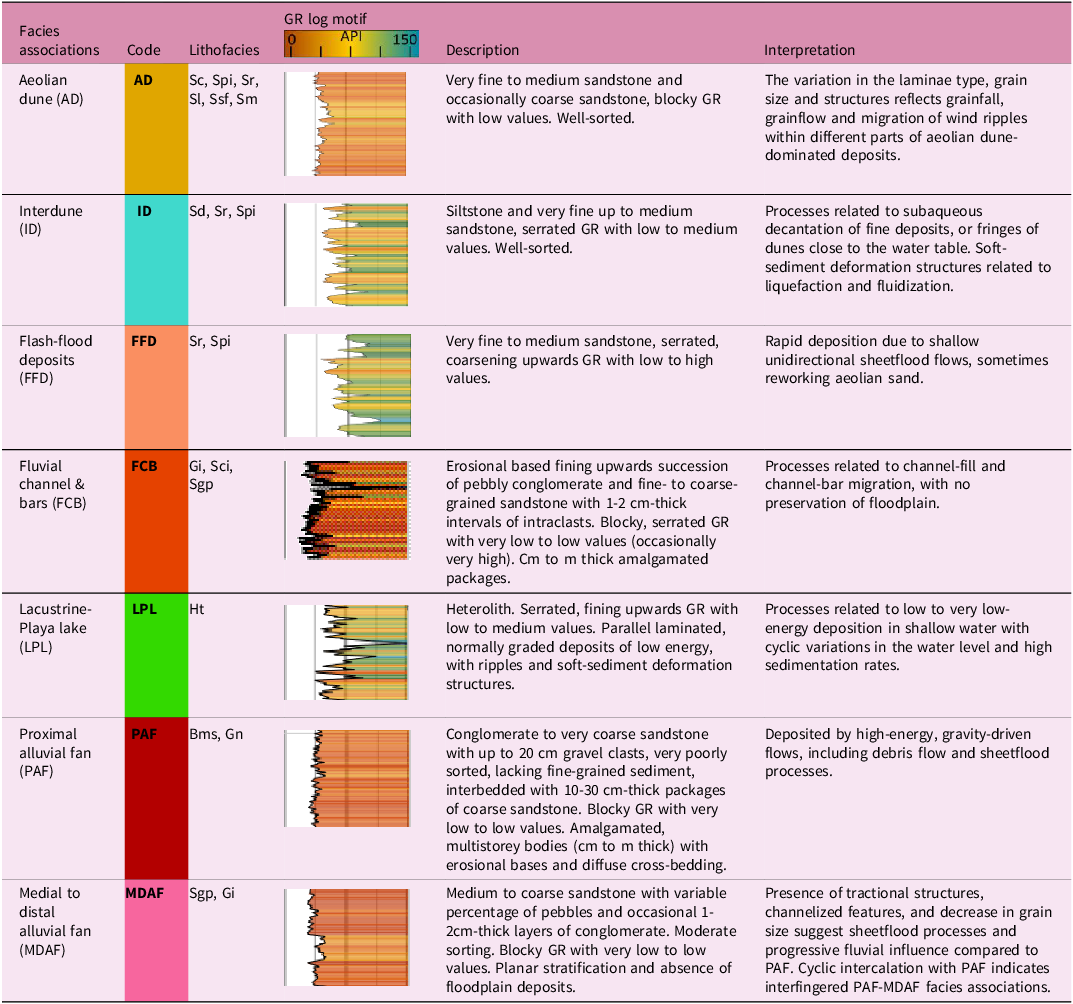
Table 2. Long description
The table presents a comparison of facies associations based on lithofacies and gamma-ray log motifs in the upper Rotliegend Group of the Norwegian North Sea. It includes seven facies associations: Aeolian dune, Interdune, Flash-flood deposits, Fluvial channel and bars, Lacustrine-Playa lake, Proximal alluvial fan, and Medial to distal alluvial fan. Each association is detailed with a code, lithofacies types, GR log motifs, descriptions, and interpretations. The table has seven rows for facies associations and multiple columns for code, lithofacies, GR log motif, description, and interpretation. Notable trends include variations in grain size, sorting, and depositional processes across different facies associations.
To reconstruct palaeowind directions, the vertical wells 15/9-9, 2/4-17 and 3/5-1 (Figure 1) containing > 300 m aeolian successions were analysed using dipmeter logs from the DISKOS database. Foreset dip and azimuth data from cross-bedded intervals were extracted and structurally corrected using the dip and strike of the overlying subhorizontally deposited Kupferschiefer Formation of the Zechstein Group as a reference surface. The restoration, performed with Stereonet v.11 (Allmendinger, Reference Allmendinger2020), applied tilt corrections of 12°/075° (2/4–17) and 9°/060° (3/5-1). These values were compared with seismic sections near the well locations to verify that the magnitude and direction of structural dip were consistent with the local structural geometry. Dipmeter-derived foresets were used directly to infer palaeowind directions from well 15/9-9 because the Kupferschiefer Formation is essentially horizontal at this location. Paleowind orientation was inferred from the mean dip direction of the corrected foresets, cross-checked against image logs in 2/4-17 to confirm their aeolian origin. Preferred palaeowind and palaeocurrent azimuths were summarized using circular statistics based on the Von Mises distribution in Stereonet v.11 (Allmendinger, Reference Allmendinger2020), reporting the mean vector, concentration parameter (κ) and circular variance. A similar workflow was applied to wells 2/7-31 and 9/4-5 to determine fluvial and alluvial-fan palaeocurrent directions from cross-bedded sandstone. The structural dip (24°/033°) had already been removed for well 2/7-31 (Glass et al. Reference Glass, Paludan and Dürr1999), so the restored dipmeter data were used to identify preferred foreset orientations related to channelized flow. For well 9/4-5 different restoration scenarios were already available to account for the structural and sedimentological complexity (NOD, 2025), so the most reliable directions restricted to laminated sandstone were utilized.
3.b. Zircon analysis
A total of 23 sandstone samples of approximately 30 g each were collected from core sections of the nine wells. To assess vertical variability in provenance, at least two samples per well were analysed (Table 3; Figures 3 and 4). Twenty samples were collected maximum 100 metres below the top of the Rotliegend Group. Only three were taken from deeper intervals due to low core availability. The dataset covers aeolian, fluvial, alluvial-fan and lacustrine facies, with grain sizes ranging from fine to medium sand. Polished thin sections and zircon mounts were prepared at the University of Stavanger. Additional thin sections were obtained from the Norwegian Offshore Directorate archive.
Samples for zircon analysis, with rock characteristics based on texture and lithology observed in thin sections. Lithology classification based on Garzanti (Reference Garzanti2019)
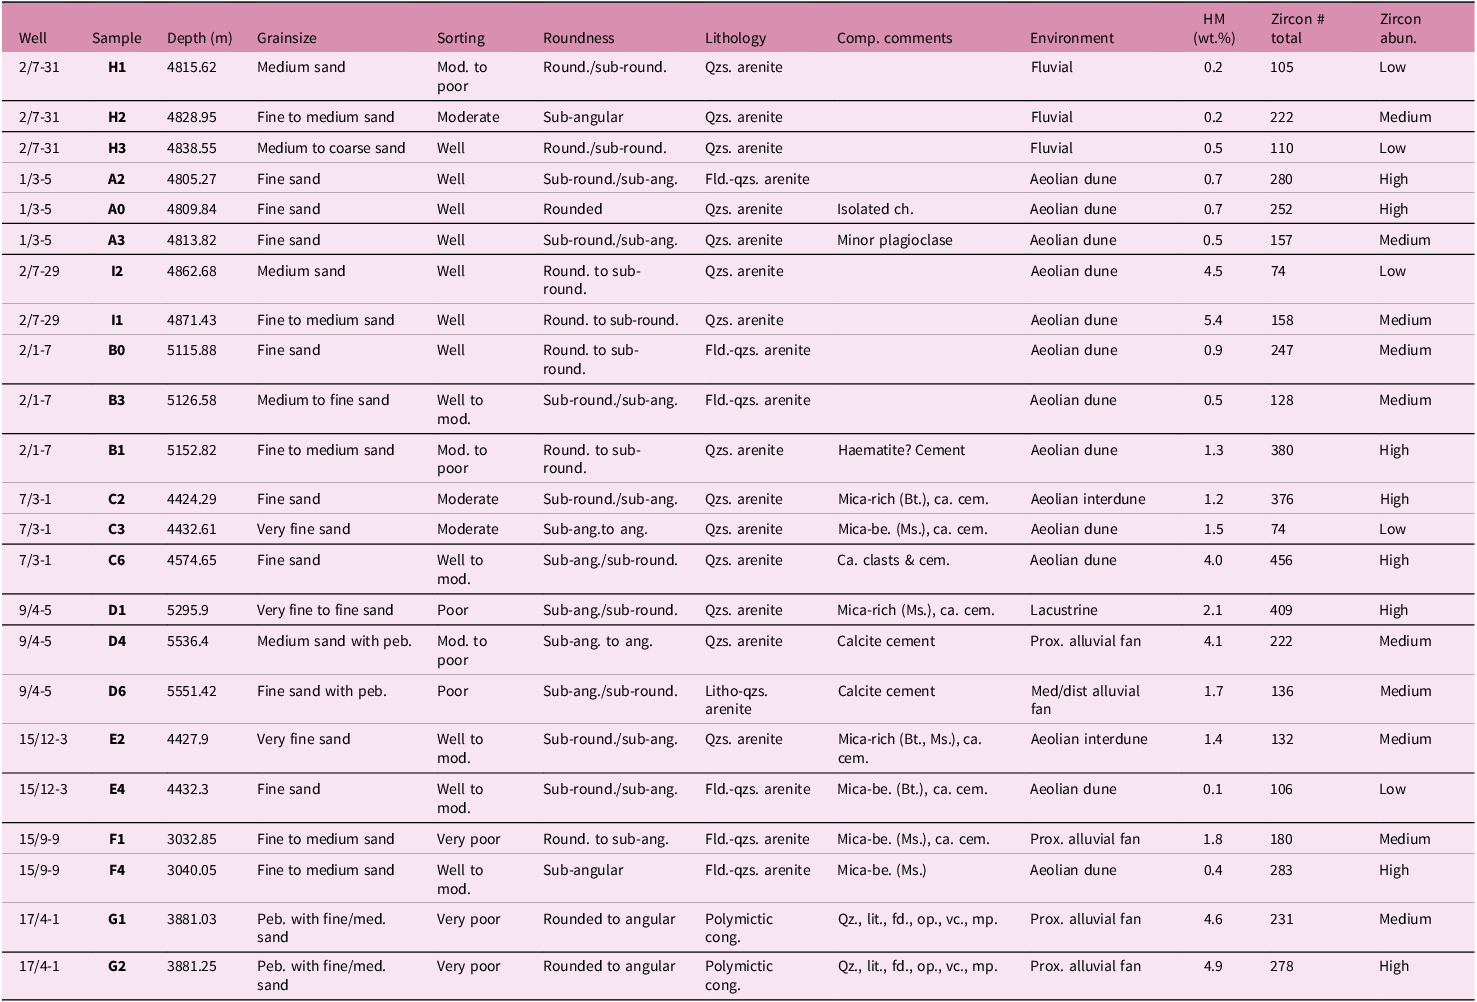
Table 3. Long description
A table listing sandstone samples collected from various wells for zircon analysis. The table includes columns for well identification, sample depth in meters, grainsize, sorting, roundness, lithology, composition comments, environment, heavy mineral content in weight percentage, total zircon number, and zircon abundance. The samples vary in depth from approximately 3881 to 5551 meters and include different grain sizes ranging from fine to medium sand. The environments range from aeolian dunes to fluvial, alluvial fans, and lacustrine settings. Notable trends include variations in zircon abundance and heavy mineral content across different wells and depths.
Abun. = Abundance; Ang. = angular; be. = bearing; Bt. = biotite; ca. = calcite; cem. = cement; ch. = chert; comp. = compositional; cong. = conglomerate; fd. = feldspar; fld. = feldspatho; HM = heavy minerals; lit. = lithics; med. = medium; med/dist. = medial/distal; mod. = moderate; mp. = metamorphic clasts; Ms. = muscovite; op. = opaques; Peb. = pebbles; Prox. = proximal; qz. = quartz; qzs. = quartzose; round. = rounded; vc. = volcanic clasts.
North, northwest-south, southeast well-correlation panel. The panel trace is shown in Figure 1. Core intervals are marked with dark grey boxes.
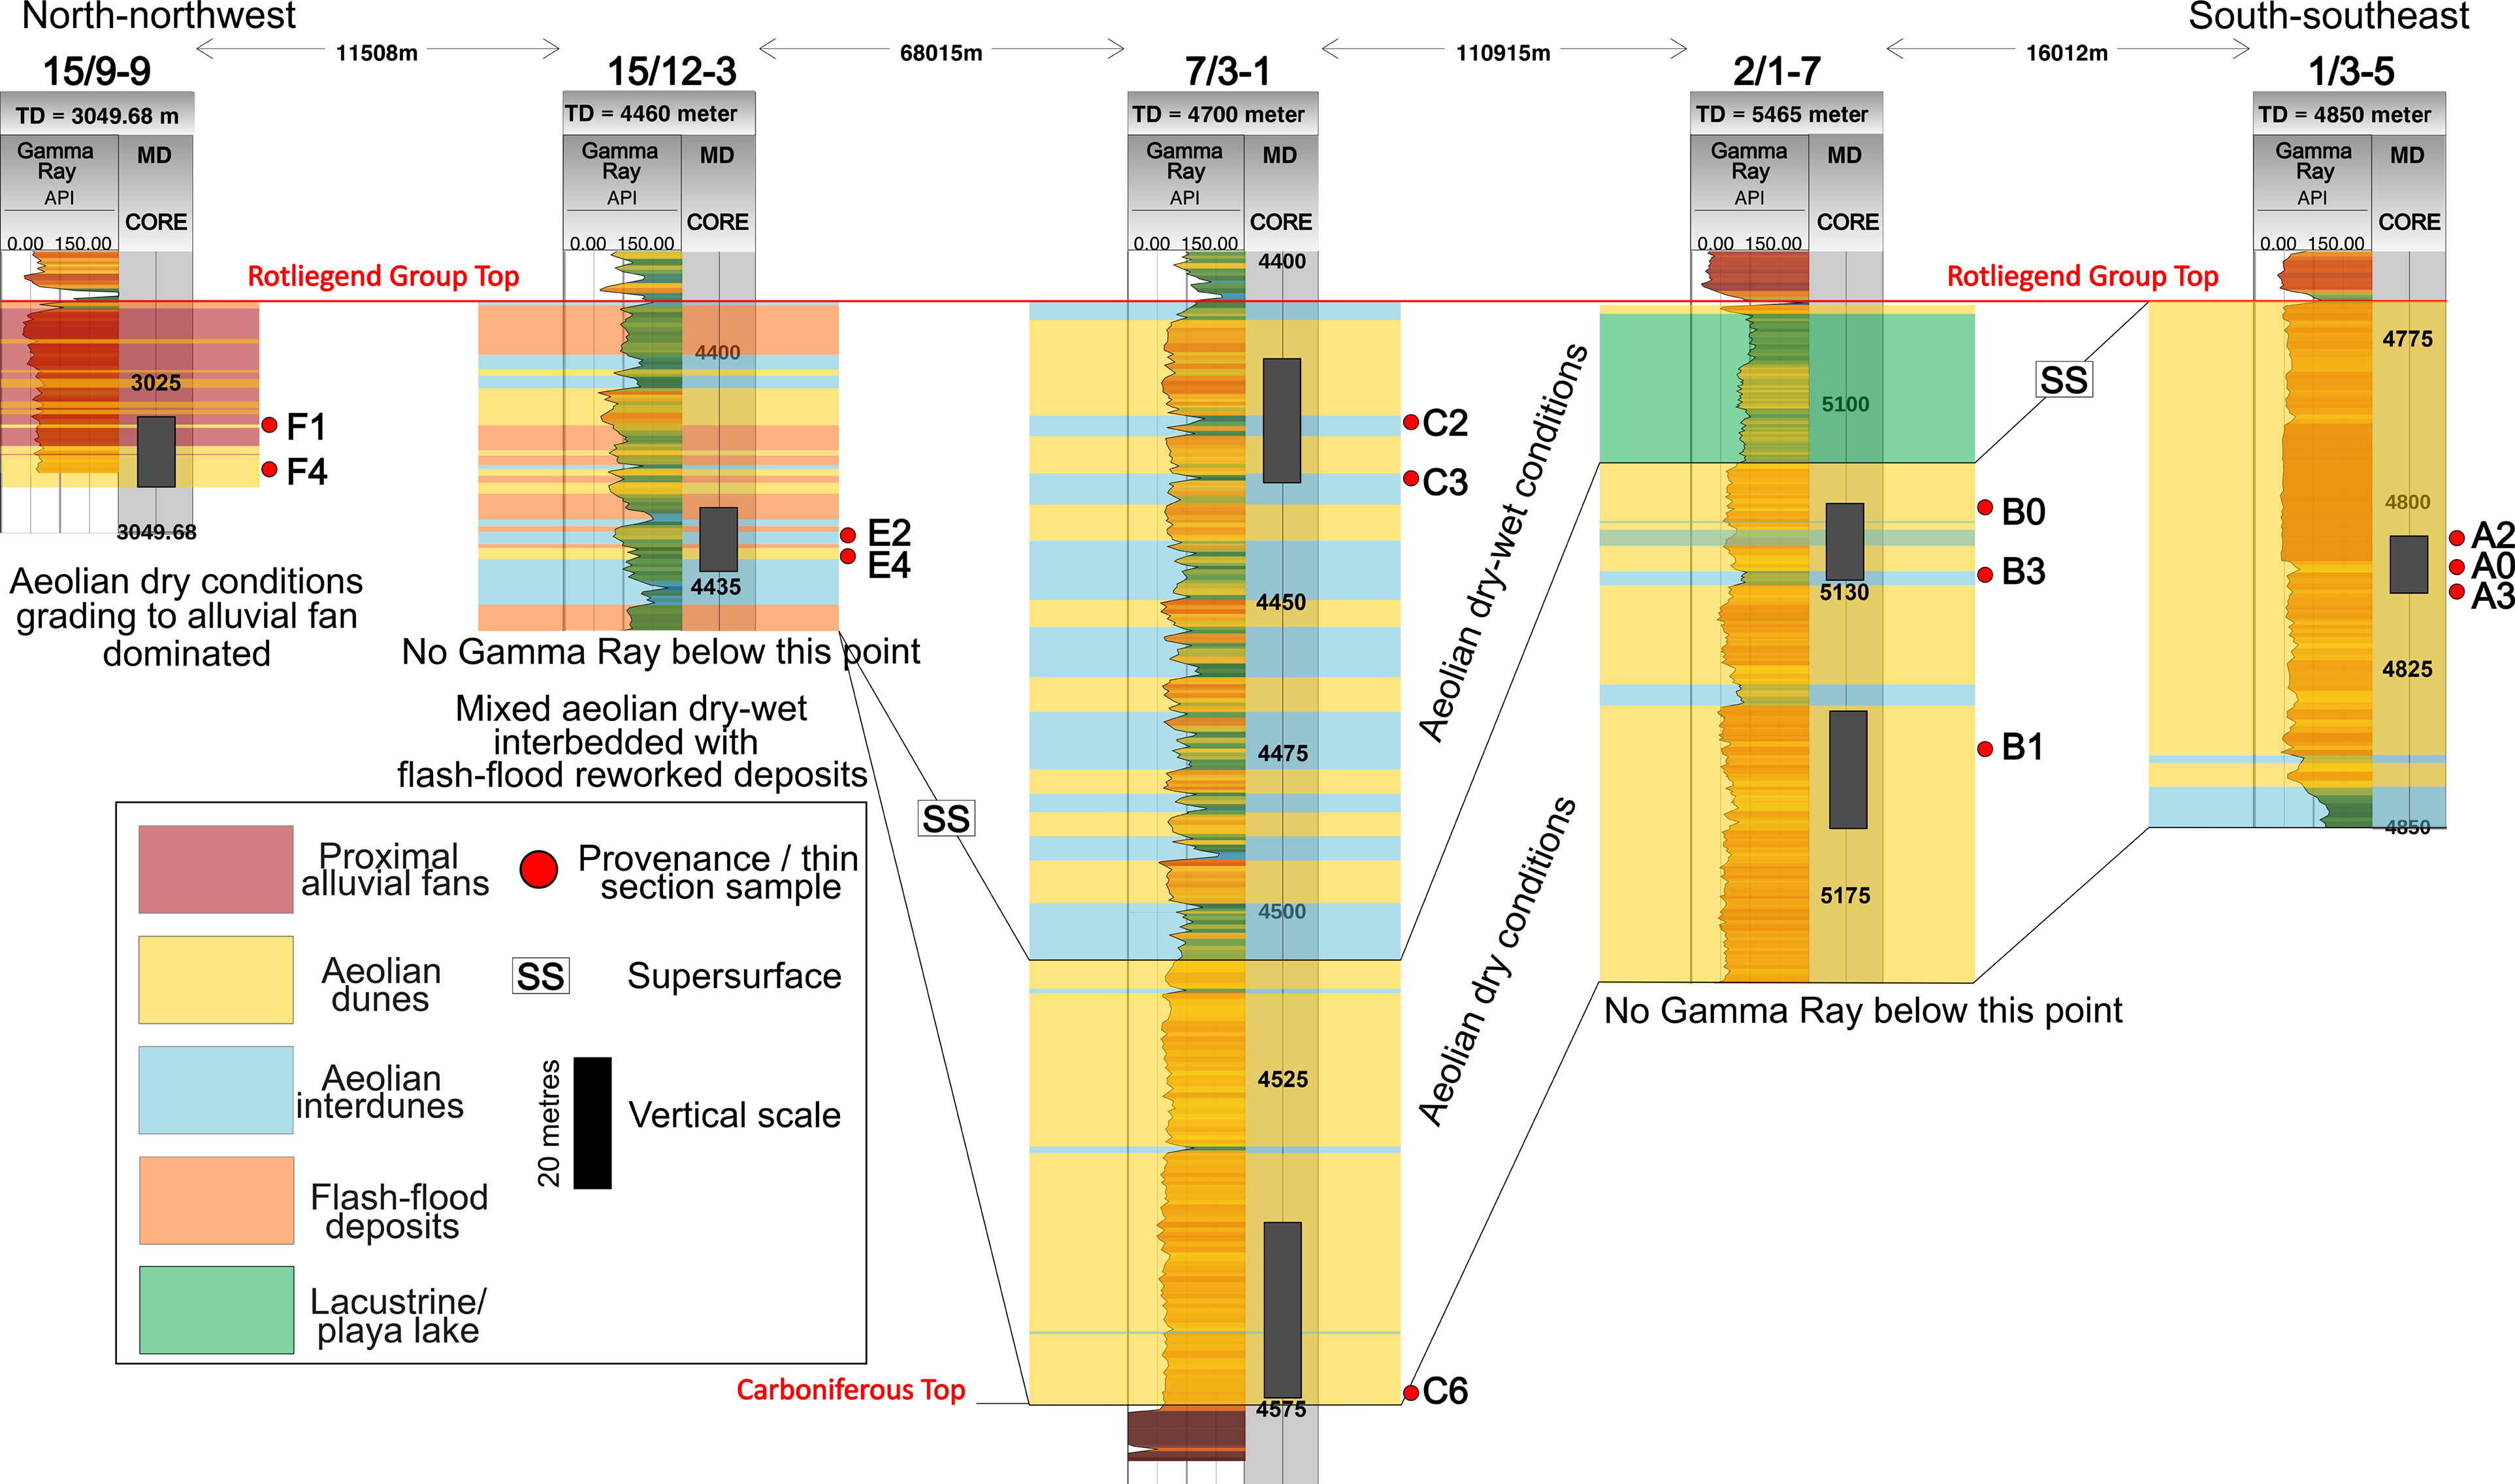
Figure 3. Long description
The diagram illustrates the east-west-oriented Northern and Southern Permian basins in northwest Europe, focusing on the sedimentary and tectonic evolution during the early Permian period. The well-correlation panel spans from the north-northwest to the south-southeast direction, with specific wells labeled as 15/9-9, 15/12-3, 7/3-1, 2/1-7, and 1/3-5. Each well shows different sedimentary layers and conditions, such as aeolian dry conditions, alluvial fans, and flash-flood deposits. Core intervals are marked with dark grey boxes, and the Rotliegend Group Top is highlighted with a red line. The diagram includes various sediment types like proximal alluvial fans, aeolian dunes, aeolian interdunes, flash-flood deposits, and lacustrine playa lake deposits. Provenance and thin section samples are indicated with red and black dots respectively. The vertical scale is marked in meters, and supersurfaces are labeled as SS. The diagram provides a detailed view of the sedimentary layers and their relationships across different wells.
North-south well-correlation panel with vertical and lateral facies transitions. The panel trace is shown in Figure 1. Core intervals are marked with dark grey boxes.
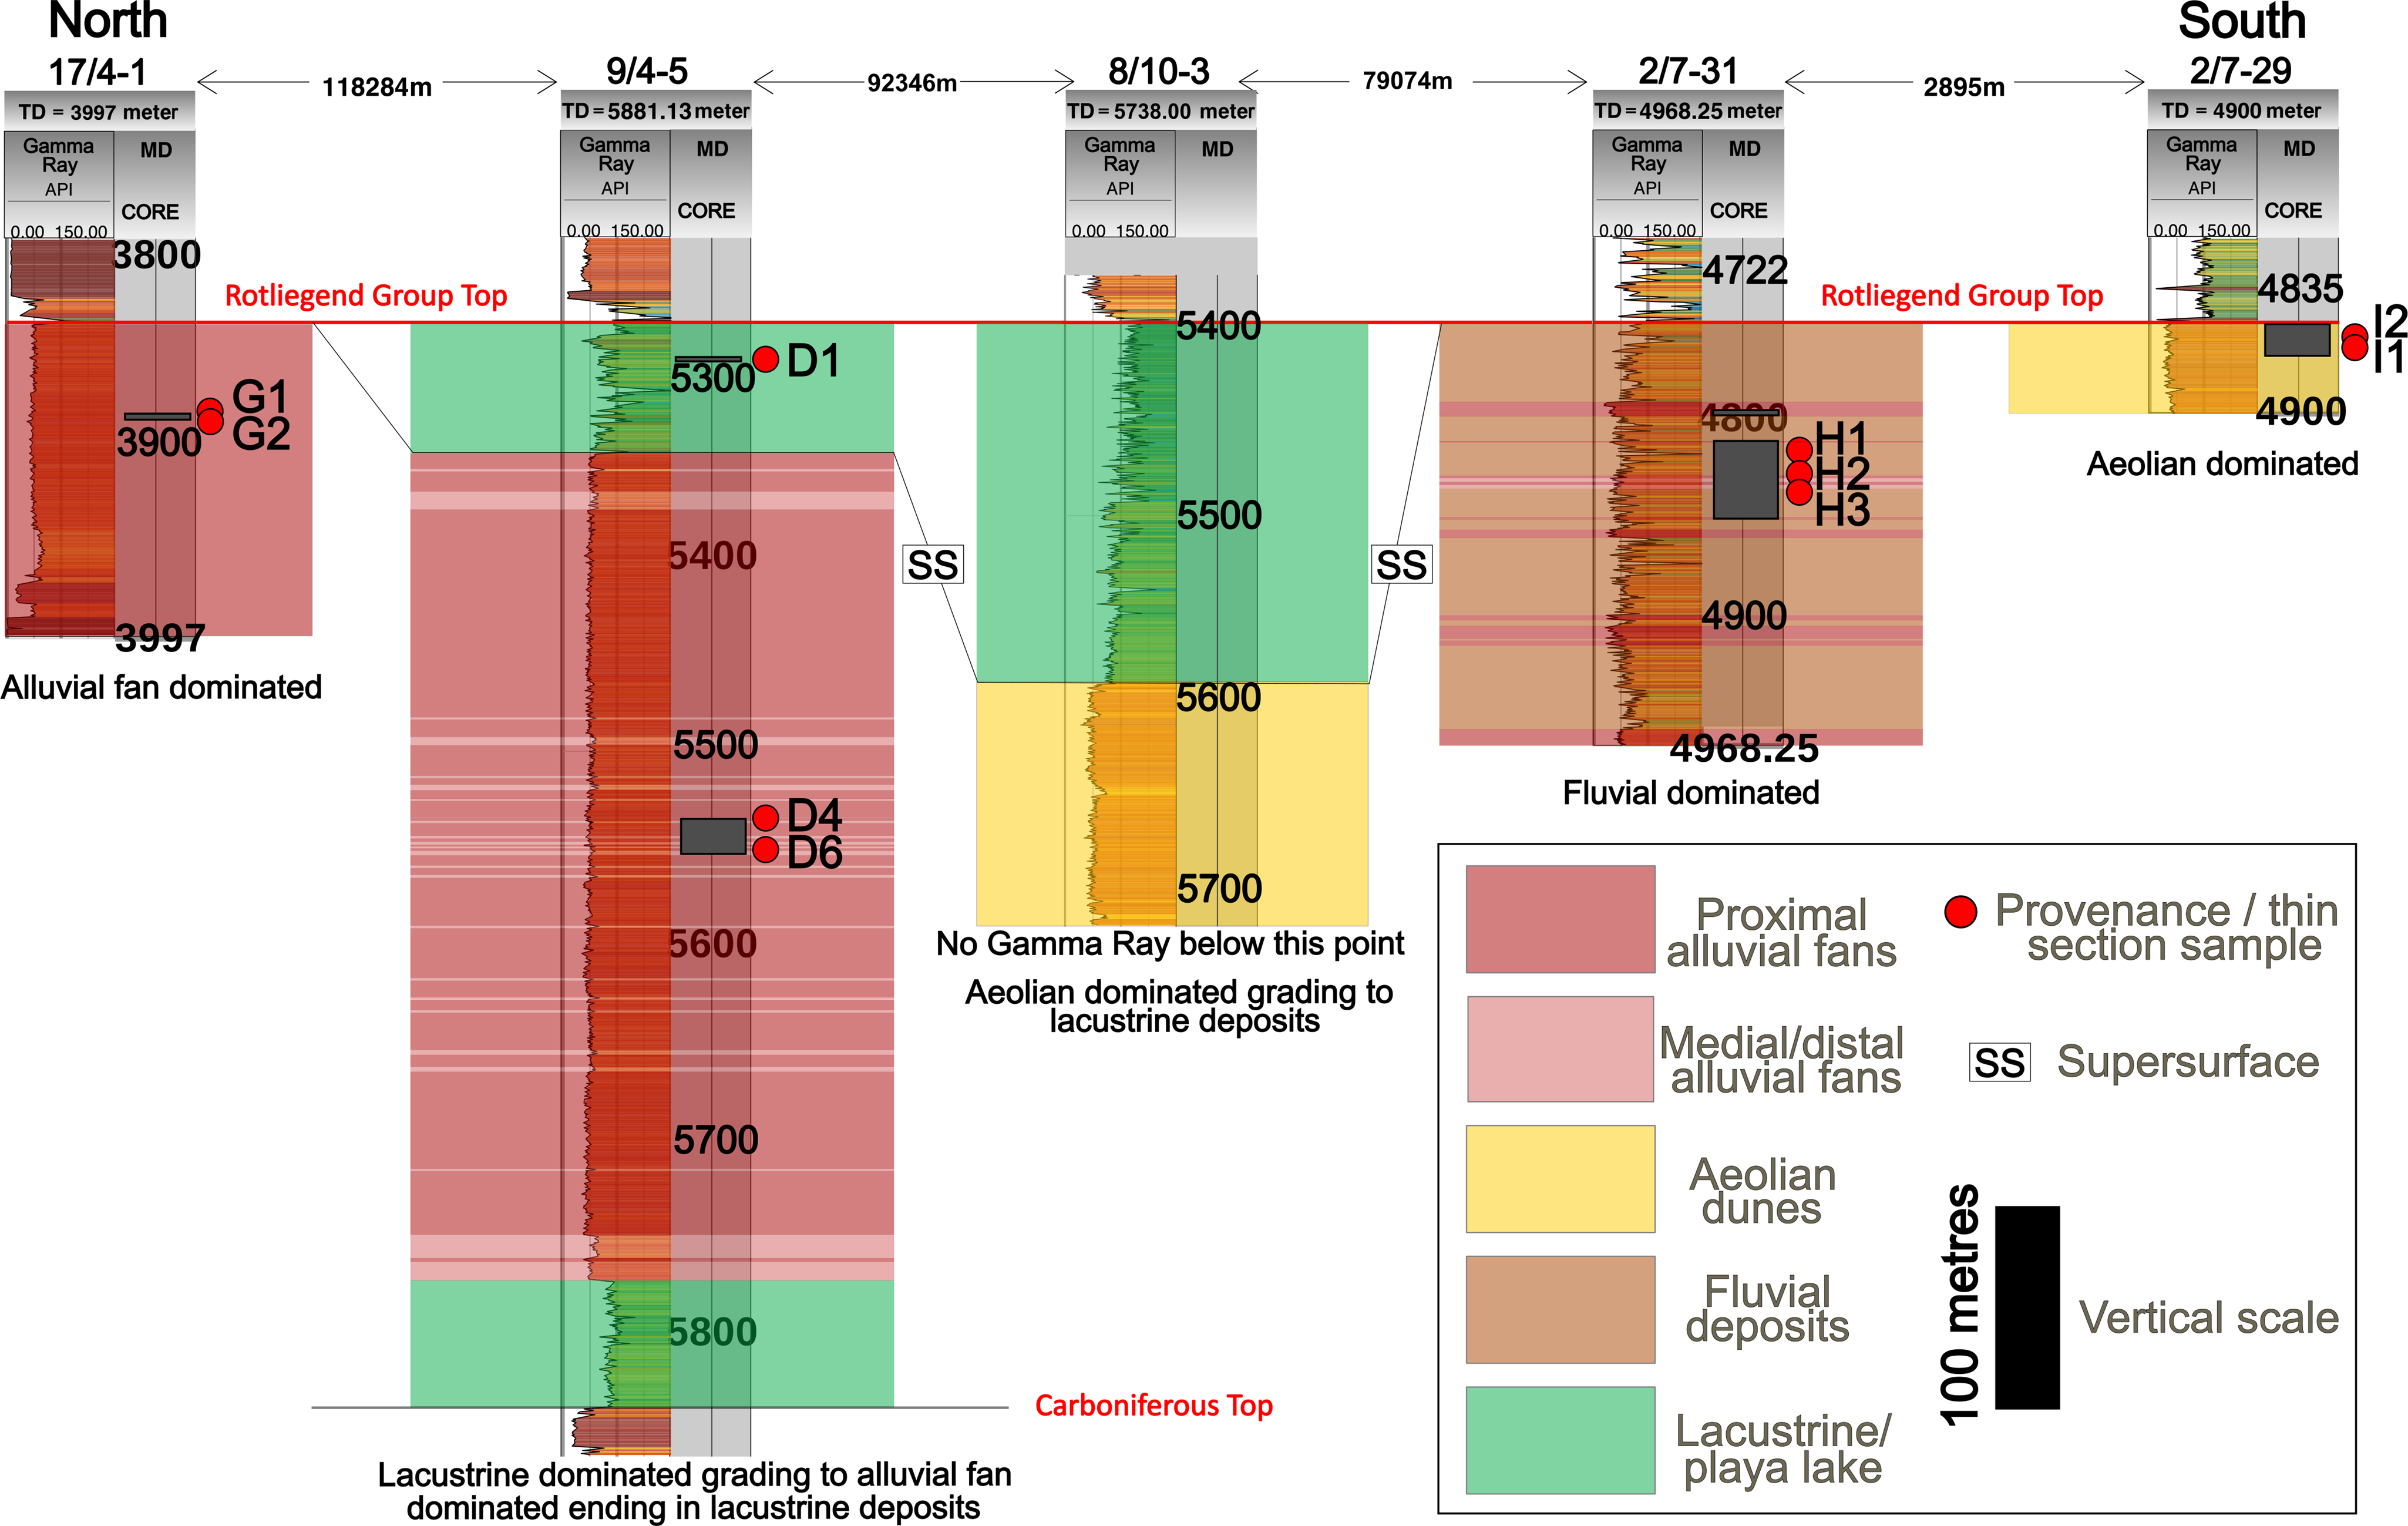
Figure 4. Long description
The image presents a north-south well-correlation panel illustrating vertical and lateral facies transitions. The panel includes various wells marked with identifiers such as 17/4-1, 9/4-5, 8/10-3, 2/7-31, and 2/7-29. Core intervals are highlighted with dark grey boxes. The panel shows different geological formations and transitions, including alluvial fan dominated areas, aeolian dunes, fluvial deposits, and lacustrine/playa lake regions. Key labels such as Rotliegend Group Top and Carboniferous Top are indicated, along with specific depth measurements in meters. The image also includes annotations for provenance and thin section samples, marked with red dots and labels like G1, G2, D1, D4, D6, H1, H2, and H3.
The samples were processed using standard separation techniques, including crushing, sieving and washing to remove clay and fine silt, keeping the grain size fraction between 25 and 500 µm. Light and heavy minerals were separated with sodium polytungstate (density 2.95 g/cm3). Heavy-mineral abundance was quantified as the weight percentage (wt.%) of heavy minerals relative to the total weight of heavy and light mineral fractions within the processed 25–500 µm interval (Table 3). The non-magnetic heavy minerals were concentrated using a Frantz magnetic separator, with a voltage of 1.5 amperes, 20° side slope and 25° tilt. The zircon fraction was isolated from the apatite fraction using diiodomethane (density 3.32 g/cm3). Zircon abundance was recorded qualitatively during grain picking as low, medium or high, based on the relative yield of zircon grains from the separated zircon fraction (Table 3).
From the zircon fraction concentrate, grains were randomly selected, mounted in epoxy and polished. In total 3,783 zircon grains were analysed for geochronology, representing approximately 200 grains per sample (or fewer if not available; Table 3). Cathodoluminescence imaging on a Zeiss Supra 35 VP scanning electron microscope identified optimal spots for U–Pb analyses (Figure 5). Grain rims in areas free of inclusions were selected for analysis.
Representative cathodoluminescence images of detrital zircons from the Permian Rotliegend Group. The analysis numbers are indicated in red. The colours are inverted in wells 1/3-5, 9/4-5 and 2/7-29 to illustrate the zircon zoning clearly.
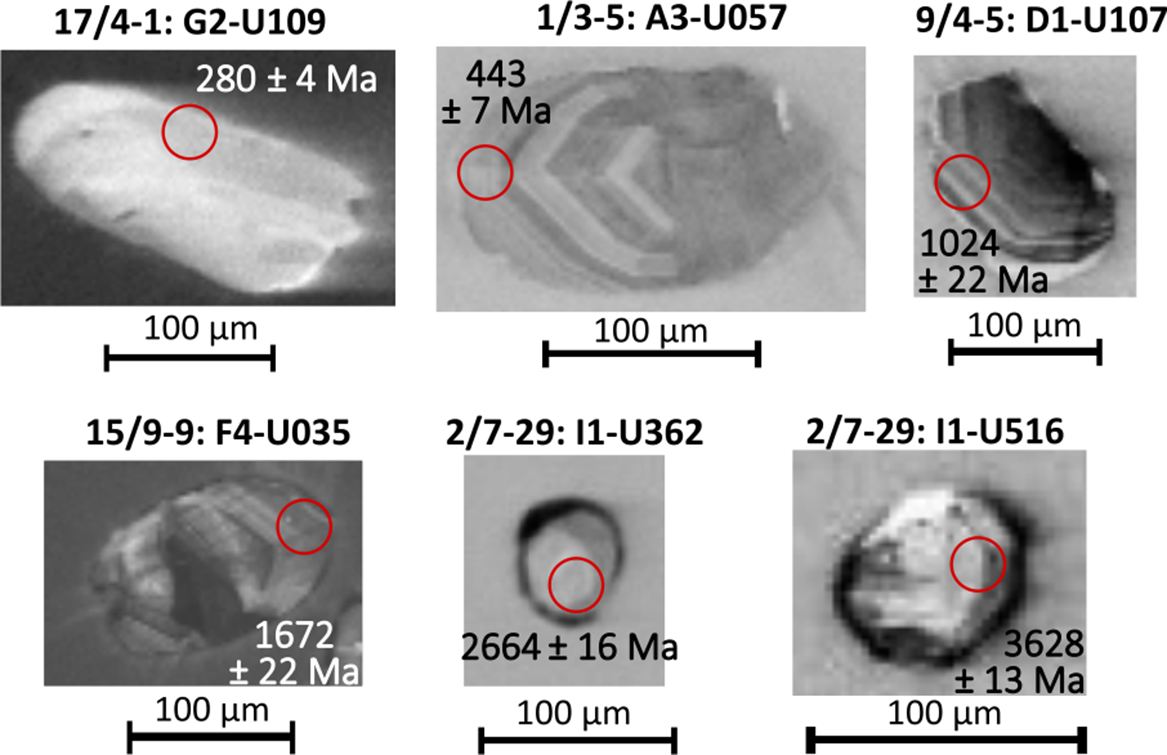
Figure 5. Long description
The image contains six cathodoluminescence images of detrital zircons from the Permian Rotliegend Group. Each zircon image is labeled with an analysis number and age measurement in mega annum. The images are arranged in a two-by-three grid. The first row includes images labeled 17/4-1: G2-U109 with an age of 280 plus or minus 4 mega annum, 1/3-5: A3-U057 with an age of 443 plus or minus 7 mega annum, and 9/4-5: D1-U107 with an age of 1024 plus or minus 22 mega annum. The second row includes images labeled 15/9-9: F4-U035 with an age of 1672 plus or minus 22 mega annum, 2/7-29: I1-U362 with an age of 2664 plus or minus 16 mega annum, and 2/7-29: I1-U516 with an age of 3628 plus or minus 13 mega annum. Each image has a scale bar indicating 100 micrometers. The colors are inverted in wells 1/3-5, 9/4-5, and 2/7-29 to clearly illustrate the zircon zoning.
Analyses were performed by LA-ICPMS using a RESOLution 193 nm ArF excimer laser (Complex Pro 102, Coherent) coupled to a sector field ICPMS (Element XR, Thermo Scientific) at Frankfurt Isotope & Element Research Center, Goethe University Frankfurt, following modified methods of Gerdes and Zeh (Reference Gerdes and Zeh2006, Reference Gerdes and Zeh2009). Each analysis used a 33 µm spot size, with a pulse width of 20 ns. GJ-01 zircon (Jackson et al. Reference Jackson, Pearson, Griffin and Belousova2004) was used as the primary reference material (RM) to correct U/Pb fractionation. Prior to this, the downhole fractionation of each analysis was corrected using the intercept method. For quality control zircon BB-16 (Santos et al. Reference Santos, Lana, Scholz, Buick, Schmitz, Kamo, Gerdes, Corfu, Tapster, Lancaster, Storey, Basei, Tohver, Alkmim, Nalini, Krambrock, Fanitni and Wiedenbeck2017), Plešovice (Sláma et al. Reference Sláma, Košler, Condon, Crowley, Gerdes, Hanchar, Horstwood, Morris, Nasdala, Norberg, Schaltegger, Schoene, Tubrett and Whitehouse2008) and Temora1 (Black et al. Reference Black, Kamo, Allen, Aleinikoff, Davis, Korsch and Foudoulis2003) were used as secondary RM. The results obtained on these zircon RMs were within 0.8% or better of the reported ages. Data processing (including common lead correction), plotting and age calculation was performed using an Isoplot (Ludwig, Reference Ludwig2012)-supported Microsoft VBA spreadsheet program AgeRap (Gerdes and Zeh, Reference Gerdes and Zeh2006, Reference Gerdes and Zeh2009). Uncertainties reported at 2σ level (i.e. 95% confidence) are propagated by quadratic addition of the within-run precision, counting statistics, background, common Pb corrections and the excess scatter derived from the primary and secondary RM. Systematic uncertainties are reported as an expanded uncertainty, considering long-term reproducibility (0.8%, 2σ) and decay-constant uncertainties. Combined age distributions were visualized with Density Plotter (Vermeesch, Reference Vermeesch2012).
The age data were filtered using a 10% discordance threshold, whereby analyses whose error ellipses do not overlap the Concordia curve and whose 206Pb/238U ages are more than 10% lower than their corresponding 207Pb/206Pb ages were excluded. 206Pb/238U dates are used for ages < 1000 Ma, and 207Pb/206Pb dates are used for older ages. Errors are given in figures and text at 2σ (95% certainty). Totally 3,055 analyses have concordant ages (81%).
Zircon grain sizes were measured by recording the longest axis from cathodoluminescence images. Spearman’s rank correlation was applied to the pooled dataset and to individual age populations to assess the relationship between zircon age and grain size. Maximum depositional ages were calculated using the youngest single cluster of at least three analyses that overlap within 2σ uncertainty (Dickinson and Gehrels, Reference Dickinson and Gehrels2009; Sharman et al. Reference Sharman, Sharman and Sylvester2018). Pairwise Kolmogorov–Smirnov (K–S) dissimilarities between zircon-age distributions were calculated to quantify statistical differences between samples. To evaluate potential mixing between provenance domains, the DZMix algorithm was used (Sundell and Saylor, Reference Sundell and Saylor2017). Sample C6 from well 7/3-1 was used as a representative sample from the basin interior. It was treated as a potential mixed population and compared with two samples representing potential source distributions, samples B1 from well 2/1-7 and D6 from well 9/4-5. A total of 100,000 models were run using kernel density estimates (bandwidth 27.2 Myr).
3.c. Palinspastic reconstruction and integration
To integrate provenance, facies and palaeocurrent datasets within a dynamic source-to-sink framework, a palinspastic intra-plate reconstruction of the North Sea was utilized (Powell et al. Reference Powell, Escalona and Augustssonsubmitted) targeting the Carboniferous–Permian boundary at 298.9 Ma (International Chronostratigraphic Chart version 2024/12). The North Sea intra-plate framework was developed within the Jackson School of Geosciences global plate model (2023; Ian Norton, Personal communication, 2024) controlling the surrounding plates including the positioning of Greenland in this study. The model integrates cross-sectional restoration and mass-balance techniques to estimate crustal shortening and stretching across structural domains. Quantitative values to adjust intra-plate movements within the model were derived through structural restorations conducted using StructureSolver (www.structuresolver.com; Powell et al. Reference Powell, Escalona and Augustssonaccepted). The software allowed implementation of flexural slip, vertical shear or inclined shear algorithms, dependent on the structural characteristics of each cross section. These restoration methods, combined with geological constraints derived from seismic interpretation and stratigraphic relationships, enforce geometric compatibility and conservation of cross-sectional area, thereby constraining block rotation during restoration.
Extensional ß-values were evaluated against published extensional factors in the North Sea. Of the ß-values assessed (n = 57), 86 % differ by less than 10 % of reported values (Powell et al. Reference Powell, Escalona and Augustssonaccepted), including those of Roberts et al. (Reference Roberts, Yielding, Kusznir, Walker and Dorn-Lopez1993), Odinsen et al. (Reference Odinsen, Reemst, Van Der Beek, Faleide and Gabrielsen2000) and Bauck et al. (Reference Bauck, Faleide, Fossen, Hassaan and Braathen2024). Across the study area, regional ß-values from the Quaternary to the Permian–Carboniferous boundary range from 1.11 to 1.53. To assess the sensitivity of plate movements within the model, the regional ß-values and calculated extensional values were compared with published estimates. The mean absolute difference was applied to the calculated regional displacements, resulting in uncertainties of approximately ±4–15 km.
Present-day Archaean-Palaeozoic terranes were repositioned according to their expected locations at the Carboniferous to Permian boundary. Wells penetrating Devonian strata in the Norwegian, British, Dutch and German sectors of the North Sea were also restored, allowing the outline of the Old Red Sandstone basins to be reconstructed in the Permo-Carboniferous geographic context. The studied wells were imported into the model and dynamically linked to the tectonic blocks, providing time-adjusted locations of sediment sources and sinks during early Permian deposition.
4. Lithofacies
Seven of the identified lithofacies are linked to wind-driven sedimentation, three to subaqueous processes, and three are associated with gravity-driven processes (Table 1). The seven facies associations correspond to aeolian, fluvial, alluvial-fan and lacustrine deposits.
The lithofacies and facies associations vary both vertically and laterally. Aeolian dune-interdune systems dominate the basin interior, whereas coarse-grained alluvial-fan and fluvial deposits fringe basin margins. Thick, laterally continuous aeolian sandstone in the central sector grades into conglomerate- and breccia-rich alluvial fans along the northern and eastern basin margins. Vertically, the Rotliegend Group successions transit upward from arid aeolian deposits to more humid interdune, flash-flood and lacustrine/playa-lake facies, including particularly thick fluvial-dominated successions in some wells (Figures 2B, 3, 4). This vertical organization broadly corresponds to the lower–upper Rotliegend Group subdivision.
4.a. Aeolian depositional environment
The aeolian environment is well developed in the central and western parts of the study area. The total thickness is several 100 m in the south (e.g., 170 m in well 7/3-1 and > 500 m in well 2/4-17; Figures 1 and 3; NOD, 2025). Aeolian deposits thin in the northwest (close to well 15/9-9) where it is represented by a cyclic alternation of dune, interdune, and flash-flood deposits. The flash-flood deposits usually retain aeolian characteristics (e.g., well 15/12-3 in the northwest; Figure 3). Aeolian deposits also thin in the east (between wells 8/10-3 and 9/4-5; Figure 4). Dune-dominated conditions prevailed at the base of the upper Rotliegend Group. The proportions of interdune and flash-flood deposits increase towards the top.
Dune facies consist mainly of very fine- to medium-grained sandstone with blocky and low gamma-ray (Tables 2 and 3; Figures 6 and 7A–C). Locally, coarser sandstone occurs. Dune sets range from 30–40 m in thickness in the southernmost wells to only 0.5–10 m in the northwest. There (well 15/9-9), 0.5–1.5 m thin dune sets are interbedded with 1–5 m thick packages of proximal alluvial-fan breccia. Elsewhere, dunes are interbedded with the interdune facies association.
Representative logged sections illustrating the main depositional environments of the Rotliegend Group. See Table 1 for lithofacies codes. Core logs of all wells are available in the Appendix. Boul = boulder; c = coarse; cobb = cobble; f = fine; FA = Facies associations; gran = granule; m = medium; pebb = pebble; vc = very coarse; vf = very fine.
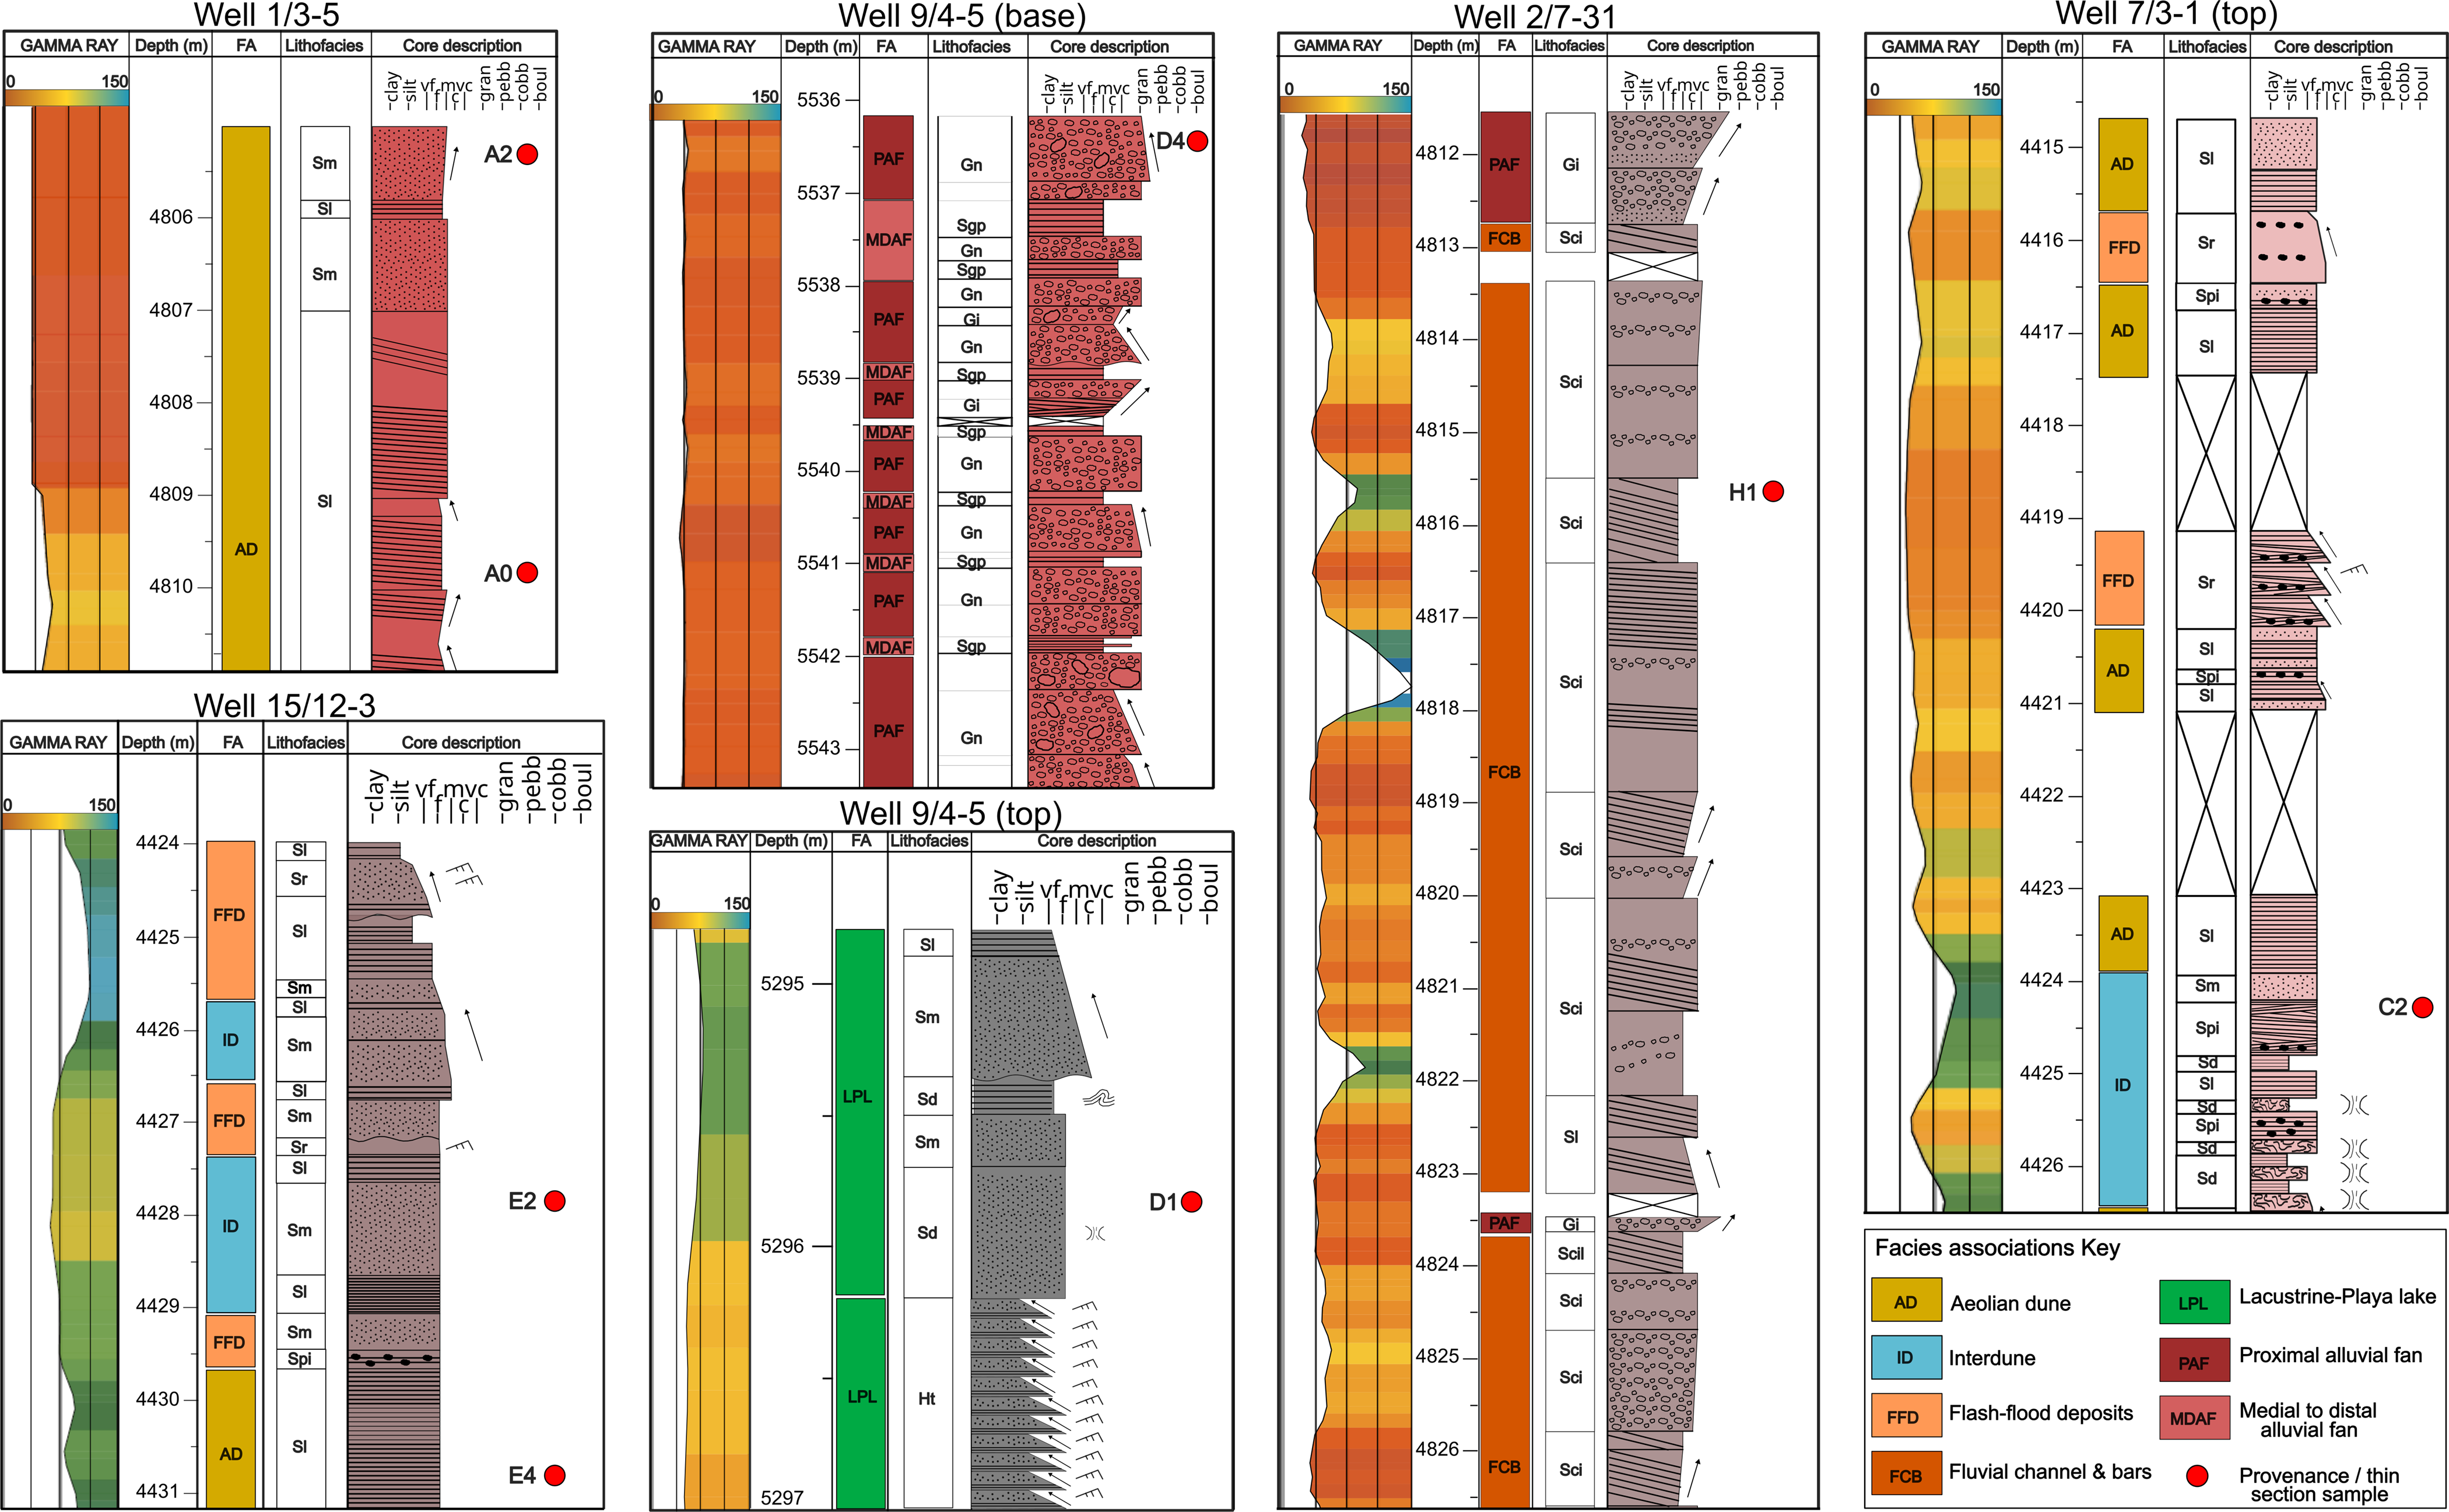
Figure 6. Long description
The image contains six vertical graphs representing logged sections of different wells, illustrating the main depositional environments of the Rotliegend Group. Each graph includes a gamma ray log, depth scale, facies associations, lithofacies, and core description. The wells are labeled as Well 1/3-5, Well 9/4-5 (base), Well 2/7-31, Well 7/3-1 (top), Well 15/12-3, and Well 9/4-5 (top). The facies associations are color-coded and include categories such as Aeolian dune, Interdune, Flash-flood deposits, Fluvial channel and bars, Proximal alluvial fan, Medial to distal alluvial fan, and Lacustrine-Play lake. Each well’s graph shows variations in depth and lithofacies, with specific codes and descriptions provided for each section. The core logs for all wells are available in the appendix. The graphs collectively illustrate the sedimentary and tectonic evolution and sediment transport dynamics in the Northern and Southern Permian basins.
Representative thin-section images under polarized light highlighting variations in grain size, sorting, clast roundness, lithology, lithofacies and cement. (A) Bi-modal, quartz-rich, planar-laminated sandstone (Sl) from an aeolian dune, featuring very fine to fine grainfall sand clasts and medium to coarse grainflow sand clasts. (B) Well-sorted, quartz-rich, planar-laminated sandstone (Sl) from an aeolian dune, featuring fine-grained sand clasts. (C) Sub-angular grains in quartz-rich, planar-laminated (Sl) coarse siltstone with abundant carbonate cement from an aeolian dune. (D) Fine-grained, poorly sorted sandstone with quartz and muscovite clasts, cemented by carbonate, from a sandstone with water-escape structures (Sd) of a flash-flood deposit. (E) Very poorly sorted polymictic normally graded conglomerate (Gn) with sub-angular to angular clasts from a proximal alluvial fan. (F) Rounded to sub-rounded grains in quartz-rich conglomerate (Gi) from a fluvial deposit.
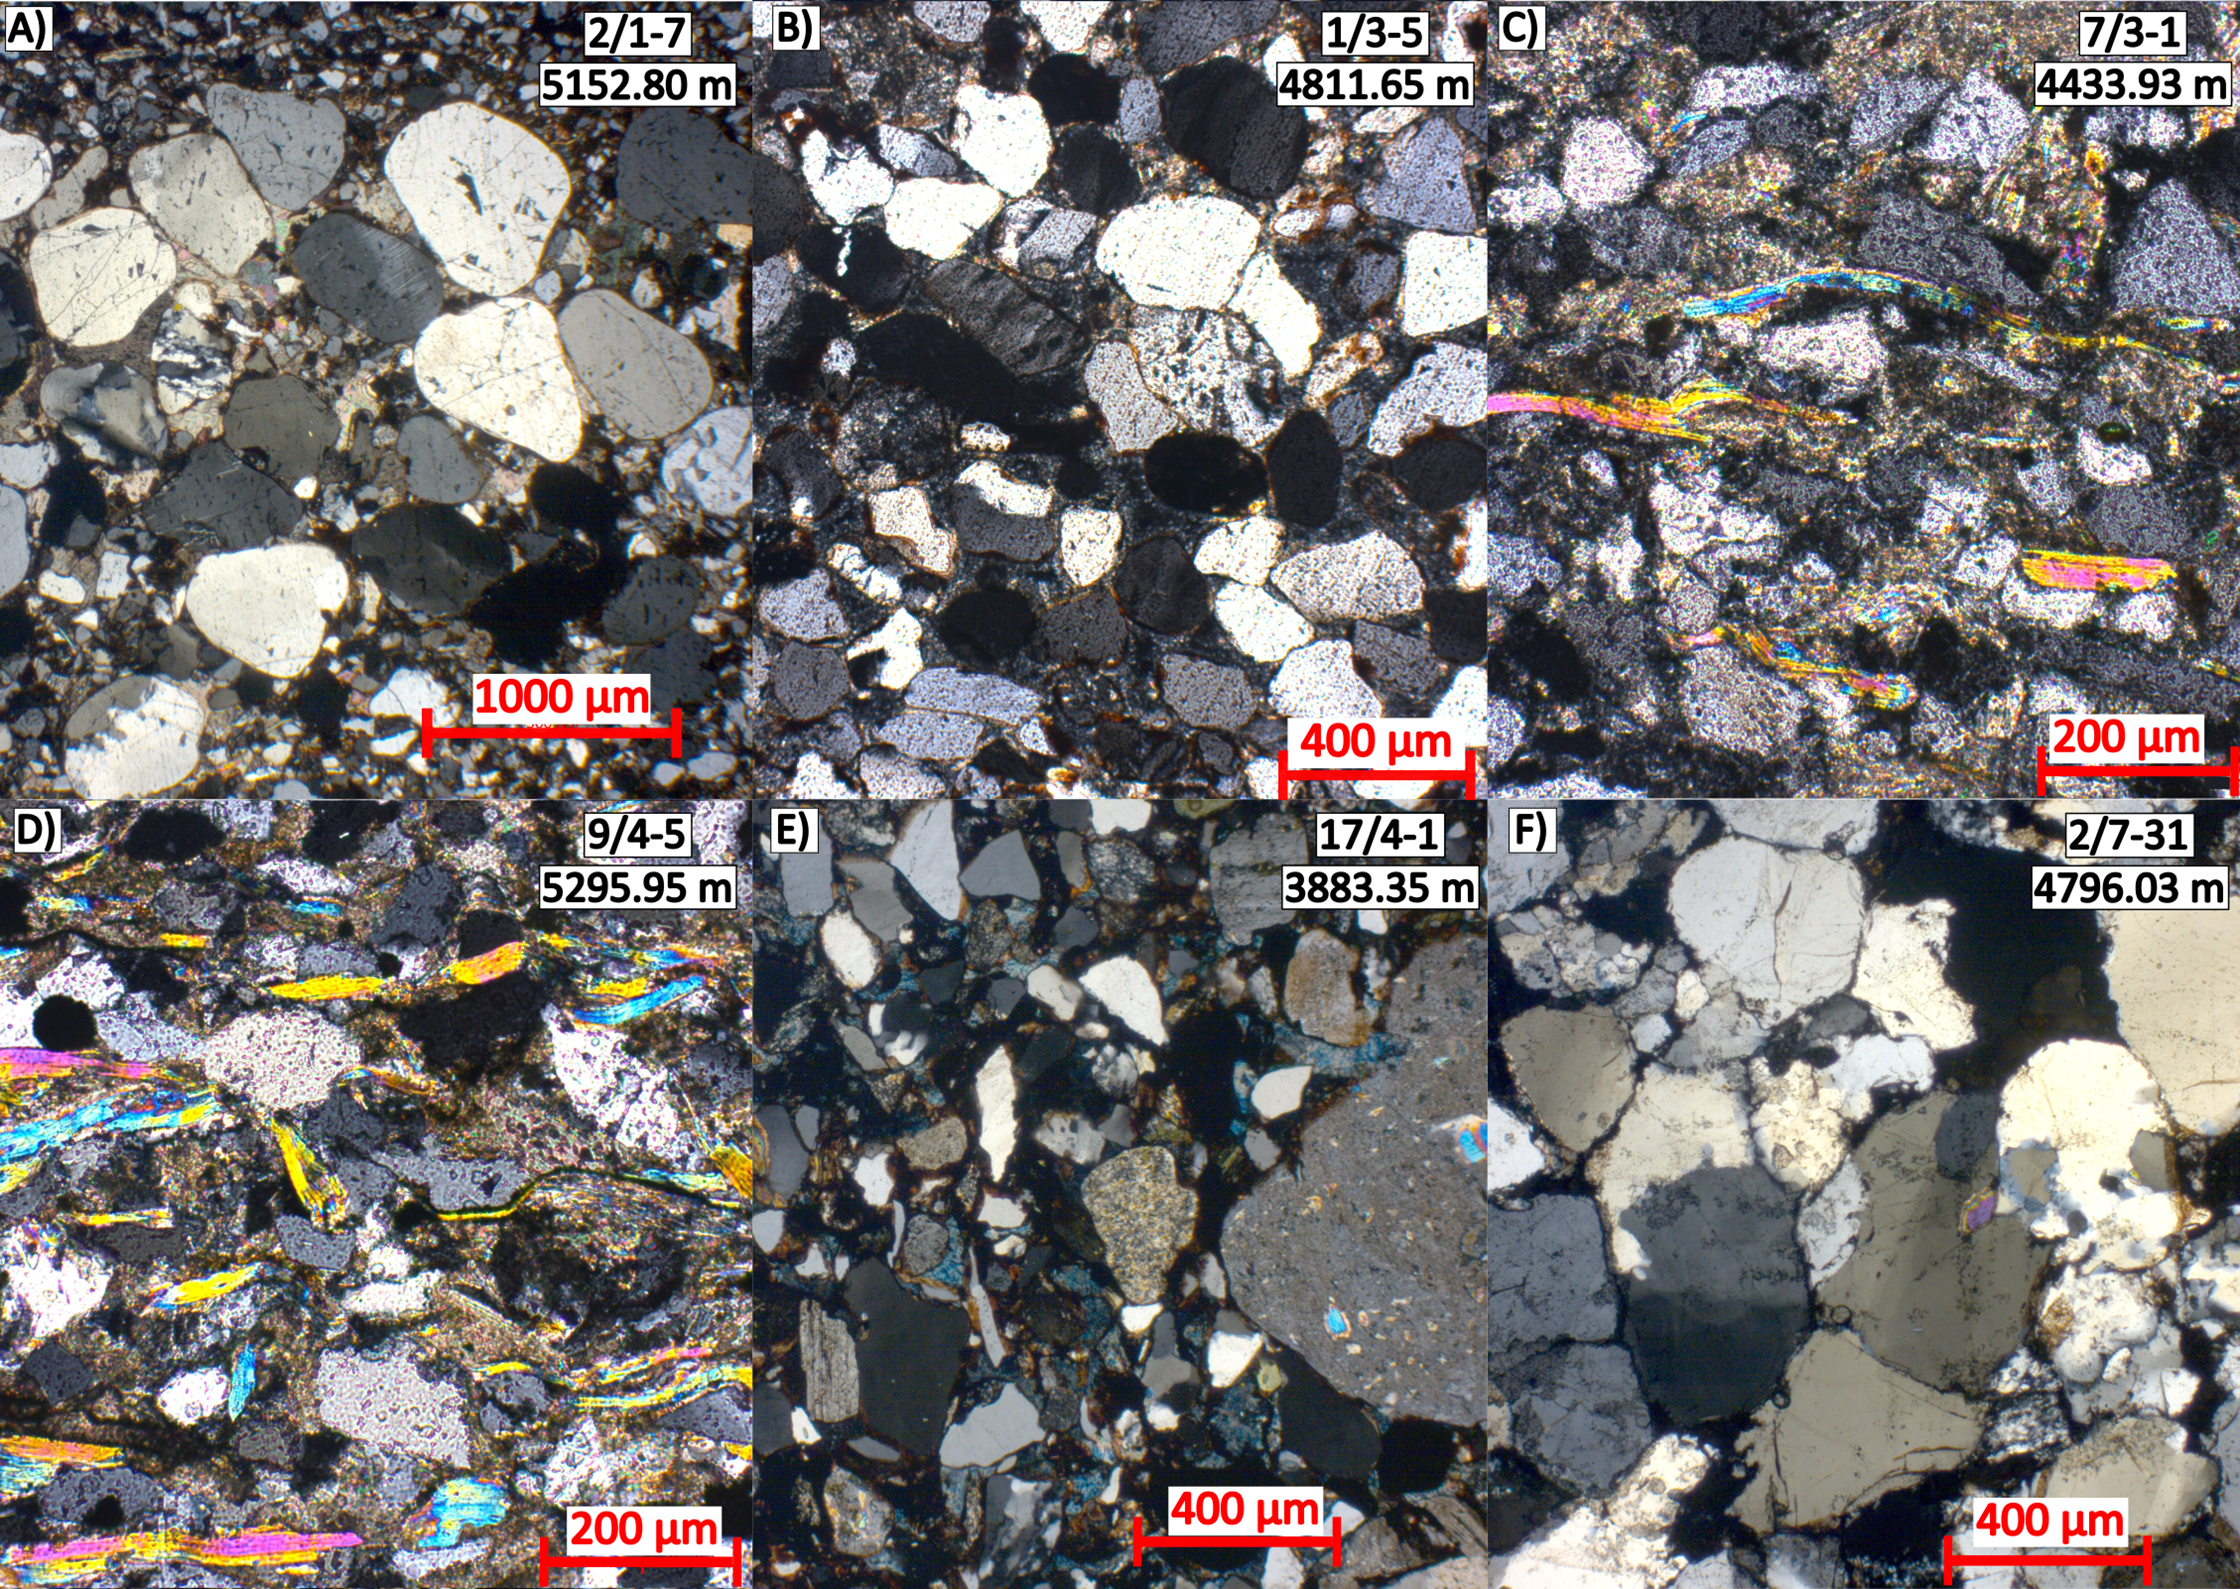
Figure 7. Long description
The collage consists of six separate images, each depicting different types of sandstone and conglomerate under polarized light. Image A shows a bi-modal, quartz-rich, planar-laminated sandstone from an aeolian dune, featuring very fine to fine grainfall sand clasts and medium to coarse grainflow sand clasts. Image B displays a well-sorted, quartz-rich, planar-laminated sandstone from an aeolian dune, with fine-grained sand clasts. Image C presents sub-angular grains in quartz-rich, planar-laminated coarse siltstone with abundant carbonate cement from an aeolian dune. Image D illustrates fine-grained, poorly sorted sandstone with quartz and muscovite clasts, cemented by carbonate, from a sandstone with water-escape structures of a flash-flood deposit. Image E shows a very poorly sorted polymictic normally graded conglomerate with sub-angular to angular clasts from a proximal alluvial fan. Image F depicts rounded to sub-rounded grains in quartz-rich conglomerate from a fluvial deposit.
Dipmeter analysis from wells 2/4-17 and 3/5-1 indicates that foreset dips are predominantly oriented toward the northeast to southeast (60–160°), with dip angles between 20° and 37° (Figures 1, 8A, B). Lower-angle dips (5–20°) are mainly oriented toward the northeast (40–85°; Figure 8A). In Well 15/9-9 with a < 30 m thin aeolian interval, dipmeter measurements also record prevailing winds towards the southeast to northeast (42–112°) with dip angles between 2° and 16° (Figure 8C).
Palaeowind directions from dipmeter data. A, B, C: Palaeowind indicators. B, D: Fluvial directions. E: Palaeocurrent indicators for alluvial-fan facies. Restored orientations are corrected for structural tilt. Intrepreted depositional systems for 3/5-1 from NOD (2025). n = number of measurements; mv = mean vector; k = concentration parameter of the Von Mises distribution; cv = circular variance.
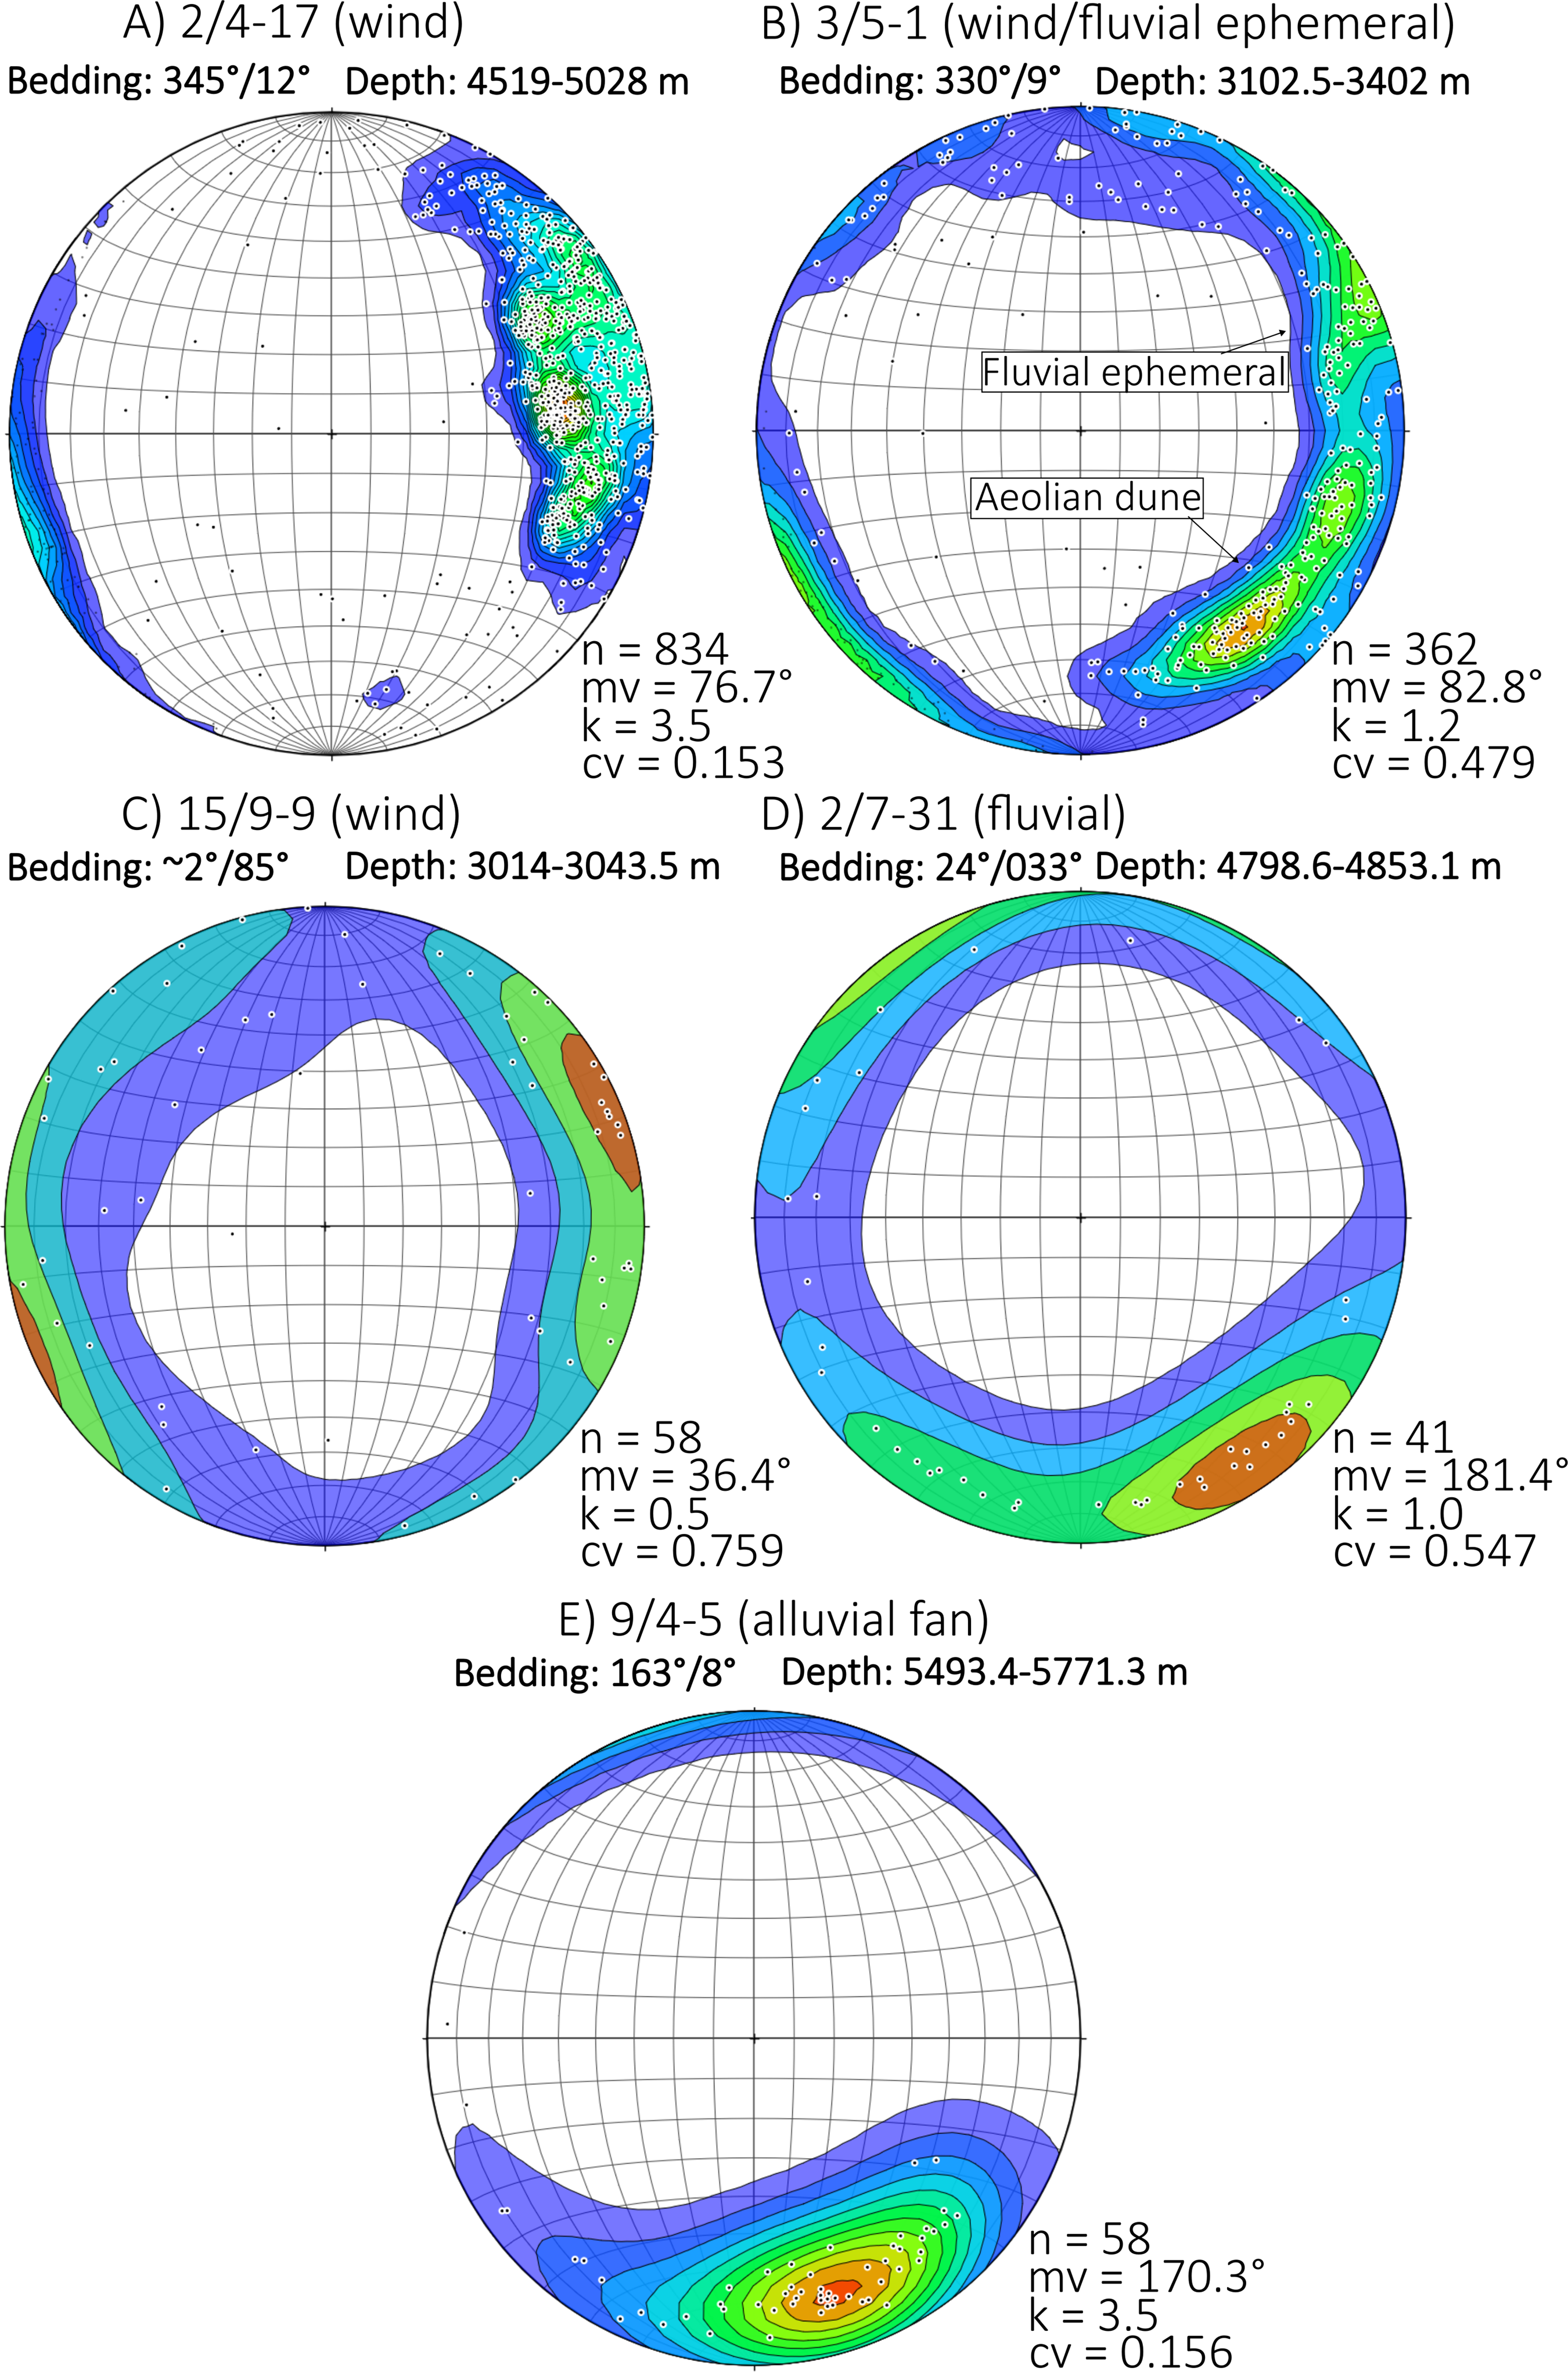
Figure 8. Long description
The image contains five circular diagrams labeled A to E, each representing different palaeowind and fluvial directions. Diagram A, dated 2/4-17, shows wind data with bedding at 345/12 degrees and depth ranging from 4519 to 5028 meters. Diagram B, dated 3/5-1, displays wind and fluvial ephemeral data with bedding at 330/9 degrees and depth from 3102.5 to 3402 meters, highlighting fluvial ephemeral and aeolian dune regions. Diagram C, dated 15/9-9, presents wind data with bedding at approximately 2/85 degrees and depth from 3014 to 3043.5 meters. Diagram D, dated 2/7-31, illustrates fluvial data with bedding at 24/033 degrees and depth from 4798.6 to 4853.1 meters. Diagram E, dated 9/4-5, shows alluvial fan data with bedding at 163/8 degrees and depth from 5493.4 to 5771.3 meters. Each diagram includes measurements, mean vectors, concentration parameters, and circular variances.
Interdune facies occur predominantly near the top of the Rotliegend Group. The facies comprise siltstone and very fine- to medium-grained sandstone with serrated and low to medium gamma-ray values. The facies commonly contain soft-sediment-deformation structures (Table 2; Figures 3 and 6). The interdune packages are 2–8 m thick in well 15/12-3 and the upper part of well 7/3-1. Interdunes are interbedded with dunes or, less commonly, flash-flood deposits (well 15/12-3 in the northwest). Flash-flood facies are represented by very fine- to medium-grained sandstone with serrated coarsening upwards gamma-ray patterns, ranging from low to high values, soft-sediment-deformation and ripple structures (Table 2; Figures 3 and 6). Packages are 0.5–5 m thick and interbedded with dune and interdune deposits (well 15/12-3), or with fluvial and alluvial facies (well 15/9-9). In the southeast (well 3/5-1), flash-flood facies are up to 95 m and separated by > 70 m thick packages of aeolian sandstone. The flash-flood deposits in the southeast are predominantly red-stained, fine- to coarse-grained, poorly sorted and contain occasional volcanic fragments and thin red siltstone interbeds (NOD, 2025).
Most aeolian sandstone thin sections, both from dunes and interdunes, represent fine- to medium-grained sandstone (exceptions: two very fine sandstone samples in wells 7/3-1 and 15/12-3; Table 3). The composition is quartzose and occasionally feldspatho-quartzose. The aeolian sandstone is generally matrix-poor and contains only minor ductile grains. In the south, the sandstone is mica-rich or mica-bearing, with muscovite, biotite and commonly with carbonate cement (Table 3; Figure 7C). Sorting is generally good to moderate, with some bimodal intervals due to intercalated coarser laminae. In the southern wells, the grains predominantly are rounded to sub-rounded, and in the northern wells, they are mainly sub-rounded to sub-angular (Table 3).
The dominantly good sorting, rounded grains, cross-bedded structures and compositionally mature texture of the thick, continuous dune deposits indicate large draas, similar to those in the Yellow Sands Formation of northeast England, although the main wind directions are towards the west there (Steele, Reference Steele1983; Glennie et al. Reference Glennie, Higham, Stemmerik, Evans, Graham, Armour and Bathurst2003) rather than towards the east. However, comparable southeast-directed foresets are reported for the Auk field in the British sector including well 30/16-1 (Heward, Reference Heward, Miall and Tyler1991) and well ELNA-1 in the Danish sector south of well 3/5-1 (Figure 1, GEUS, 2025), supporting regional consistency in palaeowind orientation across the Norwegian-British-Danish boundary. The coarse-grained laminae are interpreted as grainfall and grainflow beds on the dunes (Tables 1 and 2; Figure 7A). Soft-sediment-deformation structures in the interdune facies association may indicate accumulation in ephemeral water bodies or at dune fringes near the water table in combination with the cyclic intercalation with dune deposits and sharp contacts because they are caused by liquefaction or fluidization. The cyclic alternation of dune, interdune and flash-flood deposits indicates reworking in ephemeral sheet floods.
4.b. Fluvial depositional environment
Fluvial deposits occur mainly at the base and top of the Rotliegend Group and are best developed in the southern and eastern parts of the study area. In the south, fluvial successions reach several 100 m in thickness (up to ∼200 m in well 2/7-31; Figure 4) and locally alternate with 5–10 m thick alluvial-fan deposits. Approximately 40 m of aeolian deposits in well 2/7-29 pass laterally into fluvial deposits in well 2/7-31 over short distances (Figure 4). In well 3/5-1, a ∼25 m thick basal conglomeratic package of probable fluvial origin is overlain by aeolian facies (Figure 1; NOD, 2025).
Fluvial channel and bar deposits consist of erosional-based, fining-upward successions of pebbly conglomerate and fine- to coarse-grained sandstone, sometimes with 1–2 cm-thick conglomeratic intervals and mud and siltstone intraclasts. Typically, these facies have a blocky, serrated gamma-ray pattern with very low to low values, though locally very high values occur (Table 2). Packages range from a few centimetres to several metres, and amalgamated successions reach up to 40 m thickness in the south (Figure 4).
Similar to the aeolian sandstone, fluvial sandstone is fine- to coarse-grained quartzose, but moderately to poorly sorted, and with sub-angular to rounded grains (Table 3). In particular, the basal conglomerate contains pebbles almost entirely composed of basic volcanic rocks (NOD, 2025).
The drainage orientations are contrasting in different areas. In well 2/7-31 in the southwest, cross-bed measurements indicate palaeocurrents predominantly directed toward the southwest to southeast (130–224°), with dip angles generally between 9° and 15° (Figure 8D; Glass et al. Reference Glass, Paludan and Dürr1999). In contrast, dipmeter data from an interval interpreted as an ephemeral fluvial system (NOD, 2025) in the lower section of the Rotliegend Group of well 3/5-1 in the southeast (3308–3402 m) are more similar to the wind directions with palaeocurrents oriented predominantly toward the northeast, and with dip angles between 2° and 10° (Figure 8B).
The erosional bases, cross-bedding and fining-upward trends, combined with the coarse-grained, moderately to poorly sorted texture, indicate that the fluvial channel and bar facies in the south represent confined, high-energy sediment transport by channel-fill and bar-migration processes, with limited floodplain preservation. Their substantial thickness and limited lateral extent suggest isolated, long-lived fluvial systems restricted to drainage corridors (Figure 4).
4.c. Alluvial-fan depositional environment
Alluvial-fan deposits are best developed in the northern and eastern parts of the study area. In the east and northeast, they reach several 100 m in thickness (e.g., 450 m in well 9/4-5). Here, proximal facies occur as 1–2 m thick packages interbedded with 0.2–0.5 m thick cycles of medial to distal facies (Figures 4 and 6). In the northwest (close to well 15/9-9), alluvial-fan deposits pinch out and occur as thin alternations with 0.5–1.5 m thick aeolian packages towards the top (Figure 3). In the south, alluvial-fan facies are thinner and occur as intercalations within the predominantly fluvial succession (well 2/7-31; Figure 4).
Proximal facies consist of very coarse sandstone to conglomerate with gravel clasts typically 2–4 cm and up to 20 cm in size. They are poorly sorted, lack fine-grained material and have blocky and very low to low gamma-ray values (Tables 1 and 2). In the east, they form amalgamated multistorey bodies (Figure 4) with erosional bases, diffuse cross-bedding and normal to locally inverse grading (Figure 6). Proximal facies commonly alternate with medial to distal alluvial-fan facies and more rarely with fluvial or aeolian deposits (Figures 3 and 4). Medial to distal facies comprise medium- to coarse-grained sandstone with variable pebble content and occasional thin conglomeratic beds. These have blocky gamma-ray patterns with slightly higher values than the proximal facies where both occur together, moderate sorting, planar stratification, tractional structures and channelized geometries (Figure 4).
Thin-section analysis indicates that coarse sandstone to conglomerate/breccia facies contain pebble-sized clasts in a fine- to very fine-grained sand matrix with poor to very poor sorting (Table 3). Clast roundness varies from angular to rounded. In some cases, rounded granules are mixed with sub-angular fine- to medium-sand grains (Table 3; Figure 7E). The conglomerate is polymictic in the east and northeast, comprising quartz, volcanic and metamorphic lithic fragments, chert, feldspar, muscovite and opaque minerals (Table 3; Figure 7E). In the northwest, the facies are composed of texturally immature feldspatho-quartzose monomictic breccia, in which both clasts and matrix are composed of the same sandstone lithology. The breccia is typically cemented by carbonate (Table 3).
Palaeocurrent directions are consistently southerly (135–180°), with dip angles typically ranging between 16° and 28° when restoration is based exclusively on laminated sandstone intervals (excluding dip measurements from pebbly sandstone and conglomeratic beds to approximate primary depositional dips; Figure 8E; NOD, 2025).
Large clast size, very poor sorting and high depositional dips indicate high-energy, gravity-driven processes in proximal settings, whereas the more organized geometries of medial to distal facies reflect increasing fluvial influence. The substantial thickness and cyclicity of proximal facies packages suggest deposition by episodic flows, probably driven by seasonal floods or tectonic events. Cyclic alternation of proximal and medial–distal facies possibly indicates reworking of proximal-fan sediment into downstream sheetflood settings. Thick and laterally continuous successions in the east and northeast suggest proximity to a persistent sediment source, active fan progradation or localized subsidence. In contrast, the immature monomictic breccia in the northwest reflects very short transport. The thin intercalations with fluvial deposits in the south suggest rapid, short-lived events with material being sourced from adjacent highs and subsequently reworked into the main drainage system.
4.d. Lacustrine and playa-lake depositional environment
Lacustrine and playa-lake deposits are best developed in the central and northeastern parts of the study area. In the central area, they reach almost 200 m in thickness (e.g., 190 m in well 8/10-3). In the northeast (well 9/4-5), lacustrine strata are 80 m thick at base of the Rotliegend Group. The interval is strongly faulted and folded, but in little disturbed sections it comprises laminated shales and heterolithic beds with serrated to blocky gamma-ray profile with medium to locally very high values (Figure 4; NOD, 2025). It is overlain by alluvial-fan deposits, separated by an erosional surface (NOD, 2025).
Lacustrine/playa-lake deposits occur at the top of the Rotliegend Group in large parts of the study area. The upper interval consists mainly of silty claystone interbedded with very fine- to fine-grained sandstone with ripple cross-lamination, parallel lamination and normal grading (Tables 1 and 2; NOD, 2025). The interval is characterized by serrated, fining-upward gamma-ray trends with medium to high values. Correlation of gamma-ray logs and core descriptions shows that this upper fine-grained package can be traced across much of the central part of the basin (e.g., wells 2/1-7, 8/10-3, and 9/4-5; Figures 3 and 4), forming a regionally correlatable lacustrine/playa-lake interval. In the northeast (well 9/4-5) ∼30 m of lacustrine/playa-lake deposits occur at the top of the unit (Figure 4). Thin-section observations from well 9/4-5 (Figure 7D) show that the fine-grained sandstone is quartz-rich and micaceous, with abundant aligned mica flakes dispersed through the carbonate matrix (Table 3). The core description documents plant fragments and trace fossils identified as Planolites and possible Palaeophycus (NOD, 2025). Algae at 5296.4 m depth indicates deposition under freshwater to brackish conditions (NOD, 2025). The deposits are thinner in the west (wells 2/1-7, 6/3-2), where 10–25 m thick fine-grained intervals partly contain traces of pyrite (NOD, 2025). The package thins towards the southwest. The claystone in well 8/10-3 in the central area is micaceous. It also contains fine-grained red sandstone stringers that are well-sorted and composed of sub-rounded to rounded quartz grains with high sphericity and lacking organic matter (NOD, 2025). These deposits overlie ∼150 m of aeolian sandstone characterized by blocky gamma-ray pattern with low values (Figure 4).
Image-log data from the upper lacustrine interval of well 9/4-5 indicate stable, nearly horizontal bedding with dips averaging 3° toward the southeast (128°; NOD, 2025). In contrast, the lower lacustrine interval is strongly deformed, displaying two moderately defined dip clusters (NOD, 2025). These clusters likely represent opposing limbs of a gentle fold, with limb 1 dipping 26° to the southwest and limb 2 dipping 31° to the northeast. The calculated fold-axis orientation (317°/06°) suggests post-depositional deformation of the lower lacustrine succession.
The combination of oxidized, micaceous claystone, thin sandstone interbeds, sparse biogenic remains and subhorizontal bedding suggests deposition in a low-energy lacustrine or playa-lake setting that developed locally in topographic lows during both the early and late stages of Rotliegend Group sedimentation. The trace fossils, together with freshwater–brackish algal remains, indicate intermittent water cover and oxygenated substrates typical of shallow, low-energy conditions. The thin, well-sorted sandstone laminae likely record periodic sheetflood or reworked aeolian influx (Table 1). Progressive thinning to the southwest record pinch out under arid to semi-arid conditions at a late stage (Figures 3 and 4). Waterlain shaly deposits 30–50 m thick also are interpreted at the top of the Rotliegend Group in the Auk field in the British sector of the Northern Permian Basin (well 30/16-1; Figure 1; Heward, Reference Heward, Miall and Tyler1991). Additionally, similar oxidized, fine-grained lacustrine deposits have been described from the Southern Permian Basin (e.g., Glennie and Buller, Reference Glennie and Buller1983; Howell and Mountney, Reference Howell and Mountney1997; Grötsch et al. Reference Grötsch, Sluijk, van Ojik, de Keijzerm, Graaf, Steenbrink and Grötsch2011).
5. Zircon results
The analysed zircon grains range from 3.8 Ga to 270 Ma in age. Four main age groups are identified: 2500–2900 Ma, 1400–2000 Ma, 900–1200 Ma, and 400–500 Ma (Figure 9). Most grains are 60 and 160 µm in length, with a median of 100 µm (Figure 10). The 2200–3000 Ma population typically lies within the 50–200 µm interval. Spearman’s rank correlation analysis between zircon age and grain size for the pooled dataset (n = 3055) yields a weak negative correlation (ρ = –0.11, p < 0.001). Analyses within individual age populations show similarly low coefficients (|ρ| ≤ 0.16; Appendix 4), indicating no systematic age–grain–size relationship. Consistent with this result, all major age components occur across the full grain size range (Figure 9). In addition, samples of similar grain size have contrasting age spectra, and samples of different grain size partly have similar age distribution. Heavy-mineral abundance in the processed 25–500 µm interval ranges from 0.1–5.4 wt.% (Table 3). High values are generally associated with proximal alluvial-fan and conglomeratic facies, lacustrine deposits show intermediate values, whereas most aeolian dune and interdune deposits display low values. The zircon abundance does not correlate with the heavy-mineral abundance.
Zircon grain size versus U-Pb age for all 3055 concordant zircon ages, grouped into twelve age populations. The age populations are based on the main crustal provinces and orogenic cycles represented in the North Sea region (Caledonian, Sveconorwegian, Gothian/Svecofennian, Archaean), with additional bins for Carboniferous–Permian volcanic ages and natural gaps in the dataset.
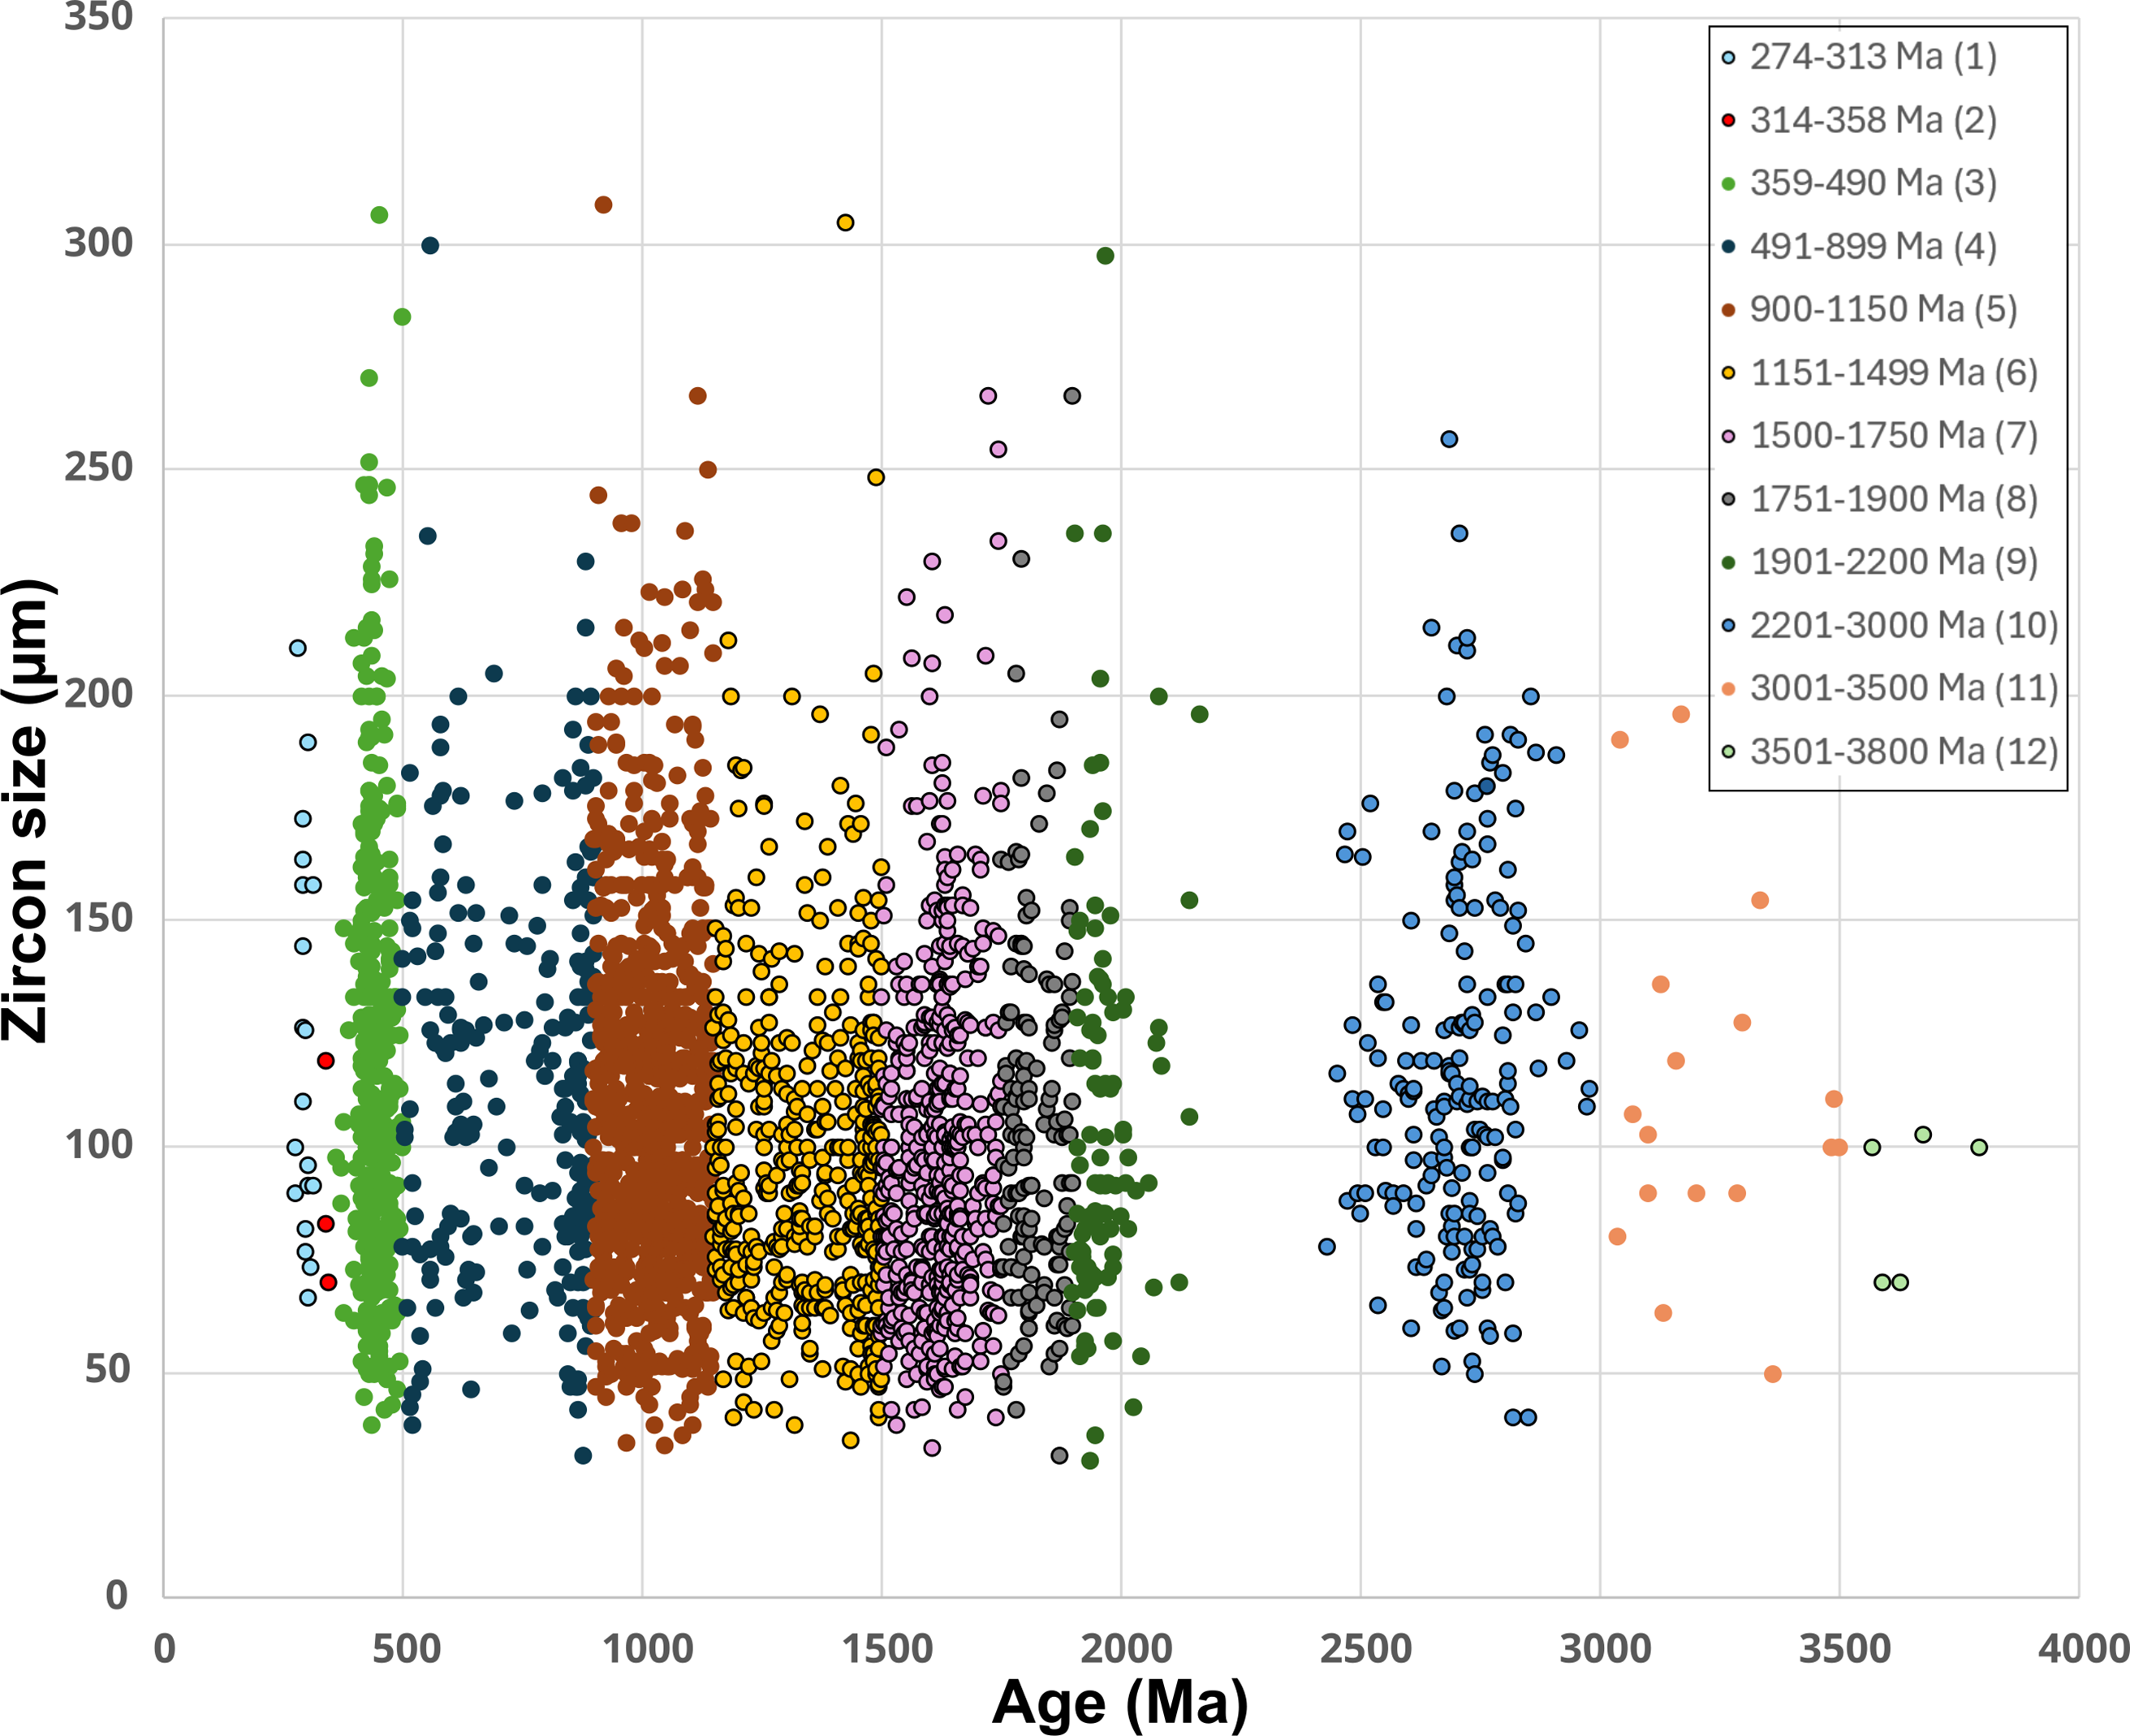
Figure 9. Long description
A scatter plot showing zircon grain size versus U-Pb age for 3055 concordant zircon ages, grouped into twelve age populations. The x-axis represents age in millions of years, ranging from 0 to 4000 million years. The y-axis represents zircon size in micrometers, ranging from 0 to 350 micrometers. The data points are color-coded and shaped differently to represent different age populations. The age populations are based on the main crustal provinces and orogenic cycles represented in the North Sea region, including Caledonian, Sveconorwegian, Gothian/Svecofennian, and Archaean, with additional bins for Carboniferous-Permian volcanic ages and natural gaps in the dataset. The scatter plot shows clusters of data points for each age population, with some gaps and outliers visible. The overall trend indicates variations in zircon grain size across different age populations. All values are approximated.
Zircon and sample grain size comparison for concordant zircon ages from each analysed well interval. Red squares represent the zircon P50, and the upper and lower limits correspond to the P90 and P10, respectively. Blue crosses indicate representative thin-section grain sizes. The coloured lines represent the P50, P90 and P10 for the entire population of the zircon grains. Axis is logarithmic.

Figure 10. Long description
A scatter plot compares zircon and sample grain sizes for concordant zircon ages from analyzed well intervals. Red squares represent the zircon P50, with upper and lower limits corresponding to the P90 and P10, respectively. Blue crosses indicate representative thin-section grain sizes. The colored lines represent the P50, P90, and P10 for the entire population of zircon grains. The x-axis represents well intervals, and the y-axis represents zircon and grain size in micrometers on a logarithmic scale. The plot shows several data points with clusters and patterns. The dataset spans multiple well intervals, and all values are approximated.
Western, northeastern and northwestern provenance groups are differentiated (Figure 11). The western group comprises wells 1/3-5, 2/1-7, 2/7-29 and 2/7-31, as well as the shallowest samples from wells 15/9-9 and 15/12-3 in the northwest. It is mostly represented by aeolian deposits, but also fluvial and alluvial-fan sandstone (Table 3). The main ages are 400–500 Ma, with secondary Neoproterozoic, Mesoproterozoic–Palaeoproterozoic and a consistent Palaeoproterozoic–Neoarchaean component (Figure 11). Only wells 1/3-5 and 2/1-7 have consistent age spectra across depths (Figure 11). In four other wells, Proterozoic grains dominate in one sample whereas 400–500 Ma grains dominate in another.
Intra-well detrital zircon-age distribution subdivided into three groups: western (left), northeastern (centre), and northwestern (right). Each spectrum contains the sample number, depth, median zircon size and interpreted lithofacies.
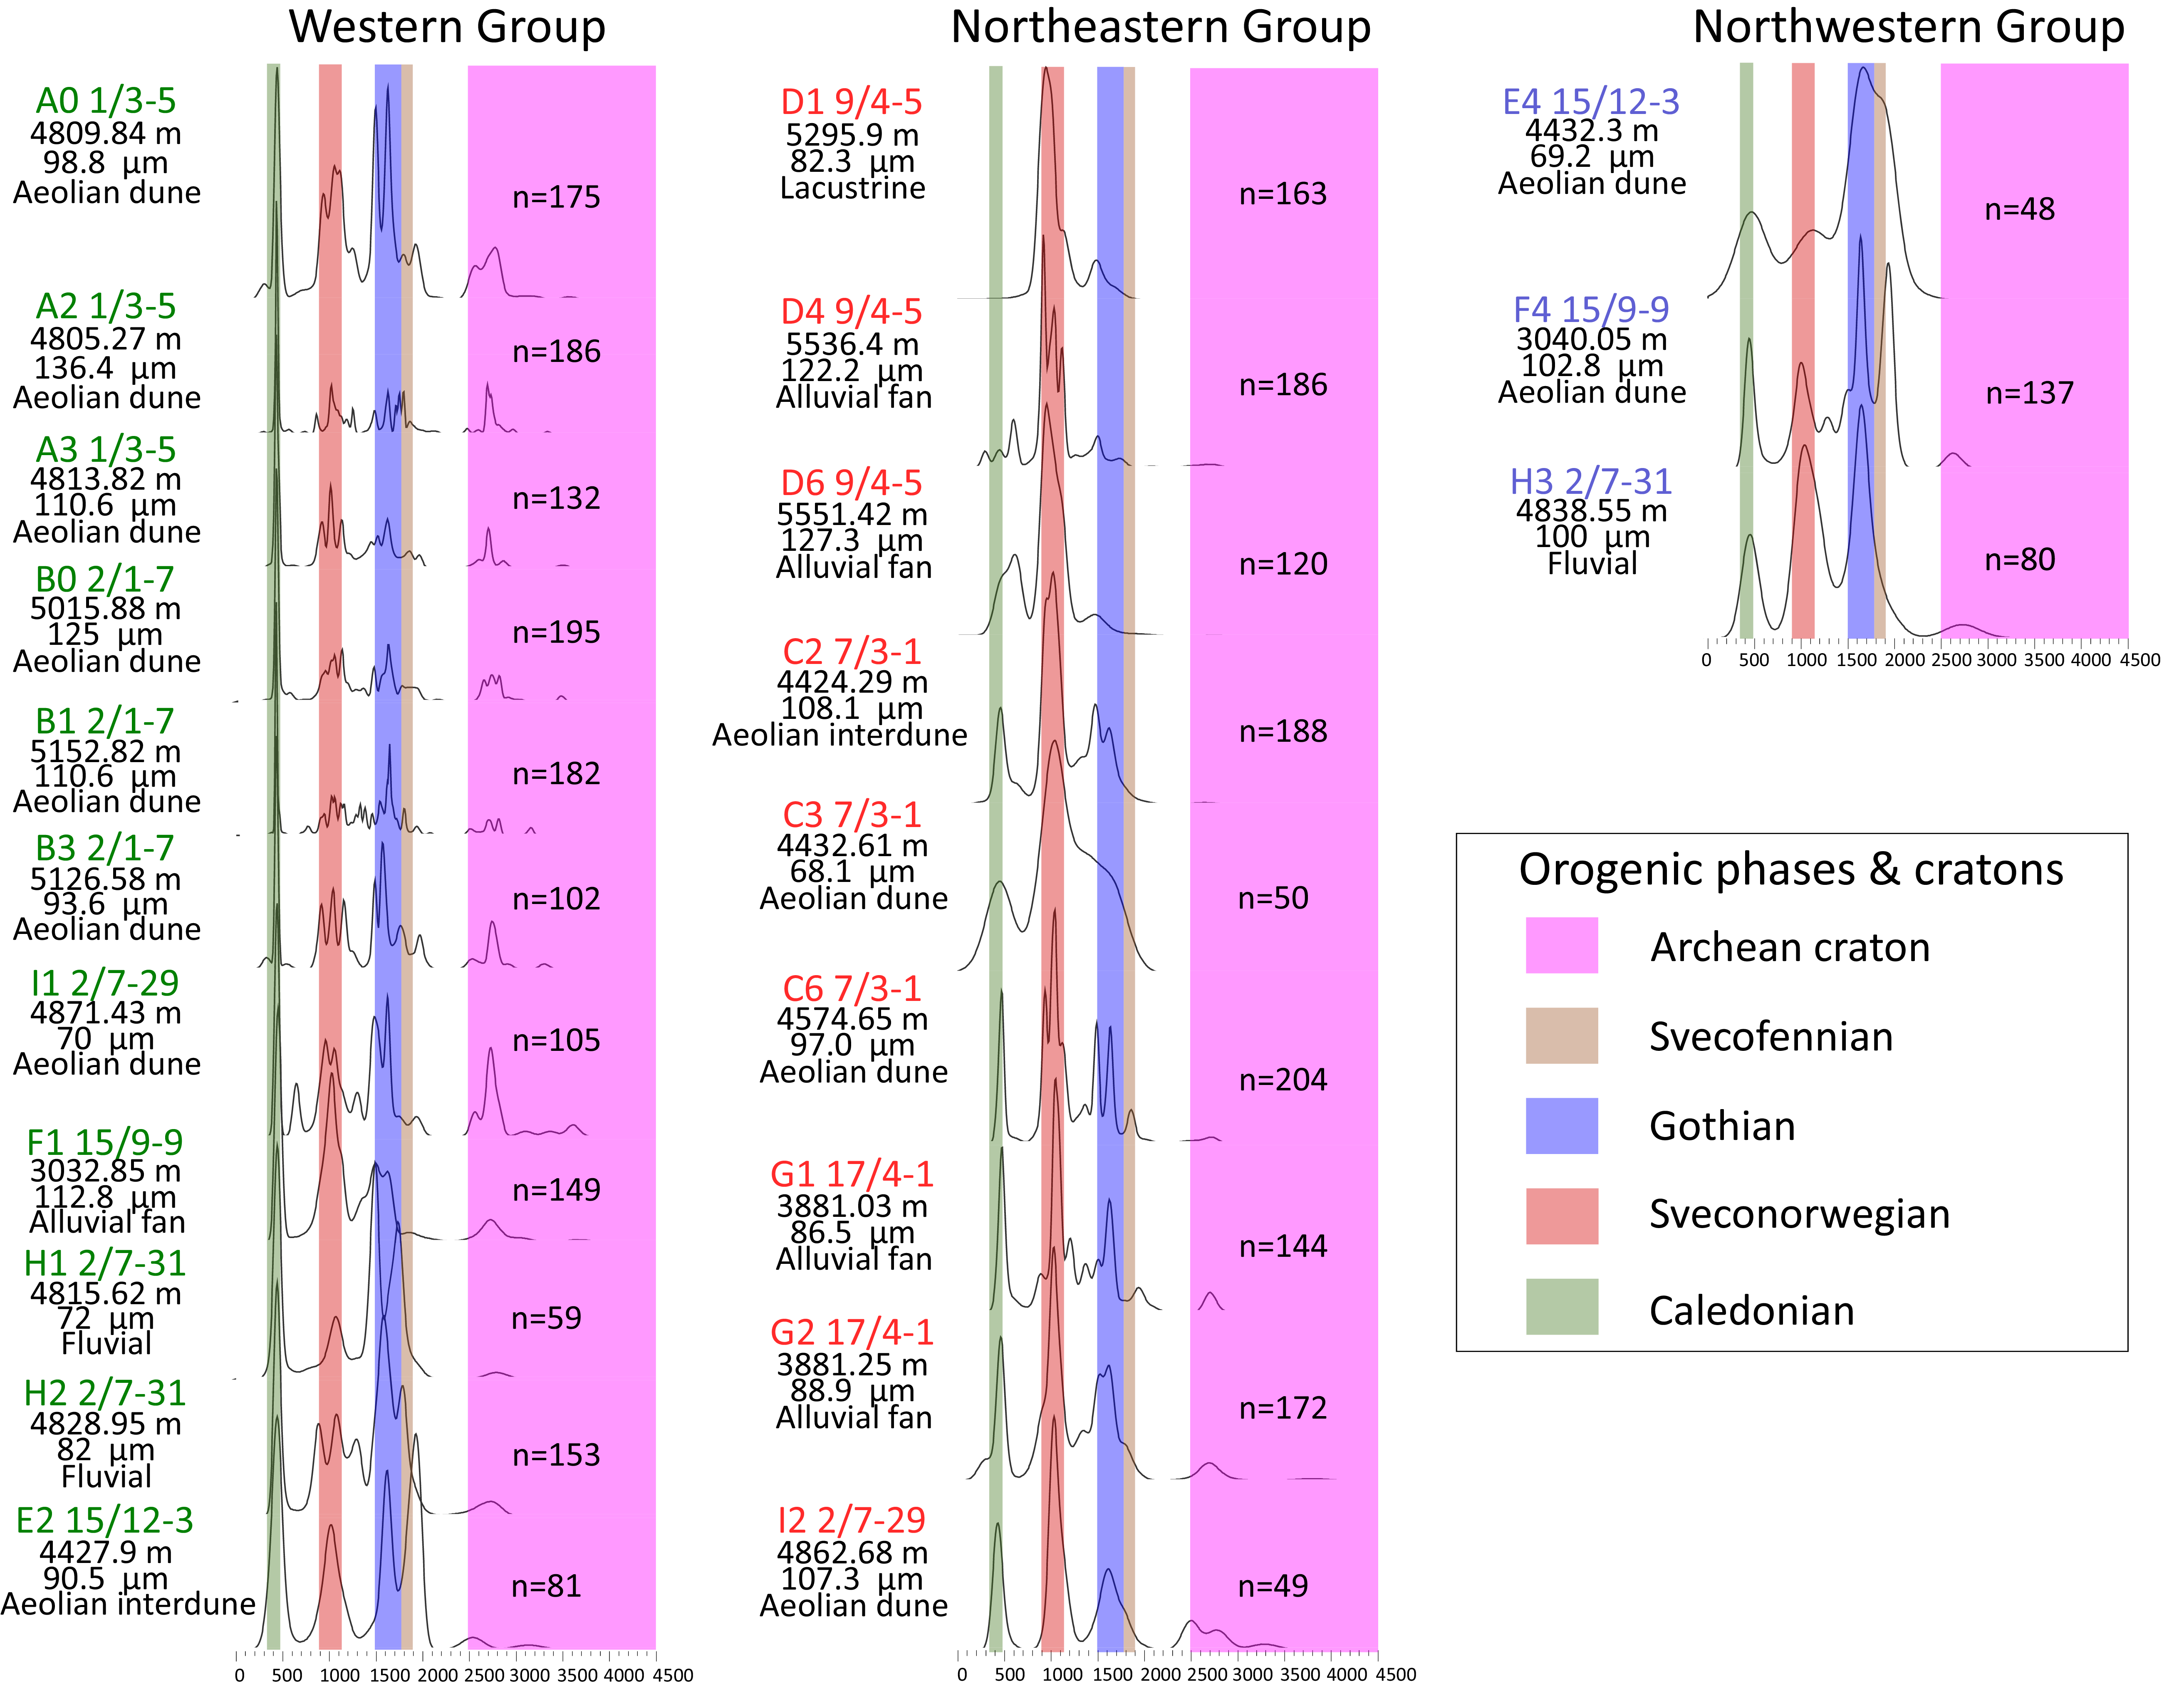
Figure 11. Long description
The image contains three groups of graphs representing intra-well detrital zircon-age distribution: western, northeastern, and northwestern. Each group consists of multiple line graphs with different colors representing various orogenic phases and cratons. The western group includes graphs labeled A0 to E2, the northeastern group includes graphs labeled D1 to I2, and the northwestern group includes graphs labeled E4 to H3. Each graph shows the sample number, depth, median zircon size, and interpreted lithofacies. The colors in the graphs represent different orogenic phases and cratons: pink for Archean craton, beige for Svecofennian, blue for Gothian, red for Sveconorwegian, and green for Caledonian. The x-axis represents the zircon age distribution, and the y-axis represents the frequency of zircon ages. The graphs are overlaid to compare the zircon-age distributions across different wells and regions. All values are approximated.
The northeastern group comprises wells 7/3-1, 9/4-5, 17/4-1 and the shallowest sample of well 2/7-29. It is mostly represented by alluvial-fan deposits, but also fluvial and aeolian sandstone (Table 3). Different to the western group, the main ages are 900–1200 Ma. Secondary ages are Early Palaeozoic, Meso-Palaeoproterozoic, and occasional Palaeoproterozoic-Neoarchaean populations (Figure 11). Within the 900–1200 Ma interval, some samples from wells 7/3-1 and 9/4-5 display two or three distinct peaks instead of a single dominant mode. These correspond to the samples with the largest number of analyses within each well (Figure 11). Only wells 7/3-1 and 17/4-1 have consistent age spectra across depths (Figure 11). Intra-well variability is evident in the other two wells with varying secondary Palaeozoic age peaks.
The northwestern group comprises the deepest samples from wells 15/12-3, 15/9-9 and 2/7-31 deposited in aeolian and fluvial facies (Table 3). The main ages are older than for the western and northeastern group at 1500–2000 Ma with minor 900–1200 Ma and 400–500 Ma ages and only rare Neoarchaean zircon grains (Figure 11). Well 15/12-3 preserves the highest proportion of Palaeoproterozoic ages despite having the lowest amount of zircon grains analysed in the complete dataset. Intra-well variability is evident, because the shallowest samples in all three wells belong to the western group.
Multidimensional scaling of the pairwise K–S dissimilarities reveals three principal clusters that broadly correspond to the western, northeastern and northwestern provenance groups defined on the basis of dominant age components (Figure 12). Three samples are more similar to a group that they have not been assigned to based on the zircon-age-distribution spectra. Sample F1 from well 15/9-9 that is assigned to the western group is similar to samples in the northeastern group, and samples I2 from well 2/7-29 of the northeastern group and H3 from well 2/7-31 of the northwestern group both are fairly similar to samples in the western group. In well 15/9-9, closely spaced stratigraphically adjacent alluvial-fan (F1) and aeolian (F4) deposits display contrasting zircon-age-spectra and large K–S dissimilarities. Samples from wells 7/3-1 and 17/4-1 occupy intermediate positions between the western and northeastern clusters.
Pairwise K–S dissimilarities between zircon-age distributions. Distances represent statistical dissimilarity between cumulative zircon-age distributions. The axes (Dim1 and Dim2) represent dimensionless coordinates derived from multidimensional scaling. The western, northeastern and northwestern provenance groups are defined based on dominant zircon-age components. Samples F1, I2 and H3 occupy positions that differ from their dominant-component grouping when evaluated using full-distribution similarity. See Figure 11 for well names of the samples. Interpretation of detrital zircon similarity follows the approach outlined by Vermeesch (Reference Vermeesch2018).
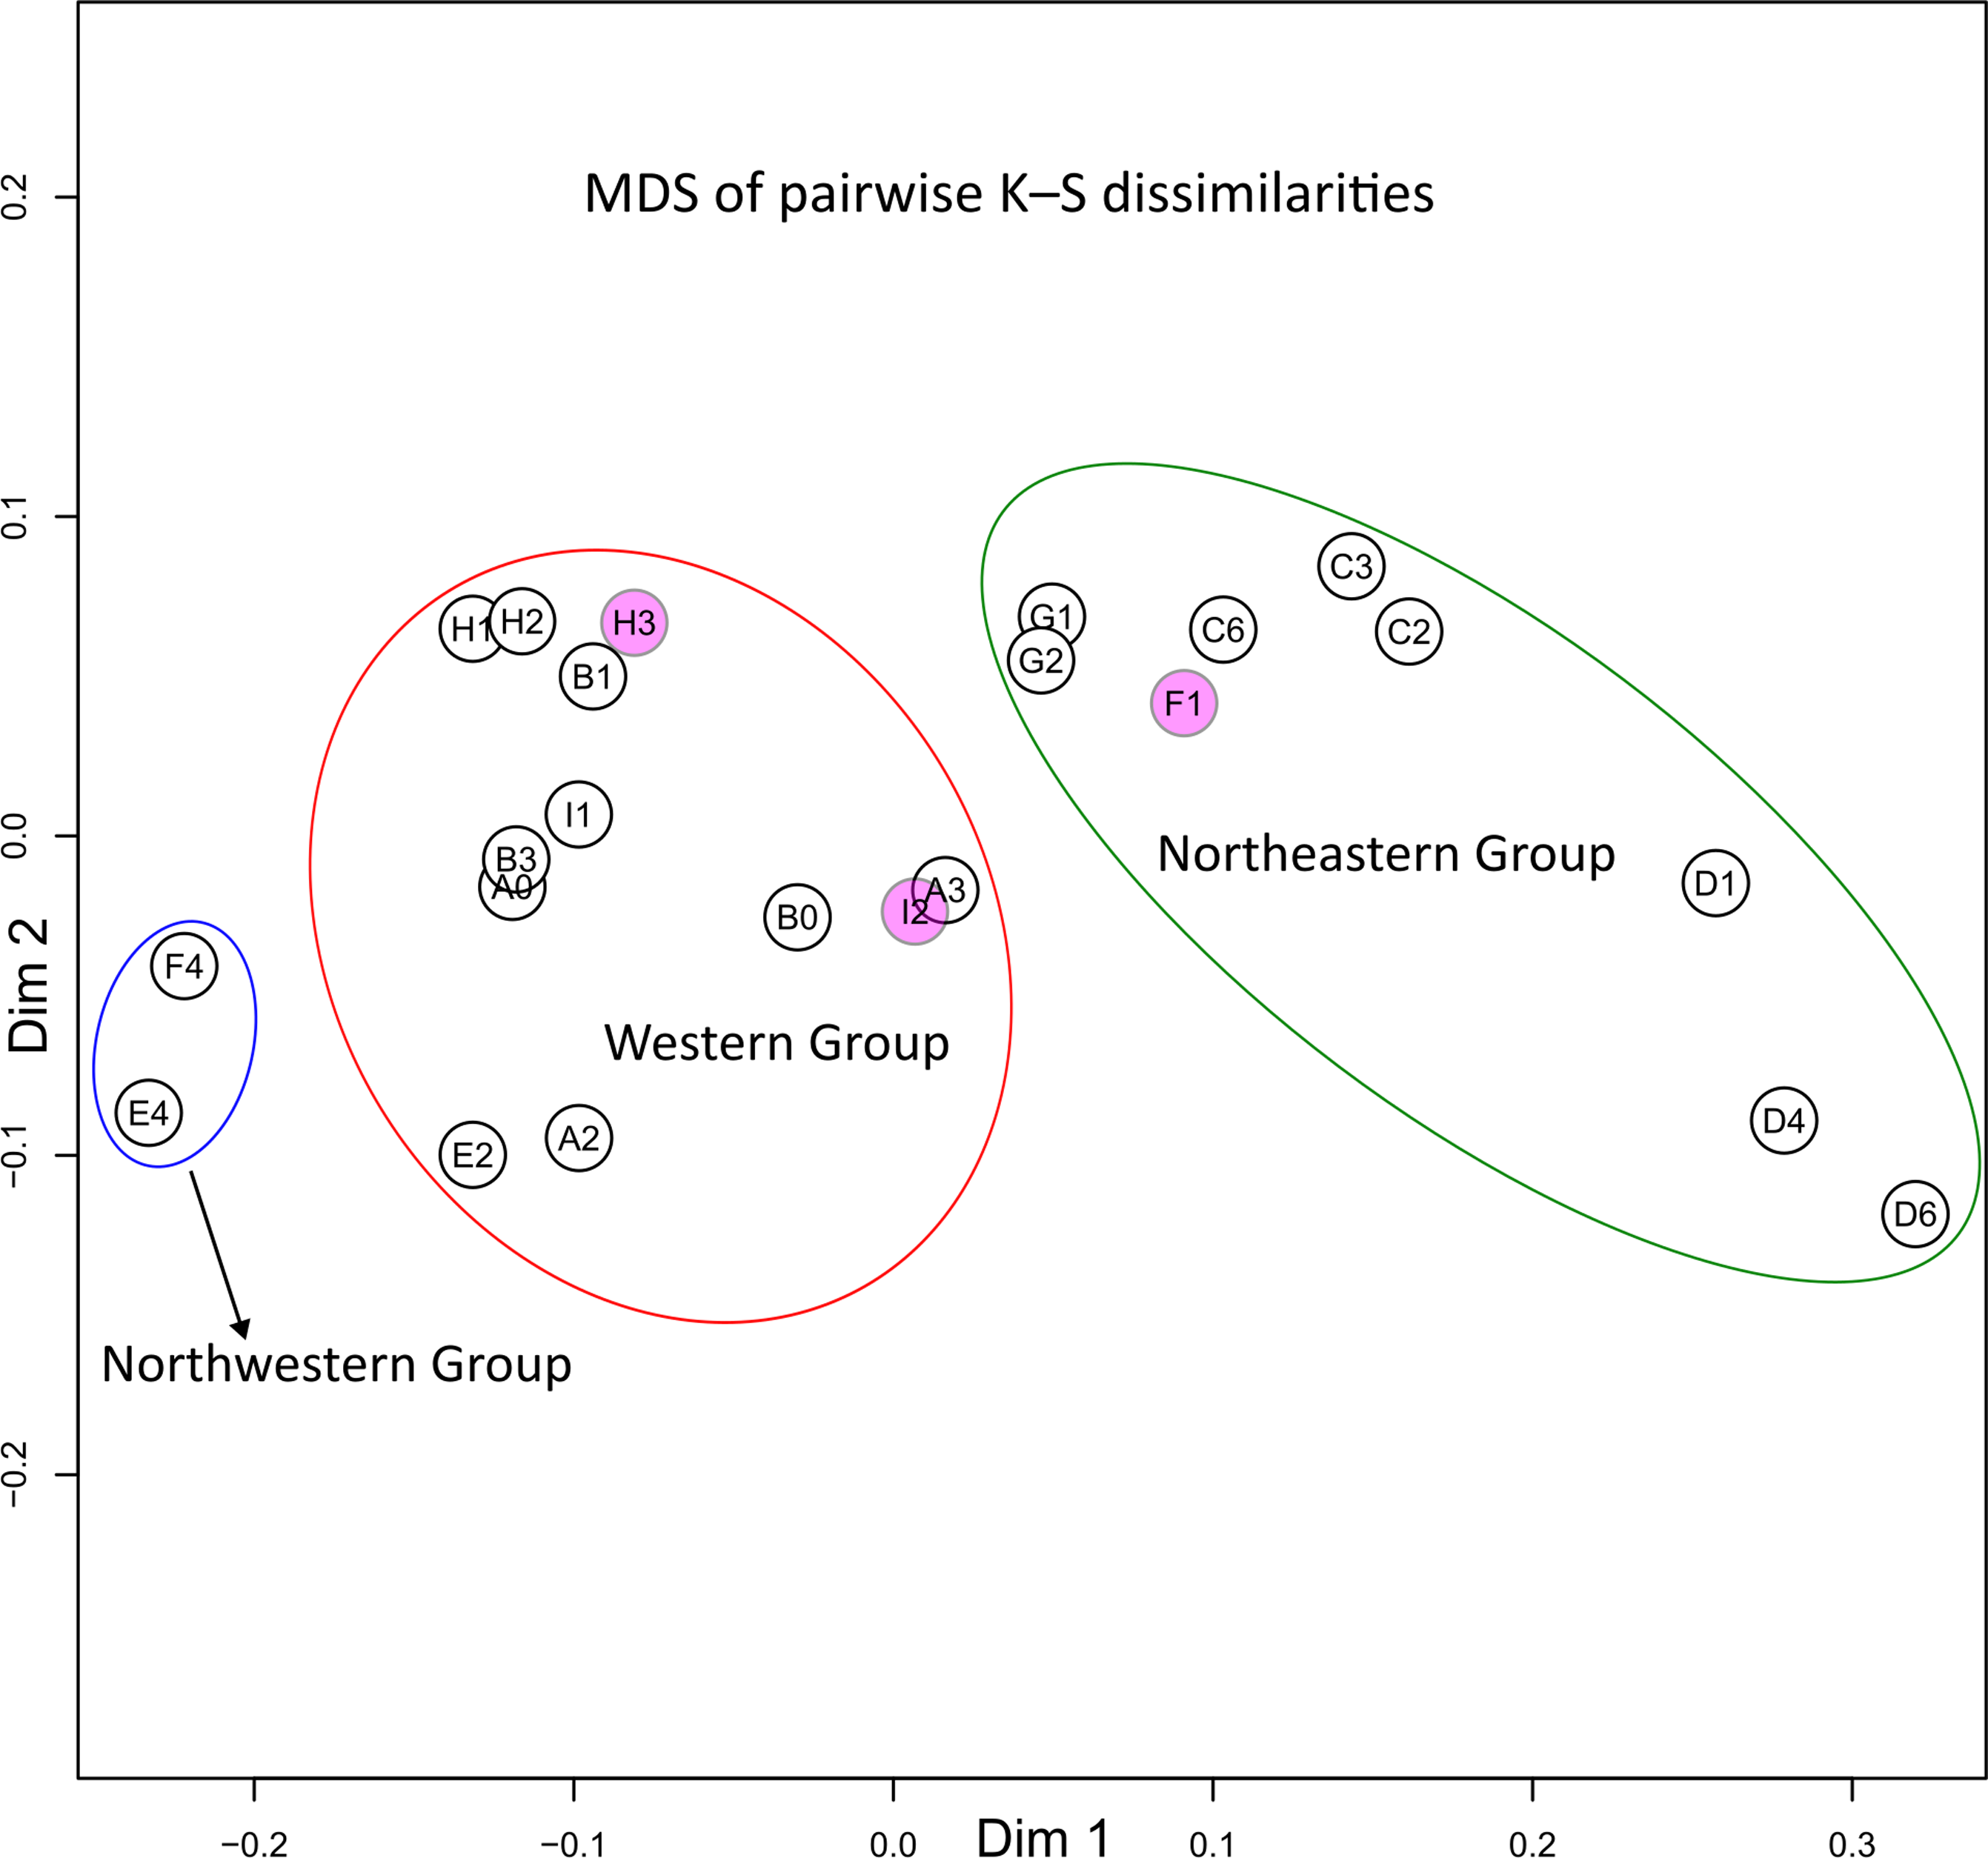
Figure 12. Long description
A scatter plot showing multidimensional scaling of pairwise K-S dissimilarities between zircon-age distributions. The plot features three main clusters: the Western Group, the Northeastern Group, and the Northwestern Group. The Western Group is enclosed in a red oval, the Northeastern Group in a green oval, and the Northwestern Group in a blue oval. The axes, labeled Dim 1 and Dim 2, represent dimensionless coordinates derived from multidimensional scaling. Several data points are labeled with identifiers such as H1, H2, H3, B1, I1, A3, I2, F1, C3, C2, C6, G1, G2, D1, D4, D6, F4, and E4. Samples F1, I2, and H3 are positioned differently from their dominant-component grouping when evaluated using full-distribution similarity. The plot illustrates statistical dissimilarity between cumulative zircon-age distributions, with the groups defined based on dominant zircon-age components.
The best-fit models using DZMix on sample C6 from well 7/3-1 indicate proportions of 49% (B1) and 51% (D6) from the two modelled sources based on cross-correlation coefficients (mean correlation 0.81). Comparable proportions are obtained using Kuiper V statistics (52% vs 48%) and K–S D statistics (67% vs 33%).
Twelve of the 3,055 (<0.4%) concordant ages are Permian and occur in five wells (17/4-1, 9/4-5, 7/3-1, 1/3-5 and 15/12-3), mostly close to the top of the Rotliegend Group. The three youngest grains, confined to well 17/4-1 (Northeastern group), yield a maximum depositional age of 276.8 ± 4.2 Ma (n = 3; Figures 2B and 5). The next youngest cluster, recorded in wells 9/4-5 (northeastern group) and 1/3-5 (western group), gives a maximum depositional age of 290.8 ± 3.1 Ma (n = 3). These results indicate an early Permian (Artinskian–Kungurian; late Cisuralian) maximum depositional age for the Rotliegend Group sandstone.
A minor Early Carboniferous population (338–345 Ma) is represented by three grains (<0.1%) from two wells (2/1-7 and 17/4-1 of the western and northeastern group). In addition, seven analyses from the western and northeastern groups yield younger ages (301–313 Ma).
6. Restored source-to-sink reconstruction
Compared to the present-day configuration (Figure 1), the restored reconstruction shows that the Rotliegend Group depocentres in the Norwegian North Sea occupied a narrower and more centrally located basin (Figure 13). In this configuration, the Fladen Ground Spur and Utsira High form a continuous western to northwestern basin margin separating the Rotliegend Group wells from adjacent Devonian Old Red Sandstone basins, which lie immediately west, northwest and south of the study area. The Sele High appears as an intra-basinal structural high in the northeast containing Devonian strata, whereas the Stavanger Platform defines a composite eastern basin margin against Proterozoic basement terranes in southwest Norway.
Palinspastically restored palaeogeographic map at 298.9 Ma (the Carboniferous-Permian boundary) with restored Rotliegend Group well locations and interpreted sediment transport pathways, after Powell et al. (Reference Powell, Escalona and Augustssonsubmitted). Present-day exposed terrane geology is after Bouysse (Reference Bouysse2014). Devonian basins outlines are reconstructed from wells penetrating Devonian strata and represent the likely source areas of Old Red Sandstone detritus. The green blocked arrow in the Southern Permian Basin is interpreted after Zieger et al. (Reference Zieger, Zieger-Hofmann, Gärtner and Linnemann2023) and this study. Proximal intra-basinal highs reconstructed after Glennie et al. (Reference Glennie, Higham, Stemmerik, Evans, Graham, Armour and Bathurst2003), Scisciani et al. (Reference Scisciani, Patruno, D’Intino and Esestime2021), Houghton et al. (Reference Houghton, Brackenridge, Neilson and Underhill2024), Bauck et al. (Reference Bauck, Faleide, Fossen and Gawthorpe2025), NOD (2025) and Urrez et al. (Reference Urrez, Escalona and Augustsson2025). The Archaean region marked with a question mark denotes a proposed offshore basement complex north of Scotland and west of the Shetland Islands, as suggested by previous studies (Fonneland et al. Reference Fonneland, Lien, Martinsen, Pedersen and Košler2004; Morton et al. Reference Morton, Hallsworth, Kunka, Laws, Payne, Walder, Ratcliffe and Zaitlin2010; Schmidt et al. Reference Schmidt, Morton, Nichols and Fanning2012; Holdsworth et al. Reference Holdsworth, Morton, Frei, Gerdes, Strachan, Dempsey, Warren and Whitham2019). For detailed Rotliegend Group well names, see Figure 1. FGS = Fladen Ground Spur, Gp = Group, HB = Hornelen Basin, MH = Mandal High, MNSH = Mid North Sea High, PBR = Patch Bank Ridge, RFH = Ringkøbing–Fyn High, SH = Sele High, SP = Stavanger Platform, UH = Utsira High.
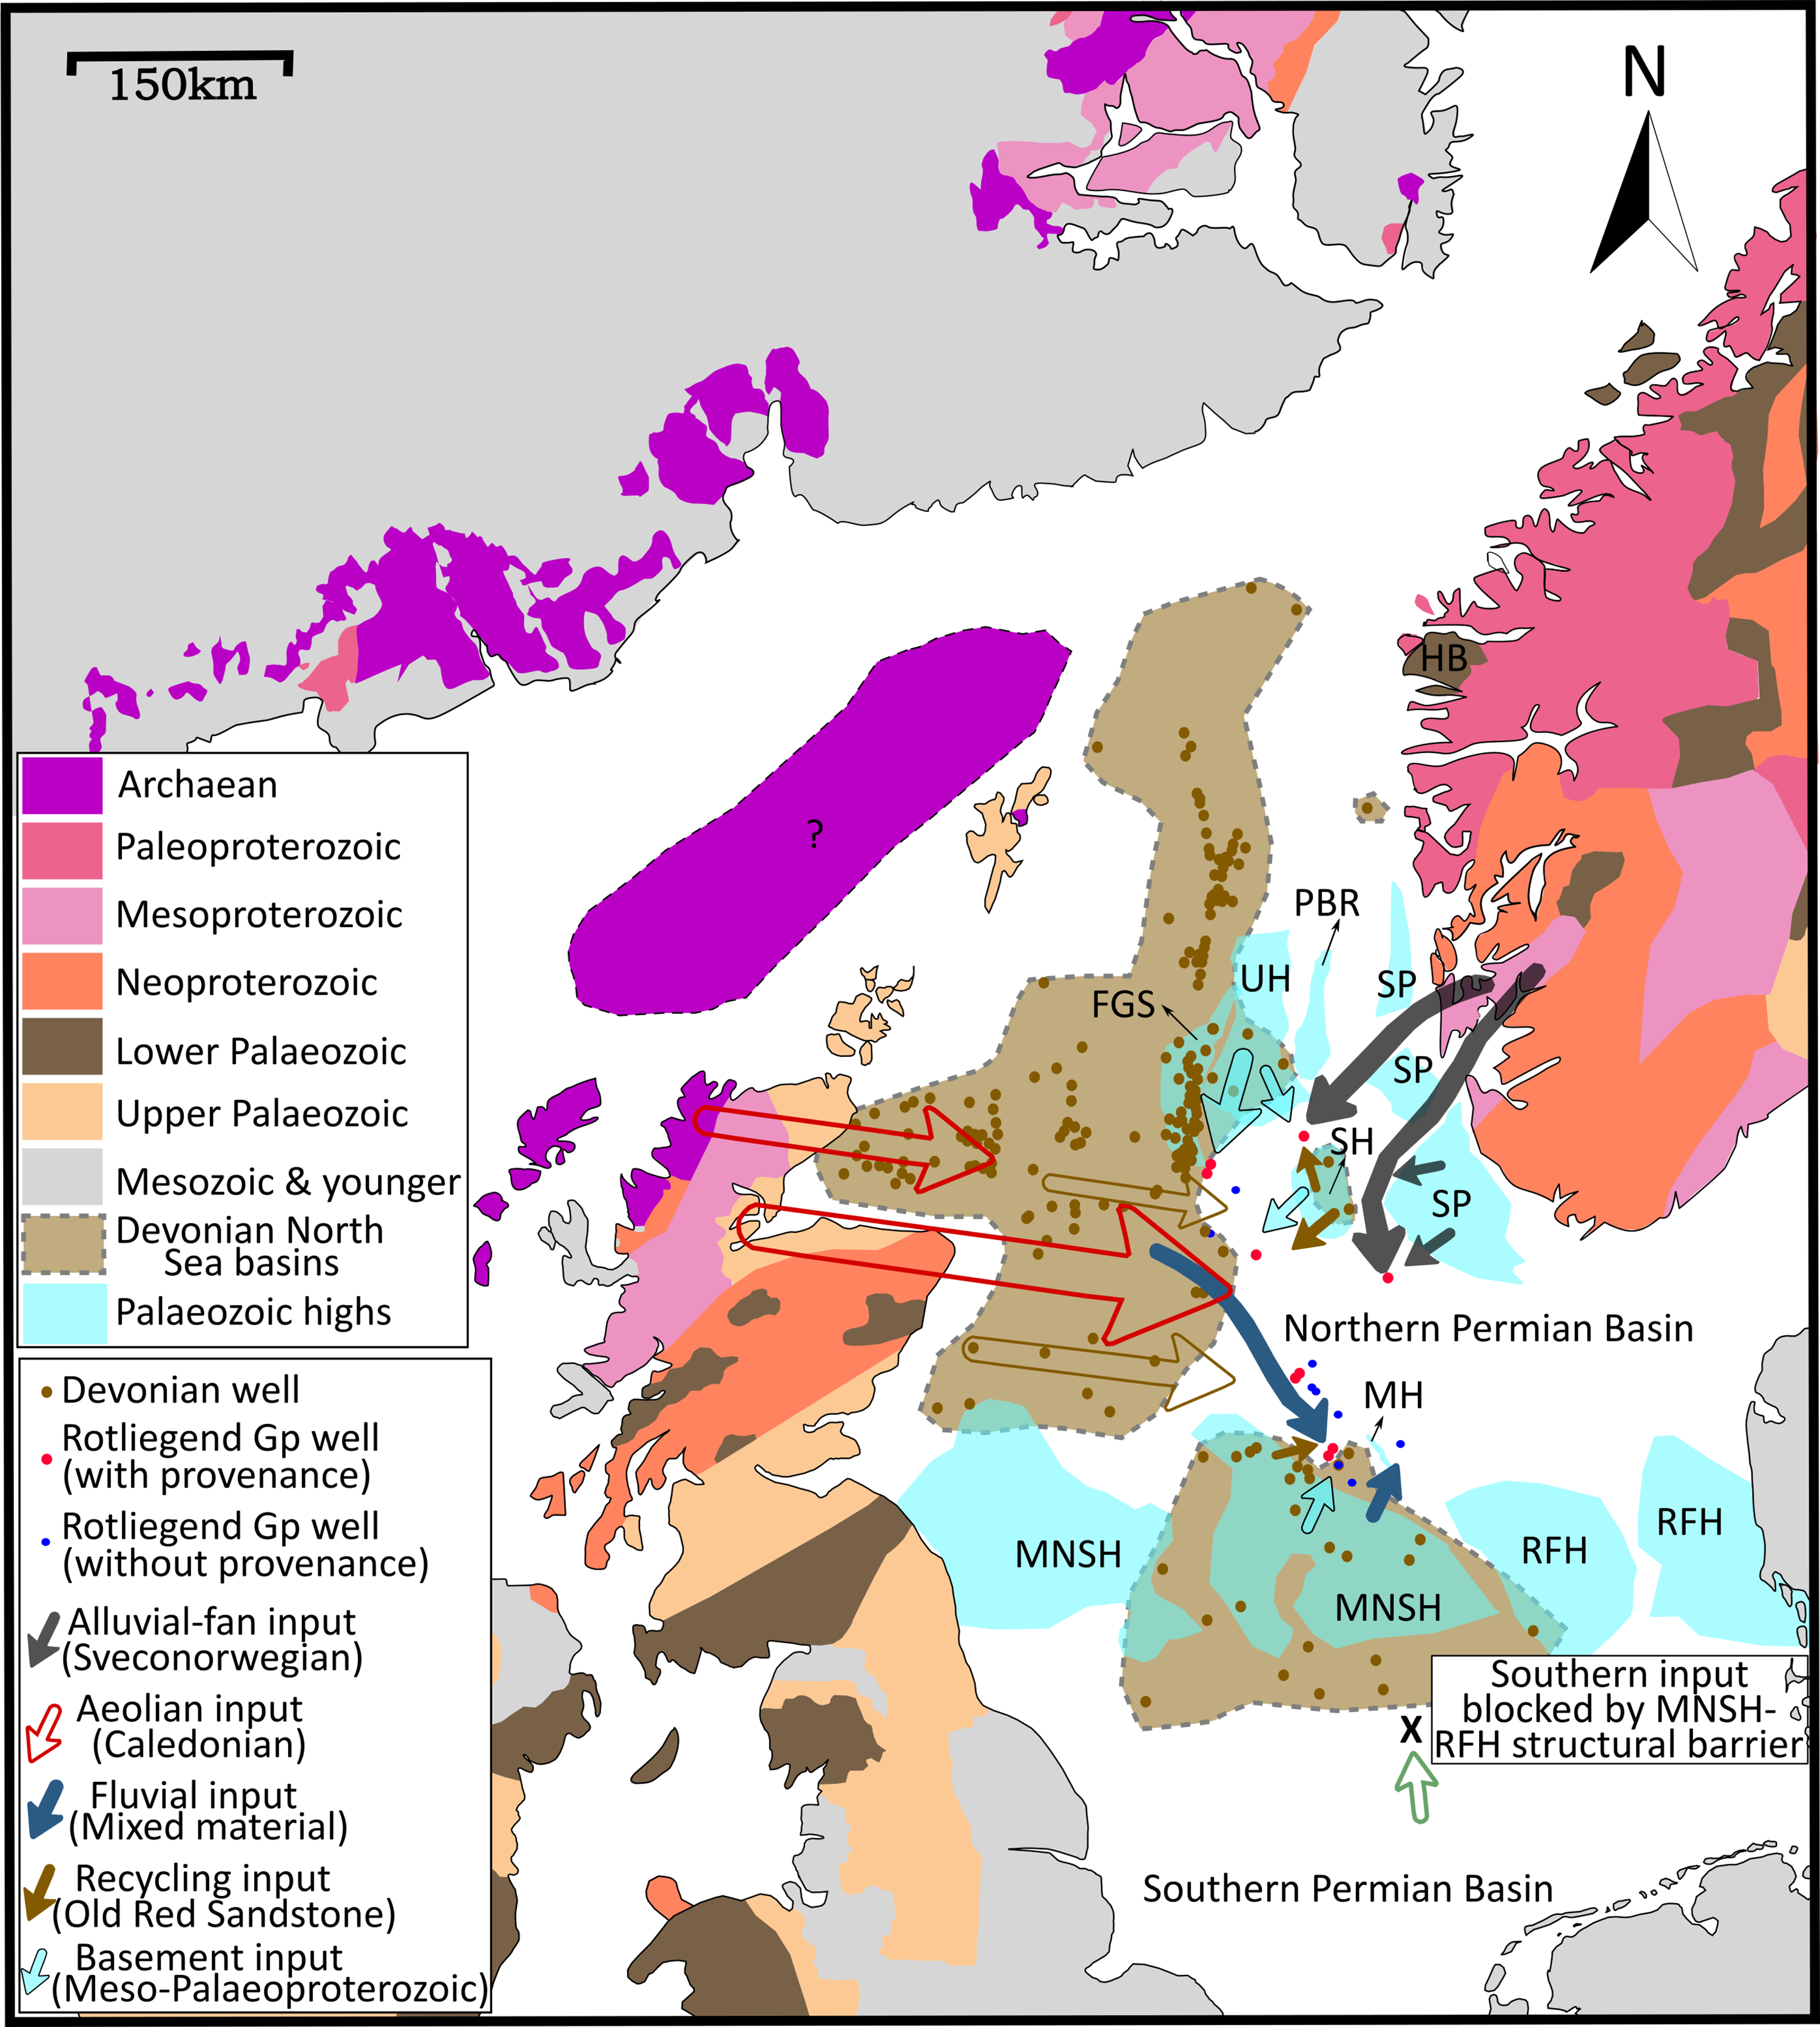
Figure 13. Long description
The map displays the study area marked by a black square, highlighting nine core-analysed wells in red and additional analysed wells in black from the Rotliegend Group. It includes onshore geological stratigraphy after Bouysse (2014) and indicates the locations of transects in Figures 3 and 4, along with zircon Groups. The positions and shapes of topographic highs and Permian basins are based on various sources including Glennie et al. (2003), Scisciani et al. (2021), Houghton et al. (2024), Bauck et al. (2025), NOD (2025), and Urrez et al. (2025). Key features include the Fladen Ground Spur (FGS), Mandal High (MH), Patch Bank Ridge (PBR), Sele High (SH), Stavanger Platform (SP), and Utsira High (UH). The map also shows sediment transport pathways and the likely source areas of Old Red Sandstone detritus. The Archaean region marked with a question mark denotes a proposed offshore basement complex north of Scotland and west of the Shetland Islands, as suggested by previous studies.
In the restored palaeogeography (Figure 13), Greenland is positioned closer to the Norwegian North Sea than in the present-day geometry, reflecting the pre-rifting configuration of Laurentia and Baltica (Powell et al. Reference Powell, Escalona and Augustssonsubmitted). The UK margin also lies closer to southwestern Norway, although the shift is smaller compared to Greenland. These restored positions illustrate that potential sediment source regions were more proximal to the Norwegian sector during early Permian deposition than their present-day distance.
7. Discussion
The intra-well variability and lithofacies control on zircon ages indicate that provenance patterns reflect a combination of depositional controls and genuine changes in sediment provenance (Figures 3–4, 11). The independence to grain size implies that the ages reflect true source variability rather than hydraulic sorting effects. However, grain size independence does not address zircon fertility bias, which operates at the source during sediment generation rather than during transport (e.g., Chew et al. Reference Chew, O’Sullivan, Caracciolo, Mark and Tyrrell2020). Accordingly, zircon-rich lithologies may be overrepresented, whereas zircon-poor lithologies may be underrepresented in detrital zircon datasets relative to their volumetric sediment contribution. Consequently, dominant age populations are interpreted as expressions of the zircon provenance signal rather than as direct measures of sediment mass contribution.
7.a. Sediment recycling within converging transport pathways
The composite Archaean–Palaeoproterozoic–Mesoproterozoic–Palaeozoic zircon signature in all Rotliegend Group samples is most consistently explained by recycling from Devonian Old Red Sandstone basins, which contain the same major age components (Schmidt et al. Reference Schmidt, Morton, Nichols and Fanning2012; Templeton, Reference Templeton2015; McKellar et al. Reference McKellar, Hartley, Morton and Frei2020; Strachan et al. Reference Strachan, Olierook and Kirkland2021). Exhumation of these basins, including those in western Norway, the Orcadian Basin, the Midland Valley, and offshore Devonian depocentres (Figure 13), during Late Devonian–Carboniferous tectonism (e.g., Séranne, Reference Séranne1992; Coward, Reference Coward1993; Watts et al. Reference Watts, Holdsworth, Sleight, Strachan and Smith2007; Fossen, Reference Fossen2010; Bauck et al. Reference Bauck, Faleide, Fossen and Gawthorpe2025; Urrez et al. Reference Urrez, Escalona and Augustsson2025) produced positive topography that enabled erosion and delivery of Old Red Sandstone-derived detritus. In the restored palaeogeography (Figure 13), these Old Red Sandstone basins lie immediately west, northwest and south of the study area, with uplifted intra-basinal remnants such as the Sele High also likely suppling recycled material, making Old Red Sandstone basins plausible contributors to all three zircon groups. Comparable mixed-age signatures in the Embla Field in the Norwegian North Sea (Lundmark et al. Reference Lundmark, Bue, Gabrielsen, Flaat, Strand and Ohm2014) and in the Outer Moray Firth in offshore Scotland (Morton et al. Reference Morton, Claoué-Long and Hallsworth2001) support a regionally extensive sourcing of Old Red Sandstone-derived sediment during Late Palaeozoic deposition.
The Mid North Sea High exerted a basin-wide dual control on basin architecture and sediment dispersal, acting as a persistent topographic divide that both restricted south-to-north drainage and that influenced regional wind circulation (Figures 13 and 14A). Deviating wind circulation is revealed by the east-southeast-directed winds in the Northern Permian Basin being in marked contrast to west-southwest-directed winds reconstructed for the Southern Permian Basin (Glennie et al. Reference Glennie, Higham, Stemmerik, Evans, Graham, Armour and Bathurst2003; Grötsch et al. Reference Grötsch, Sluijk, van Ojik, de Keijzerm, Graaf, Steenbrink and Grötsch2011). The drainage restriction is indicated by the near absence of Variscan-age zircon grains in our study, but a dominance of Variscan-derived zircon grains in the Southern Permian Basin (Zieger et al. Reference Zieger, Zieger-Hofmann, Gärtner and Linnemann2023). Seismic and stratigraphic data also indicate that the Mid North Sea High maintained a positive topographic expression during the Late Palaeozoic (Glennie & Underhill, Reference Glennie, Underhill and Glennie1998; Browning-Stamp et al. Reference Browning-Stamp, Caldarelli, Heard, Ryan and Hendry2023; Urrez et al. Reference Urrez, Escalona and Augustsson2025). The Ringkøbing-Fyn High is assumed to have had a comparable sediment-barrier function during the Early Triassic (Olivarius et al. Reference Olivarius, Friis, Kokfelt and Wilson2015). Furthermore, Variscan zircon grains are absent in Triassic sandstone <100 km west of the study area in the British sector of the Central North Sea (Greig et al. Reference Greig, Morton, Frei and Hartley2022). Thus, both the Mid North Sea High and the Ringkøbing-Fyn High may have been topographically positive and regionally influential during both Permian and Triassic times.
Sedimentological evolution of the Rotliegend Group in the Norwegian North Sea incorporating facies, provenance and palaeocurrent directions. A) Lower siliciclastic sequence deposited under hyper-arid conditions, dominated by compound draas in an aeolian dune field with limited interdune preservation and alluvial fans. B) Upper siliciclastic sequence formed under semi-arid conditions, with increased interdune, ephemeral fluvial and playa deposits and localized alluvial fans. The two stages are separated by a major unconformity (supersurface = SS), representing a basin-wide shift in wetness. MNSH = Mid North Sea High, RFH = Ringkøbing Fyn High.

Figure 14. Long description
The image presents a cross-sectional diagram illustrating the sedimentological evolution of the Rotliegend Group in the Norwegian North Sea. It features two distinct siliciclastic sequences. The lower sequence, depicted in part A, was deposited under hyper-arid conditions and is dominated by compound draas in an aeolian dune field with limited interdune preservation and alluvial fans. The upper sequence, shown in part B, formed under semi-arid conditions and includes increased interdune, ephemeral fluvial, and playa deposits along with localized alluvial fans. The two stages are separated by a major unconformity, representing a basin-wide shift in wetness. Key features include the Mid North Sea High and the Ringkøbing Fyn High, which influenced sediment dispersal and basin architecture.
The western group records one of the two major catchment end members. The combined occurrence of fluvial and aeolian facies indicates that these depositional systems accessed similar catchment areas, likely due to shared transport pathways or local mixing between aeolian and fluvial processes. Palaeocurrent and foreset-dip data indicate east- to southeast-directed sand transport, placing upwind and upstream sources in present-day Scotland, Shetland, and neighbouring Caledonian source regions, with East Greenland also possible according to our plate restoration (Figure 13). Such pathways are consistent with the dominance of Caledonian basement signatures in the Old Red Sandstone (Schmidt et al. Reference Schmidt, Morton, Nichols and Fanning2012; McKellar et al. Reference McKellar, Hartley, Morton and Frei2020). Although Old Red Sandstone recycling contributed to the western signal, the consistently strong and sharply defined Caledonian component suggests that direct Caledonian basement erosion supplied the dominant zircon provenance signal, with Old Red Sandstone-derived zircon also present. Palaeogeographic reconstructions indicate that these terranes remained exposed during Devonian–Carboniferous time, supporting their role as persistent long-distance sediment sources (e.g., Séranne, Reference Séranne1992; Coward, Reference Coward1993; Watts et al. Reference Watts, Holdsworth, Sleight, Strachan and Smith2007; Fossen, Reference Fossen2010; Bauck et al. Reference Bauck, Faleide, Fossen and Gawthorpe2025; Urrez et al. Reference Urrez, Escalona and Augustsson2025).
The northeastern group represents the other major catchment end member and is dominated by short-range sediment transport pathways from the Sveconorwegian basement. Recycling of older detritus appears modest in this end member, as the margin well 9/4-5 yields an almost purely Sveconorwegian spectrum with only minor Caledonian or older components, consistent with a largely unmixed, proximal basement source. Wells 9/4-5 and 17/4-1 contain thick alluvial-fan successions with palaeocurrents directed toward the south, placing their provenance in the uplifted southwestern Norwegian mainland and the adjacent Stavanger Platform. This interpretation is strongly supported by the zircon spectra, which show pronounced Sveconorwegian peaks corresponding to the Arendal (1120–1150 Ma), Agder (1000–1065 Ma) and Dalane (900–970 Ma) metamorphic domains (Bingen et al. Reference Bingen, Viola, Möller, Vander Auwera, Laurent and Yi2021), and by the scarcity of Caledonian and Gothian ages. In the restored palaeogeography (Figure 13), these basement terranes form the immediate eastern margin of the Permian depocentres, consistent with short transport distances. Petrographic observations from proximal facies, angular grains, abundant feldspar and lithic fragments, and common mica, further support derivation from nearby crystalline highs. Minor Caledonian and Gothian components in well 17/4-1 likely reflect localized reworking of Devonian strata exhumed during Late Devonian–Carboniferous uplift in the Sele High (Urrez et al. Reference Urrez, Escalona and Augustsson2025), but the strong dominance of Sveconorwegian ages confirms that the eastern source area exerted a dominant control on the detrital zircon signature in this sector of the basin. The small population of Permian zircon grains in several wells corresponds to Late Carboniferous–Early Permian rift-related magmatism across the Northern Permian Basin (Stemmerik et al. Reference Stemmerik, Ineson and Mitchell2000; Heeremans & Faleide, Reference Heeremans and Faleide2004). The distribution of Permian zircon grains among wells throughout the working area indicates minor and regionally scattered volcanic zircon input during Rotliegend Group deposition. Given the proximity of the eastern basin margin to the Oslo Rift–Skagerrak magmatic province, this region provides a geographically consistent source for part of the signal, whereas volcanic centres in the Central and Horn grabens may have contributed more distally.
The northwestern group defines a proximal hybrid basement-fed provenance signal with its dominance of Palaeoproterozoic–Mesoproterozoic zircon ages, subordinate Sveconorwegian and only minor Caledonian components. In the restored palaeogeography (Figure 13), wells 15/9-9, 15/12-3 and 2/7-31 lie adjacent to basement highs in the northern margin (e.g., the Utsira High, Fladen Ground Spur, Patch Bank Ridge) and in the southern margin (Mid North Sea High), which expose mixed Fennoscandian, Gothian and early Sveconorwegian crustal blocks (Lundmark et al. Reference Lundmark, Bue, Gabrielsen, Flaat, Strand and Ohm2014; Olivarius et al. Reference Olivarius, Friis, Kokfelt and Wilson2015). Petrographic evidence from monomict breccia and poorly sorted conglomerate supports derivation from local crystalline sources with short transport distances. This hybrid signature potentially reflects the composite bedrock of these highs, where erosion of multiple Proterozoic terranes would be expected to generate broad Mesoproterozoic–Palaeoproterozoic age spectra, matching the mixture observed here and the basement signatures documented in the Ringkøbing–Fyn High (Olivarius et al. Reference Olivarius, Friis, Kokfelt and Wilson2015). The mixed zircon spectra and immature textures therefore indicate predominantly proximal sourcing from uplifted basement highs, with subordinate recycled Old Red Sandstone material represented in the detrital zircon record.
The central part of the basin records the confluence of the contrasting transport pathways. The mixed zircon origin in wells 7/3-1 and 17/4-1 reflects the downstream intersection of long-distance, aeolian transport from the west–northwest with short-range alluvial-fan input from the eastern margin. The presence of Sveconorwegian-age zircon within fine-grained, predominantly aeolian strata in well 7/3-1 indicates that ephemeral rivers and flash floods episodically delivered eastern detritus into the central dune-interdune system, enabling mixing even in dominantly wind-driven environments. In the restored palaeogeography (Figure 13), this area lies at the downstream intersection of these two transport pathways, and its intermediate zircon spectra and textural attributes are consistent with reworking and recombination of sediment from both source regions.
The distinct western, northeastern and northwestern provenance domains indicate that sediment transport pathways were partly partitioned at basin scale despite local sediment integration in the basin interior (Figures 11 and 13). This partitioning reflects the spatial configuration of source areas, basin margin topography and prevailing wind regime, which restricted complete homogenization of detrital signals. Mixing nevertheless occurred locally and through time. Three mechanisms can be recognized. (i) Intra-well alternation in provenance affinity within comparable facies (e.g., H3, I2, E2 of wells 2/7-31, 2/7-29, and 15/12-3) reflects temporal shifts in source dominance consistent with stratigraphic superposition. (ii) Lateral juxtaposition of hydrologically distinct transport systems is evidenced by the contrasting provenance signatures in stratigraphically adjacent deposits (e.g., F1 and F4 in well 15/9-9). (iii) Integration of sediment in the basin interior is indicated by intermediate zircon-age distributions that reflect interaction between long-distance aeolian transport and short-range alluvial input (e.g., samples from wells 7/3-1 and 17/4-1).
The samples with dissimilarities to their proper provenance groups as indicated by the K–S analysis support the interpretation of mixing, because transitional samples tend to occupy positions between compositional end members when evaluated using full-distribution similarity (Lipp and Vermeesch, Reference Lipp and Vermeesch2023), whereas dominant age peaks preserve first-order source affinity. Furthermore, a detrital zircon study of the Bengal Fan demonstrates that K–S dissimilarity configurations can reflect varying proportional contributions of two principal parent signals rather than discrete source switching (Blum et al. Reference Blum, Rogers, Gleason, Najman, Cruz and Fox2018). Thus, mixing in the Rotliegend Group is interpreted as proportional modification of end members rather than complete signal homogenization. Converging transport systems therefore allowed long-distance and short-range detrital zircon input to interact locally, whereas first-order provenance contrasts remained preserved at basin scale due to sustained pathway partitioning. Consistent with this interpretation, the mixing of a western and a northeastern source as indicated by the DZMix analysis supports interaction between different provenance domains in the basin interior. However, the tested samples represent candidate source distributions rather than strictly defined end members, and the calculated proportions should therefore be interpreted as indicative rather than exact mixing ratios.
The convergence of aeolian, fluvial and alluvial-fan transport systems from multiple basin margins, combined with the Mid North Sea High acting as a sediment barrier, suggests that sediment was transported toward the basin interior rather than exported to an external drainage system. Given the arid depositional setting of the Rotliegend Group, this configuration is compatible with an internally drained, endorheic basin system, similar to interpretations proposed for the Southern Permian Basin (e.g., De Jong et al. Reference De Jong, Donselaar, Boerboom, Van Toorenenburg, Weltje and Van Borren2020). This interpretation is consistent with sediment accumulation and mixing within a closed continental depocentre.
7.b. Basin evolution and palaeogeographic reconstruction
The Rotliegend Group in the Norwegian sector records two distinct depositional phases, a hyper-arid aeolian-dominated phase followed by a semi-arid phase with increased hydrological connectivity (Figures 14A, B).
7.b.1. Early Permian hyper-arid erg with localized fluvial input
The earliest Permian record in the Norwegian sector is characterized by extensive aeolian sedimentation and a near absence of persistent water-lain deposits, confirming that sedimentation took place under strongly arid conditions. Thick, multistorey cross-bedded dune systems with only thin and locally deformed interdune intervals (Figures 14A and 15A) indicate the development of a laterally extensive erg. This facies assemblage closely resembles the aeolian draas and intermittently flooded interdunes documented in the Auk field of the British sector (Heward, Reference Heward, Miall and Tyler1991), supporting a basin-wide hyper-arid regime during the earliest Rotliegend Group deposition. Nevertheless, the thickness, lateral confinement, palaeocurrent roughly towards the south, and composite provenance signature indicate that the fluvial system represented by well 2/7-31 in the southwest represents a sustained drainage pathway, at least locally expressed near well 2/7-31, capable of continuously delivering sediment into the erg system. Its mixed provenance indicates that sediment was transported from various sources, in contrast to the locally derived aeolian sand that dominated elsewhere in the basin. The interpretation of a sustained drainage axis is also supported by its stratigraphic relationship with the surrounding aeolian deposits. The fluvial succession incises and reworks nearby dune sand, suggesting that channel activity persisted long enough to cut repeatedly into the adjacent erg and that flow energy exceeded that of ephemeral runoff. The regional context provides a possible analogue where the overall palaeoslope inferred from palaeocurrents is compatible with the southward drainage direction reconstructed for Carboniferous systems in the wider North Sea and onshore UK region (e.g., Drewery et al. Reference Drewery, Cliff and Leeder1987; Leeder, Reference Leeder1988; Morton et al. Reference Morton, Chisholm and Frei2024, Reference Morton, Chisholm and Frei2026), although our data only constrain the Permian expression of such pathways. In contrast, the fluvial deposits in well 3/5-1 represent a local, short-lived system. Their volcanic-rich clasts, palaeocurrents toward the northeast, and interbedding of aeolian and ephemeral-flow facies indicate short transport distances from nearby volcanic or basement highs. These characteristics clearly distinguish them from the sustained drainage feeding well 2/7-31.
Palinspastically restored palaeogeography of the upper Rotliegend Group. A) The Early Permian hyper-arid phase, B) The Early Permian semi-arid phase. FGS = Fladen Ground Spur, MH = Mandal High, MNSH = Mid North Sea, SH = Sele High, SP = Stavanger Platform High, UH = Utsira High.
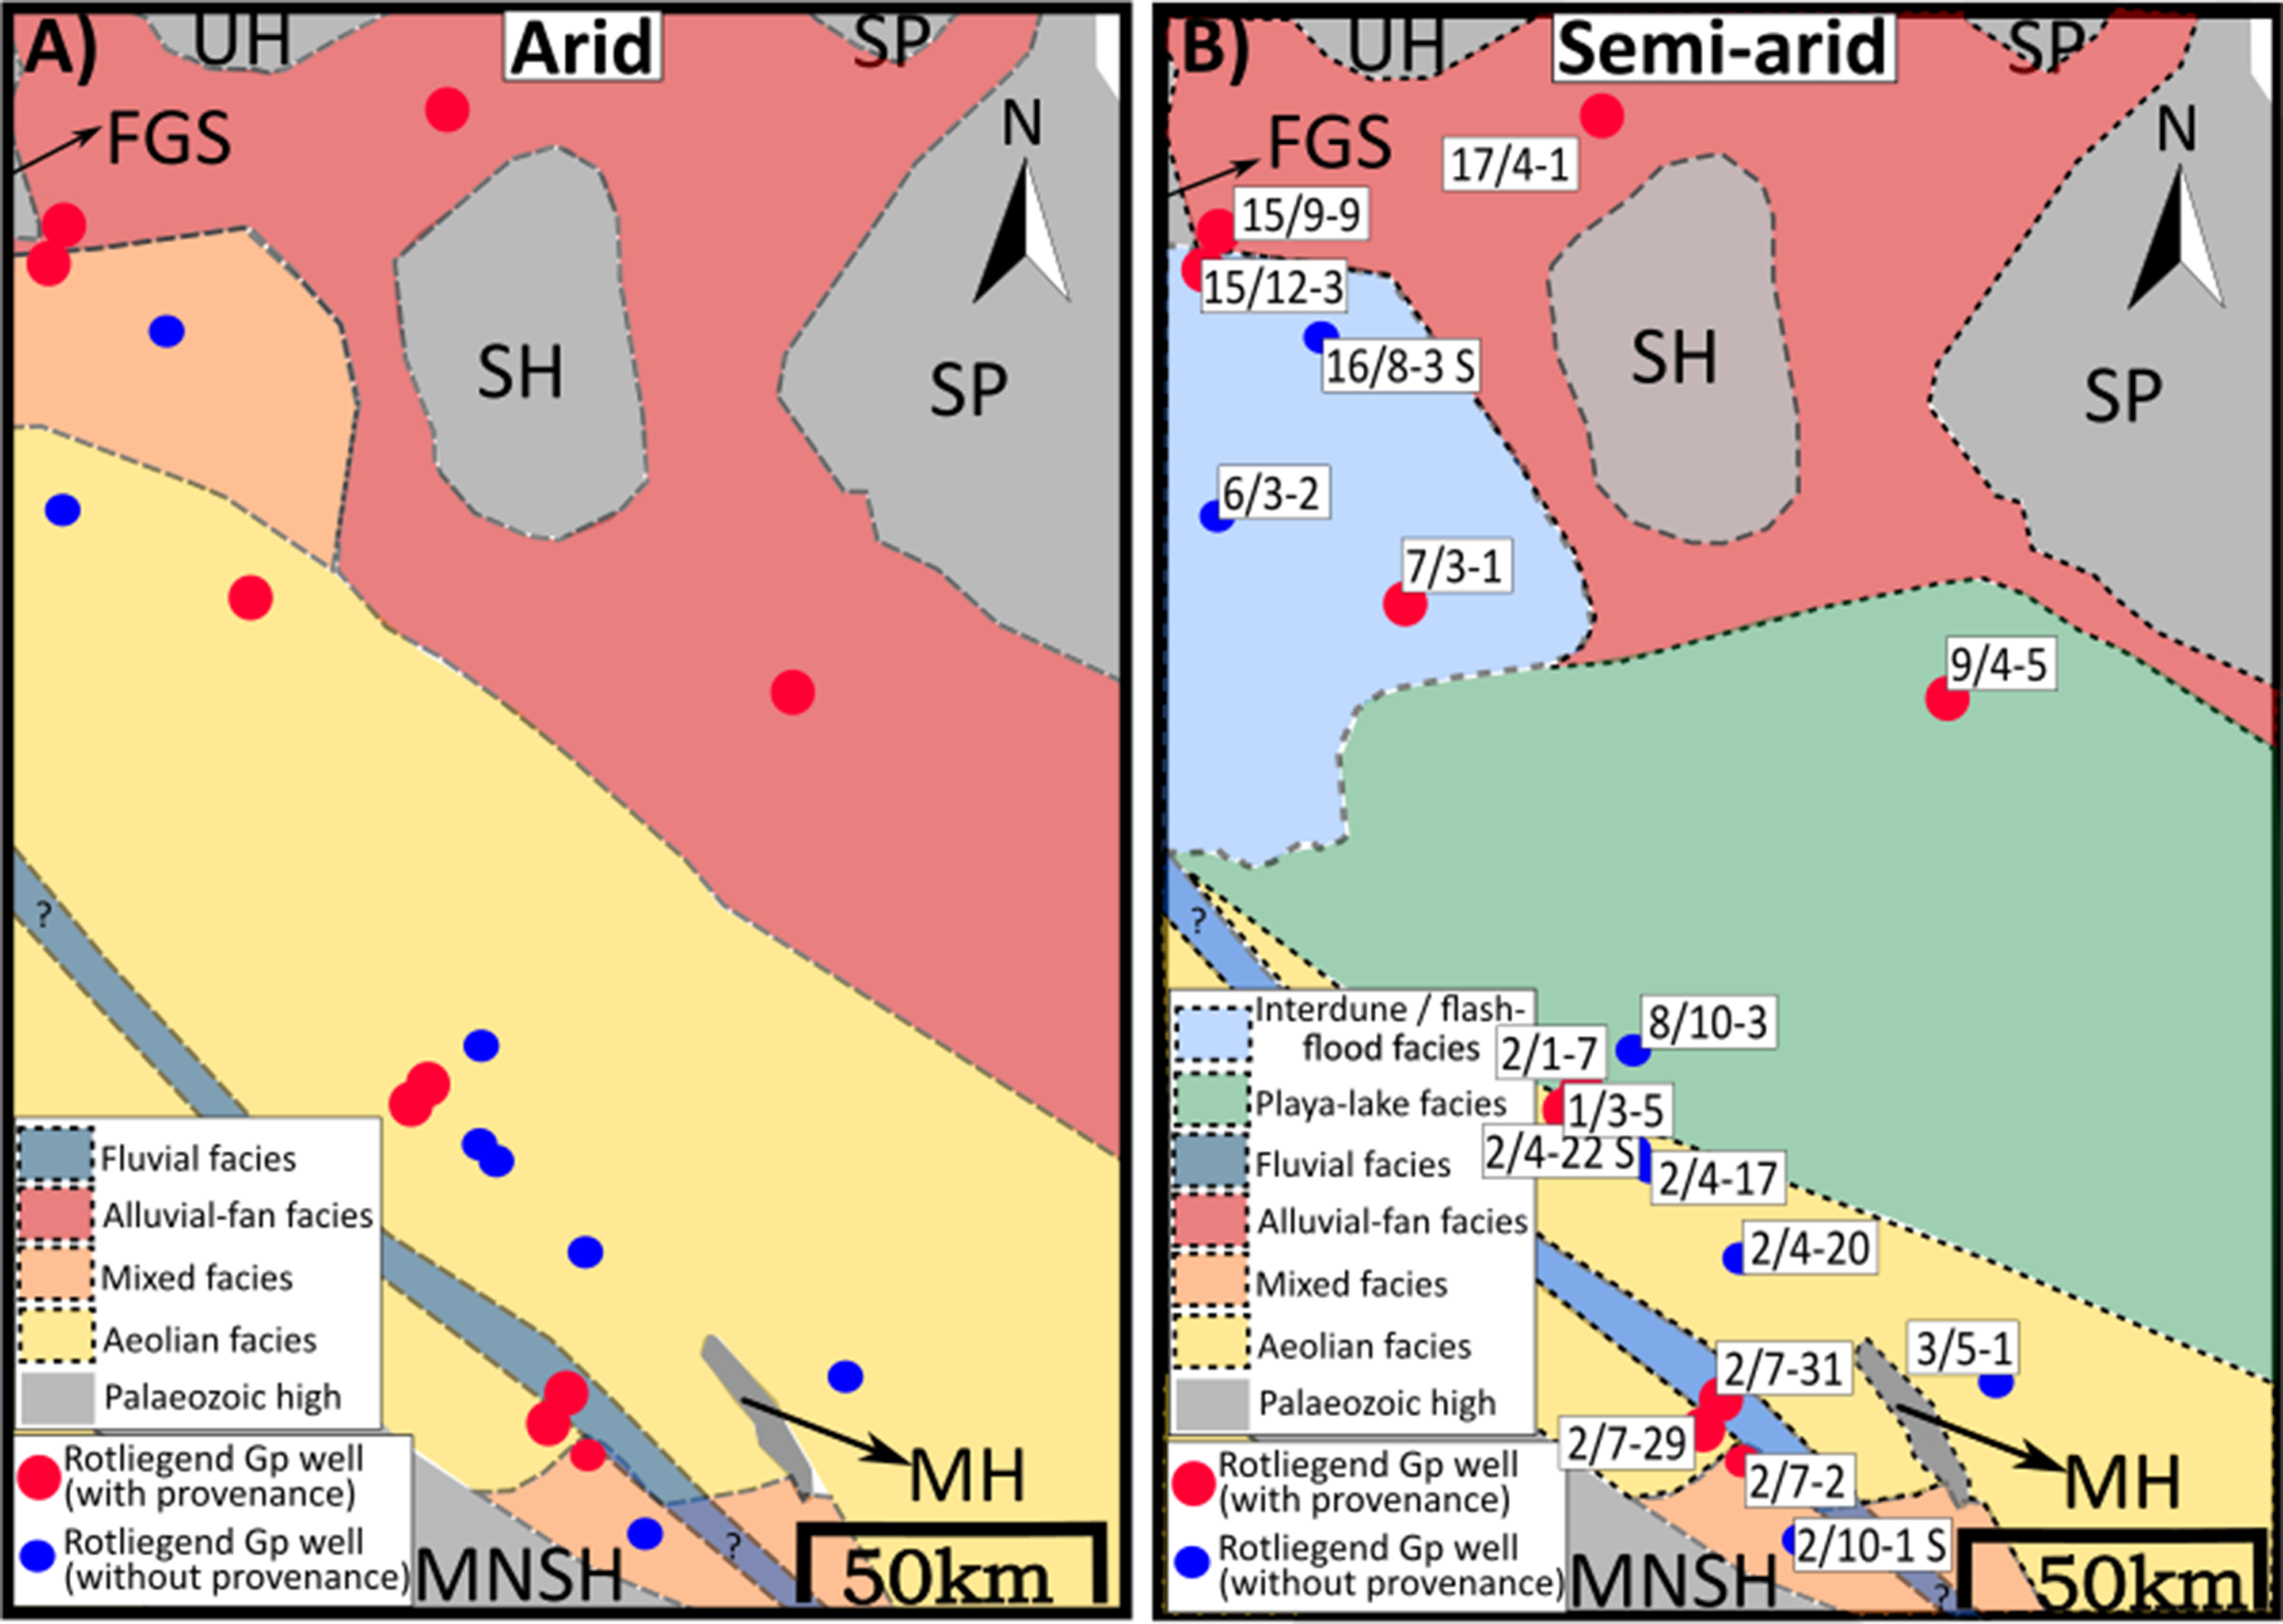
Figure 15. Long description
The map illustrates the palaeogeography of the upper Rotliegend Group during the Early Permian hyper-arid phase. It includes labeled regions such as the Fladen Ground Spur, Mandal High, Mid North Sea, Sele High, Stavanger Platform High, and Utsira High. The map uses different colors to represent various facies, including fluvial, alluvial-fan, mixed, aeolian, and palaeozoic high. Red and blue dots indicate Rotliegend Group wells with and without provenance, respectively.
The coexistence of widespread aeolian sedimentation with both a long-lived drainage axis and smaller, locally sourced runoff highlights the dual nature of sediment transport under hyper-arid conditions. Basin-wide aeolian processes dominated the landscape, whereas isolated fluvial pathways, especially the sustained drainage pathway feeding well 2/7-31, delivered recycled and compositionally diverse sediment into an otherwise extremely dry environment. Comparable relationships between erg systems and externally fed rivers occur in modern hyper-arid settings such as the Orange River corridor in the Namib Desert (Jacob, Reference Jacob2005).
The timing of the hyper-arid phase coincides with widespread continental desiccation across equatorial Pangaea (Parrish, Reference Parrish1993; Torsvik and Cocks, Reference Torsvik and Cocks2016) and overlaps with Late Carboniferous–Early Permian volcanism in the Danish North Sea and Oslo Rift (Stemmerik et al. Reference Stemmerik, Ineson and Mitchell2000; Larsen et al. Reference Larsen, Olaussen, Sundvoll, Heeremans, Ramberg, Bryhni, Nottvedt and Rangnes2008).
7.b.2. Early Permian semi-arid erg with increased hydrological connectivity
Following the hyper-arid erg stage, the Rotliegend Group basin evolved toward a semi-arid regime marked by increased hydrological connectivity and more frequent reworking of aeolian deposits (Figure 14B). This transition is expressed by the upward shift from thick, well-sorted dune sandstone into more heterogeneous intervals with interdune, flash-flood, and lacustrine/playa-lake facies (Figures 3 and 4). In addition, the vertical expansion of these wetter facies indicates that ephemeral water bodies became more persistent and more spatially extensive than during the preceding hyper-arid phase.
A key stratigraphic expression of the shift in aridity is the development of a regionally correlatable fine-grained interval in the central part of the basin. The micaceous claystone in wells 8/10-3 and 9/4-5 with thin sandstone interbeds and the locally freshwater-related trace fossils and algae indicate periodic flooding and temporary ponding in shallow lacustrine or playa-lake settings. The thinning and lateral transition into aeolian-dominated successions reflects reduced accommodation and the restriction of standing water to topographic lows. Within the context of a widespread erg system, the correlatable surface that bounds this interval is interpreted as a super-bounding surface sensu Havholm and Kocurek (Reference Havholm and Kocurek1994), based on its regional correlatability and its position at the base of a basin-wide wetting-upward succession (Figure 2B; see also Mountney and Howell, 2000).
The confinement of dune sets to topographic highs indicates an environmental reorganization from a dry-erg system to a semi-arid, water-influenced landscape. Similar upward successions from dune-dominated to interdune/playa-lake dominated facies are documented elsewhere in the Northern and Southern Permian basins (e.g., Glennie and Buller, Reference Glennie and Buller1983; Heward, Reference Heward, Miall and Tyler1991; Howell and Mountney, Reference Howell and Mountney1997), indicating that the hydrological shift was basin-wide rather than local.
The most likely extrinsic driver for the hydrological shift is linked to an increase in regional humidity and groundwater availability associated with the southward advance of the Boreal Sea in the north (Glennie et al. Reference Glennie, Higham, Stemmerik, Evans, Graham, Armour and Bathurst2003). A rising water table would have enhanced the frequency of interdune flooding, promoted playa-lake development and increased fine-grained preservation. However, the absence of palaeosol and root traces in the studied cores indicates that vegetation remained sparse and conditions fundamentally arid. The semi-arid phase therefore represents a hydrological overprint on an arid system, rather than a transition to truly humid conditions.
The deformation structures and sharp facies transitions at the top of the Rotliegend Group mark the onset of the Zechstein-sea transgression. Soft-sediment deformation and liquefaction features document rapid infiltration of marine water into unconsolidated aeolian sand, a process also observed in coeval units in northeast England and northeast Scotland (Glennie and Buller, Reference Glennie and Buller1983; Steele, Reference Steele1983). These features signal the final shift from continental semi-arid conditions to marine flooding of the basin.
7.c. Sediment provenance and depositional controls on reservoir quality
The reservoir quality of the Rotliegend Group shows a statistical association with provenance, expressed as a correlation between detrital zircon-age spectra and porosity (Figure 16; Urrez et al. Reference Urrez, Cedeno, Escalona, Augustsson and Blanconein review). Depositional areas sourced to a large degree from Caledonian terranes have anomalously high porosities, whereas intervals dominated by Sveconorwegian-derived detrital zircon-age populations have low porosities (Figure 16). These relationships partly reflect differences in depositional facies distribution as well as contrasts in sediment composition derived from the respective source areas. Porosity is controlled by primary framework grain properties and subsequent diagenetic modification. Provenance therefore influences reservoir quality indirectly via the initial sediment composition, which in turn governs its susceptibility to compaction and compositional modification during diagenesis. The present-day porosity and permeability reflect the cumulative effect of these processes.
Relationship between the proportion of Caledonian (A) and Sveconorwegian (B) zircon grains from this study and the mean porosity of the Rotliegend Group from well-log analysis for the eight wells with porosity data among the nine wells analysed for zircon ages (from Reference Urrez, Cedeno, Escalona, Augustsson and BlanconeUrrez et al. in review). Horizontal error bars represent the P10–P90 porosity range for each well. Well 15/12-3 has not been used to build the trend function.
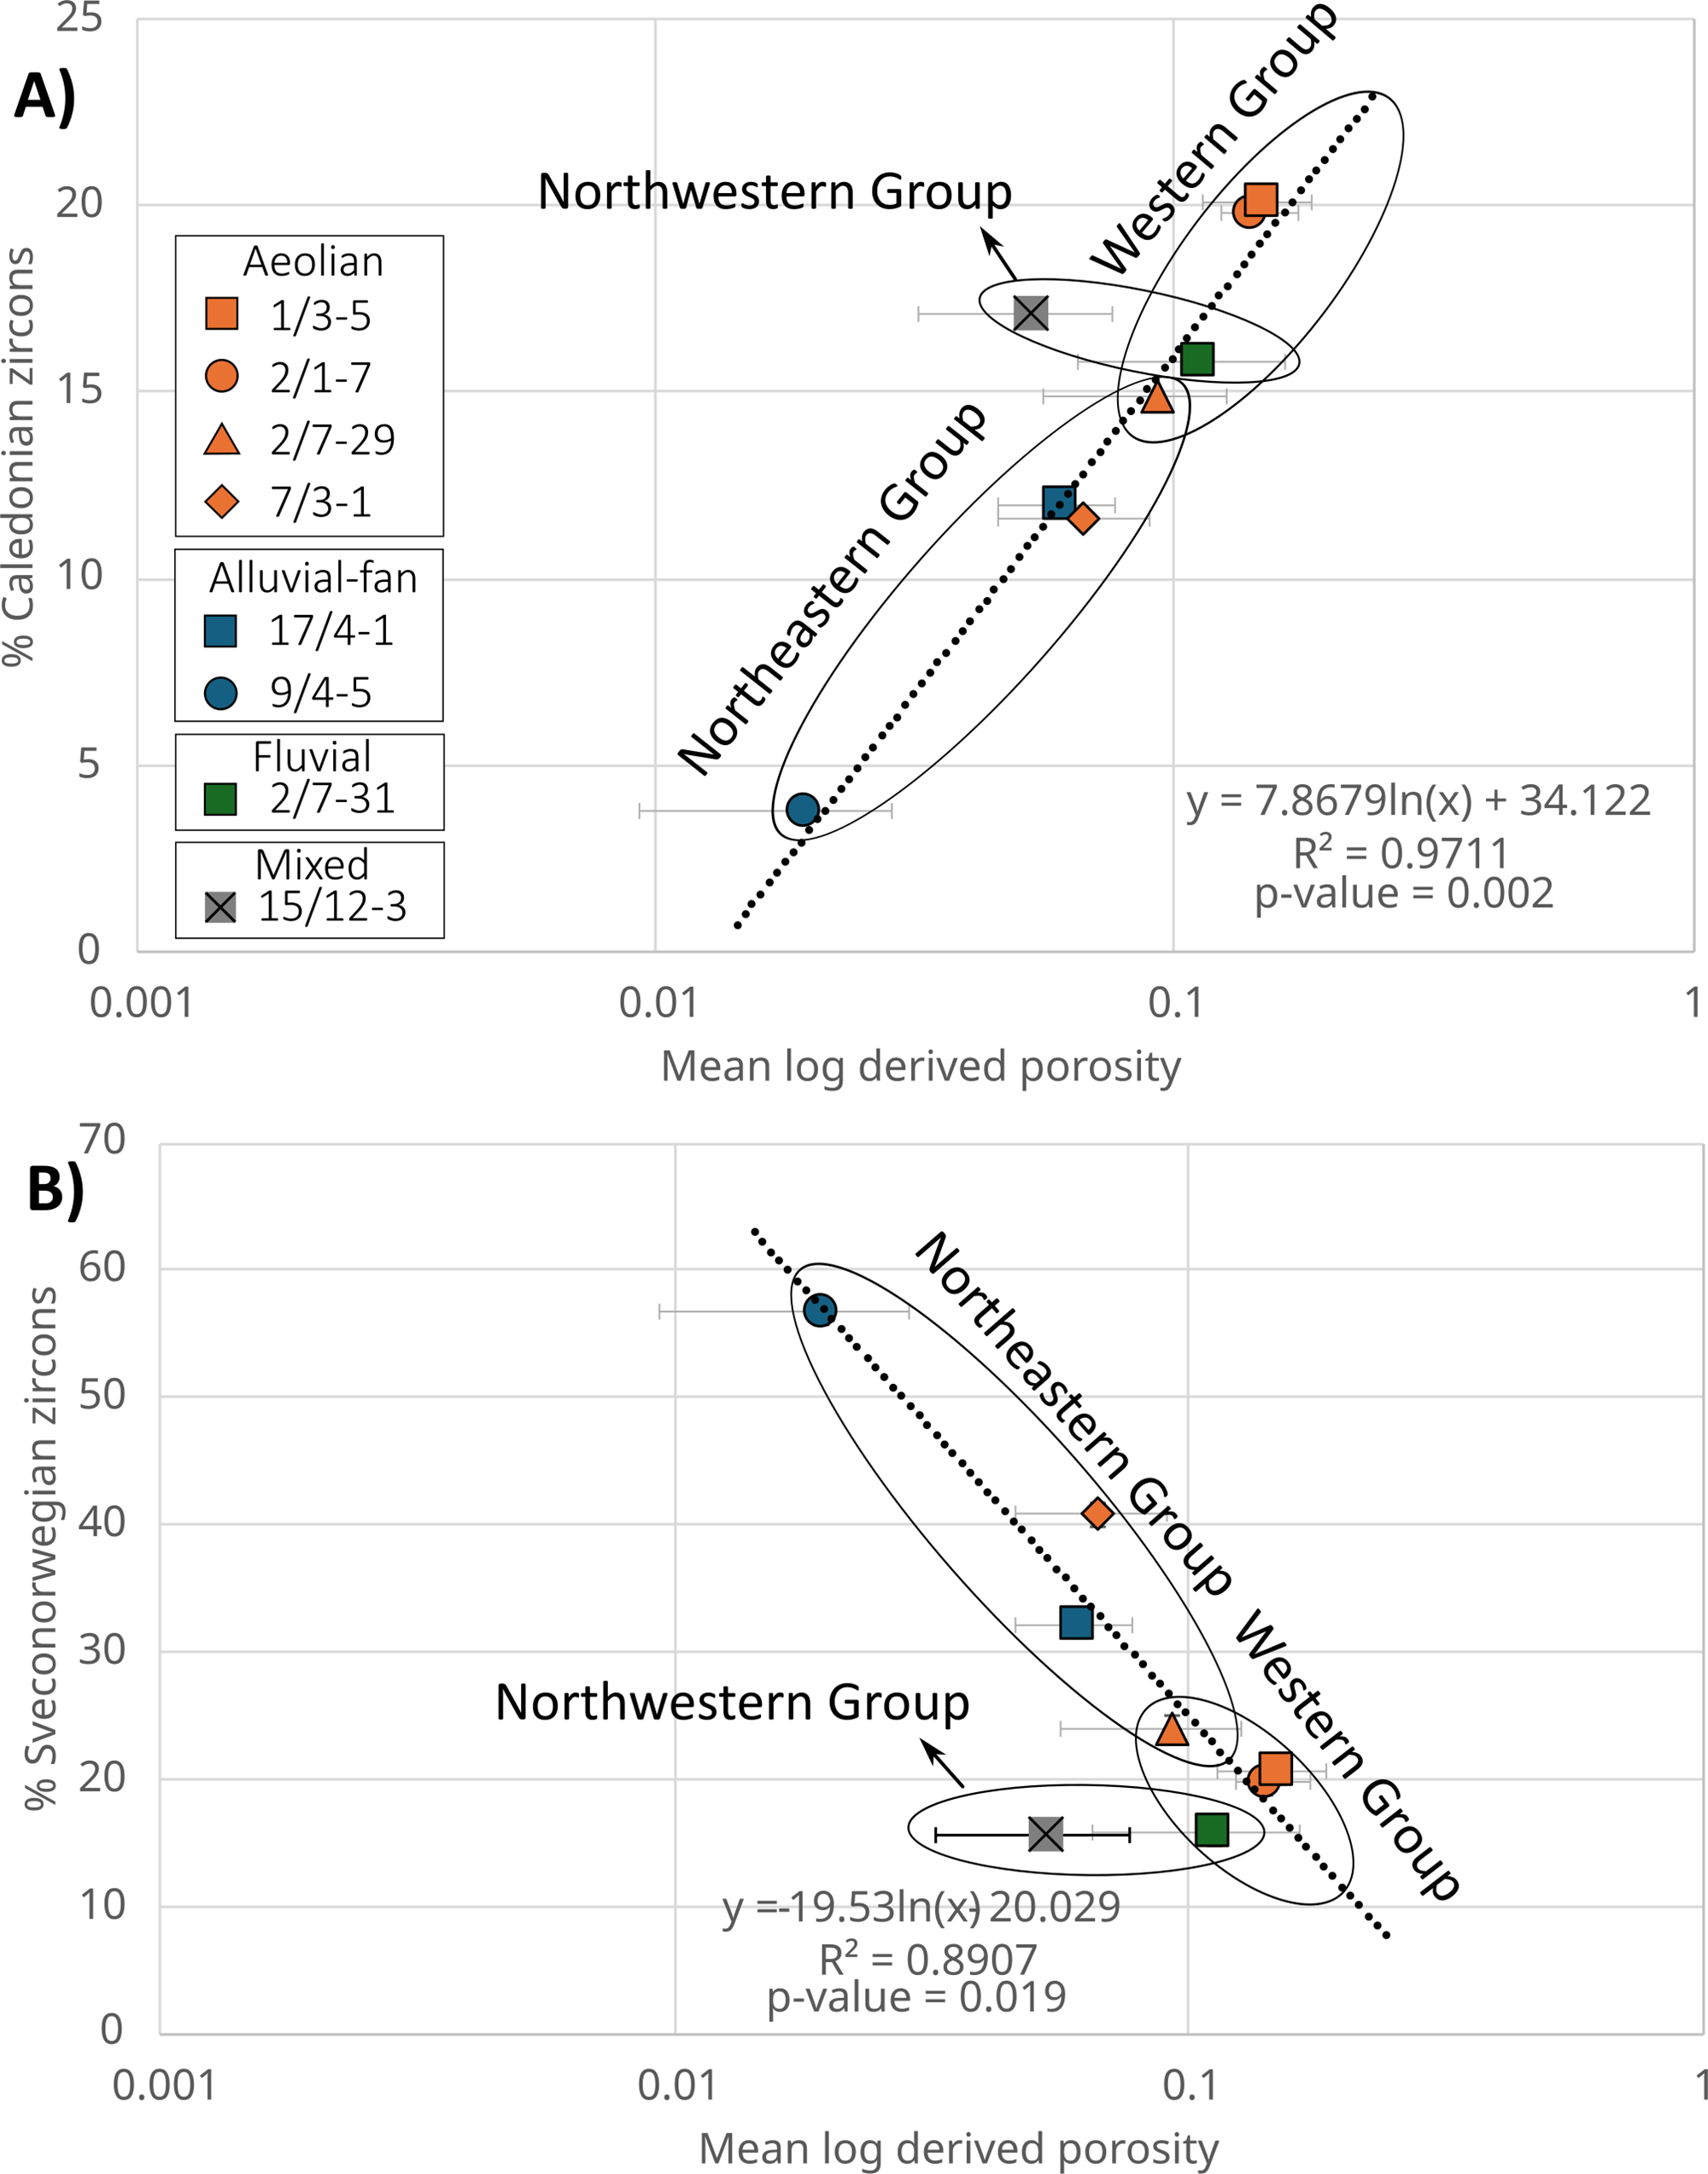
Figure 16. Long description
Two scatter plots illustrate the relationship between the proportion of Caledonian and Sveconorwegian zircon grains and the mean porosity of the Rotliegend Group from well-log analysis for eight wells. The first plot (A) shows the percentage of Caledonian zircons against mean log-derived porosity, with data points grouped into Northwestern, Western, and Northeastern groups. The second plot (B) shows the percentage of Sveconorwegian zircons against mean log-derived porosity, similarly grouped. Each plot includes a trend line with its respective equation, R-squared value, and p-value. The data points are color-coded and shaped according to different depositional environments: Aeolian, Alluvial-fan, Fluvial, and Mixed. Horizontal error bars represent the P10-P90 porosity range for each well. Well 15/12-3 is excluded from the trend function. The plots suggest a correlation between zircon grain proportions and porosity, with specific trends for each group.
The lithofacies and depositional-setting dominance in the zircon-age groups may partly explain the link between provenance and porosity based on their different rock composition and texture. Thus, the western group with its aeolian and fluvial well-sorted, quartz-rich and matrix-poor sandstone with few ductile grains and Caledonian zircon sources favoured preservation of primary porosity. In contrast, the northeastern group with its mix of alluvial fans, aeolian dune and interdune/playa sandstone rich in feldspar grains and lithoclasts and with Sveconorwegian zircon input is more prone to incorporating fine materials and early cement. These compositional, textural and facies differences increase susceptibility to mechanical compaction and cementation. This is supported by the frequent occurrence of carbonate cement in aeolian, lacustrine and alluvial-fan facies of the northeastern group, and the near absence of cement in aeolian and fluvial deposits of the western and northwestern groups. It may have been the mica clasts and matrix that increased susceptibility to cementation in the northeastern group. The petrographic contrasts between the three groups indicate that diagenetic evolution varied systematically with depositional facies and grain framework characteristics linked to provenance.
At basin scale, variation in provenance and depositional style results in Caledonian-dominated supply being commonly associated with compositionally mature aeolian/fluvial systems, whereas Sveconorwegian-dominated margins are linked to more feldspathic and matrix-prone depositional environments. A facies-linked reservoir-quality pattern agrees with Auk-field observations, where the porosity is higher in well-sorted dune cross-sets than in interdune/flash-flood intervals due to early carbonate cementation (Heward, Reference Heward, Miall and Tyler1991). Although the burial history and thermal regime affect the post-depositional reservoir evolution, the regional porosity trends indicate that primary sediment composition and texture, ultimately controlled by sediment source and depositional system, represent a primary control on porosity under broadly comparable burial conditions. This is similar to observations from the Rotliegend Group in the British North Sea (Heward, Reference Heward, Miall and Tyler1991) and the Netherlands (Grötsch et al. Reference Grötsch, Sluijk, van Ojik, de Keijzerm, Graaf, Steenbrink and Grötsch2011), as well as from Lower Cretaceous sandstone in the Barents Sea (Ärlebrand et al. Reference Ärlebrand, Augustsson, Escalona, Grundvåg and Marín2021), where sediment source and facies exert the primary control on reservoir quality.
Local deviations from the regional provenance-porosity trend indicate the influence of additional compositional or diagenetic factors. For example, the large Gothian and Fennoscandian components in well 15/12-3 coincide with a weak correlation with porosity (Figure 16) likely reflecting the different rock compositions in the catchments. Gothian–Sveconorwegian and Fennoscandian terranes are dominated by feldspathic and metamorphic basement rocks (e.g., Bingen et al. Reference Bingen, Nordgulen and Viola2008; Bingen and Solli, Reference Bingen and Solli2009; Lamminen, Reference Lamminen2011; Bingen et al. Reference Bingen, Viola, Möller, Vander Auwera, Laurent and Yi2021). In contrast, Caledonian catchments and recycled Old Red Sandstone successions typically supply quartz-rich, compositionally mature sediment (e.g., Bingen and Solli, Reference Bingen and Solli2009; Templeton, Reference Templeton2015; McKellar et al. Reference McKellar, Hartley, Morton and Frei2020; Strachan et al. Reference Strachan, Olierook and Kirkland2021). Furthermore, well 2/4-20, located near high-porosity wells 2/4-17 and 1/3-5, exhibits unexpectedly low porosity (Table 4), likely reflecting enhanced diagenetic alteration under elevated geothermal gradients (NOD, 2025). In such thermally disturbed areas, enhanced compaction and cementation may reduce porosity irrespective of provenance. Under these conditions, porosity-based provenance predictions may underestimate the original Caledonian contribution.
Summary of Rotliegend Group reservoir characteristics for studied wells, dominant facies, and proportions of Caledonian and Sveconorwegian zircon-age components. Values derived from the logarithmic functions from Figure 16 (zircon-derived porosity and estimated dominant provenance component/porosity group) are shown in red, whereas measured or data-derived parameters are shown in black. Porosity values and porosity groups marked with asterisk are from Urrez et al. (Reference Urrez, Cedeno, Escalona, Augustsson and Blanconein review)
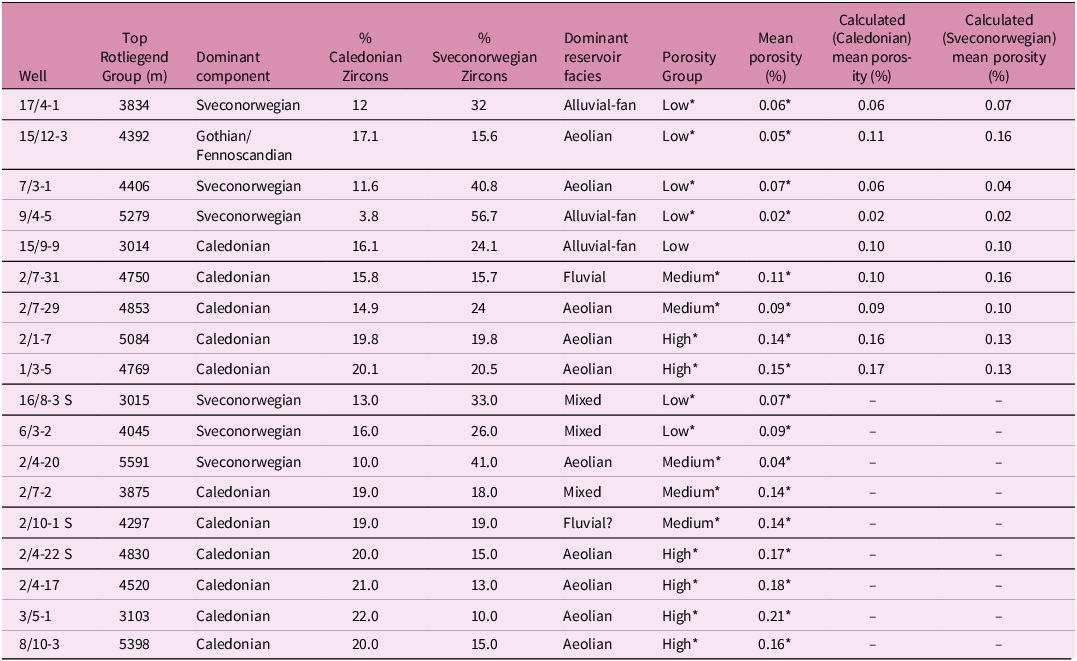
Long description
The table presents data on Rotliegend Group reservoir characteristics for various studied wells. It includes columns for well identification, top Rotliegend Group depth in meters, dominant component, percentage of Caledonian zircons, percentage of Sveconorwegian zircons, dominant reservoir facies, porosity group, mean porosity percentage, and calculated mean porosity percentages for Caledonian and Sveconorwegian components. The table has 19 rows and 11 columns, with each row representing a different well. Notable trends include variations in porosity based on the dominant zircon-age components and reservoir facies. For instance, wells with higher Caledonian zircon percentages tend to show higher porosity values.
The empirical relationship between Caledonian- and Sveconorwegian-dominated provenance and porosity provides a first-order exploratory framework in which provenance data may be used to anticipate porosity trends in undrilled areas, and conversely, porosity trends may indicate dominant sediment sources. Accordingly, the best-preserved reservoir properties are most likely to occur in the west-southwest and central Norwegian North Sea, where thick aeolian successions and Caledonian provenance dominate (Table 4). In contrast, low reservoir quality is more likely along the eastern and northern basin margins, where alluvial-fan facies and Sveconorwegian input prevail. Toward the southern sector, reservoir quality is more variable, likely due to the Caledonian–Sveconorwegian–Gothian mix (Figure 11) and varied lithofacies, resulting in greater heterogeneity and locally reduced reservoir quality. Locally elevated geothermal gradients and the presence of volcanic material (e.g., at the base of well 3/5-1) further increase the likelihood of diagenetic porosity reduction in these areas.
8. Conclusions
The mixed Archaean–Palaeoproterozoic–Mesoproterozoic–Palaeozoic zircon populations across all wells indicate contributions from both recycled Devonian Old Red Sandstone basin fills and direct erosion of adjacent crystalline highs during Rotliegend Group deposition. The structural highs that acted as both fluvial and aeolian sediment transport barriers maintained distinct provenance domains. The convergence of long-distance aeolian transport with fluvial and short-range alluvial-fan systems from the northwest, east and south implies that the Norwegian part of the Northern Permian Basin is interpreted to have behaved largely as an internally drained, endorheic depocentre during Rotliegend Group time. Superimposed, the shift from hyper-arid to semi-arid conditions, accompanied by the development of lacustrine and playa-lake deposits, altered sediment transport efficiency and detrital mixing potential.
The strong contrast between high porosities in quartz-rich Caledonian-derived aeolian deposits and low porosities in feldspathic Sveconorwegian-derived alluvial-fan deposits implies that provenance control partly overrides expected facies-linked trends. Consequently, sediment source composition and transport history must be considered alongside depositional facies when predicting reservoir quality. The same principle can, in concept, extend to other provenance tools, although the predictive strength may differ where mafic or volcanic input becomes significant or where different basement provinces supply the basin. This study identifies where Caledonian-derived, high-quality aeolian reservoirs are most likely preserved, where Sveconorwegian-dominated alluvial-fan systems impose consistently lower porosity, and where mixed sediment transport is expected to generate more heterogeneous reservoir behaviour. Because provenance establishes a first-order framework for understanding petrophysical properties, the calibrated provenance–porosity relationship provides a predictive tool for identifying dominant sediment sources in undrilled areas when interpreted within a dynamically restored basin geometry.
Developed in the context of the Norwegian North Sea, this integrated provenance–transport approach offers a transferable framework for tackling similar source-to-sink problems and improving reservoir prediction in comparably ancient, structurally overprinted basins.
Supplementary material
The supplementary material for this article can be found at https://doi.org/10.1017/S0016756826100764
Data availability
The complete U–Pb detrital zircon analytical dataset is provided in the Supplementary Material (Appendix 1). The Supplementary Material also includes the full interpreted core dataset (Appendix 2), the wells used for the palaeogeographic reconstruction (Appendix 3) and Spearman’s rank correlation results (Appendix 4).
Acknowledgements
The authors thank the sponsors of the Palaeozoic Basins (PaBas) project for the funding and partners of PL018 license (Conoco Phillips Norway, Total Energies EP, Vår Energi, Sval Energi, and Petoro) for the permission to publish dipmeter data from well 2/7-31. Norman Urrez wants to thank Olaf Normann for his guidance in teaching laboratory procedures for heavy-mineral separation and for preparing thin sections, Espen Undheim for training in cathodoluminescence imaging, Maria Josefina Cuello for her support during core work, Siri Gloppen for conducting heavy-mineral separation of samples from wells 2/7-29 and 2/7-31, Nestor Cardozo for help in digitizing dipmeter data, Jose Allard (UNPSJB) for fruitful discussions regarding palaeocurrent analysis and exotic systems, and Richard Albert (FIERCE) for helping with conducting geochronological analysis. We acknowledge two anonymous reviewers for comments that significantly improved the paper as well as Jan Schönig for editorial handling.
Declaration of generative AI and AI-assisted technologies in the writing process
During the preparation of this work, the authors used ChatGPT to refine language and improve readability in the final stages of writing. After using this tool, the authors reviewed and edited the content as needed and take full responsibility for the content of the publication.
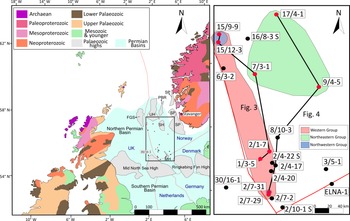
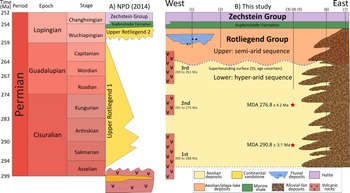
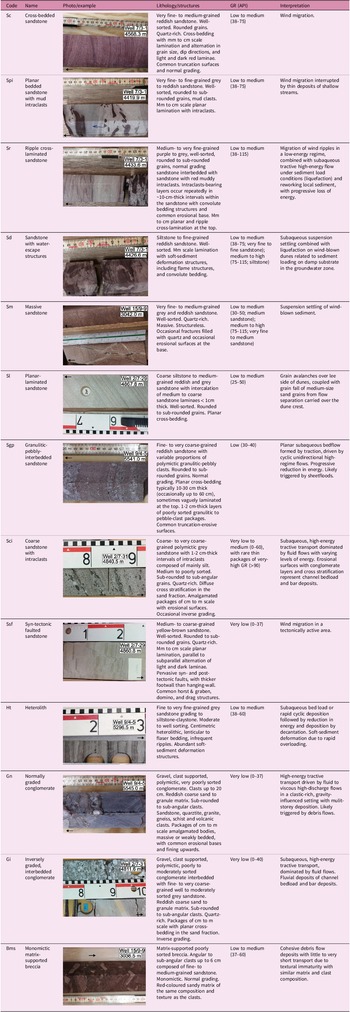
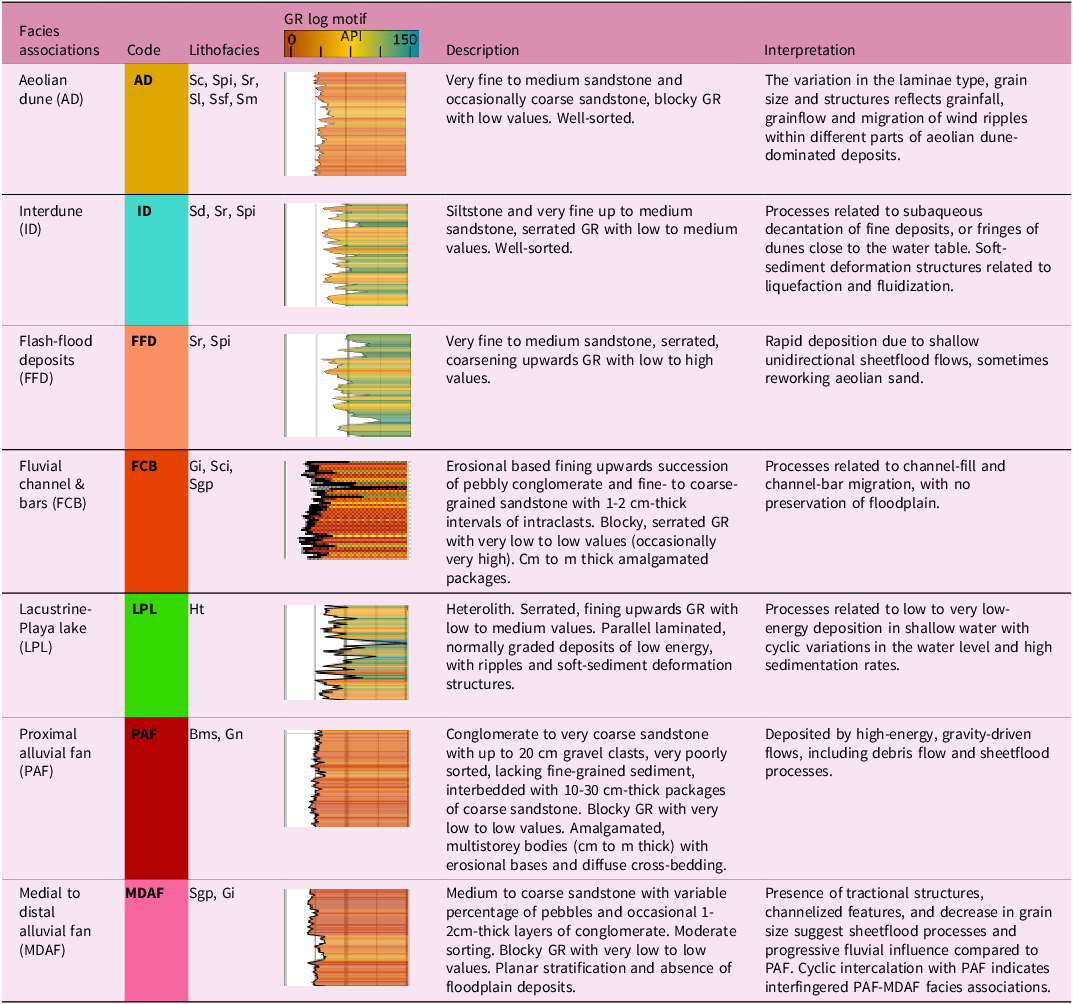
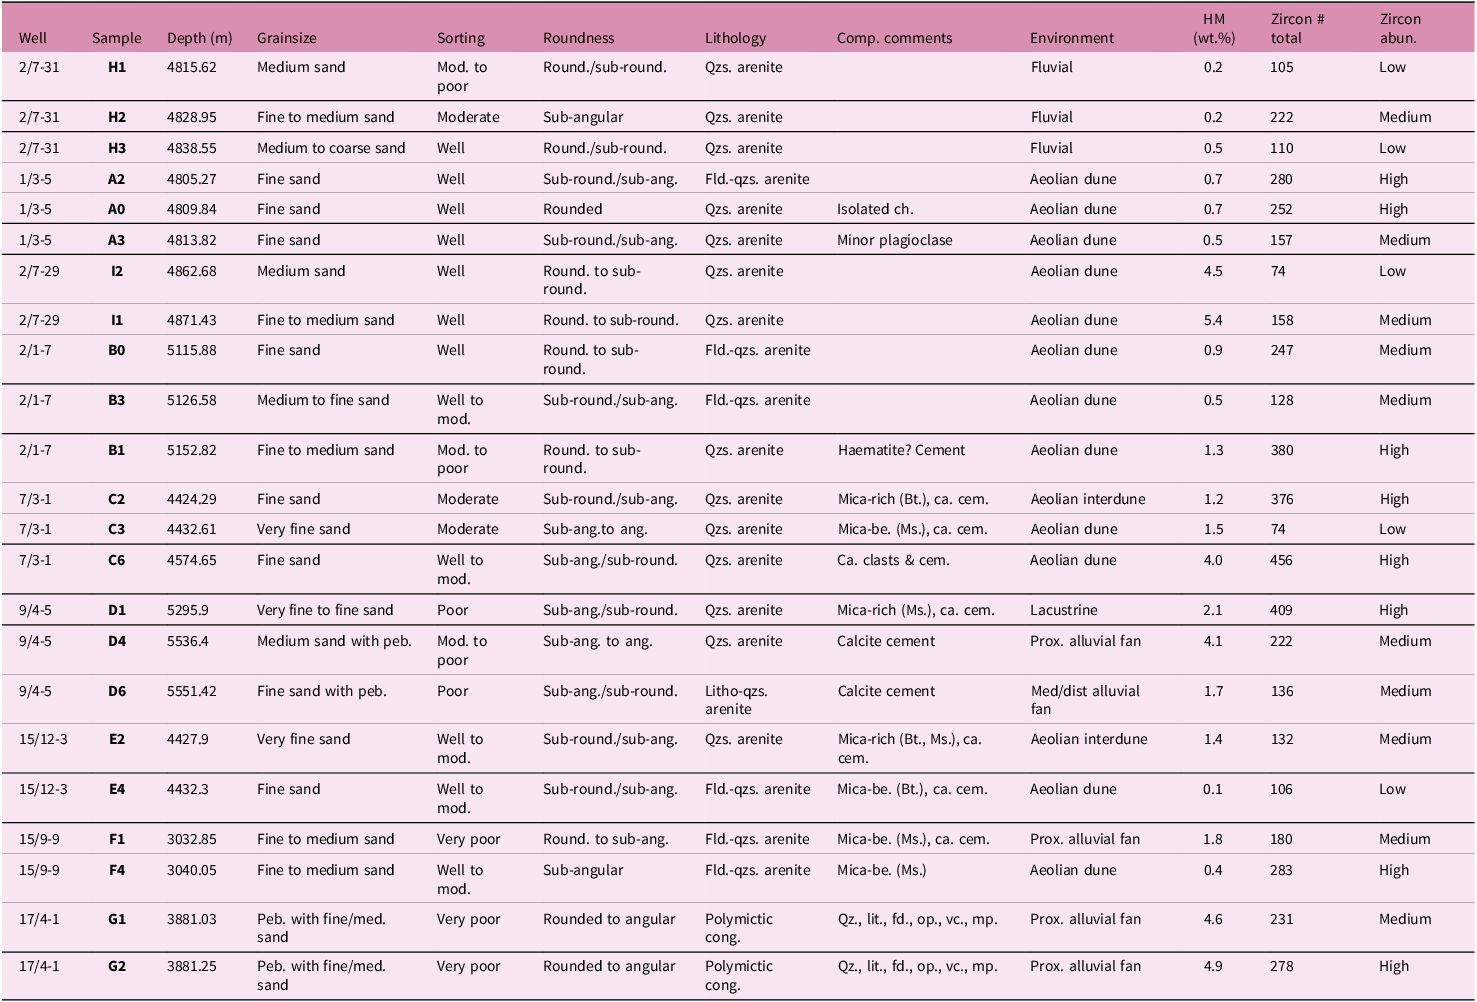
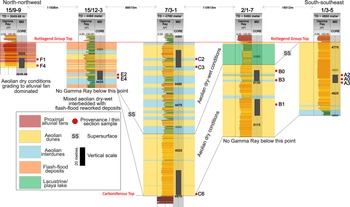
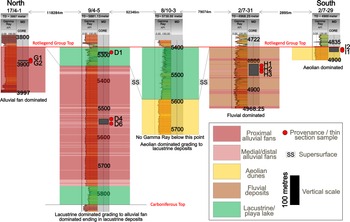
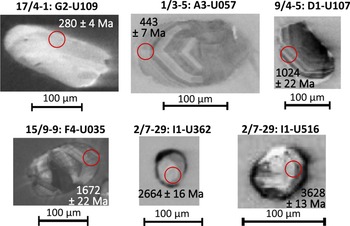
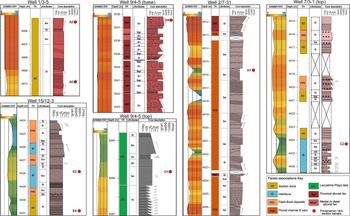
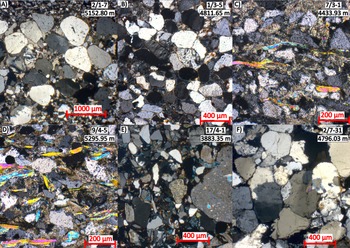
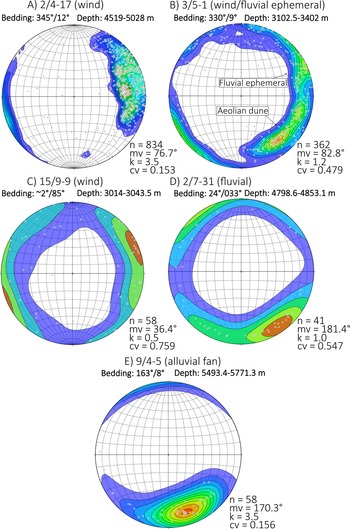
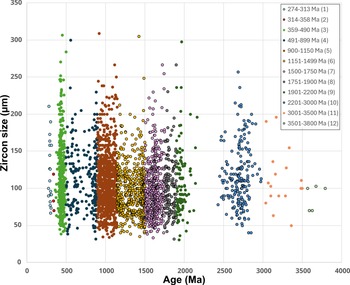
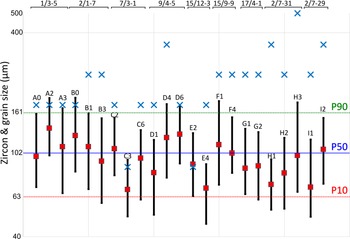
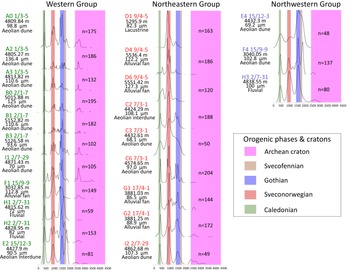

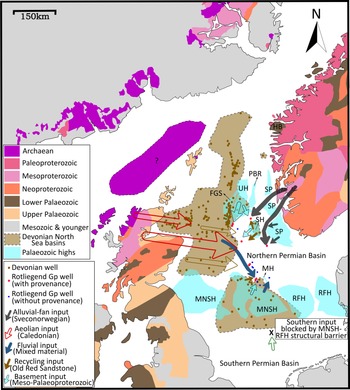
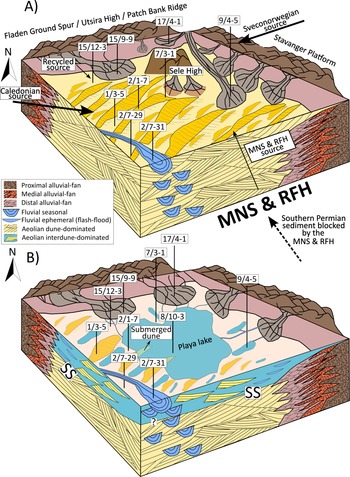

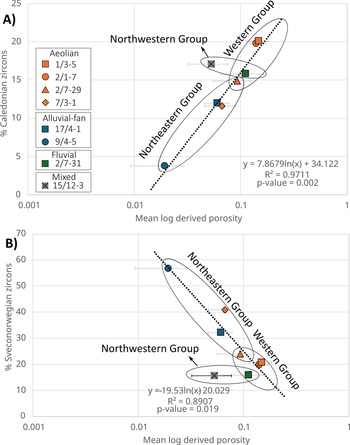
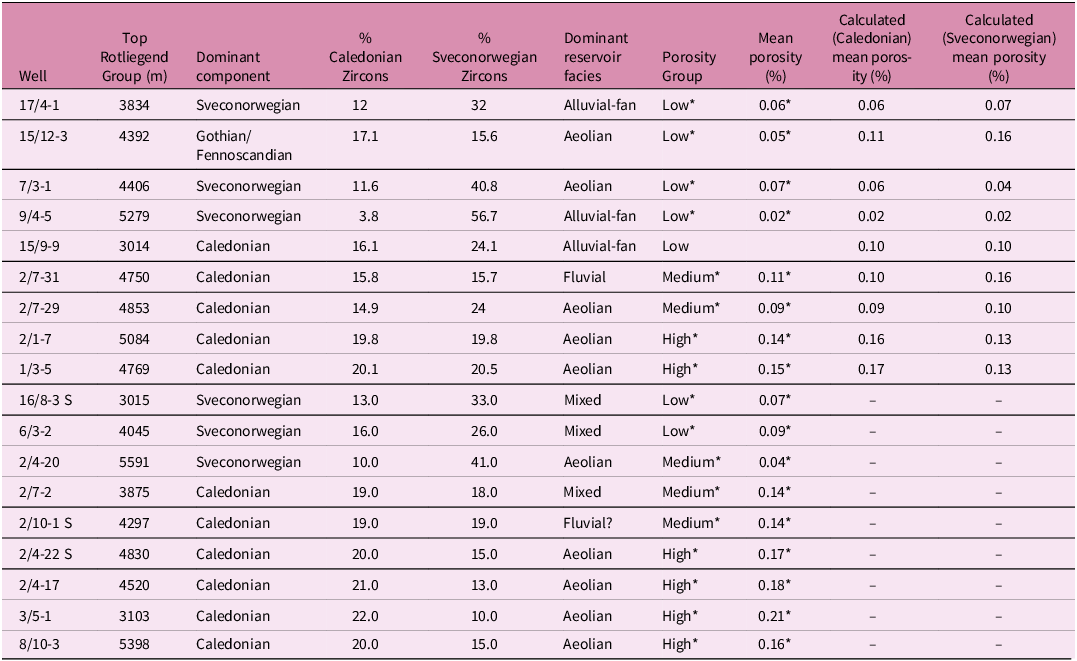


 Open access

