





1. Introduction
Globally rising temperatures cause increased glacial melting in nearly all glaciated regions of the world (Hock and others, Reference Hock and Pörtner2019b). This holds especially true for the mountain ranges of High Mountain Asia (HMA) (Shean and others, Reference Shean2020). One of the most dynamic and apparent impacts of a warming climate is the expansion of glacial lakes (Haritashya and others, Reference Haritashya2018; Farinotti and others, Reference Farinotti, Round, Huss, Compagno and Zekollari2019b). However, glacial melting processes are not only connected to the expansion of existing glacial lakes but also to the formation of new ones. Paraglacial bedrock troughs and laterofrontal moraine complexes are abundant in many deglaciating mountain ranges, often providing morphological configurations capable of storing precipitation and meltwater (Cuellar and McKinney, Reference Cuellar and McKinney2017). Newly formed moraine dams consist of unconsolidated sediments that were typically deposited along a steep ice front that recently melted away and are thus highly unstable. Dam failures can be triggered by thawing permafrost or by displacement waves from rockfall, ice avalanches or calving (Kershaw and others, Reference Kershaw, Clague and Evans2005; Harrison and others, Reference Harrison2018). Both types of events can lead to reduced material cohesion and/or subsequent dam erosion (Eriksson and others, Reference Eriksson2009). The following sudden and often catastrophic discharge of water characteristically transforms into a debris flow, gaining momentum and range, sometimes even exceeding 100 km, and involving valley damming and secondary outbursts (Lliboutry and others, Reference Lliboutry, Morales Arnao, Pautre and Schneider1977; Allen and others, Reference Allen, Singh, Schickhoff and Mal2016). Hence, glacial lake outburst floods (GLOFs) are among the most dangerous natural hazards in high mountain areas and pose an immense threat to people and infrastructures regionally (Clague and O'Connor, Reference Clague, O'Connor, Haeberli, Whiteman and Shroder2015; Carrivick and Tweed, Reference Carrivick and Tweed2016). Glaciological and hydrological information about glacial lakes is crucial for early hazard detection and effective risk reduction (Haeberli and others, Reference Haeberli2016). To date, most research focuses on evaluating the threat from existing glacial lakes by means of remote sensing (Veh and others, Reference Veh, Korup, Roessner and Walz2018; Scapozza and others, Reference Scapozza, Ambrosi, Cannata and Strozzi2019; Treichler and others, Reference Treichler, Kääb, Salzmann and Xu2019; Shugar and others, Reference Shugar2020; Zhang and others, Reference Zhang, Chen, Tian, Liang and Yang2020). Goals were, for example, the development of early warning systems (Huggel and others, Reference Huggel2020), decision making strategies (Cuellar and McKinney, Reference Cuellar and McKinney2017) or inventories of lakes and previous flood events (Nagai and others, Reference Nagai2017; Nie and others, Reference Nie2018).
Over the last few years, another research perspective emerged focusing on anticipating the development of future lakes as increasing temperatures lead to permafrost degradation and increasing slope instability (Deline and others, Reference Deline, Haeberli, Whiteman and Shroder2015). These future glacial lakes will most likely differ from existing ones regarding several aspects: first, they will rather form in bedrock overdeepenings in ice-free glacier beds than behind large moraine dams which would require a stationary glacier to build-up (Frey and others, Reference Frey, Haeberli, Linsbauer, Huggel and Paul2010; Farinotti and others, Reference Farinotti, Round, Huss, Compagno and Zekollari2019b). Second, they are likely to be located in the vicinity of increasingly unstable slopes (Schaub and others, Reference Schaub, Haeberli, Huggel, Künzler, Bründl, Margottini, Canuti and Sassa2013). Third, they will probably have a higher potential for disasters because of the continued expansion of people and infrastructure into higher elevations (GAPHAZ, 2017). Linsbauer and others (Reference Linsbauer, Paul and Haeberli2012) developed the widely used GlabTop model to identify potential sites of lake formation. To date, variations of this method have been applied to individual mountain ranges, such as the European Alps (Haeberli and others, Reference Haeberli2016), the Himalayan and Karakoram ranges (Allen and others, Reference Allen, Singh, Schickhoff and Mal2016; Linsbauer and others, Reference Linsbauer2016), or the Peruvian Andes (Colonia and others, Reference Colonia2017; Drenkhan and others, Reference Drenkhan, Huggel, Guardamino and Haeberli2019). However, we are not aware of any inventory of future glacial lakes covering all mountain ranges of HMA, neither do we know about a future glacial lake hazard analysis of the same regional scope.
With the current study we provide the first inventory of future glacial lakes with associated hazard analyses on a regional-to-continental scale. Our study area covers the entire HMA, including the mountain ranges of the Himalaya, Karakoram and Kunlun, the Hindu Kush, Pamir and Tien Shan. We use global ice thickness data provided by Farinotti and others (Reference Farinotti2019a) to create a DEM of the study area ‘without glaciers’. Based on this, we calculate subglacial bedrock morphology which is then used to identify potential locations for lake development. As a result, we provide information on location, area and volume of potential future lakes for ~100 000 glaciers in HMA. We categorize the slopes surrounding the overdeepenings according to their geomorphological and hydrological attributes and obtain an approximate assessment of the hazard of rock or ice avalanches impacting the lake. Subsequently, we classify each lake accordingly, from highest to lowest impact hazard. We combine these results in a synoptic analysis to provide a first assessment of mass-movement impact hazards anticipated at future glacial lakes in the entire HMA. Due to the complex interactions between surface processes and landforms, modeling future lakes in high mountain areas is inherently subject to large uncertainties regarding, e.g. lake location and morphology, moraine dam height and water level (GAPHAZ, 2017). Therefore, the goal of this study is not a final assessment of glacial lake hazards but a comprehensive first overview. We aim at narrowing down potentially dangerous future lakes as a basis for more extensive investigations at the respective locations. It is with such early anticipation that planning and adaptation responses can be improved and risk-reducing measures can be defined.
2. Study area
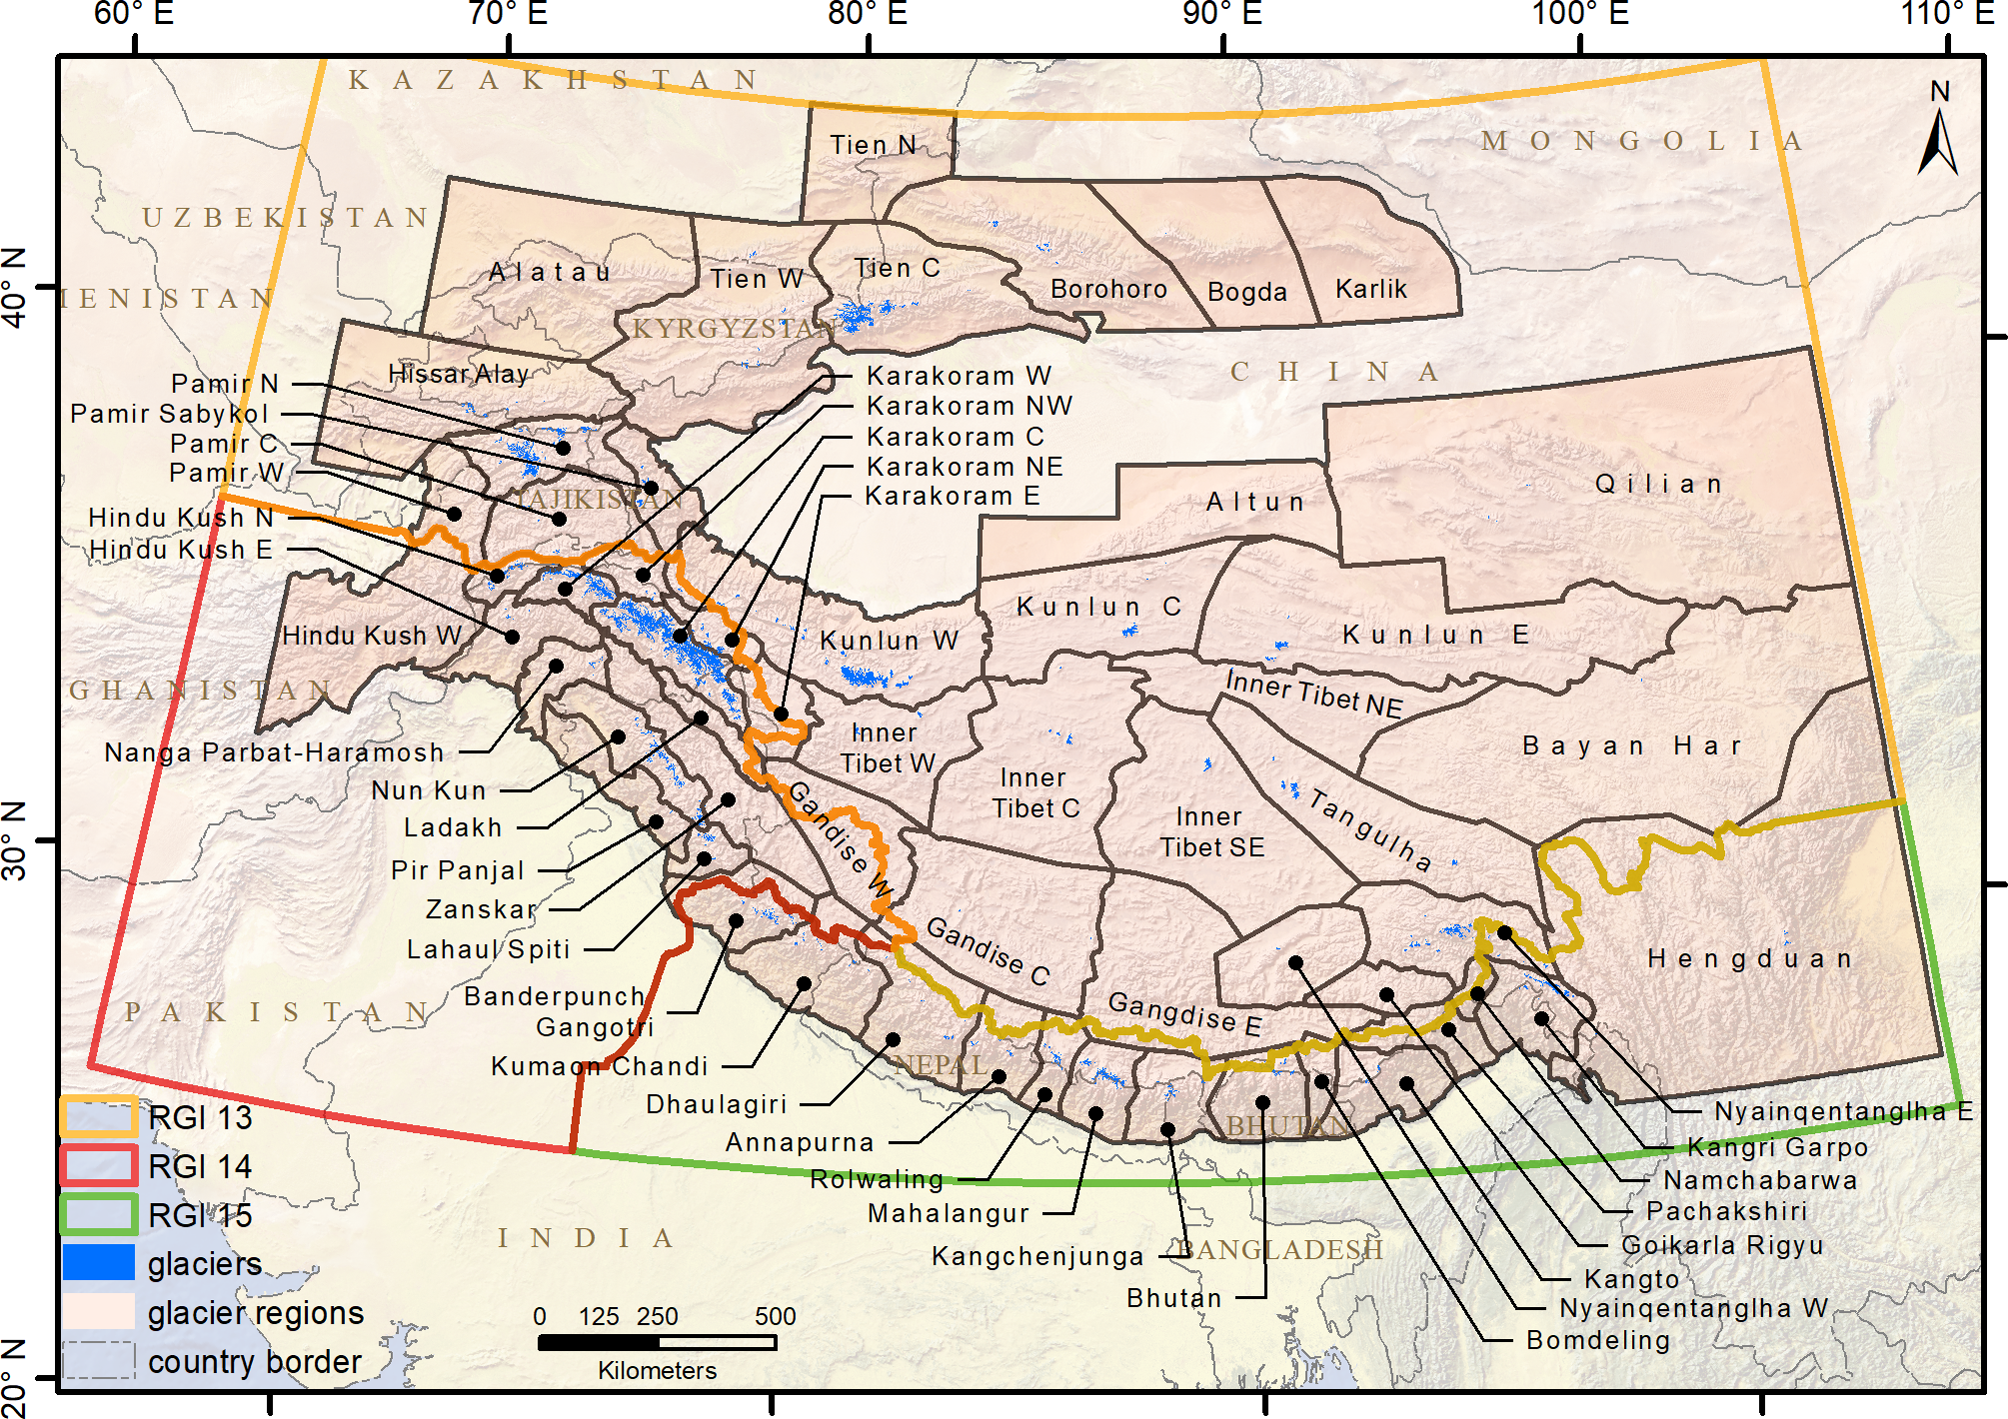
This study focuses on the mountain ranges of HMA – the most glaciated region in the world aside from the polar ice caps (Vaughan and others (Reference Vaughan2013)). The Randolph Glacier Inventory, version 6.0 (RGI v6), lists 95 536 glaciers in HMA that cover an area of 97 605 km2 (RGI Consortium, 2017). Despite the fact that HMA comprises extensive glaciers and glacier systems (e.g. the Fedchenko Glacier in the Pamir or the Siachen, the Baltoro and the Biafo Glaciers in the Karakoram), only ~1.5% of the inventoried glaciers are larger than 10 km2 and ~85% are smaller than 1 km2 (RGI Consortium, 2017). The RGI separates the glaciers of HMA into three zones: Central Asia (zone 13), South West Asia (zone 14) and South East Asia (zone 15) (Pfeffer and others, Reference Pfeffer2014). However, to be able to conduct comparative analyses of regional hydro- and topoclimatic regimes, a more detailed dataset is required. Here, we use glacier region outlines by Loibl (Reference Loibl2020) which are based on second-order glacier regions provided by the Global Terrestrial Network for Glaciers (GTN-G, 2017). The aim of this new dataset is to refine GTN-G regions to facilitate regional glaciological and climatological analyses, e.g. for patterns in forcing and changes. This is achieved by delineating individual glaciated (sub)mountain ranges using major valleys for separation. The resulting dataset thus allows for analyses of regional geomorphological and hydrological properties relevant in this study at a much higher level of detail. Figure 1 shows the regions of this dataset together with the three RGI zones and the respective glaciers.
Overview of the study area in HMA with glaciers in blue and orographic subregions in orange. Capital letters after some names stand for the compass directions while C stands for ‘central’. Glacier data are taken from the Randolph Glacier Inventory, version 6.0, orographic regions from Loibl (Reference Loibl2020). The country boundaries are part of the TM World Borders dataset (Sandvik, Reference Sandvik2008).
In the Tien Shan, the Karakoram and the western Himalaya, mid-latitude cyclones of the Westerlies provide 60–70% of the annual precipitation, while areas in the eastern and central Himalaya receive ~80% from the East Asian and the Indian summer monsoons (Bolch and others, Reference Bolch2012; Maussion and others, Reference Maussion2014). Brun and others (Reference Brun, Berthier, Wagnon, Kääb and Treichler2017) calculate a total annual glacier mass change for HMA of −16.3 ± 3.5 Gt for the period between 2000 and 2016. Shean and others (Reference Shean2020) estimate the annual glacier mass change to be even higher, at ~−19.0 ± 2.5 Gt for the period between 2000 and 2018. Continued glacier wastage of this order of magnitude would substantially accelerate the formation of new glacial lakes during coming decades. HMA is expected to have lost between 36 and 87% of its glacier mass by 2100, depending on the chosen representative concentration pathway scenario, climate forcing and model (Kraaijenbrink and others, Reference Kraaijenbrink, Bierkens, Lutz and Immerzeel2017; Hock and others, Reference Hock2019a; Marzeion and others, Reference Marzeion2020). Estimates of the number of current glacial lakes range from ~15 000 covering an area of 1600 km2 (Chen and others, Reference Chenin press) to ~25 000 lakes with an area of 1800 km2 (Wang and others, Reference Wang2020). For all estimates, it is undebated that glacial lake area has expanded significantly over the last few decades, especially at proglacial lakes, and that new lakes tend to develop in higher elevations (Chen and others, Reference Chenin press; Wang and others, Reference Wang2020). According to King and others (Reference King, Dehecq, Quincey and Carrivick2018, Reference King, Bhattacharya, Bhambri and Bolch2019), this will further accelerate glacier mass loss due to a positive feedback between lowered effective pressure, rising ice velocity, longitudinal strain and increased thinning and ablation at the glacier front.
3. Data and methods
3.1 Input data
To detect subglacial overdeepenings and assess potential future lake area and volume, this study relies on three datasets: DEM data, glacier ice thickness data and glacier outlines. Regarding the DEM, previous studies of glacial lake development in certain parts of HMA mainly relied on SRTM (Linsbauer and others, Reference Linsbauer2016) or ASTER data (Allen and others, Reference Allen, Singh, Schickhoff and Mal2016). However, these DEMs are subject to considerable artifacts in high mountain regions (Bolch and Loibl, Reference Bolch, Loibl and Huang2018). In this study, we therefore employ the ALOS World 3D-30m (AW3D30) DEM (version 3.1), which is based on the AW3D DEM with a resolution of 5 m by the PRISM sensor aboard the Advanced Land Observing Satellite (ALOS) operated by the Japan Aerospace Exploration Agency (JAXA) (Takaku and others, Reference Takaku, Tadono, Tsutsui and Ichikawa2018). Despite void-filling anomalies still being present in a few mountainous areas, the AW3D30 offers the highest accuracy among publicly available global DEMs (Mo and others, Reference Mo, Xie and Liu2018). Especially for studies in HMA, it is currently regarded the most suitable dataset surpassing both ASTER and SRTM elevation datasets regarding the mean absolute error (MAE) and the root mean square error (Liu and others, Reference Liu2019). Naturally, both error measures show increasing trends with an increase in slope. However, even in very rugged areas with slopes >50°, the MAE for the AW3D30 DEM (>10 m) is relatively low when compared to the SRTM data (>30 m) or ASTER data (>26 m). Also, the AW3D30 DEM outperforms other DEMs particularly well in areas with elevations over 1500 m (Liu and others, Reference Liu2019) which is especially required in this study.
For the glacier ice thickness, we chose to rely on a global model ensemble instead of one individual model as those tend to suffer from substantial uncertainties (Farinotti and others, Reference Farinotti2017). We use data published by Farinotti and others (Reference Farinotti2019a) who employed a combination of up to five models to increase the accuracy and robustness of the results. Their model ensemble uses RGI v6 data for glacier outlines, SRTM v4 data for the glacier surface topography, glacier mass turnover estimates and principles of ice flow dynamics to produce a glacier ice thickness dataset with a spatial resolution of 100 m. Cross-validation is employed to assess model performance while inverse variance and bias weighting are used for the final composite result (Farinotti and others, Reference Farinotti2019a). The difference between single model outputs and measured ice thickness (−17 ± 36%) reduces to +10 ± 24% when considering the average composite solution (Farinotti and others, Reference Farinotti2017). This value is only surpassed by manually selecting the most suitable solution for every glacier which is not feasible in the scope of our study.
Glacier outlines for HMA are available through the RGI v6. This globally nearly complete inventory of glaciers provides information on, e.g. a glacier's area, type, elevation, slope, length and aspect. In this dataset, ice caps with multiple outlet glaciers are divided up into separate units (RGI Consortium, 2017).
3.2 Detection of overdeepenings
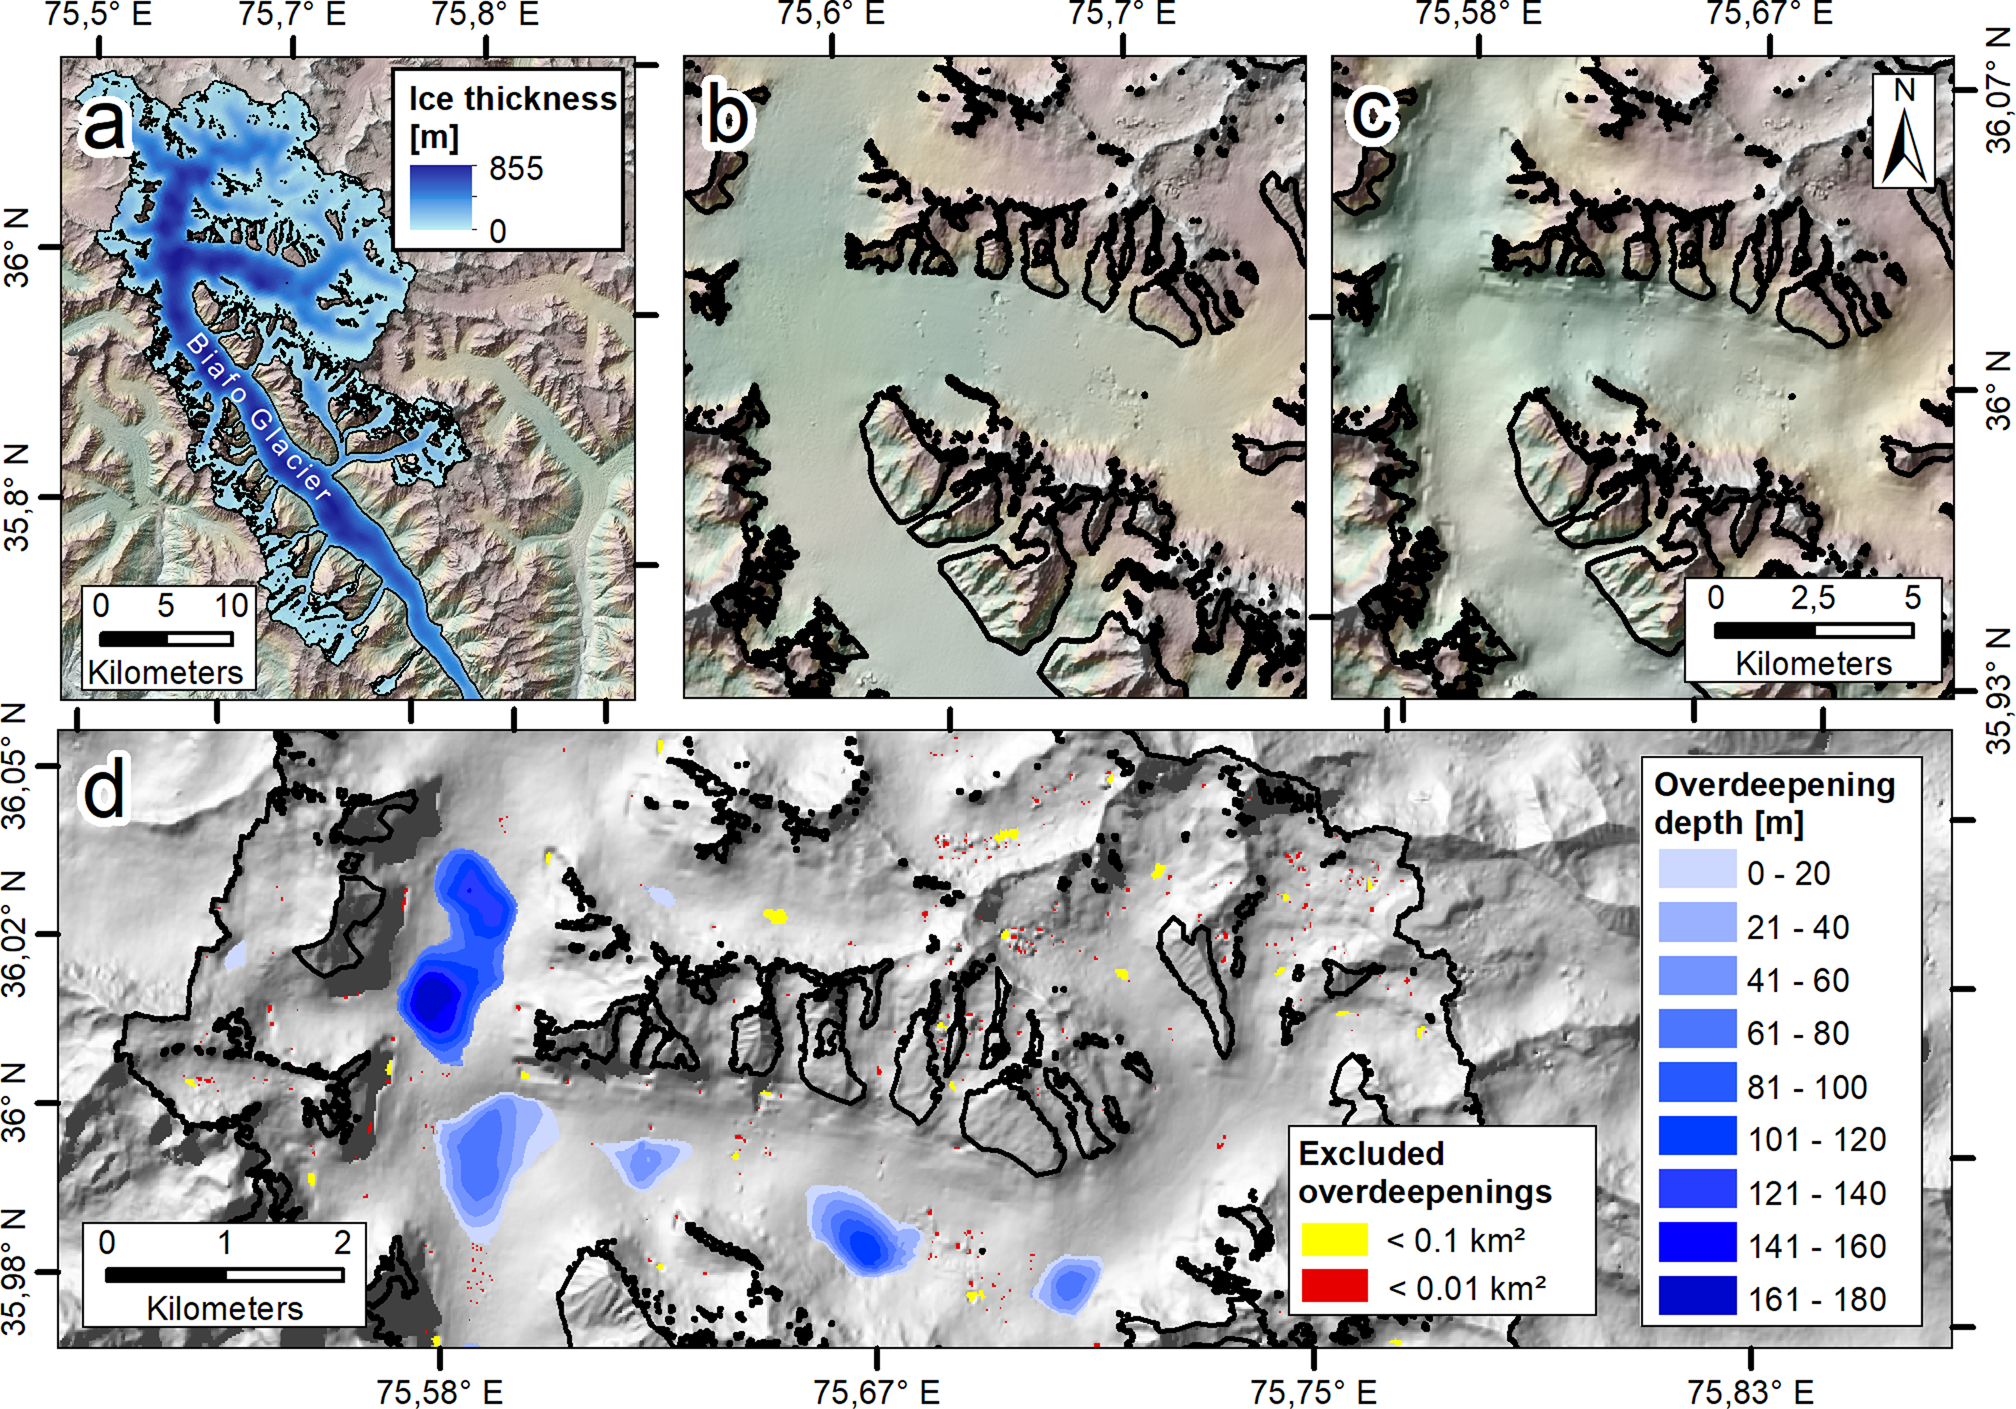
To locate potential future lakes, we create a DEM ‘without glaciers’, facilitating an assessment of the subglacial bedrock morphology (Paul and Linsbauer, Reference Paul and Linsbauer2012). We do so by subtracting the ice thickness data (Fig. 2a) from the AW3D30 elevation data (Fig. 2b and c). We refrain from coregistering the AW3D30 and the SRTM v4 DEM due to their very similar horizontal offset (Hu and others, Reference Hu, Peng, Hou and Shan2017), the higher sampling rate in the AW3D30 data (~30 vs 90 m in the SRTM) and the potential to introduce errors during the transformation. Additionally, any horizontal uncertainties can be considered negligible compared to the much higher uncertainties of the ice thickness dataset. To reduce computing time, we decided to exclude all glaciers <1 km2 which, according to preliminary tests as well as previous studies (Farinotti and others, Reference Farinotti2019a), does not significantly affect the results. Since accumulation areas shared by multiple glaciers are separated along flow divides in the RGI, calculations near the common borders of glaciers can lead to artifacts. To avoid those and other inconsistencies in the data, we group together all adjacent glaciers within a buffer of 100 m. Finally, the bedrock topography for the whole glacier complex is calculated. Subsequently, overdeepenings in the subglacial bedrock are filled using hydrological GIS tools (ESRI, 2019; Hijmans, Reference Hijmans2019). The difference between the DEM without glaciers and the filled DEM yields a bathymetry raster which is then used to assess the area and volume of the overdeepenings (Fig. 2d). We exclude small overdeepenings that most likely would fill with sediments rather than with water or not form at all (red areas in Fig. 2d). In choosing this threshold, we are guided by previous studies. Linsbauer and others (Reference Linsbauer2016) and Colonia and others (Reference Colonia2017) chose a threshold of 104 m2 of surface area for the initial calculation. For HMA, Linsbauer and others (Reference Linsbauer2016) considered only overdeepenings with surface areas larger than 106 m2 for most of their evaluations. We also employ 104 m2 as a threshold for the computation of overdeepenings (yellow areas in Fig. 2d). However, to investigate future lake development in more detail, we set our analysis threshold one order of magnitude smaller than previous studies in HMA – at 105 m2 of surface area (blue/violet areas in Fig. 2d). Additionally, we use a minimum depth threshold to rule out very shallow sinks. Following our assessments, lakes with a depth >10 m can potentially be the source of a significant GLOF event. Therefore, we employ 5 m as a second threshold leaving only those sinks that realistically can form and fill up with water.
Illustration of the detection of overdeepenings. (a) Ice thickness data for Biafo Glacier, Pakistan, as provided by Farinotti and others (Reference Farinotti2019a). (b) DEM of the northern part of the glacier and the surrounding mountains. (c) DEM ‘without ice’ depicting the calculated subglacial bedrock. (d) Bathymetry of bedrock overdeepenings >105 m2 (blue) as well as overdeepenings >104 m2 (yellow) and overdeepenings <104 m2 (red).
Uncertainties regarding overdeepening area and volume estimates are determined by two factors: (1) the accuracy of the ice thickness data and, (2) the vertical precision of the AW3D30 DEM. With uncertainties of ±25.99% (RGI zone 13), ±25.78% (RGI zone 14) and ±26.14% (RGI zone 15), the accuracy of the five-model-ensemble ice thickness estimates is nearly consistent for the entire HMA and significantly higher than with previous single model runs (Farinotti and others, Reference Farinotti2019a). In this study, we use the mean uncertainty of ±25.97% for the modeled ice thickness in all three RGI zones in HMA. Following NELAK (2013), glacial lakes deeper than 30 m are described as ‘deep lakes’. Few glacial lake inventories include depth estimates but Muñoz and others (Reference Muñoz, Huggel, Frey, Cochachin and Haeberli2020) describe a maximum glacial lake depth of ~130 m for the Cordillera Blanca. However, in our study we found that some computed overdeepenings exceed this depth by far. As this is partly the effect of erroneous void fillings in the AW3D30 data, we disregard overdeepenings where depth values are strongly affected by such void fillings from our calculation using a primary maximum depth threshold of 1000 m. We use a secondary, still fairly high threshold of 300 m to mark overdeepenings for manual validation, as the overdeepenings mapped in our study are about one order of magnitude larger than the lakes described by Muñoz and others (Reference Muñoz, Huggel, Frey, Cochachin and Haeberli2020). Each marked overdeepening was checked in GIS for visible erroneous void fillings in the AW3D30 DEM as well as for incongruencies between Landsat surface reflectance images and the shape of the overdeepening in the DEM. Overdeepenings with questionable characteristics were excluded from further analyses.
As we avoid grave outliers in our data with the previous step, we rely on the MAE for describing the DEM accuracy as it is less sensitive to such outliers and, therefore, better fits our adjusted data. For the AW3D30, Liu and others (Reference Liu2019) measured the MAE as 2.79 m for HMA. The resulting uncertainty depends on the respective glacier ice thickness and ranges from ±0.59 to ±69.75%. For all overdeepenings larger than 105 m2, the AW3D30 uncertainty averages ±2.87%. Combined with the uncertainty from the ice thickness model (±25.97%) this results in a cumulative uncertainty of ±28.8%. We employ this cumulative value for both lake area and volume, as Cook and Quincey (Reference Cook and Quincey2015) found a strong correlation (R 2 of 0.91) between both parameters that we were able to confirm for our findings (R 2 of 0.86, significance level: <0.001).
3.3 Slope hazard assessment
To assess the hazard of rock or ice avalanches hitting the lake we identify all relevant slopes of the DEM without glaciers in a 2 km buffer. Relevant slopes are initially defined as slopes belonging to the catchment area of the lake. However, the flow behaviors of avalanches and surface runoff are substantially different from one another, since avalanche tracks are, although guided by the underlying topography, far more linear (Norem and others, Reference Norem, Irgens and Schieldrop1989; Fischer and others, Reference Fischer, Kowalski and Pudasaini2012a). Ice and rock avalanches in lateral valleys may well originate from a location within the lake's catchment area but are unlikely to directly hit the lake and initiate a GLOF. If avalanches reach the floor of the lateral valley, their mobility will be heavily decreased by a run up on the opposing valley side (Nicoletti and Sorriso-Valvo, Reference Nicoletti and Sorriso-Valvo1991). Therefore, if lateral valleys exceed a certain drainage area, we exclude their catchment area from the hazard assessment. This is determined by the number of pixels that are drained through a valley's inlet into the lake. We set the threshold at 200 pixels (~0.18 km2) which, depending on the geomorphology of the catchment, generally excludes lateral valleys with a length of more than 1.5–2 km. With this approach, we provide a catchment area containing exclusively slopes from where mass movements would directly impact the lake.
The relationship between a region's terrain and the morphological characteristics of its future glacial lakes can be investigated using the terrain ruggedness index (TRI) by Riley and others (Reference Riley, DeGloria and Elliot1999). This index corresponds to the mean elevation difference between adjacent pixels in a DEM and is used to evaluate the average elevation change in a region (Riley and others, Reference Riley, DeGloria and Elliot1999). We calculate the TRI for each raster cell and use the mean TRI of all raster cells in an orographic region as a proxy for this area's ruggedness (Evans and others, Reference Evans, Oakley, Cushman and Theobald2014). In this study, the TRI is used for regional comparisons of the spatial distribution of future glacial lakes in order to find correlations between a region's terrain and the development and morphological characteristics of future glacial lakes. Allen and others (Reference Allen, Singh, Schickhoff and Mal2016) introduced the term ‘lake impact predisposition area’ (LIPA) for the combined area around a glacial lake from where an impact of ice or rock avalanches is possible. We expand this concept by dividing DEM cells in the respective catchment area into single slope units (SU) based on slope angles. Although this may split morphologically connected slopes in the landscape into smaller SU, this approach results in a more detailed approximation of the hazard of mass movements. For the SU delineation, we define four groups (Table 1), following the results of previous studies (Allen and others, Reference Allen, Cox and Owens2011; Hermanns and others, Reference Hermanns2012; Fischer and others, Reference Fischer, Purves, Huggel, Noetzli and Haeberli2012b).
Grouping criteria for the angle-dependent slope division
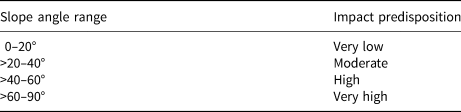
Areas with a slope ≤20° are considered safe and excluded from further calculations.
The first group contains areas from where mass movements typically are unlikely (slope angle <20°). Although this group is excluded from further analyses, the remaining three groups comprise potentially dangerous areas that are analyzed in the slope hazard classification. Additionally, we consider further topographical data for each SU: area, distance from and height difference to the lake. Thus, we can assign more detailed hazard scores to each SU, yielding a more comprehensive estimation of the overall impact hazard for each lake. The resulting values should, however, not be interpreted as absolute – in the sense of a final hazard assessment – but instead be treated as a means for recognizing similarities and differences between the different regions of HMA. First and foremost, they are meant as a comparative measure for organizing and prioritizing further research and field studies.
The hazard score (H SU) for each SU is approximated as a weighted mean of normalized relevant topographical parameters, as shown in Eqn (1):
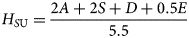
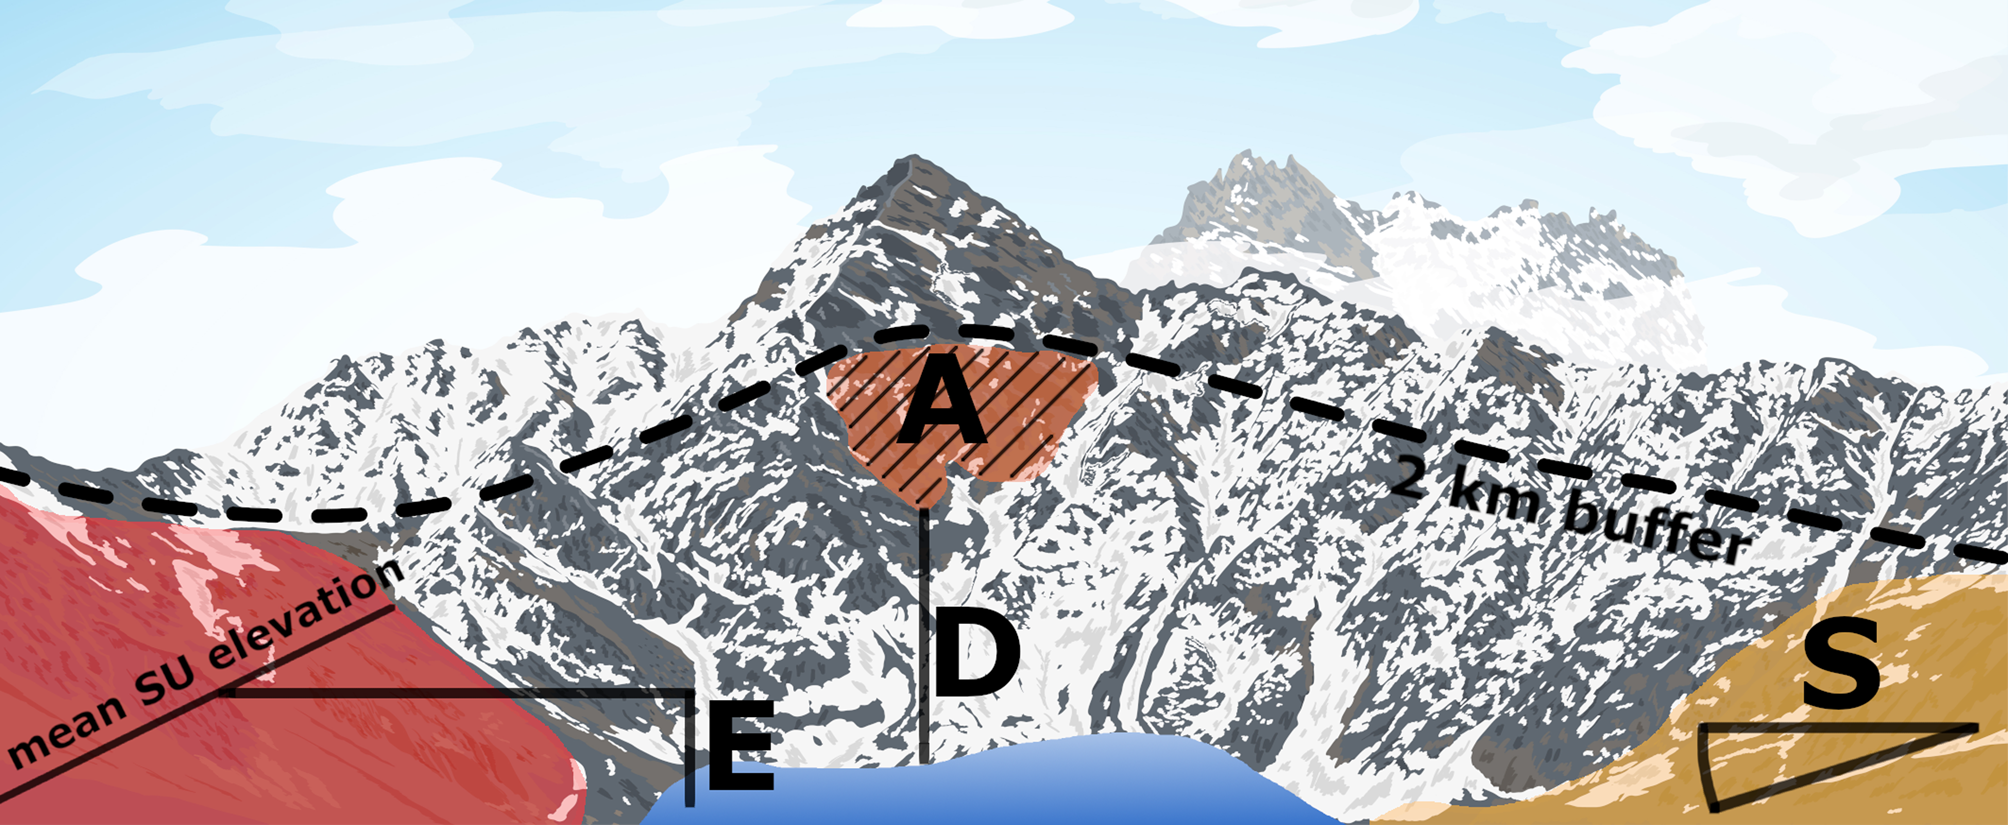
where A is the SU area, S is the mean SU slope, D is the shortest distance from any part of the SU border to any part of the lake border and E is the elevation difference between mean SU elevation and the lake surface. Higher values for A indicate a higher hazard, as more potentially unstable material is to be expected in a larger area. Higher values for S also contribute to a higher hazard classification, as material is more likely to detach from steeper slopes. As we invert the value D, high values for this parameter indicate areas in close proximity to the lake which raises the hazard. Higher values for E indicate a higher hazard as detached material can potentially gather more speed and hit the lake as well as other unstable material in its path with increased force. In accordance with the recommendations of the ‘Standing Group on Glacier and Permafrost Hazards’ of the IACS/IPA (GAPHAZ, 2017), A and S are considered to be the most important parameters and thus have the highest weight factors. D and E were introduced to improve the accuracy of the classification by adding factors that may exert further control on the hazard regimes in the heterogeneous topographic settings of HMA. All four parameters are rescaled. We normalize the slope S between 20 and 90° and use the 2 km buffer as a maximum and 0 as a minimum for the distance D. The elevation E is rescaled between 0 and an arbitrary maximum of 1000 m, while for the area A, we use the ratio between SU and lake area. Figure 3 shows the topographic parameters on the basis of three selected SU in a schematic depiction. The colors attributed to the slopes reflect the potential for rockfalls or icefalls impacting the lake (red = very high potential; orange = moderate potential; yellow = very low potential). Due to the weighting of the parameters, the large, steep area (left in Fig. 3) very close to the lake is attributed a very high hazard despite its smaller elevation difference. The smaller area (in the middle of Fig. 3) receives a moderate hazard score despite its high values for S and E value because of its small values for A and D. The gently sloped area (Fig. 3, right) is attributed a very low hazard score as its slope angle is <20° and would be excluded from further calculations.
Schematic depiction of the topographic parameters used for the hazard classification of selected SU surrounding a future lake in a 2 km buffer. E = elevation difference between mean SU elevation and lake surface, A = SU area, D = distance to the lake, S = mean SU slope. The colors indicate different hazard scores attributed to the slopes (red = very high potential; orange = moderate potential; yellow = very low potential).
The arithmetic mean of all relevant slopes in a lake's watershed is considered to be a proxy for the hazard of rock or ice avalanches impacting the lake. Resulting values range from 0 to 1, with higher values implying a higher probability of detached material to impact the lake and produce a considerable displacement wave that could lead to a GLOF event. However, as an avalanche or a rockfall from one very hazardous SU would be enough to trigger an event even for a lake with a very low mean hazard score, we additionally calculate the maximum H SU for each lake. Furthermore, we consider the lake volume to account for the potential magnitude of the GLOF (Eqn (2)). We employ a linear normalization for this parameter between 0 and 1 with 10−4 km3 as the lower boundary and 10−1 km3 as the upper. The lake hazard level is defined as the product of either the mean slope score (LHL mean) or the maximum slope score (LHL max) and the normalized lake volume. These variables are considered a first-order evaluation of the hazard of GLOF events triggered by mass impacts into future glacial lakes:

where V is the normalized lake volume.
4. Results
4.1 Bedrock overdeepenings
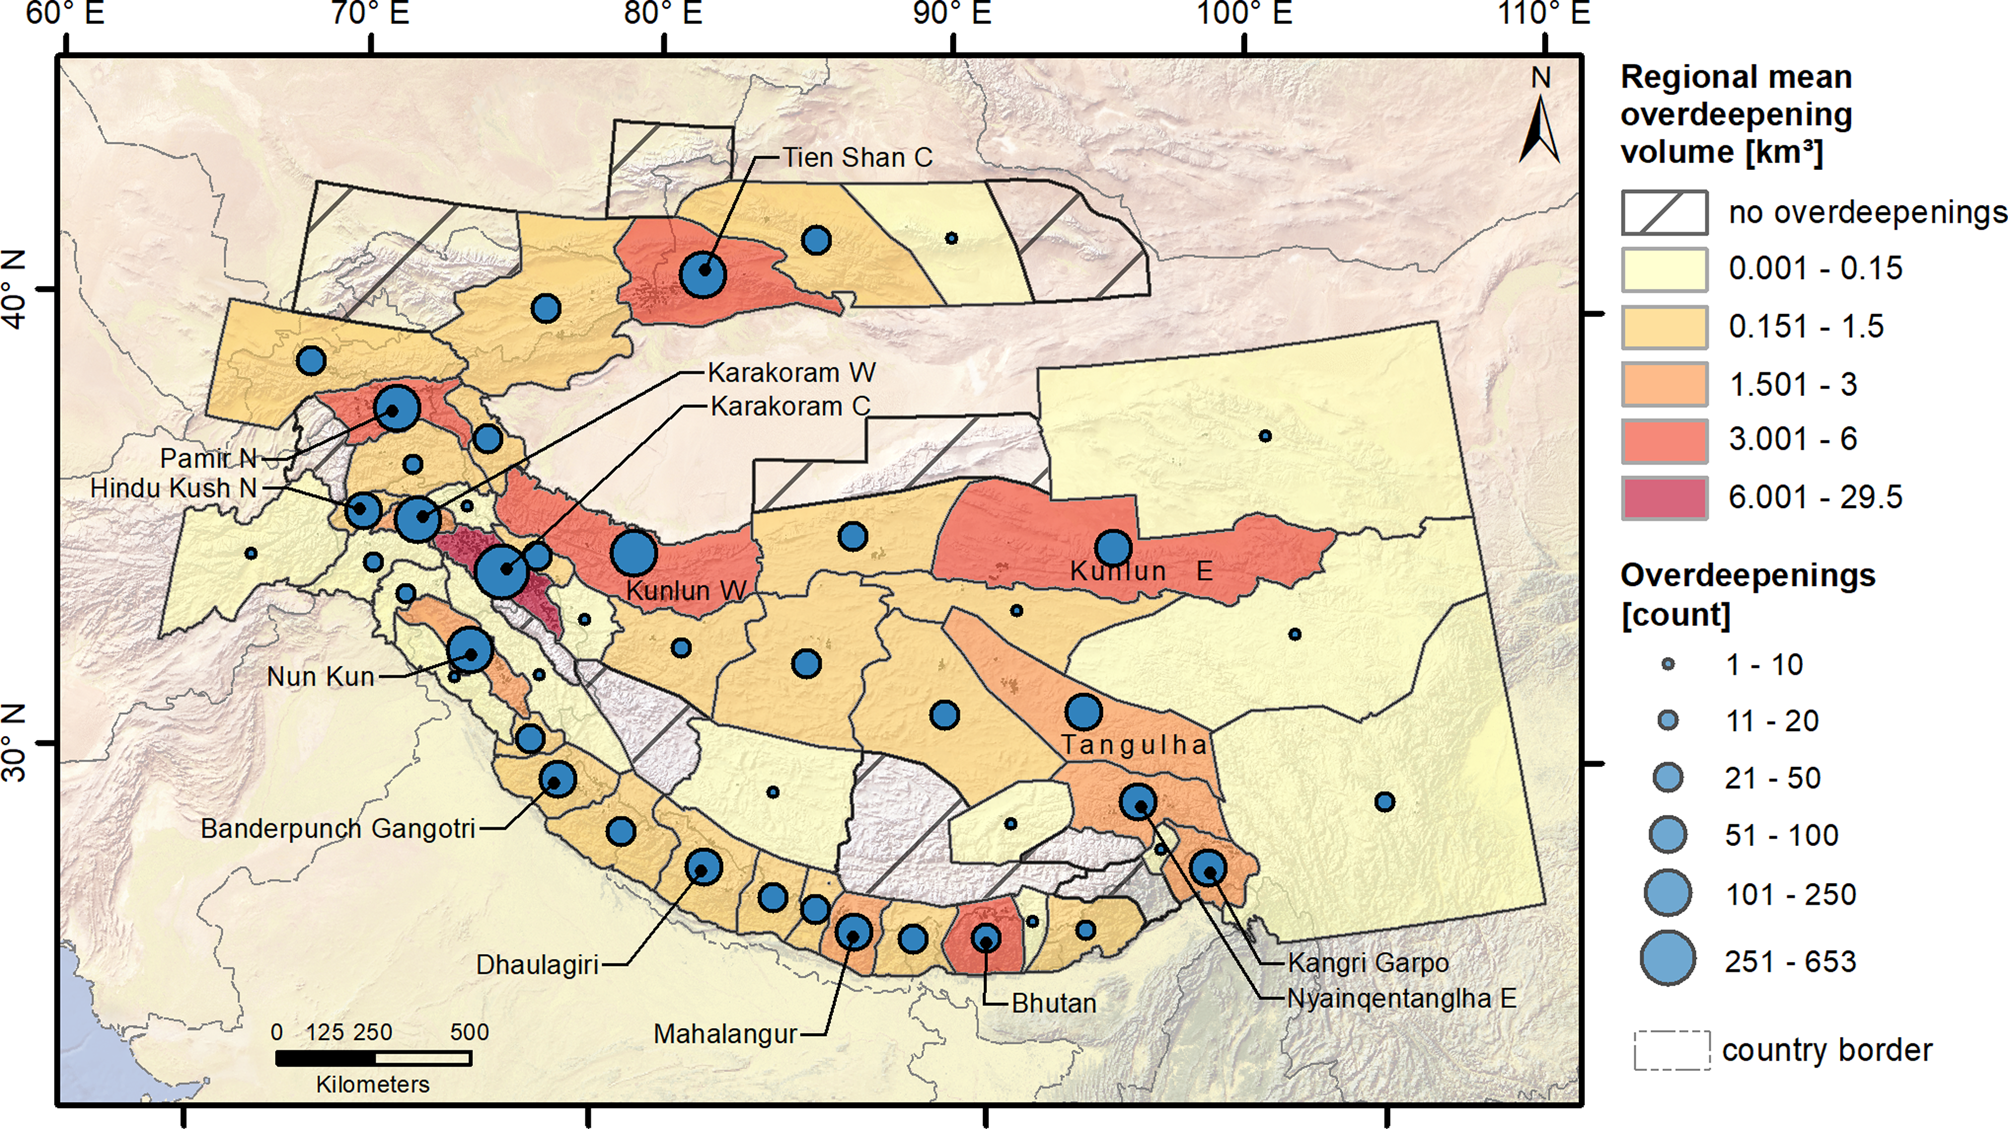
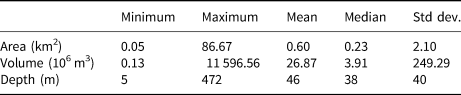
In the computed subglacial bedrock, we find 25 285 overdeepenings with a surface area >104 m2 and a total volume of 99.1 ± 28.6 km3 covering 2683 ± 773.8 km2. Applying the 105 m2 threshold leaves 2700 overdeepenings in the bedrock of 669 glaciers, with 2257 being larger than 106 m2. Overdeepenings larger than 105 m2 cover an area of 1623 ± 468 km2 which is 1.18–2.14% of today's glacierized area. Their volume of 72.6 ± 20.9 km3 equals 0.74–1.33% of the current glacier volume estimated by Farinotti and others (Reference Farinotti2019a). A total of 1535 future lakes (57%) can be classified as ‘deep lakes’ with a depth of more than 30 m (NELAK, 2013). Altogether, 16 overdeepenings >105 m2 (0.6%) were marked for manual validation because of a depth >300 m. With depth values ranging from 1028 to 2223 m, five overdeepenings are automatically excluded for crossing the threshold (depth >1000 m). Supplementary Figure S1 shows some of those overdeepenings that are clearly affected by artifacts in the DEM. Another eight overdeepenings, with depths ranging from 308 to 719 m, were excluded because of clearly visible void fill errors in the AW3D30 DEM data. In case of doubt, comparisons with Landsat surface reflectance images provided additional indications, as some erroneous overdeepenings were placed across mountain ridges. Only three overdeepenings marked for manual validation (300, 308 and 472 m depth) were kept after this step to verify values of extreme overdeepening. Figure 4 shows the spatial distribution of computed overdeepenings >105 m2 over HMA. Clearly visible are the regional differences between highly glacierized rugged mountain ranges (e.g. the Central Karakoram, Central Tien Shan and Pamir) and regions with less extreme relief (e.g. the Gangdise, Qilian or Hengduan). Supplementary Table S1 provides a TRI-based terrain comparison for selected regions. Statistics for the most important morphological features of the computed overdeepenings are summarized in Table 2.
Identified subglacial bedrock overdeepenings (>105 m2) per region and cumulative overdeepening volume.
Summary statistics for subglacial bedrock overdeepenings (surface area >105 m2) in HMA
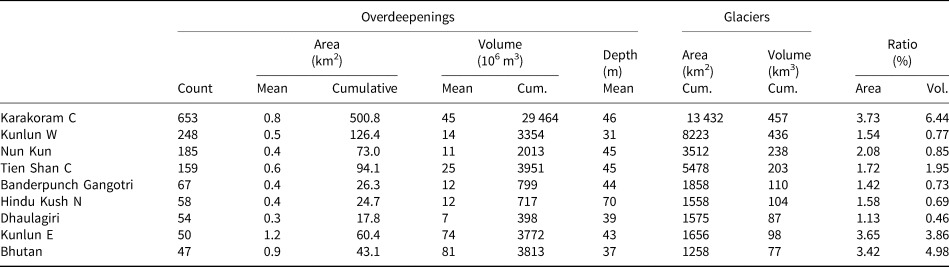
By far the most (653) and biggest (29.5 ± 8.5 km3) overdeepenings are located in the Central Karakoram, accounting for about one-quarter of the total number of overdeepenings. However, owing to the abundance of glaciated surfaces, overdeepenings cover only 5.5% of the currently glacierized area in the Central Karakoram. In comparison, the 51 overdeepenings in eastern Kunlun cover 16% of the local glacierized area. Nevertheless, overdeepenings in Central Karakoram account for 18.7% of the area and 29.6% of the total volume of all overdeepenings in HMA, owing to a number of very large lakes.
Besides the dominant Central Karakoram, there are other regional differences to be found regarding the morphometric characteristics of overdeepenings. Table 3 lists selected regions (see Supplementary Table S2 for all regions) that stand out regarding their relationships between overdeepening area/volume and their current glacierized area/total ice volume. Particularly for the Nun Kun Range, Banderpunch Gangotri and the Dhaulagiri region, the volume ratio is smaller than the area ratio. In general, this indicates shallower overdeepenings for the western part of the Himalaya. The same applies for the northern Hindu Kush and the western Kunlun. In contrast, for the Central Karakoram the volume ratio is larger than the area ratio, suggesting relatively deep overdeepenings. For the Central Tien Shan, eastern Kunlun and Bhutan the same is true in attenuated form. Furthermore, the eastern Kunlun and Bhutan stand out due to a relatively low number of overdeepenings in combination with a comparably high volume and area ratio. In both regions, this can be explained by a relatively small glacierized area in combination with few very large overdeepenings beneath glacier tongues.
Statistics for glaciers and overdeepenings (surface area >105 m2) in selected regions of HMA
4.2 Hazard classifications
Over the entire HMA, we classified 8516 km2 as hazardous slopes around future glacial lakes. Approximately half of those slopes (48.4%) are mapped within exposed glacier beds. The HMA-wide mean slope hazard forms a mesokurtic distribution with a mean of 0.49, a std dev. of 0.1, and a skewness of −0.4 (Fig. 5). As such, the data relatively closely resembles a normal distribution indicating equilibrated results produced by the algorithm. Expectably, the leptokurtic distribution of the maximum hazard is skewed even further to the left with a mean of 0.7 and a std dev. of 0.17. The secondary peak at zero indicates 46 (1.7%) of the total of 2700 future lakes that were assigned an impact hazard of zero. The average angles of slopes adjacent to those lakes were <20° and, therefore, classified as not relevant. Occurring predominantly in the Kunlun Shan and Inner Tibet, these lakes are characterized by small average area and volume. Its specimens are often located in large cirques or in the central parts of large, flat glacial troughs. With a cumulative area of 17.5 km2 and a cumulative volume of 0.3 km3, they only make up 1.1% of the area and 0.4% of the volume of all overdeepenings in HMA and were thus excluded from further analyses.
Distribution of the mean and maximum lake hazard for all overdeepenings in HMA.
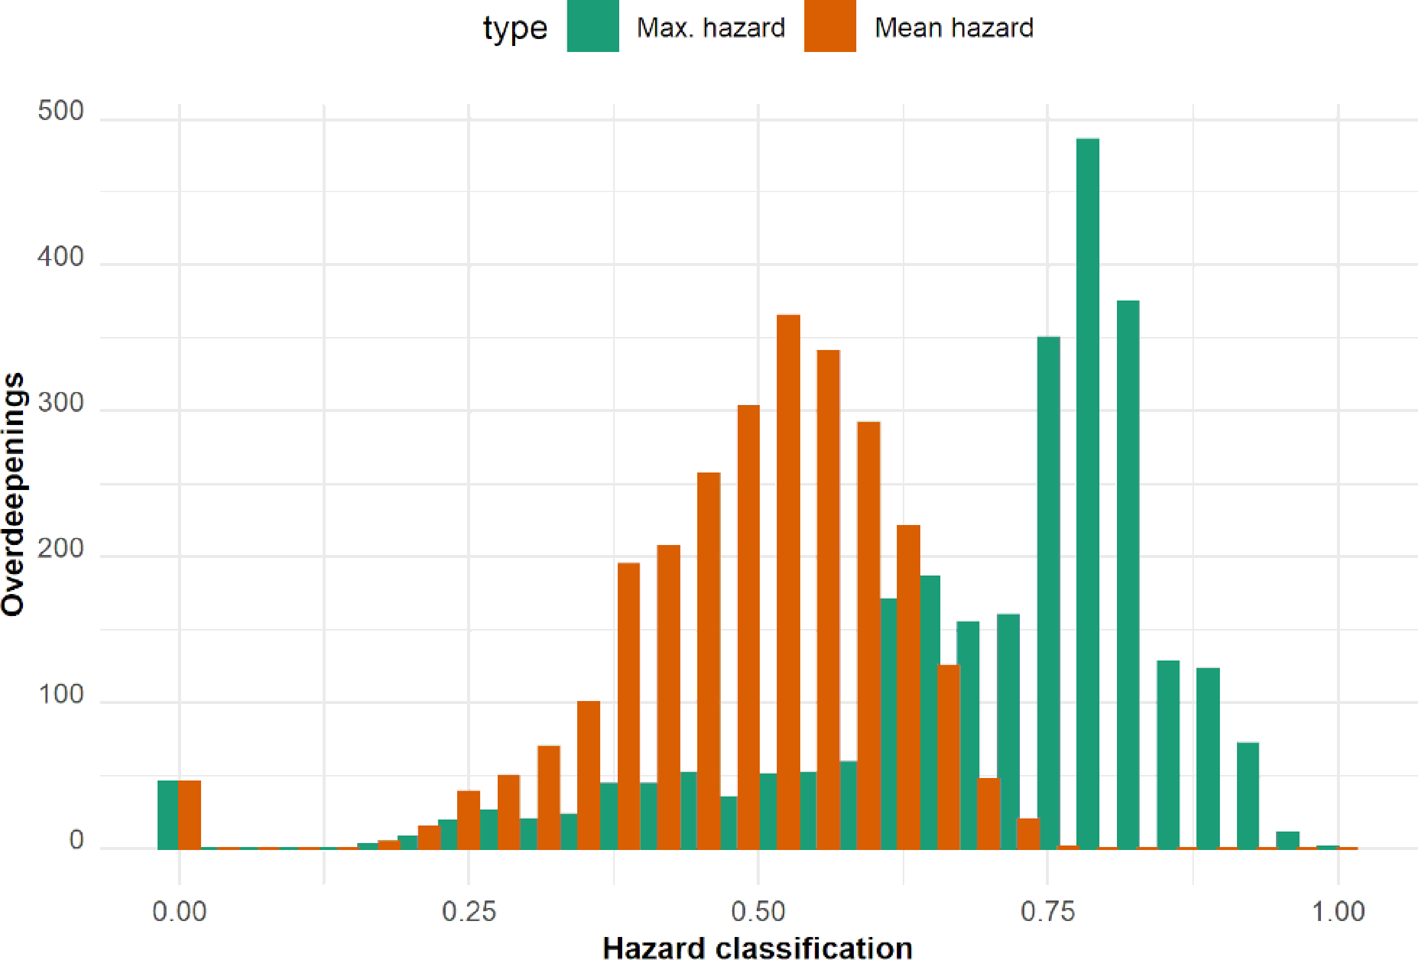
Figure 6 depicts two overdeepenings under Siachen Glacier, Karakoram and the hazard classification of their surrounding slopes to demonstrate the results of our algorithm. Notice that inlets of surface runoff streams from larger tributary valleys and the upper glacier bed (small black circles in Fig. 6) are used to exclude the associated catchments. Slopes belonging to the remaining catchment area of each overdeepening (black outline) are then classified according to the hazard of icefalls or rockfalls impacting the lake. With all areas with a slope <20° excluded, the yellow-to-red color ramp indicates the hazard from moderate (yellow) to very high (red). The division of the mountainsides into SU allows an in-depth analysis of the area surrounding a potential lake as the overall slope morphology can be reproduced following the different hazard scores. Larger, steeper slopes in close distance to the lake with high values for A, S and D receive higher scores. More gently sloping areas with low S values or areas in greater distance (low values for D) receive a lower hazard score.
Bathymetry of two overdeepenings under Siachen Glacier, Karakoram, and the results of the classification of all relevant SU inside the catchment area (dark outline). SU can be delineated by their gray outline and the different colors indicating their hazard score. Small black circles indicate the inlets of large tributary valleys that were excluded from the calculation.
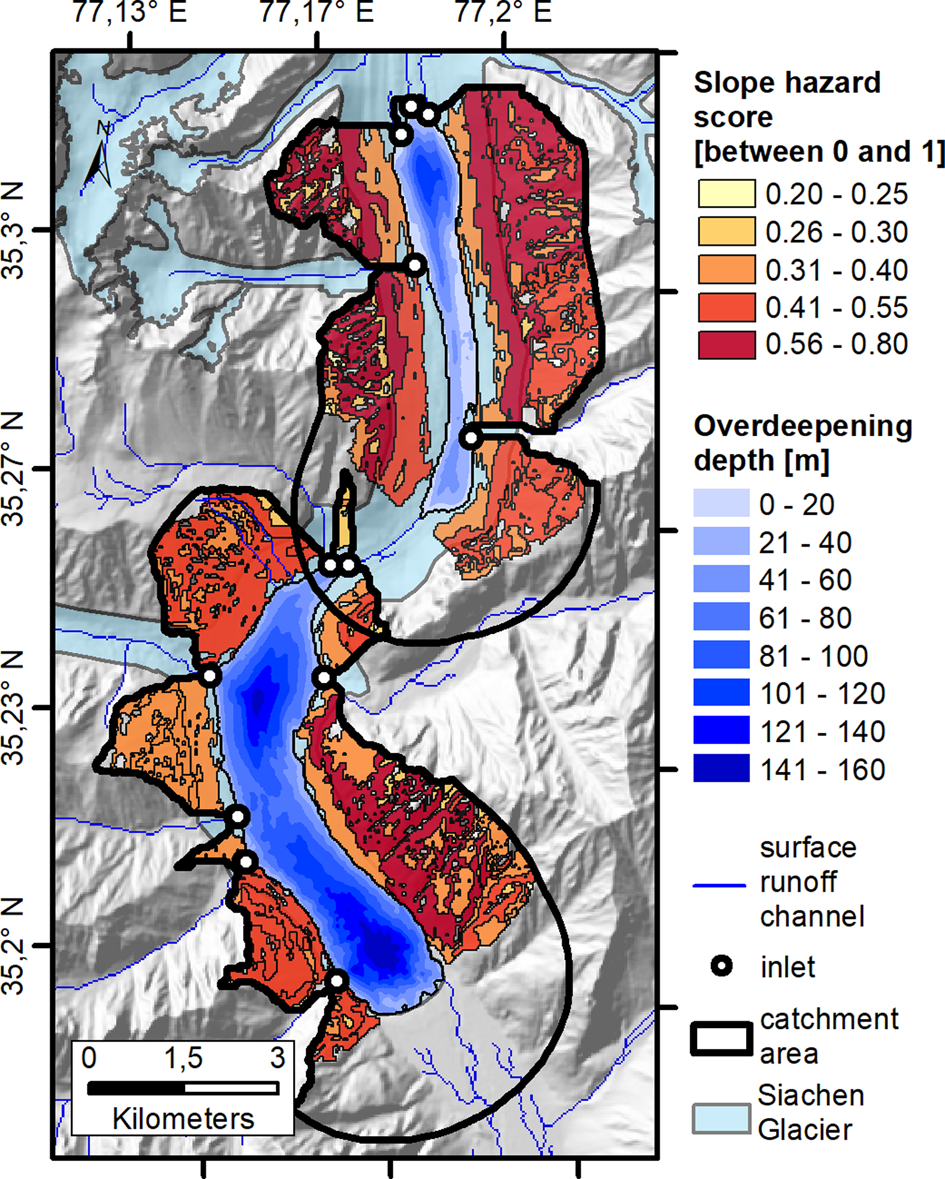
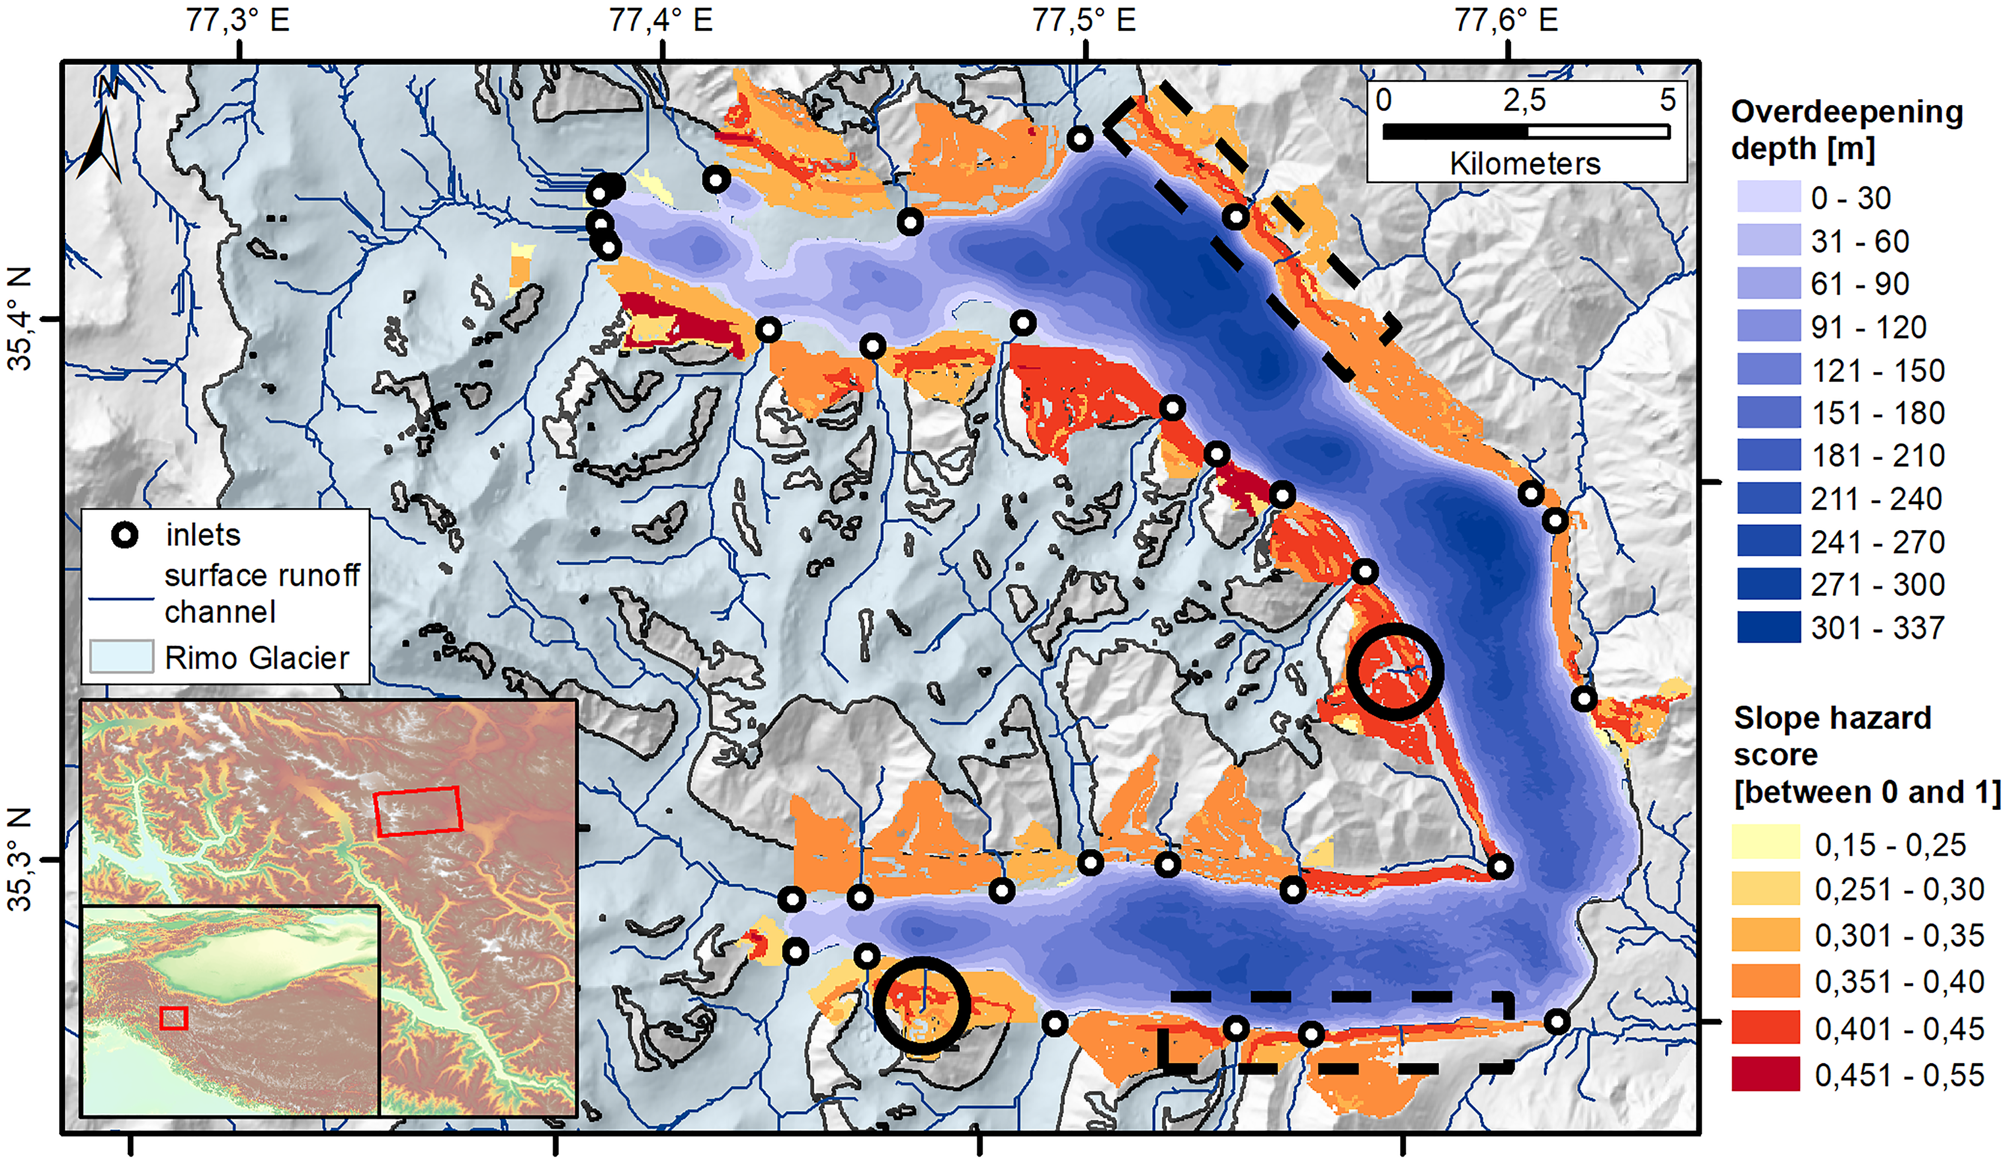
Figure 7 depicts a very large overdeepening, located beneath the glacier tongues of central and south Rimo Glacier, Karakoram, as another, more extreme example (see also Section 5.1). Noticeable are the tributary valleys of considerable size whose catchment areas are excluded from the hazard assessment. Those valleys are indicated by their inlets (black points in Fig. 7). Smaller, less incised lateral valleys, however, are included in the assessment as their slopes more directly point toward the lake and detached material is more likely to directly impact the lake. In Figure 7, these areas are indicated by black circles. Dashed black rectangles indicate the location of large, steep side moraines discernable by their higher score. They partly block the catchments behind from draining into the lake and would probably also be an obstacle in the way of a potential rockfalls or avalanches.
Bathymetry (blue colored) for the largest potential lake (11.6 km3) at Rimo Glacier, Karakoram, with hazard scores (yellow-to-red color ramp) for adjacent slopes. Smaller lateral valleys included in the slope assessment are indicated by black circles, excluded larger valleys by their inlets (black points). Dashed black rectangles show steep side moraines distinguishable by their higher hazard classification. Surface runoff channels are indicated by blue lines.
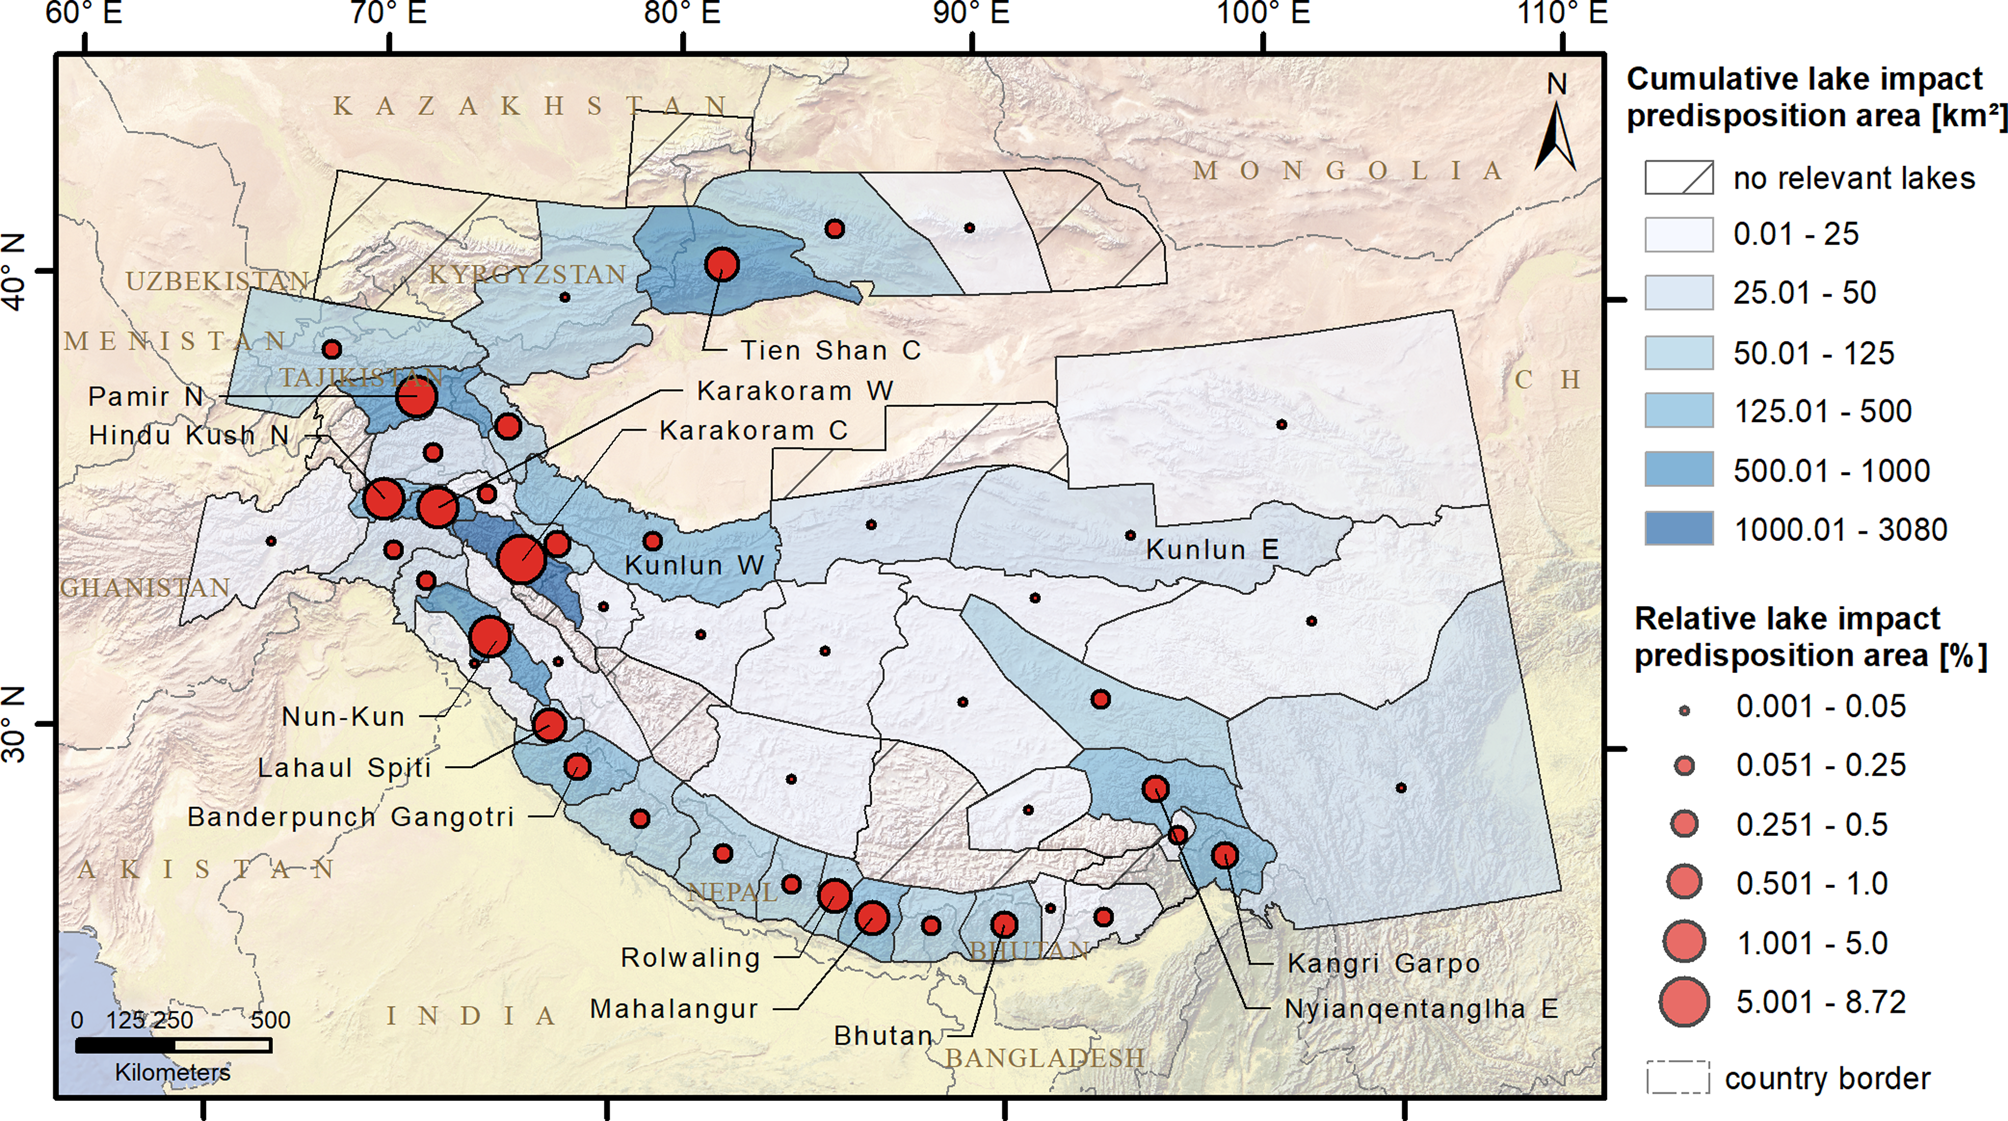
The analysis of the relevant slopes for all lakes on a regional scale, i.e. the cumulative LIPA (Fig. 8), shows a pattern similar to the distribution of the overdeepenings with a contrast between high mountain glaciers and glaciers in less rugged regions. In consequence, most areas with a large number of overdeepenings, such as the Tien Shan, the northern Pamir and the Nun Kun Range, also have comparably large LIPA. Conversely, only very few slopes are classified as LIPA in the eastern Kunlun, despite the region's relatively high number of overdeepenings. Again, the central Karakoram stands out with nearly 9% of its total area being a potential origin for mass movements that could impact future lakes.
Regional differences between absolute and relative LIPA for subglacial overdeepenings in HMA. The relative values reflect the percentage of LIPA for the whole subregion area.
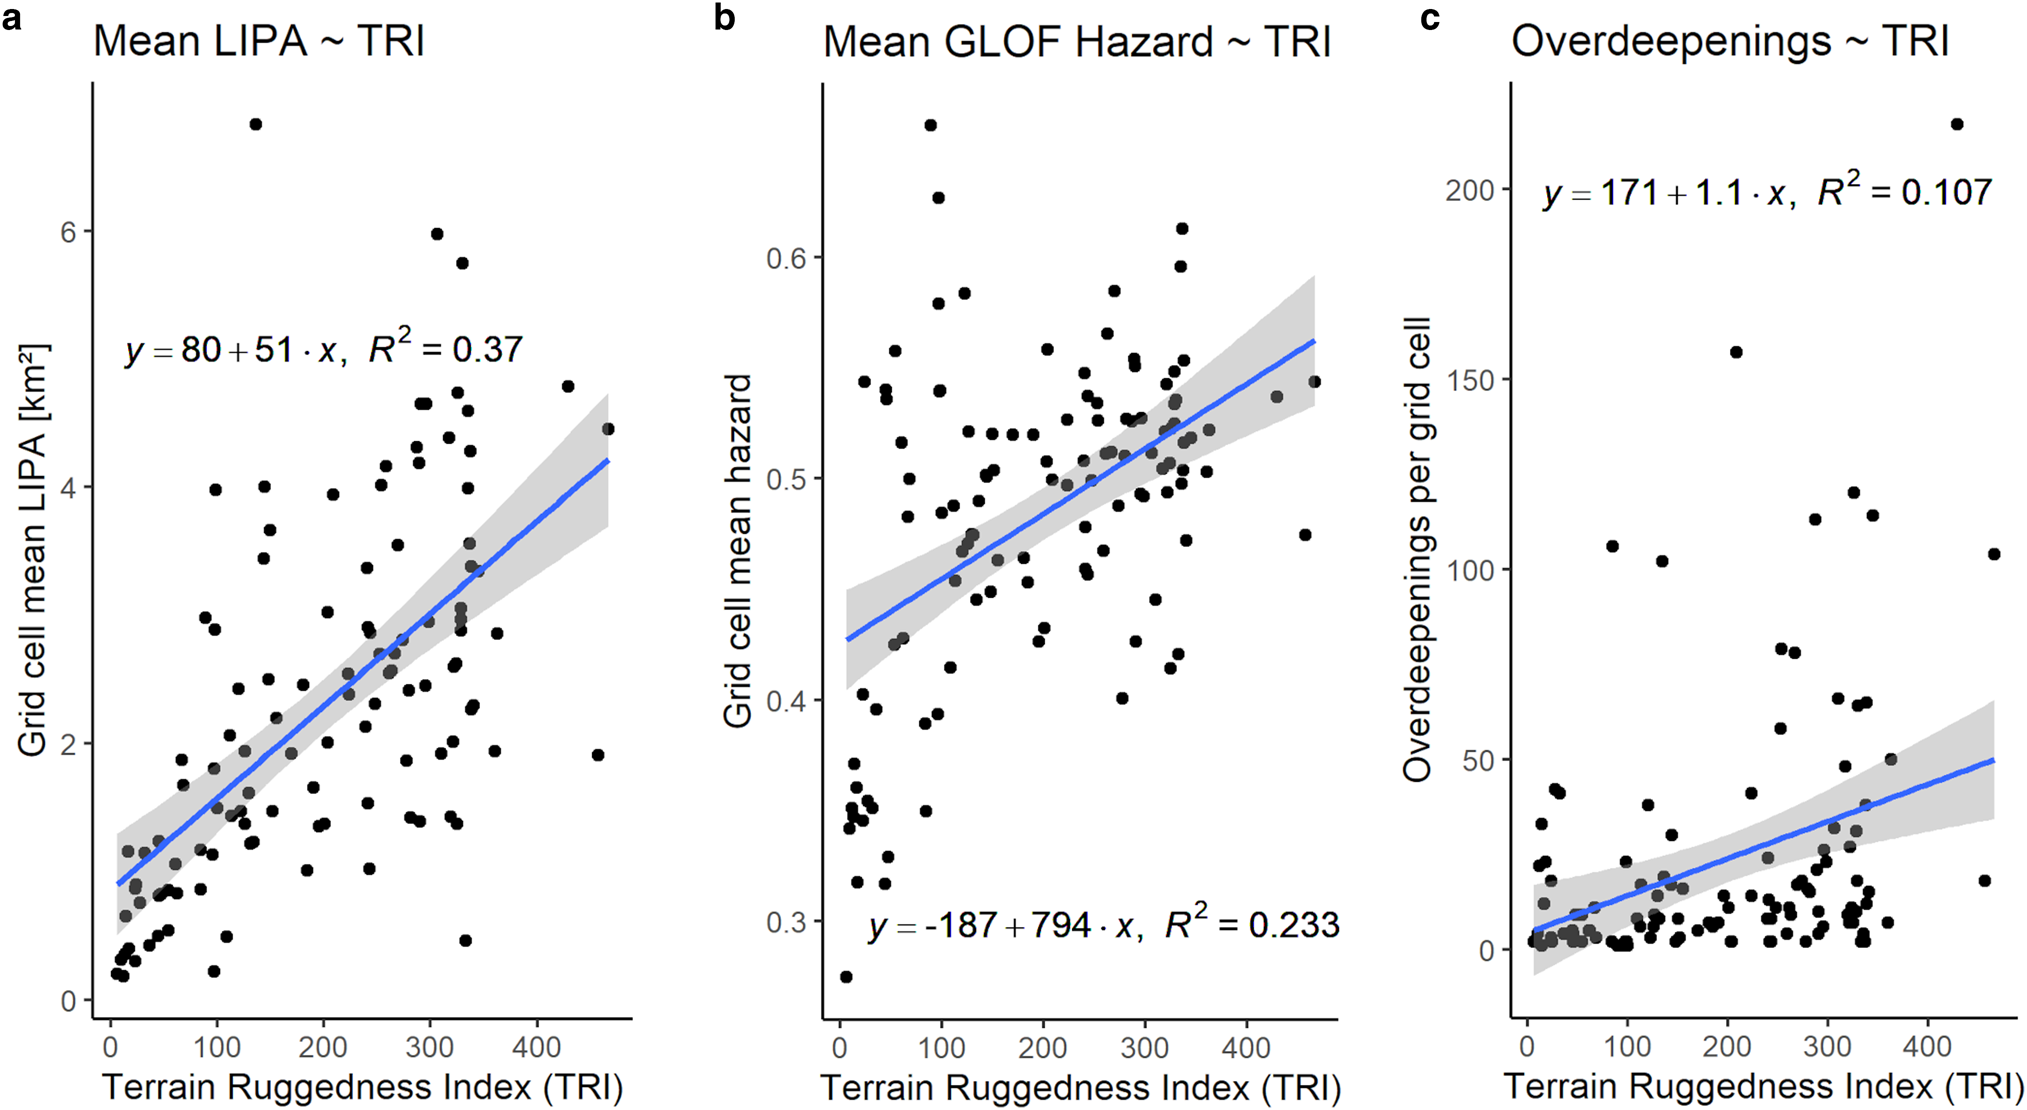
Spatial patterns of impact hazards are assessed based on a grid of 1° cells (see also Fig. 10). We calculated the mean gridcell TRI as well as the mean gridcell impact hazard. The latter serves as a proxy for the average impact hazard of all lakes within, i.e. their predisposition for mass-movement impacts. Through the analysis of all 112 gridcells, a weak yet statistically significant correlation can be found between the TRI of a gridcell and its mean LIPA (R 2 = 0.37; Fig. 9a). Hardly any correlations exist between the TRI and a gridcell's mean impact hazard (Fig. 9b) or its number of overdeepenings (Fig. 9c). However, the relationship between both variables and the TRI is significant. In contrast, overdeepening area, volume and depth show no significant correlation to the TRI, neither does the lake hazard level (LHL mean and LHL max), which combines a lake's impact hazard and its volume (see Supplementary Fig. S2 for further correlations).
Correlation between a gridcell's ruggedness and (a) its mean LIPA, (b) its mean hazard and (c) the number of its future lakes.
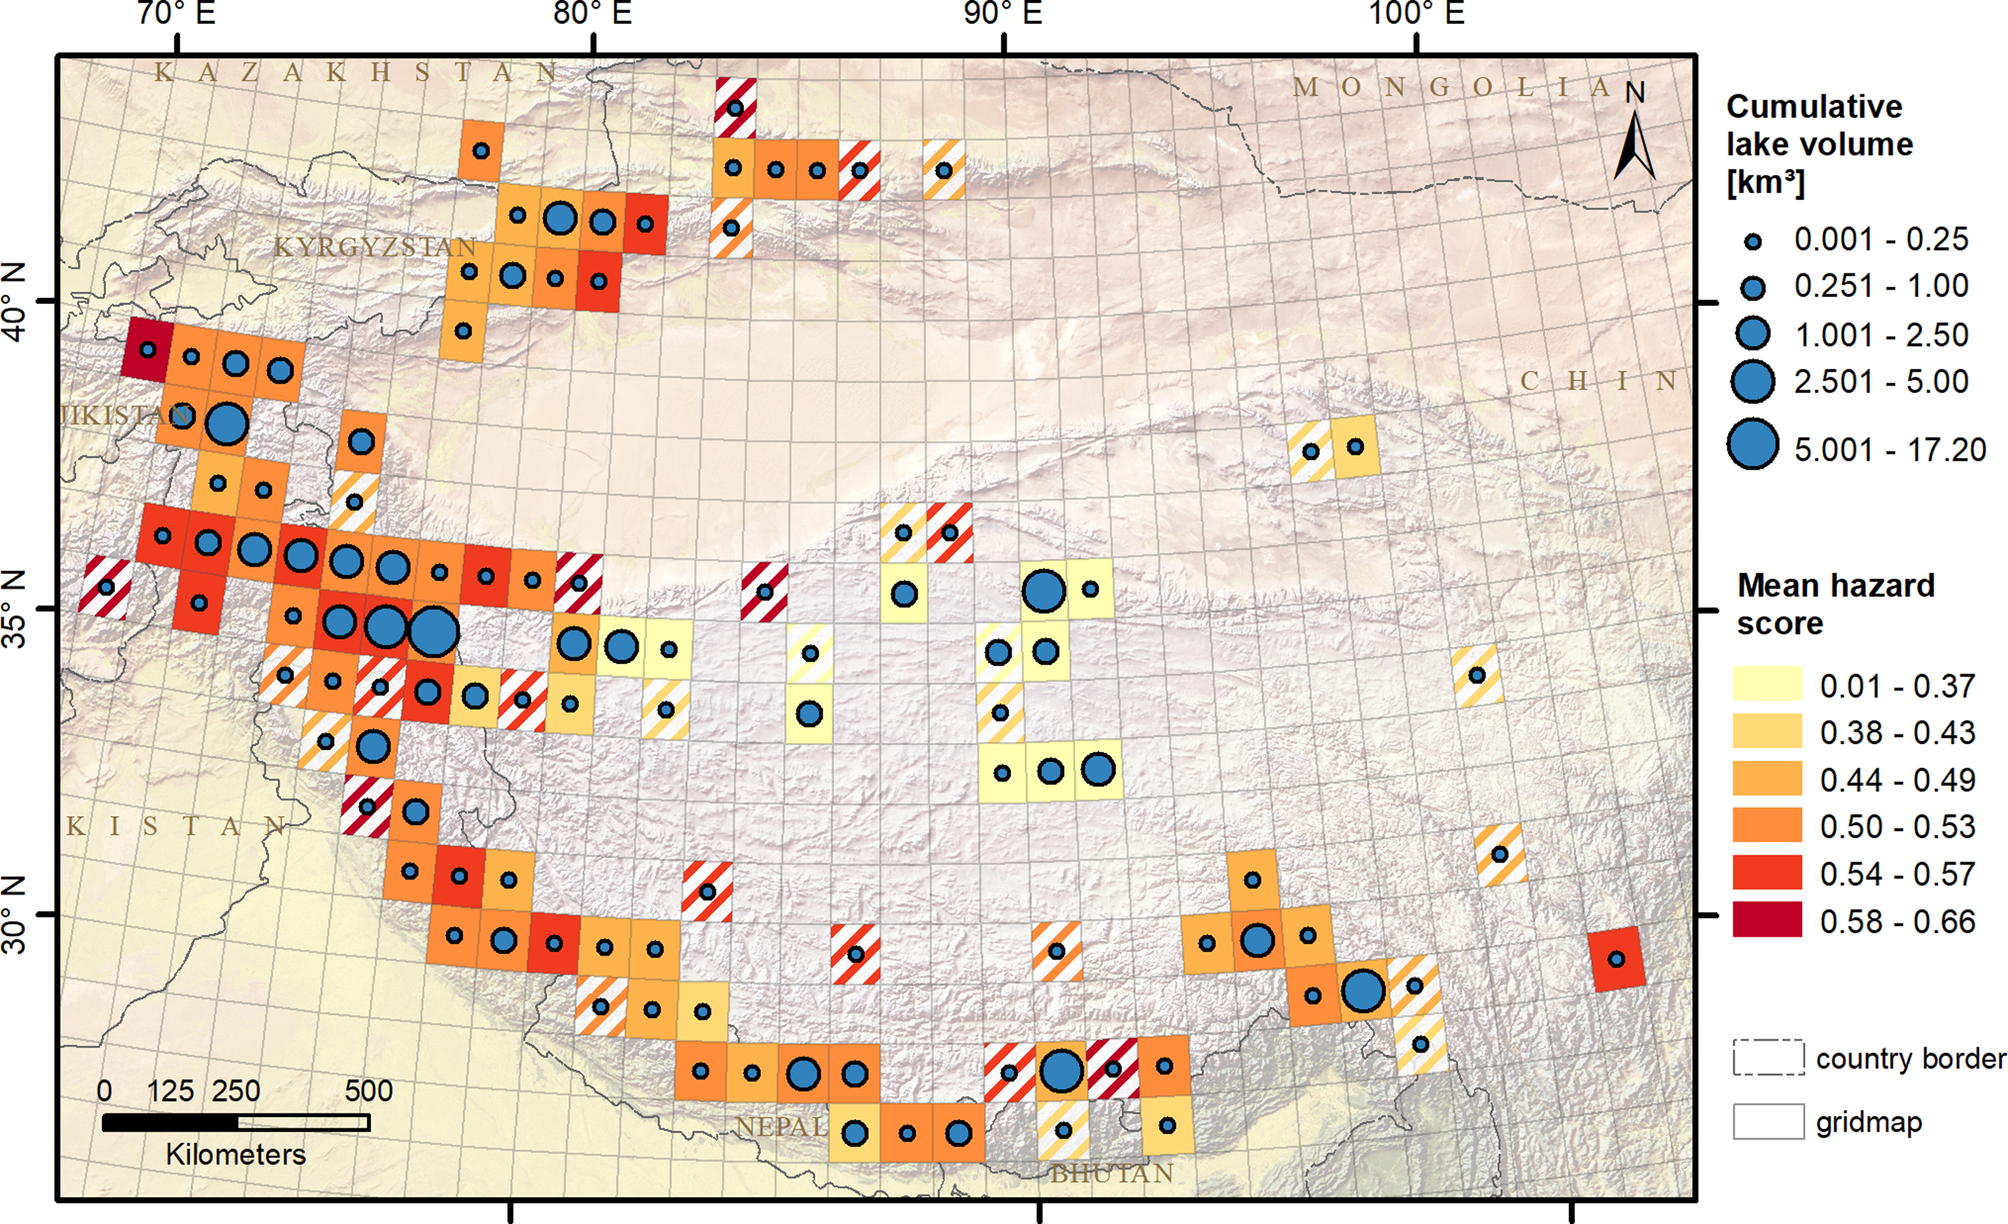
Clearly visible is the aforementioned contrast between the high-mountain glaciers of the Karakoram, Tien Shan Pamir and parts of the Himalaya on the one hand and the gently sloped glaciers and ice caps of Inner Tibet, the eastern Kunlun and the Qilian Shan on the other hand (Fig. 10). Lakes with higher impact hazard scores are mostly found in the high mountain ranges. Conversely, low impact hazard scores prevail on the less rugged topography of the Tibetan Plateau.
Gridcell-based spatial distribution of the mean future lake impact hazard in HMA and the associated cumulative potential future lake volume. Gridcells with fewer than five overdeepenings are symbolized by dashes.
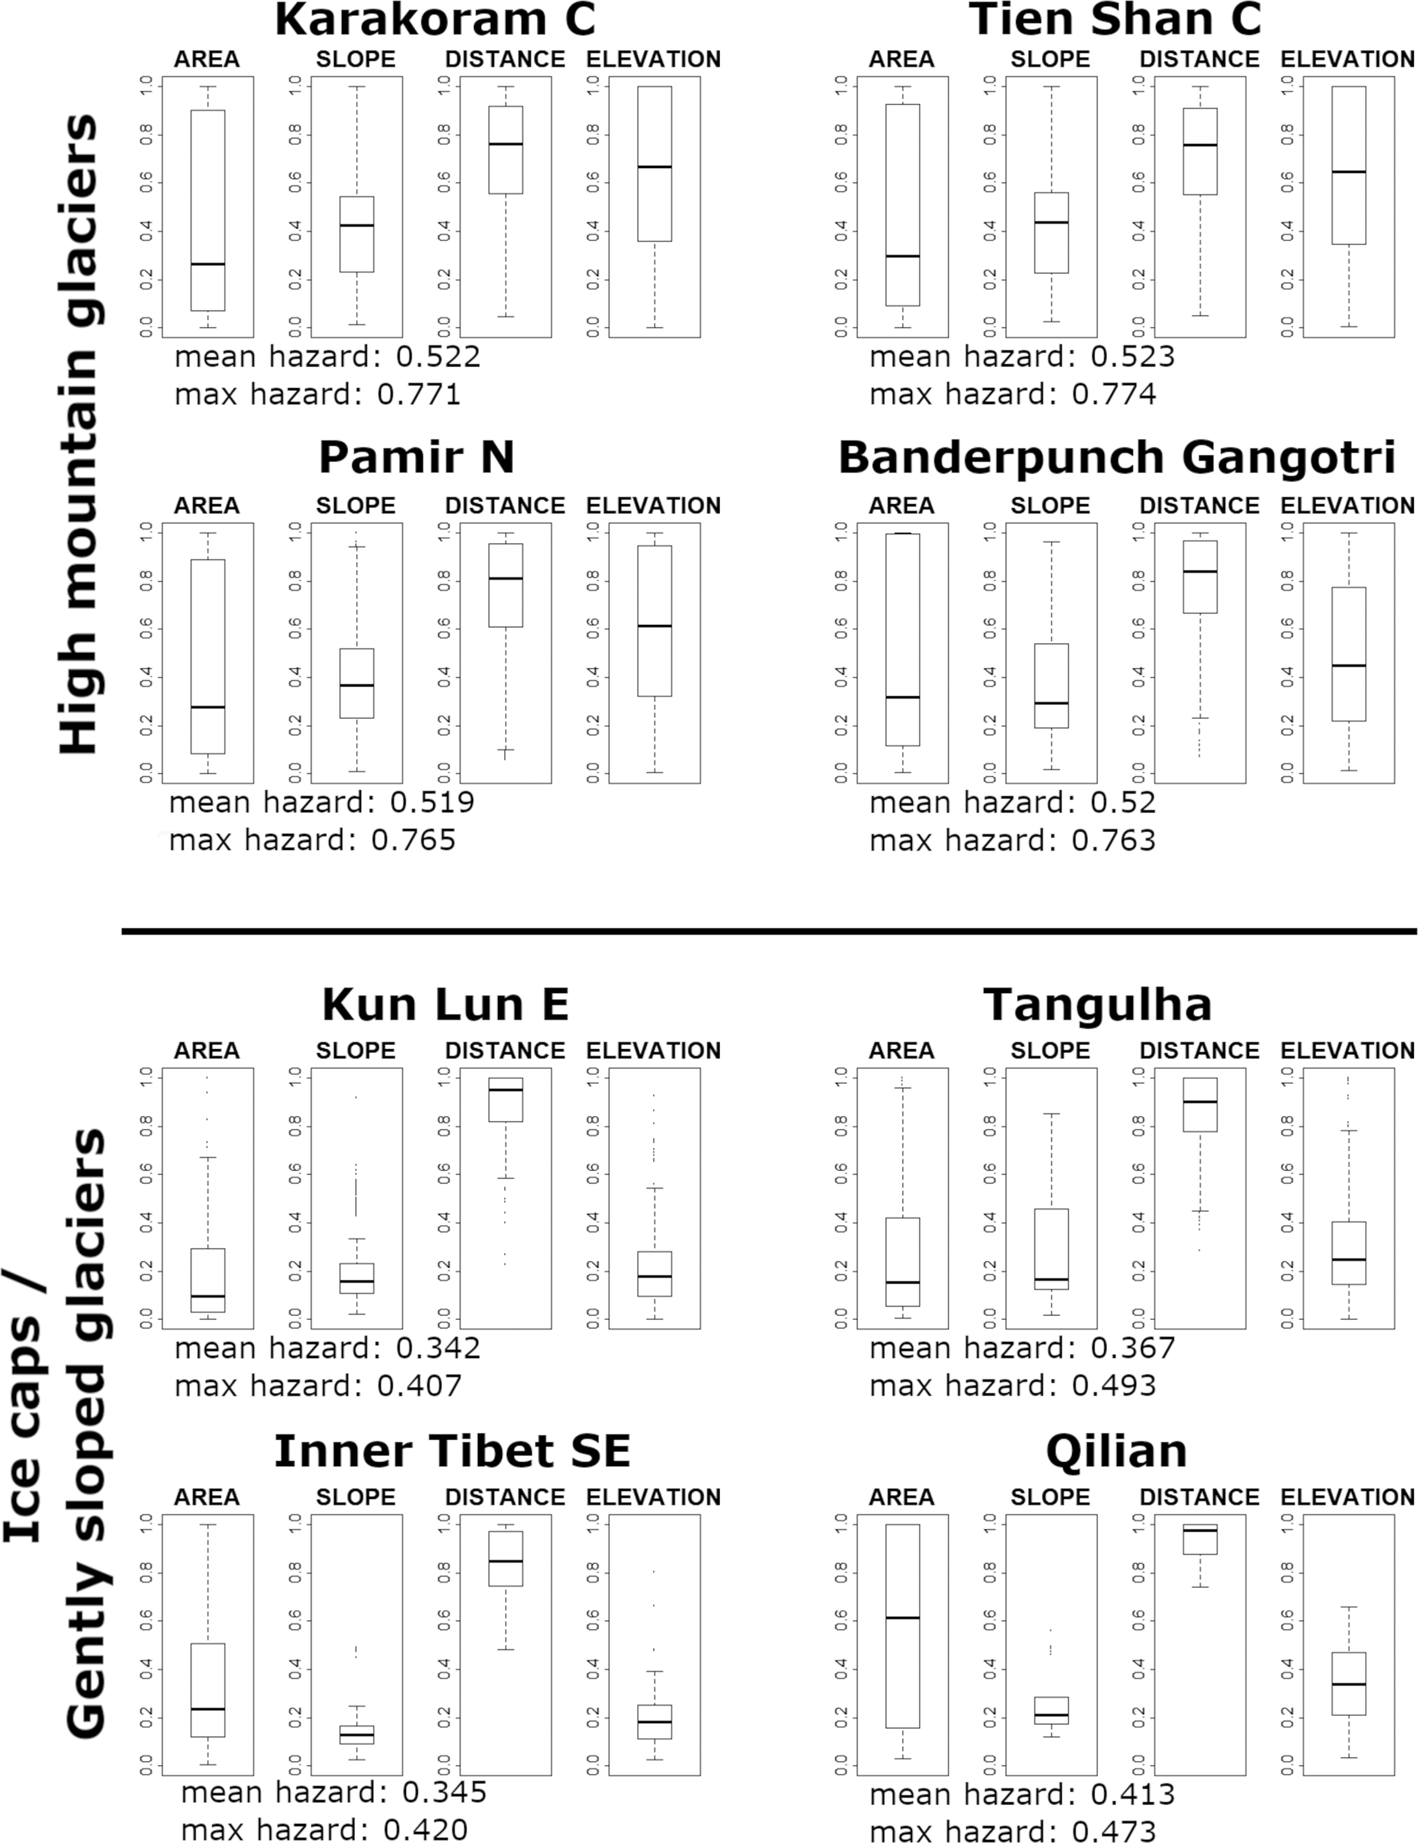
Parameter values of the impact hazard score for both high relief and low relief areas show noticeable similarities within their respective group, yet are very different from each other (Fig. 11). The same holds true for the region-wide mean impact hazard. In regions of less rugged topography, mountain slopes adjacent to overdeepenings tend to be relatively small and exhibit lower overall slope. The overall very high values for D (distance) indicate slopes in close proximity to the overdeepening whereas the very low values for E (elevation difference) reflect only minor differences between mean slope elevation and the calculated lake surface altitude. Therefore, lakes in these regions are expected to have a comparably low predisposition to mass-movement impacts. Moreover, the low maximum impact hazard indicates that most lakes are indeed surrounded exclusively by slopes with only a moderate probability of producing rockfalls or icefalls. In comparison, overdeepenings in higher altitudes are surrounded by slopes of varying areas A with higher overall slope S. In these settings, slopes are classified as hazardous up to greater distances from the overdeepening (high D) and display higher elevation differences to the lake surface altitude (high E). This results in a higher mean hazard for these regions. Also, the very high maximum hazard indicates that most lakes in higher altitudes are located close to at least one slope with a very high potential of generating mass movements in their direction.
Comparison of the four slope hazard classification parameters (area, slope, distance and elevation) in high-relief (upper half) and less extreme relief (lower half) regions of HMA as well as region-wide mean and maximum slope hazard classifications.
Considering the lake hazard level (both LHL mean and LHL max) as the combination of slope hazard score and potential lake volume, smaller lakes in high altitudes with low potential volume are contrasted by large overdeepenings under gently sloped glacier tongues. Although the former are assigned a low impact hazard due to their comparably low volume, the large proglacial lakes receive the highest impact hazard scores, always depending also on the properties of their surrounding slopes. The largest of these lakes are located in the Central Karakoram (20 lakes with a combined volume of 22.58 ± 6.52 km3), the Mahalangur region of the Himalaya (12 lakes with combined volume of 2.93 ± 0.85 km3) and the Northern Pamir (eight lakes with a total volume of 2.57 ± 0.74 km3).
5. Discussion
5.1 Data quality
This study benefits from recently published data that allows for a more robust computing of overdeepenings as well as for an impact hazard classification at a larger scale than previously possible. The quality of the glacier outlines in RGI v6 substantially improved since v4, which was used by Linsbauer and others (Reference Linsbauer2016). Still, there are some glaciers missing in the RGI or other inconsistencies in the data, however, they have only minor influences on the accuracy of the regionally computed glacial lake volumes. Frey and others (Reference Frey, Haeberli, Linsbauer, Huggel and Paul2010) proposed a four-level approach to assess the validity of computed subglacial overdeepenings. According to their findings, our results are categorized as a level-3 result, outperformed only by on-site measurements using drills and/or ground-penetrating radar. Despite significant uncertainties regarding the absolute values, level-3 data are expected to be a realistic estimate of lake area and volume as well as the lake bottom topography (Frey and others, Reference Frey, Haeberli, Linsbauer, Huggel and Paul2010).
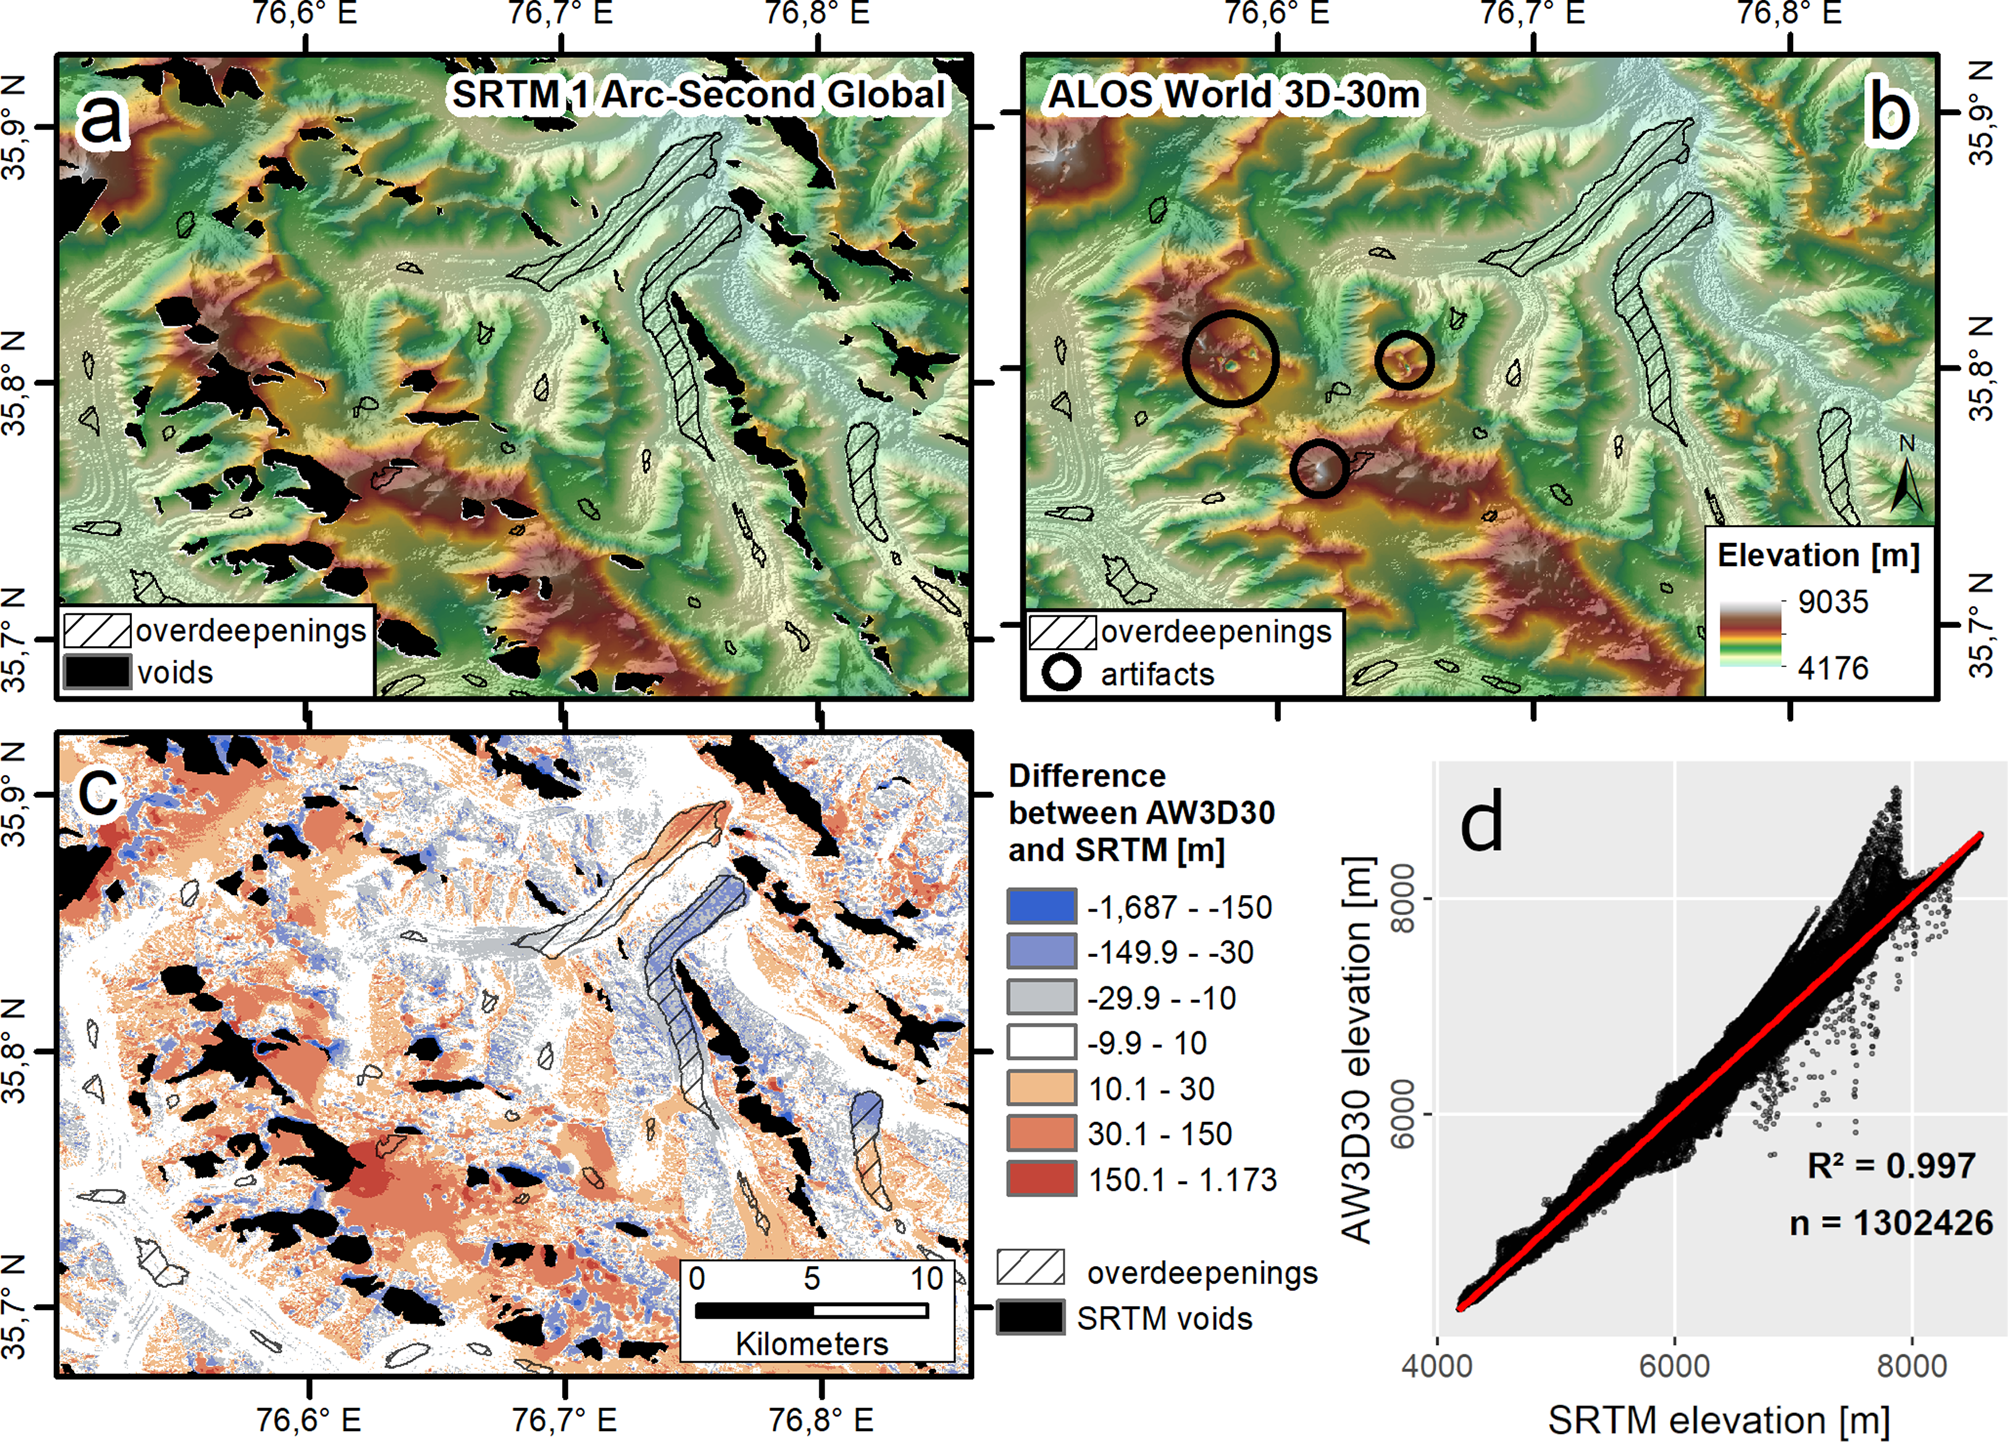
Figure 12 shows a comparison between SRTM and AW3D30 data in the Karakoram area (see Fig. 14 for an overview of the larger region). Black areas in Figure 12a indicate numerous voids in the SRTM data, which would lead to incomplete hazard classifications of nearby overdeepenings. Only small artifacts remain in the AW3D30 DEM as indicated by the black circles in Figure 12b. In general, this DEM tends to overestimate the terrain elevation over void-filled areas (Liu and others, Reference Liu2019), as can be seen by the maximum height of 9035 m. Even so, local underestimations can lead to unrealistically high depths of overdeepenings that have to be addressed (see also Supplementary Fig. S1). The difference raster (Fig. 12c) shows a good agreement of both DEMs (±10 m) for some of the wide flat glacier areas with smaller overdeepenings. However, for the large future proglacial lakes in the northeast, there are substantial differences between both DEM. In general, both datasets have a very high correlation, although it depends on the elevation (Fig. 12d). Figures 12c and d indicate that, especially in higher and more rugged areas, the SRTM DEM differs substantially from the AW3D30. The AW3D30 dataset is expected to be a more realistic portrayal of the actual terrain (Liu and others, Reference Liu2019; Guan and others, Reference Guan2020).
Data quality comparison between the SRTM and the AW3D30 DEM in the Karakoram area. (a) Numerous voids in the SRTM DEM are indicated by black areas. (b) Small artifacts in void-filled regions in the AW3D30 DEM are indicated by black circles. (c) Difference raster between both DEM. (d) Raster value scatterplot for both DEM showing growing differences with increasing elevation. SRTM 1 arc-second Global DEM data provided by EROS (2017).
In general, the AW3D30 DEM improves the quality of our computed overdeepenings due to its so far unmatched accuracy in HMA, especially in higher areas. As the lowest future lakes investigated in this study are located ~2200 m, AW3D30 is best suited for our purpose. Due to the higher quality of the DEM, we also eliminate some of the erroneous void filling that posed challenges in previous analyses of future lakes in HMA conducted with SRTM data (Linsbauer and others, Reference Linsbauer2016) or ASTER data (Allen and others, Reference Allen, Singh, Schickhoff and Mal2016). Thus, and following Frey and others (Reference Frey, Haeberli, Linsbauer, Huggel and Paul2010), we assume the results of our overdeepening mapping to be based on realistic estimations of glacier bed morphology. The vertical accuracy of the AW3D30 is only available HMA-wide as an MAE of 2.79 m (Liu and others, Reference Liu2019). Thus, the relative uncertainty for each single glacier solely depends on its ice thickness. With glaciers large enough for overdeepenings >105 m2 of surface area to form in their bedrock, the mean additional uncertainty of 2.9% is only a minor factor. For glaciers with overdeepenings >104 m2, the mean uncertainty rises by 6.5% and for all other, even smaller glaciers in HMA it rises by 10.9%.
Uncertainties in the calculated DEM of subglacial topography mainly originate from the employed ice thickness data. Due to the global scope of their study, Farinotti and others (Reference Farinotti2019a) do not provide uncertainties for each glacier individually but composite values per RGI region. Therefore, it remains unclear how the given uncertainty values for each RGI region relate to, e.g. glacier type, size or location. Whether the cumulative uncertainty for HMA (28.8%) is an over- or underestimation for larger glaciers as investigated in this study cannot be determined. However, as the accuracy of composite ice thickness data is substantially improved compared to the results of single models (Farinotti and others, Reference Farinotti2017), we expect the accuracy of our overdeepening and slope mapping to be comparably high.
Due to the fact that the ice thickness estimates of Farinotti and others (Reference Farinotti2019a) are based on SRTM v4 data, void-filling errors still factor into the uncertainty of our results, the exclusion of especially affected overdeepenings notwithstanding. Moreover, half of the mapped slopes (48.4%) are located inside the exposed glacier bed. Despite our realistic estimate of lake bottom topography, the morphology of those slopes is subject to higher uncertainties as it is not directly based on the AW3D30 DEM but on SRTM v4 data and the ice thickness modeled by Farinotti and others (Reference Farinotti2019a). In most cases, such slopes within the exposed glacier bed are adjacent to small lakes in heavily glaciated areas in the high mountains. Conversely, large proglacial lakes in most cases fill up the whole glacier bed and are primarily surrounded by slopes represented by the AW3D30 data. As a result, SRTM uncertainties mainly increase the uncertainty regarding the hazard classifications of smaller lakes in the high mountains and do hardly factor into the uncertainty for larger proglacial lakes. In general, our results confirm morphological characteristics and the surface area for larger overdeepenings in the Himalaya–Karakoram range (RGI zone 14) presented by Linsbauer and others (Reference Linsbauer2016). However, we are not able to reproduce the number of overdeepenings and the total volume calculated in this previous study. Linsbauer and others (Reference Linsbauer2016) mapped ~16 000 overdeepenings with a combined volume of ~120 km3 whereas our study found 8744 (55%) overdeepenings with a total volume of 44.8 km3 (37%) in the Himalaya–Karakoram range. As fully reproducing the results of Linsbauer and others (Reference Linsbauer2016) would exceed the scope of this study, we assume the differences are predominantly caused by two factors: (1) the lower resolution and abundant void-filling artifacts in the SRTM v4 data used by Linsbauer and others (Reference Linsbauer2016) and (2) the different ice thickness estimates of both studies. The ice thickness dataset used in this study was calculated by Farinotti and others (Reference Farinotti2019a) based on an ensemble of five models, including the GlabTop2 model used for the ice thickness calculations by Linsbauer and others (Reference Linsbauer2016). According to Farinotti and others (Reference Farinotti2017, Reference Farinotti2019a), ice thickness model ensembles significantly improve robustness and accuracy of the findings over individual models that are more prone to suffer from substantial uncertainties. Still, larger errors for individual glaciers are possible despite overall robust and accurate regional thickness estimates. Spatially, higher overdeepening volumes in the dataset by Linsbauer and others (Reference Linsbauer2016) prevail in the western Himalaya and the Karakoram and thus coincide with the region of most abundant void-filling errors in the SRTM dataset. The most pronounced example is the large (50 km2) overdeepening under the central Rimo Glacier (Fig. 7): with a volume of 11 km3 it contains 9.2% of the total overdeepening volume calculated by Linsbauer and others (Reference Linsbauer2016). We estimate this overdeepening's area to be 86.6 km2, assuming a confluence of the two overdeepenings under central and south Rimo Glacier. With only 57.7% of the area according to our study, Linsbauer and others (Reference Linsbauer2016) still estimated nearly the same overdeepening volume (11 km3) as we found in our study (11.6 km3). Presumably, this is due to a calculated depth of 588 m in their study compared to 329 m in our study. Due to the smaller surface area, this indicates a much larger overdeepening and excess overdeepening volume by ~4.3 km3 by Linsbauer and others (Reference Linsbauer2016).
5.2 Overdeepenings
The 25 285 overdeepenings with an individual area of >104 m2 cover 2683 ± 773.8 km2 and indicate a potential increase in the number of glacial lakes in HMA of ~100 and 170% according to current lake estimates by Wang and others (Reference Wang2020) and Reference Chenin press, respectively. This corresponds to an expected increase in lake area of 150% to 170%. The mean glacial lake area, currently estimated to be 0.06–0.1 km2, is projected to increase up to 0.6 km2. Besides the expected growth of current glacial lakes, this corroborates a trend found by previous studies, indicating future glacial lakes are going to be larger than already existing ones (Linsbauer and others, Reference Linsbauer2016; Wang and others, Reference Wang2020). Exact timescales for the development of future lakes are highly uncertain. However, it is possible to provide an approximate time span for lakes located in the glacier ablation area, which in this context can be considered as the area below the mean glacier elevation, following Braithwaite and Raper (Reference Braithwaite and Raper2009). With constant rates of glacier retreat, the Karakoram is expected to lose 50–75% (relative to 1985) of its glacier mass by 2035 (Cogley, Reference Cogley2011) which would uncover the glacier bed of most glaciers in this region. Following this estimate, many large proglacial lakes will develop over the next two decades in this region of HMA. This is especially important as these lakes account for a significant fraction of both the total lake area and the total lake volume found by this study and could pose a significant threat to local infrastructure (see also Section 5.4). When calculating the overdeepening volume, we regard every overdeepening to be fully filled which, at times, may overestimate the actual volume. Similar to other studies (Allen and others, Reference Allen, Singh, Schickhoff and Mal2016; Colonia and others, Reference Colonia2017), we regard the results as a reliable average that accounts for lakes that are not fully filled as well as lakes surrounded by moraine dams that possibly fill up to a higher level. In HMA, the latter case is likely especially close to existing glacier tongues due to high debris availability (Kirkbride, Reference Kirkbride, Singh, Singh and Haritashya2011; Kääb and others, Reference Kääb, Berthier, Nuth, Gardelle and Arnaud2012).
Currently, the central and eastern Himalaya, particularly Bhutan and Nepal (Fig. 13b) are considered the GLOF hotspots of HMA with glacial lakes being about two orders of magnitude larger than in the less affected western parts, e.g. the Karakoram, Hindu Kush or Pamir (Gardelle and others, Reference Gardelle, Arnaud and Berthier2011; Veh and others, Reference Veh, Korup, von Specht, Roessner and Walz2019) (Fig. 13a). In the Karakoram, smaller supraglacial lakes prevail (>90%) whereas in Bhutan and Nepal, the majority (~75 and 85%, respectively) are fast-growing proglacial lakes (Gardelle and others, Reference Gardelle, Arnaud and Berthier2011). Our assessment suggests that the hotspot of large glacial lakes (>105 m2) will shift toward the northwest in the future. In part, this is just due to the fact that there are more and larger glaciers yet to melt in the Karakoram region as many of them are stagnant or retreating at a much slower pace than in the Himalaya. Therefore, this region offers a higher potential for the development of future glacial lakes. Another factor could be the comparably high percentage of surging glaciers in this region. However, data on surge-type glaciers in the RGI v6 are still fragmentary. Of the 669 glaciers with overdeepenings, only 84 (13%) are given a data entry regarding their surge classification. Unfortunately, surging was only observed at 36 of those glaciers and could be possible at another 28 glaciers. With data this sparse, a mathematical correlation between overdeepenings and the occurrence of surge-type glaciers cannot be carried out while visual interpretation remains highly speculative. Thus, this issue needs to be investigated further.
Comparison of (a) the potential future and (b) the current glacial lake hotspots in HMA. The lake distribution is expected to shift from the southeastern Himalaya (b) toward the Karakoram and Pamir (a). The mapped current glacial lakes are a composite of the Hi-MAG database by Chen and others (in press) and the lake inventory of Wang and others (Reference Wang2020).
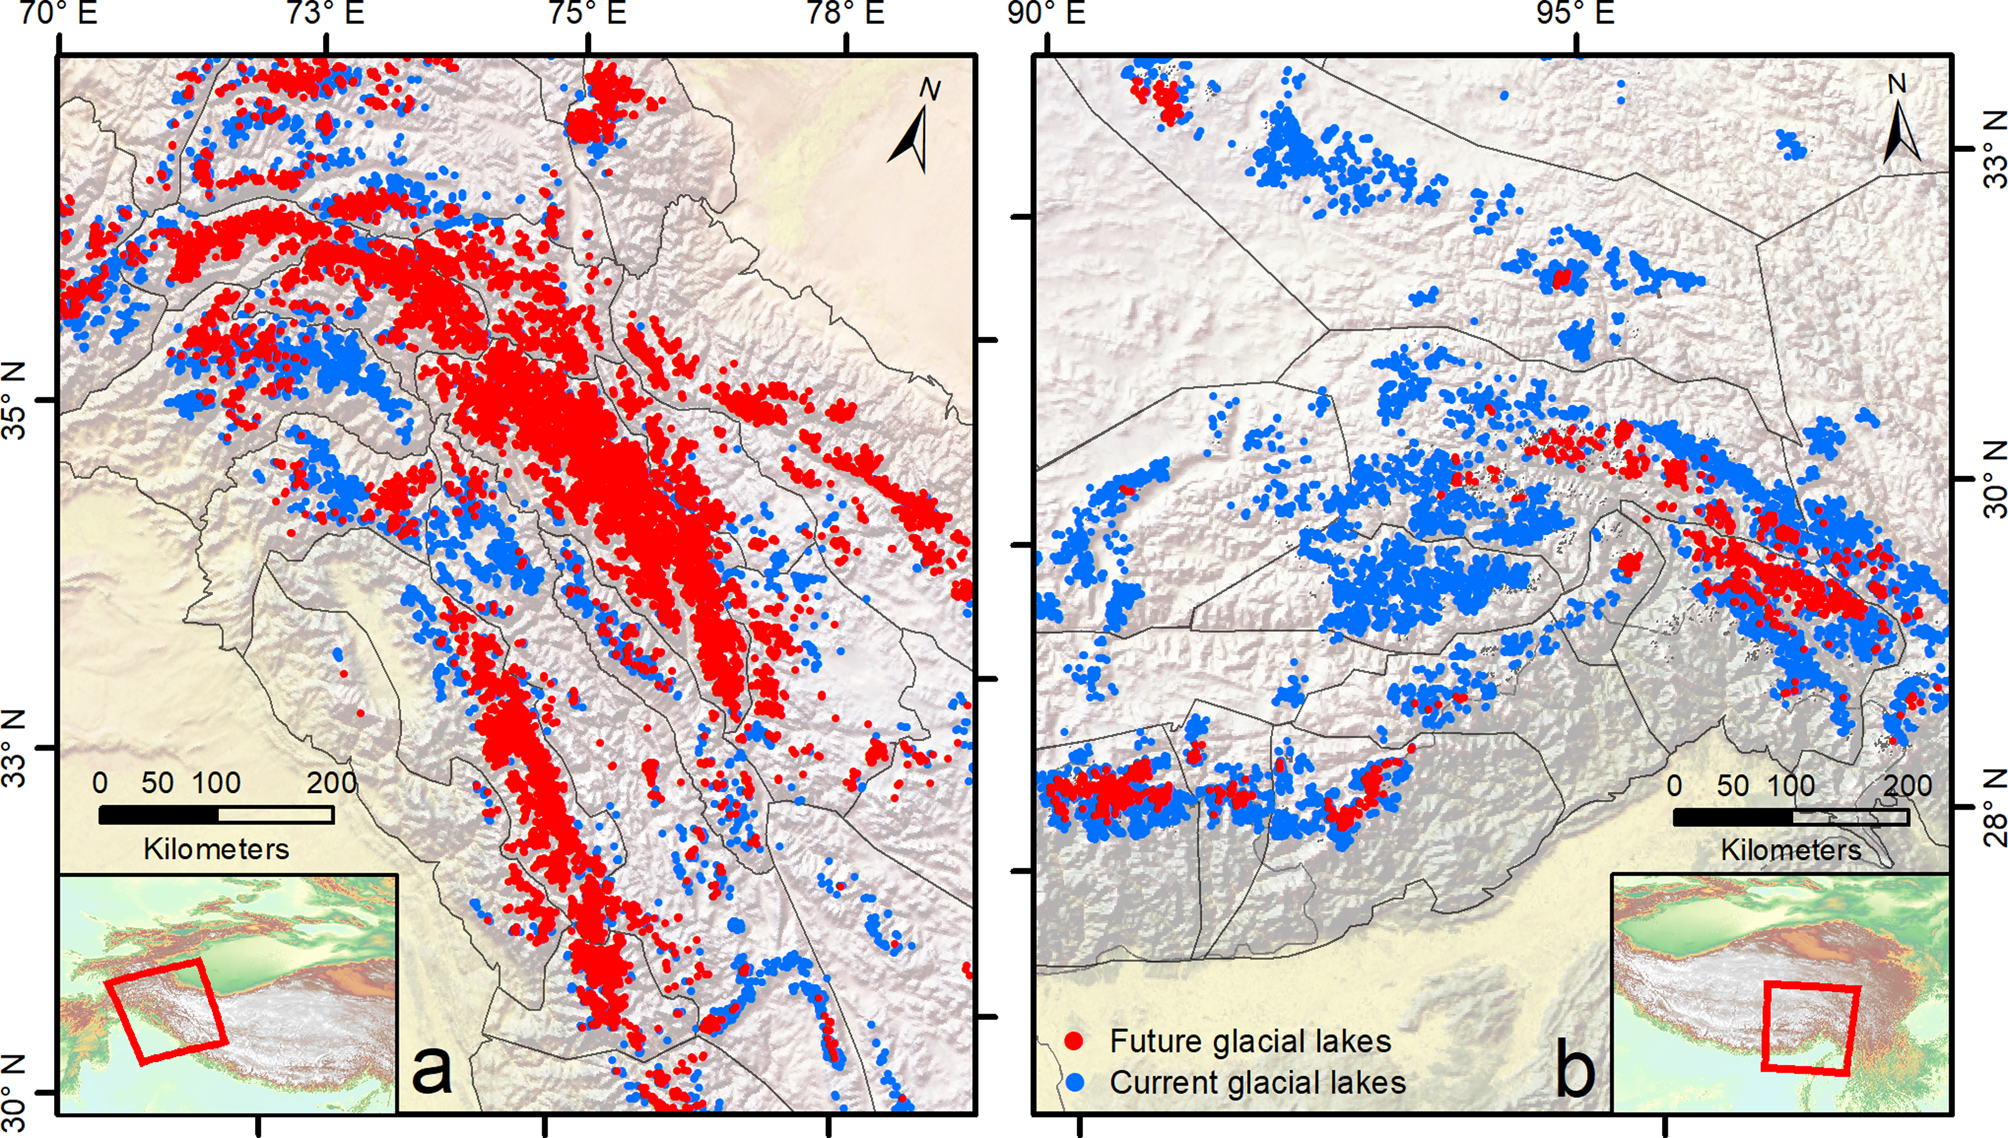
With HMA expected to lose up to 87% of its glacier ice mass in the next 70 years (Shean and others, Reference Shean2020) and the Karakoram transitioning from a positive to a negative mass balance (Brun and others, Reference Brun, Berthier, Wagnon, Kääb and Treichler2017), our projections indicate that in a scenario with considerably less ice mass the largest glacial lakes will be found in the Karakoram and Pamir (Fig. 13a). Moreover, future glacial lakes in this region will be far more susceptible to mass-movement impacts (see also Fig. 10). The described northwestern shift not only in the number of glacial lakes but also in lake size and impact predisposition could, in turn, further enhance glacier melt and the potential GLOF hazards in that region.
5.3 Impact hazards
For the assessment of the GLOF potential for already existing lakes, parameters such as permafrost conditions (Bolch and others, Reference Bolch2011), lake expansion (Dubey and Goyal, Reference Dubey and Goyal2020), moraine dam morphology (Wang and others, Reference Wang2012), vegetation cover (Veh, Reference Veh2019) and the likelihood of extreme meteorological conditions (Singh and others, Reference Singh2014) can be included in addition to a slope hazard classification. When investigating future lakes, however, most of these parameters are unsatisfactory due to enormous uncertainties or a general lack of data. Therefore, and since more than 50% of all GLOF events in HMA occur due to displacement waves (Allen and others, Reference Allen, Singh, Schickhoff and Mal2016), the lakes' predisposition to mass-movement impacts in combination with its volume can serve as a first impression of the potential GLOF hazard in a region. We provide large-scale and detailed information about potential LIPA as well as detailed hazard classifications of related slopes in the catchment. Over the whole of HMA, we classified 8516 km2 as potential LIPA for glacial lakes with a surface area >105 m2. Notably, this could be considered a conservative estimate due to the exclusion of large lateral valleys. Almost every future lake (98.3%) is surrounded by potentially dangerous slopes with slope angles >20°. Very few small lakes in large cirque basins or flat glacial troughs exhibit adjacent slopes entirely <20° from where mass movements generally are unlikely (Hermanns and others, Reference Hermanns2012). Our results show that comparably small future lakes in the higher parts of mountain ranges within HMA tend to have an especially high predisposition for mass-movement impacts. Typically, these high hazard scores are due to steep slopes >40° in close proximity to the respective lake and/or large elevation differences between the mean slope altitude and the calculated lake surface altitude. In regions with less extreme relief, such as Inner Tibet, or parts of the Gangdise and Kunlun Ranges, many of the smaller future lakes show low hazard scores. In these situations, glaciers have mostly retreated to the mountain peaks and few steep slopes remain above possible future lakes. Therefore, these regions seem to be less threatened by GLOF events triggered by mass-movement impacts in general. However, for the few larger lakes in this area a more in-depth analysis of their potential hazard is required, as a significant destructive potential can still be attributed to large lakes at lower altitudes due to their sheer size (GAPHAZ, 2017).
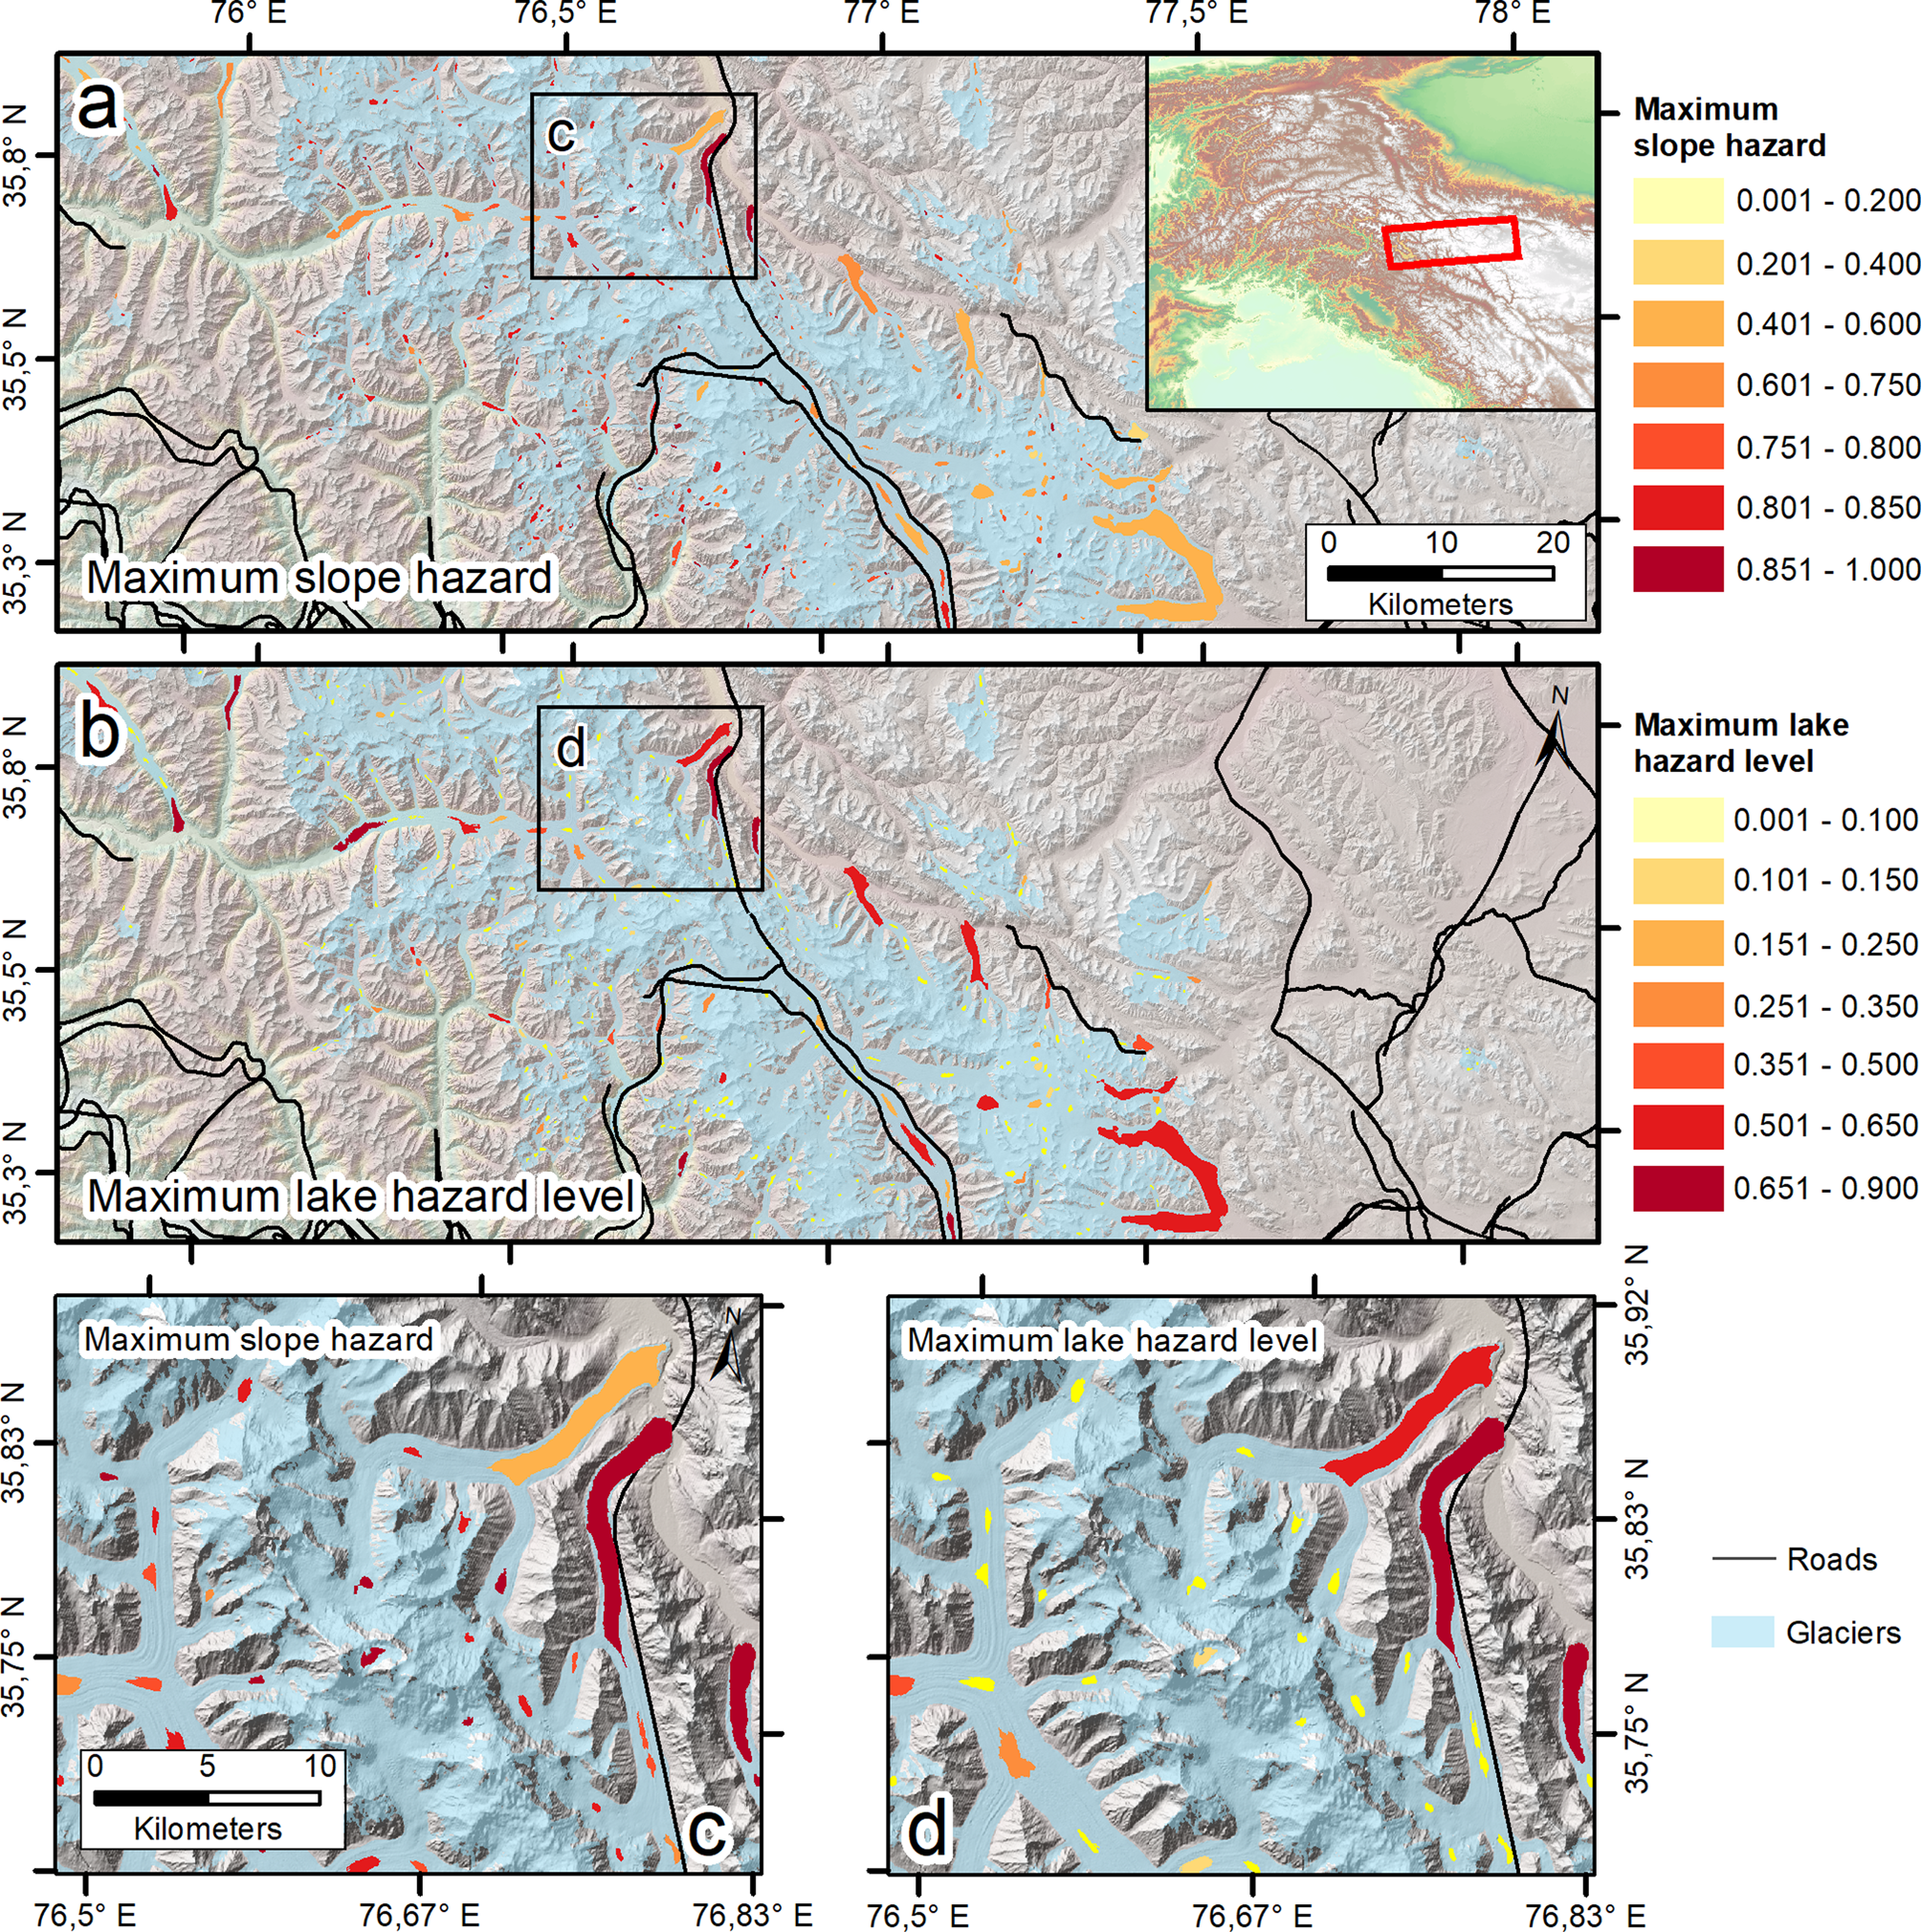
Our results indicate that most of the future lakes in HMA will form in the still heavily glaciated regions of the central Karakoram, Tien Shan and Pamir. In the higher altitudes of these mountain ranges, above the lower permafrost limit, mass movements are dominated by low-magnitude, high-frequency rockfalls and avalanches (Blöthe and others, Reference Blöthe, Korup and Schwanghart2015). With transported material of <106 m3, these events may be small compared to some of the catastrophic landslides of the past. However, they still are capable of generating large displacement waves. The continued warming trend and glacial retreat in nearly every part of HMA increases the slope instability at higher altitudes due to retreating permafrost and the loss of stabilizing pressure at the glacier flanks (Schaub and others, Reference Schaub, Haeberli, Huggel, Künzler, Bründl, Margottini, Canuti and Sassa2013) and, thus, further increases the GLOF hazard in these regions. Currently, landslides of larger magnitudes detach with low frequency and below the mean elevation of a mountain range. They transport much more material (up to 20 km3) over a vertical drop of mostly more than 700–900 m (Blöthe and others, Reference Blöthe, Korup and Schwanghart2015). Therefore, they still must be considered as potential hazards for the few future glacial lakes at lower altitudes. Due to the fact that lower lakes are in general closer to more densely populated areas, the few larger overdeepenings at lower altitudes may still pose a significant threat to local communities. Although the maximum slope hazard is highest in the regions with the most rugged topographies, i.e. the Karakoram, Pamir and Tien Shan (Figs 14a, c), the consideration of lake volume changes the spatial pattern. Although both LHL mean and LHL max display this change, it is most visible when considering LHL max. With this, larger proglacial lakes at lower altitudes can often be expected to pose the highest threat (Figs 14b, d). Due to their size, they are very susceptible to mass-movement impacts and, at the same time, capable of generating large outburst floods relatively close to settlements and infrastructure. Although infrastructure information is fragmentary for the Karakoram region, several roads can be determined that run close to potentially dangerous future lakes (Fig. 14).
Impact hazard for future lakes in the Central Karakoram mountains based on (a) the maximum slope hazard score and (b) the maximum lake hazard level (LHL max). Clearly visible is the difference between small lakes at high altitudes and larger proglacial lakes at the glacier tongues. The subsets (c) and (d) illustrate this phenomenon at greater detail. The extent of the subsets is indicated by black rectangles in the overview maps (a) and (b). Roads (black lines) are a composite of data provided by Meijer and others (Reference Meijer, Huijbegts, Schotten and Schipper2018) and the CIESIN/ITOS (2013) dataset.
Additionally, and this has not yet been considered in the scope of this study, some overdeepenings situated below glacier tongues may develop behind current proglacial lakes, eventually coalescing with them and forming even larger lakes. Also, ice avalanches are an alternative GLOF trigger mechanism (Schaub and others, Reference Schaub, Huggel and Cochachin2016). To date, an assessment of predisposition to ice avalanching is not feasible for large regions, so that this also does not factor into this study. However, the major glacier collapses in the Aru Range in July 2016 (Tian and others, Reference Tian2017; Kääb and others, Reference Kääb2018) demonstrate the hazard potential such processes may pose in HMA under continuously warming climate. In most glaciated regions of HMA, settlements and infrastructure are still sparse. Nevertheless, vulnerability is often high because the destruction of a single road or bridge poses a significant threat as it can leave entire upstream valleys and settlements cut off (Carrivick and Tweed, Reference Carrivick and Tweed2016). The settlement density is expected to increase by the ongoing expansion of infrastructure into higher elevations for tourism, hydropower or agriculture (GAPHAZ, 2017). With regard to the growing GLOF threat, the long-term lake hazard assessment of this study can serve as the groundwork for future research into regional or glacier specific hazards in order to provide further information for planning and mitigation measures. Himalayan communities often struggle with effectively planning, managing and funding mitigation projects (Thompson and others, Reference Thompson, Shrestha, Chhetri and Agusdinata2020). Following the continuing retreat of glaciers in most parts of HMA, the larger overdeepenings under glacier tongues at lower altitudes will probably become ice free and fill up due to glacial melt in the near future. As our study indicates the development of large future lakes will focus on the northwestern part of HMA, adaptation measures taken in the southwestern Himalayan region (Bajracharya, Reference Bajracharya2009; Mahagaonkar and others, Reference Mahagaonkar, Wangchuk, Ramanathan, Tshering and Mahanta2017) will need to be considered and adopted by communities in the Karakoram and Pamir as well.
5.4 Proglacial lakes
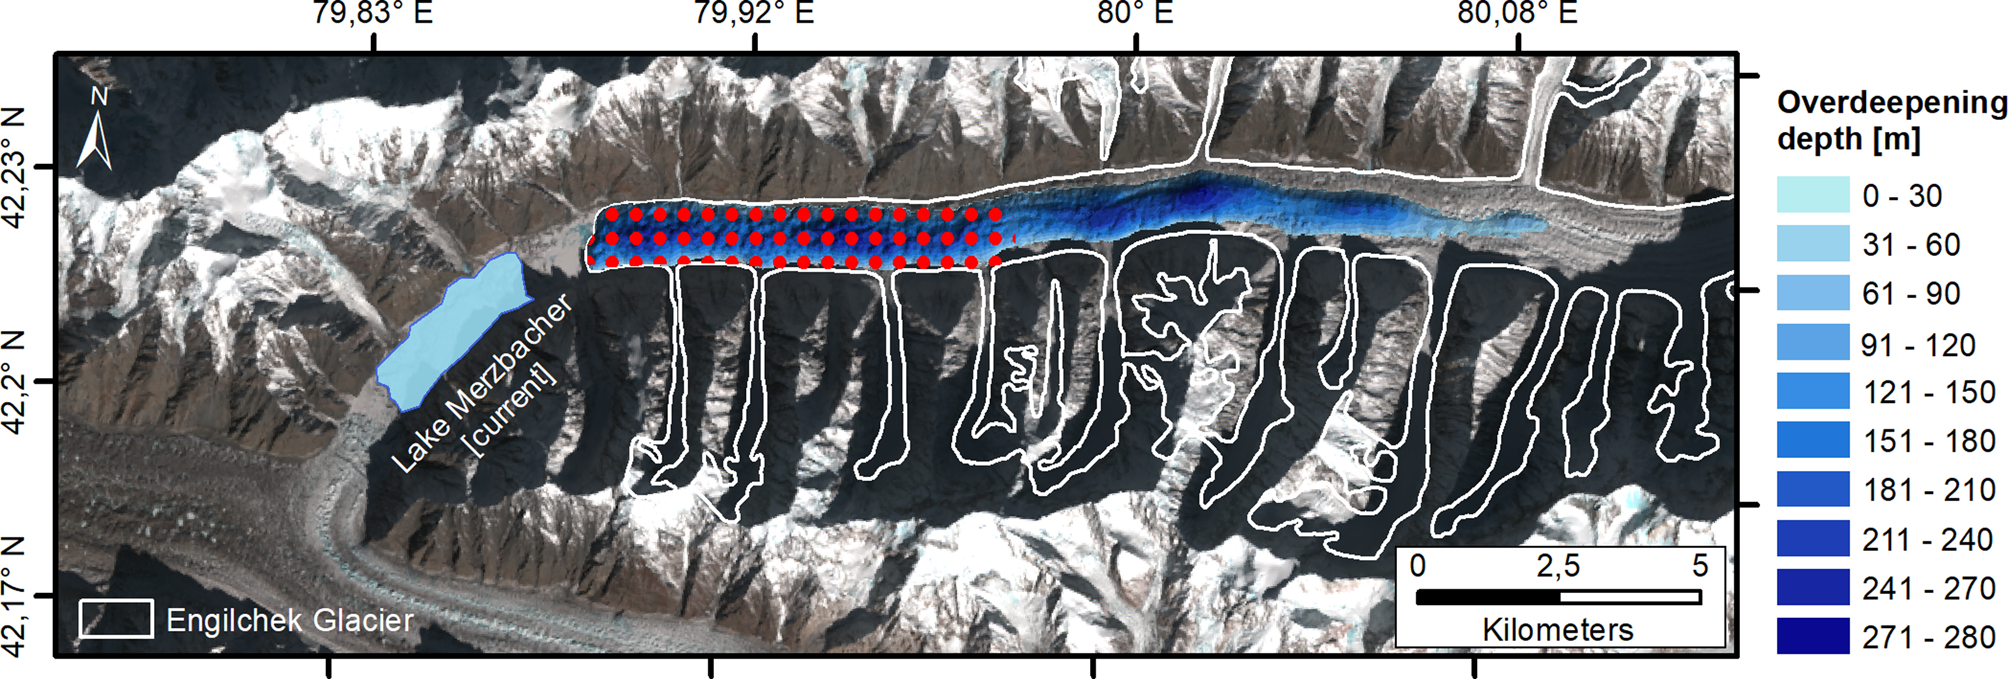
Currently, there are more than 700 proglacial lakes in HMA whose total area increased by 50% over the last three decades (King and others, Reference King, Bhattacharya, Bhambri and Bolch2019). Proglacial lakes pose a significant threat for two reasons: first, the debris cover on glaciers in HMA is higher at lower elevations leading to higher moraine dams with larger potential for failure and increased GLOF risk (Linsbauer and others, Reference Linsbauer2016). Second, proglacial lakes aggravate glacier mass loss (King and others, Reference King, Bhattacharya, Bhambri and Bolch2019) – a factor not included in current ice loss projections. Despite the fact that lake-terminating glaciers currently only account for a small fraction of all glaciers in HMA, our calculations indicate the formation of proglacial lakes at nearly every glacier with overdeepenings >105 m2. Some of these lakes will newly form while others will increase the area of already existing ones leading to even larger lakes with a higher potential for catastrophic GLOF events. Lake Merzbacher in the Tien Shan is an example of such a situation. With a maximum depth of 100 m (Narama and others, Reference Narama2017) and an estimated volume of ~0.17 km3 (Mayer and others, Reference Mayer, Lambrecht, Hagg, Helm and Scharrer2008), it is the largest proglacial lake in the region and outbursts almost every year, causing damage to downstream infrastructures and communities (Wortmann and others, Reference Wortmann, Krysanova, Kundzewicz, Su and Li2014). Xie and others (Reference Xie, ShangGuan, Zhang, Ding and Liu2013) report that the outbursts at Lake Merzbacher are occurring earlier every year due to warming trends. Figure 15 depicts the current lake as well as a computed overdeepening under Engilchek Glacier with a maximum volume of 1.5 km3. Following the ongoing retreat of the glacier, the overdeepening can gradually fill and eventually connect with Lake Merzbacher. The abundance of supraglacial lakes over the lower 7 km of the glacier (indicated by red dots in Fig. 15) could well be an indicator for the development of a massive proglacial lake in the near future (Benn and others, Reference Benn2012). In case the whole overdeepening will coalesce with Lake Merzbacher, the projected increase in area and volume (by ~400 and 900%, respectively) could lead to a substantial increase in both discharge rate and volume. Whether the lake would still be outbursting regularly at this point or only after rockfall or avalanche events cannot be determined. In both cases, however, a lake of this size would lead to a significantly exacerbated threat downstream.
Comparison of the current Lake Merzbacher (light blue) and the potential lake extension (shaded dark blue) that would almost quadruple its size. Red dots indicate an area with a multitude of supraglacial lakes which could develop into a proglacial lake in the near future.
6. Conclusions
This study provides the first complete inventory of future glacial lakes >104 m2 in area in HMA by computing the bedrock topography of the ~100 000 glaciers in the region using ice thickness data of a five-model-ensemble by Farinotti and others (Reference Farinotti2019a) and the AW3D30 DEM. A total of 25 285 overdeepenings with a volume of 99.1 ± 29.5 km3 were computed covering 2683 ± 812 km2. The location and size of the overdeepenings is in good agreement with previous studies. Particularly for the western Himalaya and the Karakoram range, however, our results suggest a smaller number of overdeepenings (54%) as well as less overdeepening volume (37%) than previously projected. Our analysis of the hazard potential for slopes adjacent to the 2700 lakes larger than 105 m2, generally, shows a very high impact predisposition for mainly the smaller lakes in high mountain regions such as the Tien Shan, Pamir, Karakoram and parts of the Himalaya. In regions with less pronounced relief, such as Inner Tibet and the Kunlun range, overdeepenings are less prone to be impacted by mass movements. When additionally considering lake volume, the most hazardous future proglacial lakes are those that are very vulnerable to mass-movement impacts and, at the same time, capable of releasing large outburst floods relatively close to infrastructure and settlements. According to our findings, the number of proglacial lakes is expected to increase substantially, particularly in the northwestern part of HMA. Considering the profound impact of proglacial lakes on glacier ablation at the ice front, we emphasize the need for improving the integration of the impact of proglacial lakes on glacier melt and the projection of glacier-mass loss. At this stage, the results of this study provide the first comprehensive overview on lake development and emerging GLOF hazard in HMA and can serve as a basis for further assessments of risks and opportunities related to future glacial lakes. Investigating the temporal perspective of lake formation and development as well as performing GLOF risk assessments including infrastructure and land-use would be significant future steps toward adapting to the emerging challenges from future glacial lake formation in HMA.
Supplementary material
The supplementary material for this article can be found at https://doi.org/10.1017/jog.2021.18
Data
Shapefiles containing the computed overdeepenings with information about, e.g. area, volume, depth and hazard scores are available on GitHub (Furian, Reference Furian2020). The data can also be found at doi.org/10.5281/zenodo.4282253 .
Acknowledgements
This study builds on data published by Farinotti and others (Reference Farinotti2019a), who are thanked for sharing their findings and data online. The research carried out in this study was made possible by several open-source software tools, such as RStudio, Slurm and QGIS, whose development teams we hereby thanked. Sebastian Schubert is thanked for great assistance with the employment of the Cirrus High Performance Computing cluster at the Geography Department of Humboldt-Universität zu Berlin. We give thanks to Anselm Arndt who provided support with the algorithm development and the general coding. We thank two anonymous reviewers as well as Dan Shugar, Scientific Editor, and Hester Jiskoot, Associate Chief Editor, who helped to improve the manuscript with their constructive comments and valuable advice.
Author contributions
WF and CS jointly developed the idea for this study. WF created the outline. Together with CS, he devised the final structure of the study. WF wrote the main program code, carried out analyses and wrote the first version of the manuscript. DL participated in the conceptualization of the slope classification algorithm and provided additional code. CS and DL assisted with geoscientific interpretation. All authors partook in structuring the manuscript. All authors reviewed and finalized the manuscript.
Financial support
WF is funded by a personal grant of the Studienstiftung des Deutschen Volkes. We acknowledge support by the German Research Foundation (DFG) and the Open Access Publication Fund of Humboldt-Universität zu Berlin.


 Open access

