


Introduction
Ever since the postwar debates between pluralist (Dahl Reference Dahl1961; Rose Reference Rose1967) and power elite (Domhoff Reference Domhoff1967; Mills Reference Mills1956) theorists, social scientists have been interested in elite cohesion – the social bonds between elites, rooted in the common background or personal relationships, that afford mutual recognition, cultivate consensus regarding the rules of the game and agreement on what is to be done, foster coordination, and encourage elites to overcome zero-sum thinking and act in unison. While these early debates centered on the question of whether there was a single group of elites able to dominate all major political decisions, they have also given rise to more general questions about the degree of cohesion among individuals who occupy the top positions in different sectors of American society (Lindsay Reference Lindsay2008).
Empirical work on elite cohesion in the United States has focused primarily on corporate elites, their social backgrounds (Lee et al. Reference Lee, Kish-Gephart, Mizruchi, Palmer and Useem2021), and their interconnections through shared membership on corporate boards (Burris Reference Burris2005; Mizruchi Reference Mizruchi1992, Reference Mizruchi2013) as well as in elite schools, clubs, and policy-making organizations (Bonacich and Domhoff Reference Bonacich and William Domhoff1981; Useem Reference Useem1984; Whitley Reference Whitley1973). As far as political elites go, scholars have directed their attention to policy networks (Laumann and Knoke Reference Laumann and Knoke1987) and to members of Congress (Desmarais et al. Reference Desmarais, Moscardelli, Schaffner and Kowal2015; Kirkland and Gross Reference Kirkland and Gross2014; Liu and Srivastava Reference Liu and Srivastava2015; Minozzi and Caldeira Reference Minozzi and Caldeira2021; Parigi and Bergemann Reference Parigi and Bergemann2016; Ringe and Victor Reference Ringe and Victor2013).
What is lacking are systematic empirical studies of cohesion among the group of political appointees who sit atop the major organizations of the American administrative state. Given their work responsibilities and authority to decide the use of the legal, material, human, fiscal, and other resources of those organizations, it is important to better understand the backgrounds of these individuals. Studying elite cohesion among political appointees does not only matter because of its relation to questions of democracy, as the postwar debates made clear, but also because of its implications for governance. While both power elite theorists and pluralists emphasized that high levels of elite cohesion can lead to oligarchic political structures that threaten democracy, Putnam (Reference Putnam1976: 124–32), Higley and Moore (Reference Higley and Moore1981), Higley et al. (Reference Higley, Hoffmann-Lange, Kadushin and Moore1991), and Van Gunten (Reference Van Gunten2015) suggest that a certain level of elite cohesion is necessary for political stability and effective governance – an argument echoed in work on the consequences of elite political polarization (Lee Reference Lee2015; Mann and Ornstein Reference Mann and Ornstein2006). Raymond Aron (Reference Aron1950: 143) recognizes this tension when he writes that “a unified élite means the end of freedom. But when the groups of the élite are not only distinct but become a disunity, it means the end of the State.” Yet before scholars can study the effects of cohesion, they need to know how much cohesion there is, where cohesion is produced, and how that has changed over time. This is the task I take up in this article.
Drawing on a novel dataset of the career histories of 2,221 political appointees who served between 1898 and 1998, I provide the first systematic descriptive study of changes in cohesion within this group over time. Among the many ways administrative elites can potentially be connected, I focus on two that previous research (Ellersgaard et al. Reference Ellersgaard, Lunding, Henriksen and Larsen2019; Putnam Reference Putnam1976; Van Gunten Reference Van Gunten2015) has identified as important and that can be consistently measured across such an extensive time period: attending the same educational institution (both at the college and post-college level) at the same time and working in the same federal government agency at the same time.
Using these measures and deploying network analysis, I document an increase in cohesion among administrative elites throughout the twentieth century. Co-educational networks become markedly more cohesive over time, especially during the three decades following the World War II. This trend is accompanied by a shift from college to post-college ties so that toward the end of the study period, the majority of educational ties are formed in graduate programs. Co-working networks, which are denser overall than co-educational ones, experience a sharp increase in cohesion during the 1930s and 1940s and remain highly cohesive thereafter. Moreover, I demonstrate that while these ties are more likely to connect individuals within the same government agency than would be expected by chance, the vast majority are inter-agency ties. These inter-agency ties provide the potential for information exchange and coordination across the various organizations of the American administrative state.
Elite cohesion
Elite cohesion was a central concern for classic elite theorists such as Pareto, Mosca, and Michels, who saw it either as a given or something necessary for society to function (Khan Reference Khan2012). Mosca (Reference Mosca1939: 53), in particular, argued that elites’ ability to dominate nonelites stems from their organizational capacity, their shared understanding, and their ability to act in concert. The issue of elite cohesion received renewed attention after World War II when pluralist and power elite theorists engaged in a heated debate about how power was organized in America. Both agreed that high levels of cohesion, due to social homogeneity and frequent personal interactions, would allow elites to act together to defend their interests (Chu and Mizruchi Reference Chu, Mizruchi, Scott and Kosslyn2015). However, they differed in their assessment of how strong elite cohesion actually was. Power elite theorists like Hunter (Reference Hunter1953), Mills (Reference Mills1956), and Domhoff (Reference Domhoff1967) saw a small and cohesive group of elites who occupied positions at the top of business, military, and political hierarchies and who were able to dominate all major decisions of national scope. Pluralist theorists like Dahl (Reference Dahl1961) and Rose (Reference Rose1967), in contrast, found little evidence of elite cohesion and consequently argued that political power was distributed across multiple competing groups. What was ultimately at stake in these debates was the nature of the American political system – whether the course of the country was determined by a small and highly cohesive oligarchy or by multiple competing interests.Footnote 1
This debate sparked broader questions about the degree of connectedness among individuals holding top positions in different sectors of American society (Lindsay Reference Lindsay2008). Most empirical work on elite cohesion has focused on corporate elites, particularly on networks formed through shared membership on corporate boards. At the firm level, studies of twentieth-century corporate interlocks have found a highly connected corporate network, with leading financial institutions as the most central nodes (Allen Reference Allen1974; Mintz and Schwartz Reference Mintz and Schwartz1985; Mizruchi Reference Mizruchi1982; Reference Mizruchi1992; Roy Reference Roy1983). At the individual level, they have identified an “inner circle” (Useem Reference Useem1984) of highly connected corporate elites who sit on the boards of the largest corporations (Burris Reference Burris2001, Reference Burris2005; Heerwig and Murray Reference Heerwig and Murray2019). In addition to board membership ties, corporate elites are often connected through kinship (Baltzell Reference Baltzell1962; Whitley Reference Whitley1973; Zeitlin Reference Zeitlin1974) as well as membership in private schools and clubs (Bonacich and Domhoff Reference Bonacich and William Domhoff1981; Domhoff Reference Domhoff1970; Useem Reference Useem1984). These high levels of cohesion enable corporate elites to overcome zero-sum thinking and focus on the long-term interests of the corporate community (Mizruchi Reference Mizruchi2013), resulting in similar political behavior (Burris Reference Burris2005; Mizruchi Reference Mizruchi1992). Furthermore, based on systematic data over time, research on corporate interlocks has documented important changes. While Mizruchi (Reference Mizruchi1982) found relatively stable patterns of interlocking from 1935 onward, Mizruchi (Reference Mizruchi2013) and Chu and Davis (Reference Chu and Davis2016) diagnose a fracturing of the US corporate elite beginning in the 1980s. In contrast, Carroll (Reference Carroll2010) and Murray (Reference Murray2017) argue that corporate elite networks remain cohesive but are shifting from domestic to transnational ones.
As far as American political elites are concerned, scholars have focused either on policy networks or on networks of interaction among legislators. Policy networks form around a particular issue or piece of legislation and can include both private actors as well as government officials such as members of congressional committees, federal agencies, and state and local governments (Carpenter et al. Reference Carpenter, Esterling and Lazer2004; Heaney Reference Heaney2006; Higley and Moore Reference Higley and Moore1981; Laumann and Knoke Reference Laumann and Knoke1987). An early community study of elites in a German town by Laumann and Pappi (Reference Laumann and Pappi1973), for example, shows how decision-making was decisively shaped by existing social, business, and discussion networks. Studies of American policy networks at the national level, however, have found only weak elite cohesion (Heinz et al. Reference Heinz, Laumann, Nelson and Salisbury1993).
In addition to policy networks, there is a small body of work on the social networks of members of the US Congress. Most of this work examines networks of interaction, ranging from co-sponsorship networks (Cho and Fowler Reference Cho and Fowler2010; Fowler Reference Fowler2006a, Reference Fowler2006b; Kirkland and Gross Reference Kirkland and Gross2014) to networks of co-membership in congressional committees (Liu and Srivastava Reference Liu and Srivastava2015; Porter et al. Reference Porter, Mucha, Newman and Warmbrand2005) and caucuses (Ringe and Victor Reference Ringe and Victor2013) to networks of participation in joint press events (Desmarais et al. Reference Desmarais, Moscardelli, Schaffner and Kowal2015). Relationships formed outside the legislature have received less attention, but Bó et al. (Reference Bó, Dal Bó and Snyder2009) show that family ties among members of Congress have become less common since the founding of the American republic. While more than 40 percent of members of Congress had relatives in Congress in 1789, that number had fallen to less than 10 percent by 1996. Further, research on the “boardinghouse effect” demonstrates that in the nineteenth century, informal relationships based on coresidence in Washington boarding houses significantly influenced congressional voting (Minozzi and Caldeira Reference Minozzi and Caldeira2021; Parigi and Bergemann Reference Parigi and Bergemann2016; Young Reference Young1966). These relationships often cut across political parties, thus muting the effect of partisanship on voting and curbing elite polarization.
While these studies have produced important insights into the connections among various groups of elites, existing research has largely overlooked those in the most powerful positions within the American administrative state – individuals who wield significant influence over policy-making, implementation, and the allocation of state resources. As a result, the relationships among political elites remain understudied, leaving our knowledge of elite cohesion incomplete. This article addresses this gap by providing a systematic analysis of cohesion among twentieth-century political appointees.
Schools and workplaces
Cohesion can be produced by a common background or personal relationships (Clemens Reference Clemens2007; Engelstad Reference Engelstad, Best and Higley2018; Mills Reference Mills1956; Putnam Reference Putnam1976; Rosenau Reference Rosenau1963). Many organizations rely on common background – and the shared experiences that come with it – when recruiting their staff (Rider Reference Rider2012; for the case of firefighters, see Desmond Reference Desmond2009). Recruiting political appointees with similar backgrounds – whether rooted in class, education, or prior work experience – can foster mutual understanding and coordination. The same is true for personal relationships. Perhaps even more so than mere common background, they help elites to transcend the limited viewpoint of their own careers or organizations, mitigate competition, facilitate information exchange, and foster a common outlook, a shared understanding of how things are done, and a political culture of compromise, cooperation, and loyalty (Ingram and Roberts Reference Ingram and Roberts2000; Van Gunten Reference Van Gunten2015; Wang Reference Wang2024). It is these informal networks that, according to Evans (Reference Evans1995: 49), “give the bureaucracy an internal coherence and corporate identity.” Stegner (Reference Stegner1954) offers a vivid example in his biography of John Wesley Powell, highlighting how Powell established a network of social bonds during a series of expeditions to the American West. These connections later proved invaluable in his career as a government scientist, enabling him to coordinate activities across diverse federal agencies and influence policy.
In line with previous research (Grindle Reference Grindle1977; Putnam Reference Putnam1976; Rider Reference Rider2012; Van Gunten Reference Van Gunten2015), this study examines two types of connections that are particularly important: those established in educational institutions early in a person’s life and those established by working in the same organization of the federal government later in a person’s career. Elite schools and universities serve as key sites where future elites forge lasting social relationships that often endure throughout their careers (Khan Reference Khan2012, Reference Khan2013; Stevens, Armstrong, and Arum Reference Stevens, Armstrong and Arum2008). A well-known example is the friendship between Bill Clinton and Robert Reich, who first met as Rhodes Scholars at Oxford, later became classmates at Yale, and eventually worked together when Reich served as Secretary of Labor under Clinton. Schools not only foster close personal connections but also help establish the weak ties that can be instrumental in job searches (Granovetter Reference Granovetter1974).
The role of educational institutions in grooming political elites can be seen in institutions like the grandes écoles in France (Bourdieu Reference Bourdieu1998; Kadushin Reference Kadushin1995), Tokyo University in Japan (Johnson Reference Johnson1982), Oxford and Cambridge in Britain (Reeves et al. Reference Reeves, Friedman, Rahal and Flemmen2017; Wakeling and Savage Reference Wakeling and Savage2015), and the Ivy League schools in the US (Brint and Yoshikawa Reference Brint and Yoshikawa2017; Domhoff Reference Domhoff1970; Reference Domhoff2010; Kurtz and Simon Reference Kurtz and Simon2007). While American administrative elites are not trained in designated government schools, they tend to come from a selective group of elite schools. An early study by Stanley, Mann, and Doig (Reference Stanley, Mann and Doig1967: 126–28) found that between 1933 and 1965 one in four American political executives enjoyed a college education at an Ivy League school, and one in five attended either Harvard, Yale, or Princeton. Post-college education was even more concentrated. Almost half of the political executives went to graduate school at one of only five universities: Harvard, Yale, Columbia, George Washington, and Oxford. Although these numbers are higher than those for the general public, they do not lead to the conclusion that elite recruitment to high public office in the United States is entirely dominated by only a few elite schools. In addition, there is evidence that undergraduate degrees from elite institutions have become less important in recent times for both corporate and government elites, while the significance of graduate degrees, especially in the fields of business and law, has increased (Brint and Yoshikawa Reference Brint and Yoshikawa2017; Cappelli, Hamori, and Bonet Reference Cappelli, Hamori and Bonet2014; Useem and Karabel Reference Useem and Karabel1986).
While educational institutions offer opportunities for tie formation early in life, workplaces function as important hubs later in people’s careers (Ellersgaard et al. Reference Ellersgaard, Lunding, Henriksen and Larsen2019; Van Gunten Reference Van Gunten2015). Since this study focuses on elites appointed to positions within the American federal government, I only consider ties formed through prior shared work experience in federal government organizations. As research on the “revolving door” in politics has shown (Li Reference Li2023; McCrain Reference McCrain2018), these ties constitute social capital that can facilitate the exchange of information and the creation of shared understandings and a willingness to cooperate. Moreover, such connections may play a critical role in the recruitment process. A notable example is the relationship between Donald Rumsfeld and Dick Cheney: Rumsfeld brought Cheney into the Ford White House, having known him from Cheney’s tenure as a congressional staffer when Rumsfeld was a member of the House of Representatives.
However, focused on democratic theory, the literature on American elite recruitment depicts the federal government as a “government of strangers” (Heclo Reference Heclo1977), whose highest positions are staffed not by a class of professional administrators, but by political appointees “whose career stakes are tied neither to party politics nor to government administration” (Heclo Reference Heclo and Calvin Mackenzie1987: 195). In contrast to countries like China, where political elites are systematically rotated through government positions prior to their elite appointments, political appointees typically come from various parts of the private sector and have spent little time in the national government (Aberbach et al. Reference Aberbach, Putnam and Rockman1981; Mackenzie Reference Mackenzie1987). The likely result of such an open and diverse system is a group of elite administrators with few pre-existing connections.Footnote 2 Reflecting this lack of cohesion, a Nixon administration appointee quoted by Heclo (Reference Heclo1977: 107) lamented, “I have no contact that amounts to anything with other appointees outside the department. … As a group there’s no trust.”
The existing literature offers limited predictions about changes in cohesion among political appointees during the twentieth century. However, several factors can be seen as suggesting a decline in cohesion. First, political elites have become more diverse in terms of their socioeconomic backgrounds (Zweigenhaft and Domhoff Reference Zweigenhaft and William Domhoff2006). Given that social networks tend to be highly segregated by gender, race, and class (McPherson et al. Reference McPherson, Smith-Lovin and Cook2001), increasing diversity could potentially reduce cohesion, though this outcome is by no means inevitable (Cornwell and Dokshin Reference Cornwell and Dokshin2014). In addition, the American educational system and the federal government both expanded dramatically during this period. As the state grew, so did the number of political appointees, many of whom, as I will later demonstrate, were educated at a growing number of colleges and universities and worked at a growing number of government agencies. These expansions – both in the number of appointees (nodes in the network) and in the number of educational institutions and agencies (sites for potential tie formation) – should, all else being equal, reduce the likelihood of two career paths crossing, thus making cohesion less likely.
On the other hand, the expansion of higher education increased the likelihood that elites attended college and graduate school. If these educational experiences were concentrated within a sufficiently small number of institutions, this should increase the number of connections formed in educational institutions. Similarly, there is evidence that the proportion of political appointees with federal public service careers grew during the twentieth century and that their careers became increasingly centralized in the D.C. area (Fisher Reference Fisher and Calvin Mackenzie1987). If these higher levels of government experience were concentrated within a sufficiently small number of agencies, this should lead to increasing workplace-based cohesion.
Further, Parigi and Bergemann (Reference Parigi and Bergemann2016), in their article on Washington boarding houses, propose that the high levels of polarization in Congress today may stem from a lack of informal cross-party interactions (see also Mann and Ornstein Reference Mann and Ornstein2006: 232). Scholars of corporate elites have suggested a similar relationship between declining elite cohesion, the erosion of compromise and consensus, and rising elite polarization (Mizruchi Reference Mizruchi2020). If elite polarization reflects low elite cohesion, and if we can extrapolate from Congress to political appointees, this would lead to the hypothesis that cohesion declined as polarization increased. Given the pattern of polarization – declining during the 1920s and 1930s, then rising again after the 1980s (McCarty et al. Reference McCarty, Poole and Rosenthal2006) – it is plausible that elite cohesion followed an inverse trajectory, increasing during the 1920s and 1930s and decreasing in the late twentieth century.
The following analyses examine how educational and workplace cohesion among elites in the American administrative state evolved between 1898 and 1998. To do this, I rely on a novel dataset of elite administrators from the McKinley to the Clinton administrations, which I describe in the next section.
Data and methods
The basis for this study is a sample of positions in the federal government atop what are commonly called cabinet departments, independent agencies and commissions, White House agencies, and legislative and judicial administrative agencies. These posts are filled via appointment by the President acting alone or with Senate confirmation.Footnote 3 Formally, these positions can be held by anyone from any sector in society.
The first step in the construction of the dataset consisted in sampling government agencies. Every four years, starting in 1898 and ending in 1998, and corresponding to the terms of presidential administrations (I will refer to these time points as sample years), I identified all major cabinet departments, independent agencies and commissions, White House agencies, and legislative and judicial administrative agencies. For the years since 1934, this was done using the United States Government Manual, which began publication in 1934. For prior time points I used the Congressional Directory. In a second step, the two highest positions within each agency were then sampled according to the formal agency structure depicted in the sources. In line with previous research (Bukodi and Goldthorpe Reference Bukodi and Goldthorpe2021; Orren and Skowronek Reference Orren and Skowronek2004), the dataset thus contains those positions with the greatest span of authority in the positional hierarchy of the US federal government’s executive and administrative organizations. The quota sampling scheme prevented organizations with a large number of eligible positions from dominating the sample.
The publications reported above were then used to identify the names of the individuals in the sampled positions. The percentage of position occupants for whom information could be found (the response rate, effectively) varies across sample years from 79 to 100 percent. In total, 2,221 positions entered the dataset, with yearly numbers ranging from 27 to 143, reflecting the dramatic growth of the administrative side of the American executive during the twentieth century. Note that this sample is based on positions, not people, such that the same person can appear multiple times in the dataset. In fact, the 2,221 positions are filled by 1,691 unique individuals.
For each person, in addition to the government agency in which he or she was sampled and the year in which the appointment took place, the dataset contains information on all educational institutions the person attended as well as the year in which the person graduated (which I use to determine whether people’s time at a school overlapped). The dataset also contains information on all previous work experience in the federal government, including the name of the government agency and the years in which the person worked in that agency (which I use to determine whether people’s time in an agency overlapped). Federal government agencies were coded using 333 unique codes, which correspond largely to individual agencies. This fine-grained coding means that, say, someone who worked at the FBI, an agency under the jurisdiction of the Justice Department, is coded as working at the FBI, not the Justice Department, which is important given my goal of measuring cohesion. Finally, the dataset contains information on the party leanings of the sampled individuals. The vast majority of the data were derived from Appletons’ Cyclopædia of American Biography, the Dictionary of American Biography, and Who’s Who in America. Occasionally, those were supplemented with information from other sources, including Who’s Who in American Politics and Who’s Who in Government.
A person who appears in the dataset without a college/graduate degree or without work experience in the federal government almost certainly did not attend college/graduate school or work in the federal government. It is very unlikely that he or she did, and that this information was not recorded in the sources consulted for the construction of the dataset. However, there are cases where I know someone went to school, but either the name of the school is missing (e.g., the source would only say “a private four-year college”) or the graduation date is missing. Of the 1,691 individuals in the dataset, 187 have no information on college. Of the remaining 1,504 individuals who have attended college, 272 have no complete entry (college name plus graduation date). Similarly, 529 people have no information on graduate school. Of the remaining 1,162 individuals who attended graduate school, 198 have no complete entry.
To examine change over time, I use a moving window approach with a window size of three sample years. For every sample year from 1906 to 1998, I take all people who were sampled in that year as well as in the two previous sample years and create both a network of educational ties and a network of workplace ties. I then move the window one sample year to the right and repeat the process until I reach 1998. This approach ensures I only consider ties between people who were sampled around the same time. While this leads to data loss, as ties between people sampled further apart are ignored, it makes the analysis conservative in the sense of being less likely to find ties. Further, using a constant window size holds the likelihood of censoring constant over time, thus allowing for adequate temporal comparisons.
For each window, ties between elites were created as follows. An education-based tie was created if two individuals attended the same school and graduated no more than two years apart. For example, if a person graduated from Harvard in 1915, he or she was tied to everyone who graduated from Harvard between 1913 and 1917. A work-based tie was created if two individuals had worked in the same organization of the federal government in the same year, considering only work experience up until the elite position in which they were sampled. For example, if a person worked at the FBI in 1915, he or she was tied to everyone who also worked there in 1915. If an elite pair is connected through multiple schools/organizations, this is treated as a single tie so that the resulting networks are unweighted.
The top tie producing schools and federal government organizations, divided into three 30-year time periods, are shown in Appendix A. What stands out is the significant concentration of ties in a small number of schools and government agencies. In each period, Harvard and Yale alone produce at least half the college ties. Harvard is also by far the largest supplier of post-college ties. Co-working ties are, overall, less concentrated than educational ties and tend to be formed in cabinet departments and Congress.
Conceptually, these measures of ties lie between shared backgrounds and personal relationships. They add copresence to mere shared background – people not only attend the same colleges or work in the same agencies but do so at the same time. This approximates the likelihood of a personal tie as much as can be done across such an expanse of time and government, but it is impossible to know if this combination of spatial and temporal proximity resulted in actual personal relationships. Thus, the “ties” analyzed here are perhaps better understood as a social-structural potential for face-to-face interaction rather than evidence of direct relationships. Such an indirect approach is inevitable when the goal is broad organizational and temporal coverage, and it is not uncommon in the literature on elite “networks,” which, as discussed earlier, does not measure personal interactions or relationships directly but infers their existence from shared organizational membership – whether in clubs, schools, boarding houses, or on corporate boards. Research on the Chinese party-state, in particular, has effectively employed this method to operationalize patron–client relationships by measuring whether elites attended the same educational institutions or worked in the same government organizations or provinces at the same time (e.g., Fisman et al. Reference Fisman, Shi, Wang and Wu2020; Jiang Reference Jiang2018; Keller Reference Keller2016).
In this context, it is worth bearing in mind that for much of the time period, educational institutions and federal government agencies were smaller than they are today, thus increasing the likelihood that copresence led to interaction. Moreover, life at colleges and universities tends to exhibit high levels of homophily based on ambition, further increasing the likelihood that individuals who later ascended to elite positions within the American state had known each other when their careers intersected in space and time.
Using this approach, I go on to examine change over time in the connectedness and cohesiveness of the networks that result from these ties. Connectedness, a dyadic measure of cohesion, is simply the proportion of people with at least one tie to someone else in the data who was appointed within the same time window (see Bó et al. Reference Bó, Dal Bó and Snyder2009 for an application of this measure to the case of family ties among members of Congress). To measure cohesiveness, a structural measure of cohesion, I adopt an idea from Van Gunten (Reference Van Gunten2015). I first identify cohesive blocks (Moody and White Reference Moody and White2003), a well-established and rigorous approach to network cohesion. The method identifies hierarchical blocks of k-connected nodes, where k is the minimum number of nodes who, if removed, would disconnect the block. In other words, k is a measure of subgroup cohesion based on node connectivity. For every pair of nodes, I then find the cut level k of the most cohesive block the two nodes are members of. I finally average those numbers across all pairs of nodes to obtain a measure of cohesiveness for the network as a whole.
Analysis
Whether a co-educational tie exists between two elites depends, among other things, on two important factors: whether they attended college/graduate school and the degree to which their educational experiences are concentrated in a small number of schools. The same logic applies to co-working ties. Before I turn to the development of cohesion over time, it is, therefore, important to make two observations. First, as shown in Appendix B, over the course of the twentieth century, the proportion of political appointees in my data who attended college rises from around 60 percent to nearly 100 percent; the proportion of those with a graduate education doubles from around 40 percent to 80 percent; and the proportion with prior work experience in the federal government increases from just over 50 percent in 1898 to 90 percent in 1946 and then declines to around 70–80 percent.Footnote 4 These developments should, ceteris paribus, increase the likelihood of tie formation. In the following analyses I will address this by also providing measures of cohesion that condition on whether people had attended college/graduate school or had worked in the federal government prior to their elite appointment.
Second, as shown in Appendix C, this expansion of educational and workplace experience is accompanied by a decrease in organizational concentration. While in 1898 more than half of the college degrees in the sample are obtained at the top five schools (defined as the institutions that produce the most degrees), by the end of the century, the top five schools account for less than 20 percent of college degrees. Similarly, the top five schools provide more than 80 percent of the sampled administrative elites with a post-college education in 1898 and only around 40 percent a century later. Work experience also becomes less concentrated. While in 1898 more than 70 percent of the total time appointees spent in the federal government prior to their elite appointment is concentrated in just five agencies, by the 1970s that figure falls to 30 percent (before increasing slightly towards the end of the time period). The concentration of work experience, of course, is a function of the number of government organizations in the data, which ranges from just under 30 agencies in 1898 and 1902 to over 70 agencies in the 1980s and 90s. Lower levels of concentration should, ceteris paribus, make it less likely for career paths to cross, making the results that follow conservative as I find increasing cohesion in a context of decreasing organizational concentration.
Elite cohesion
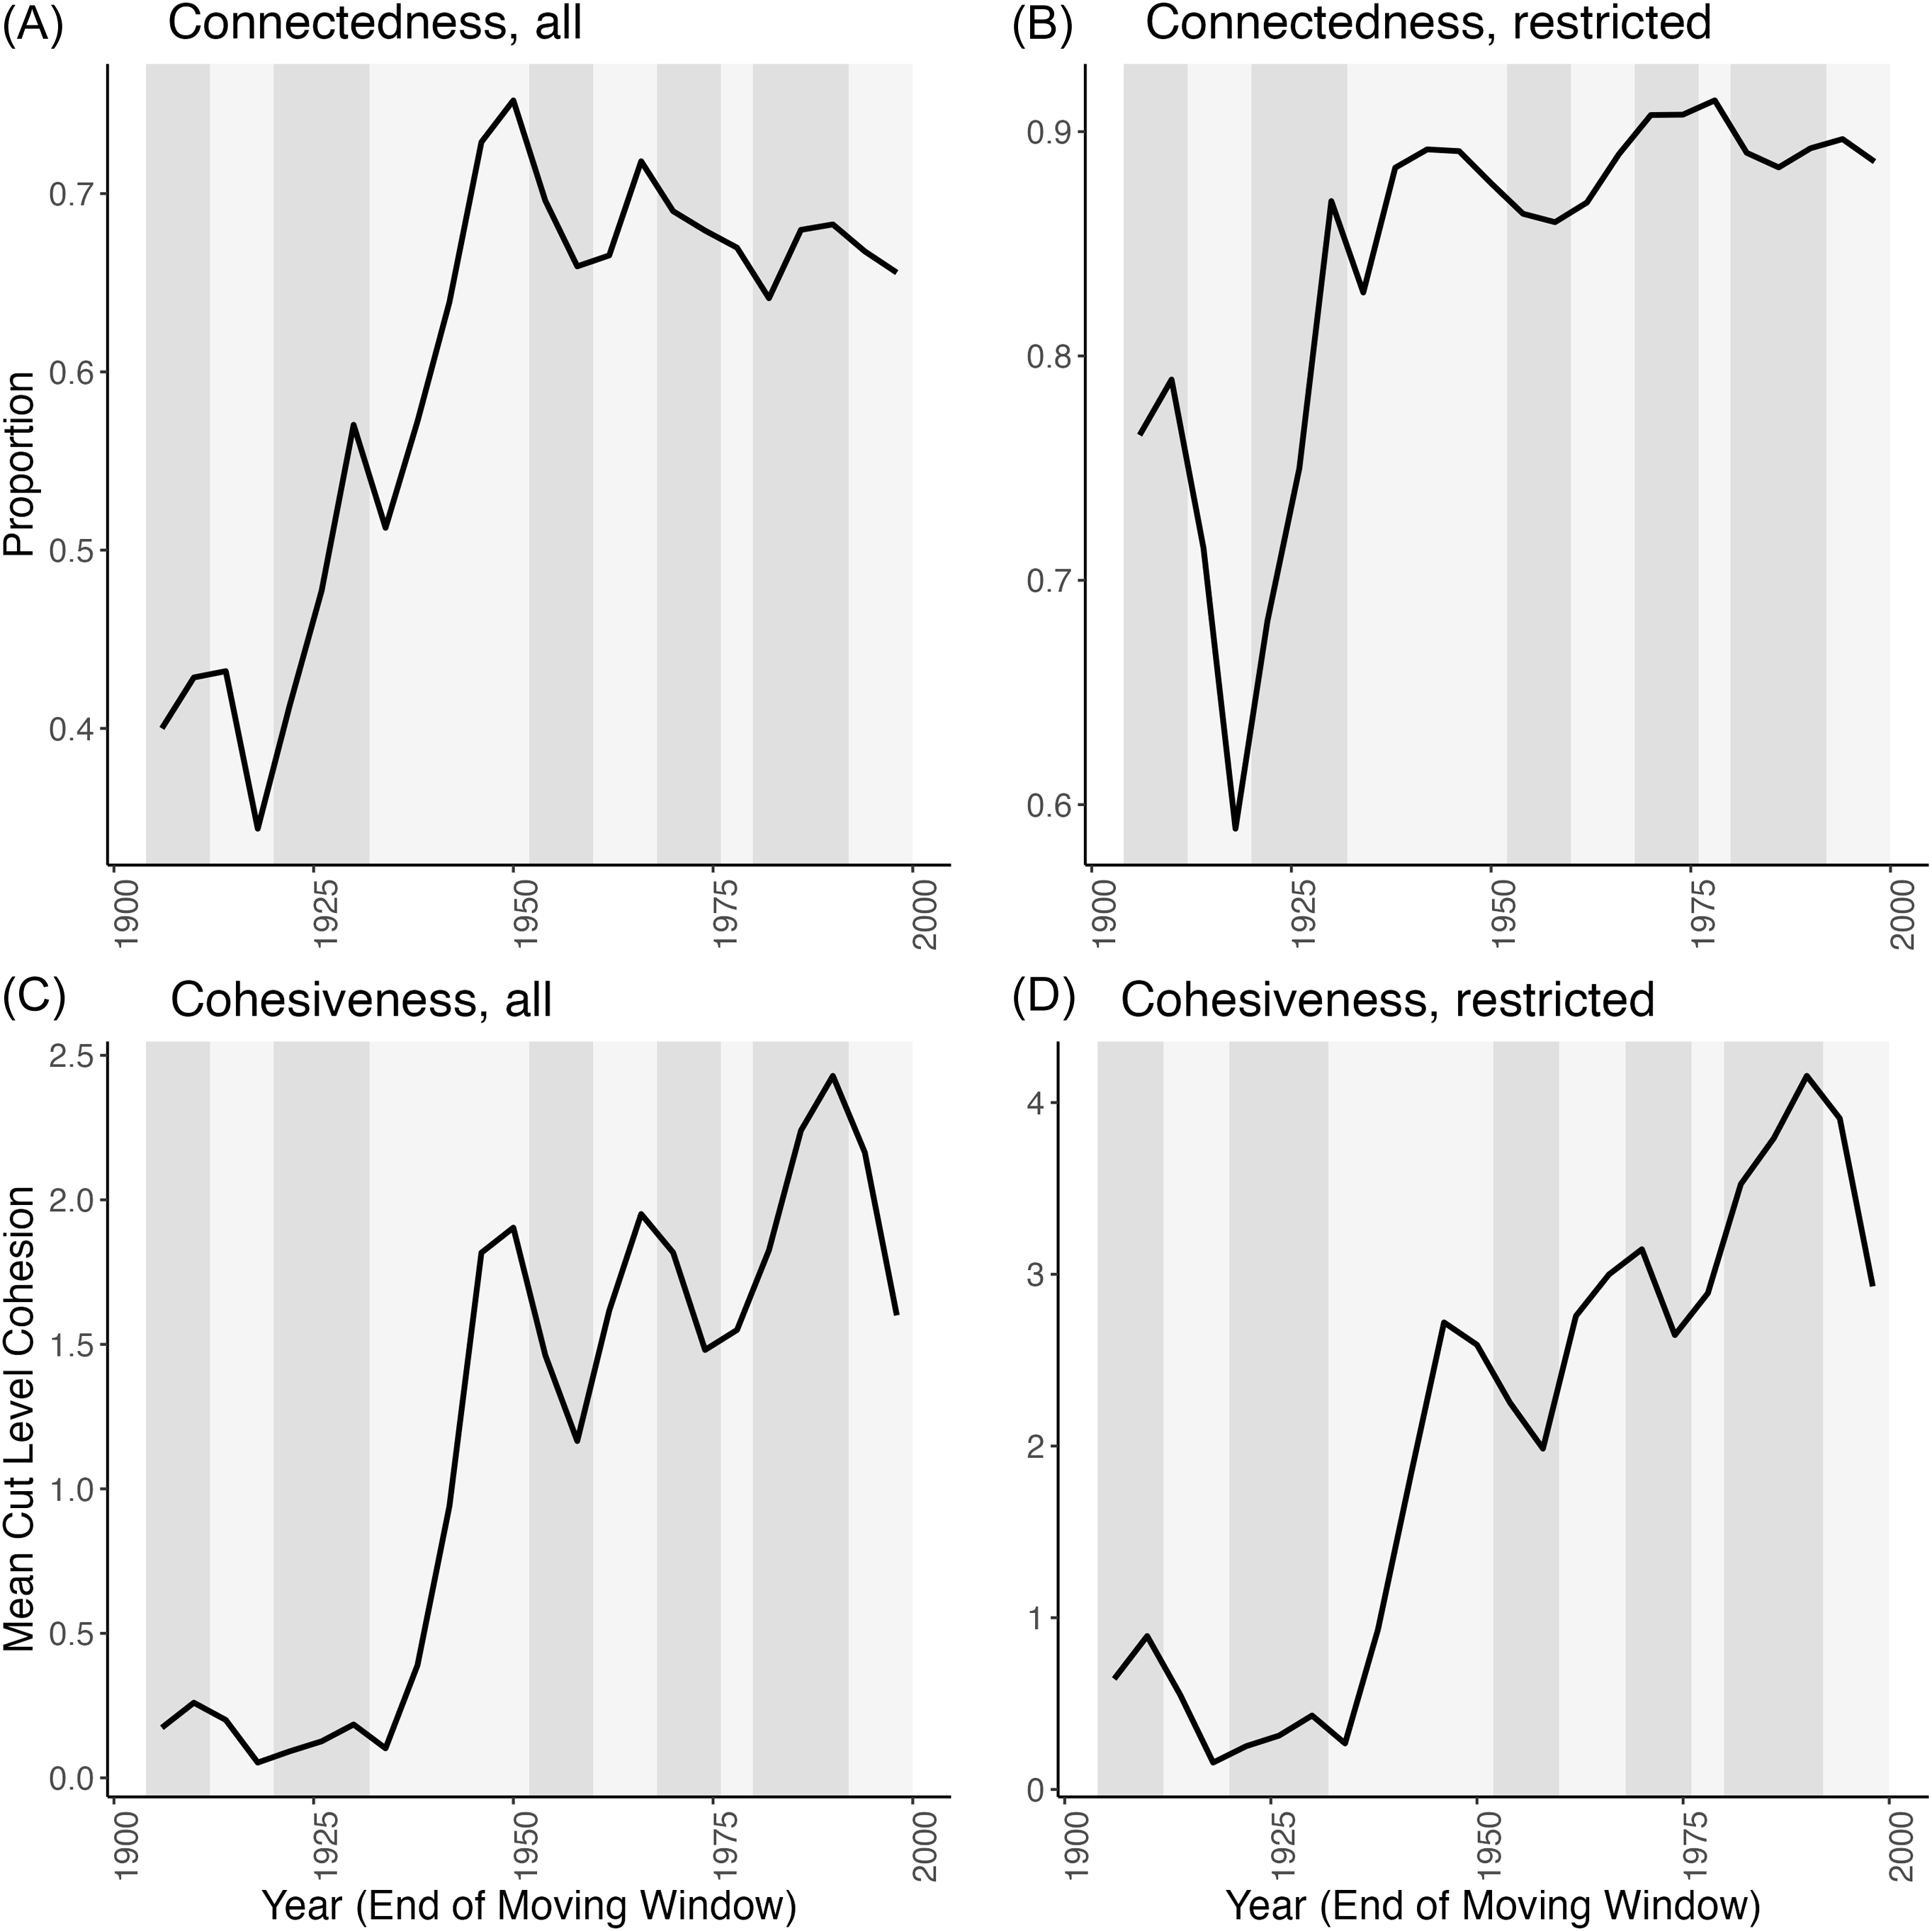
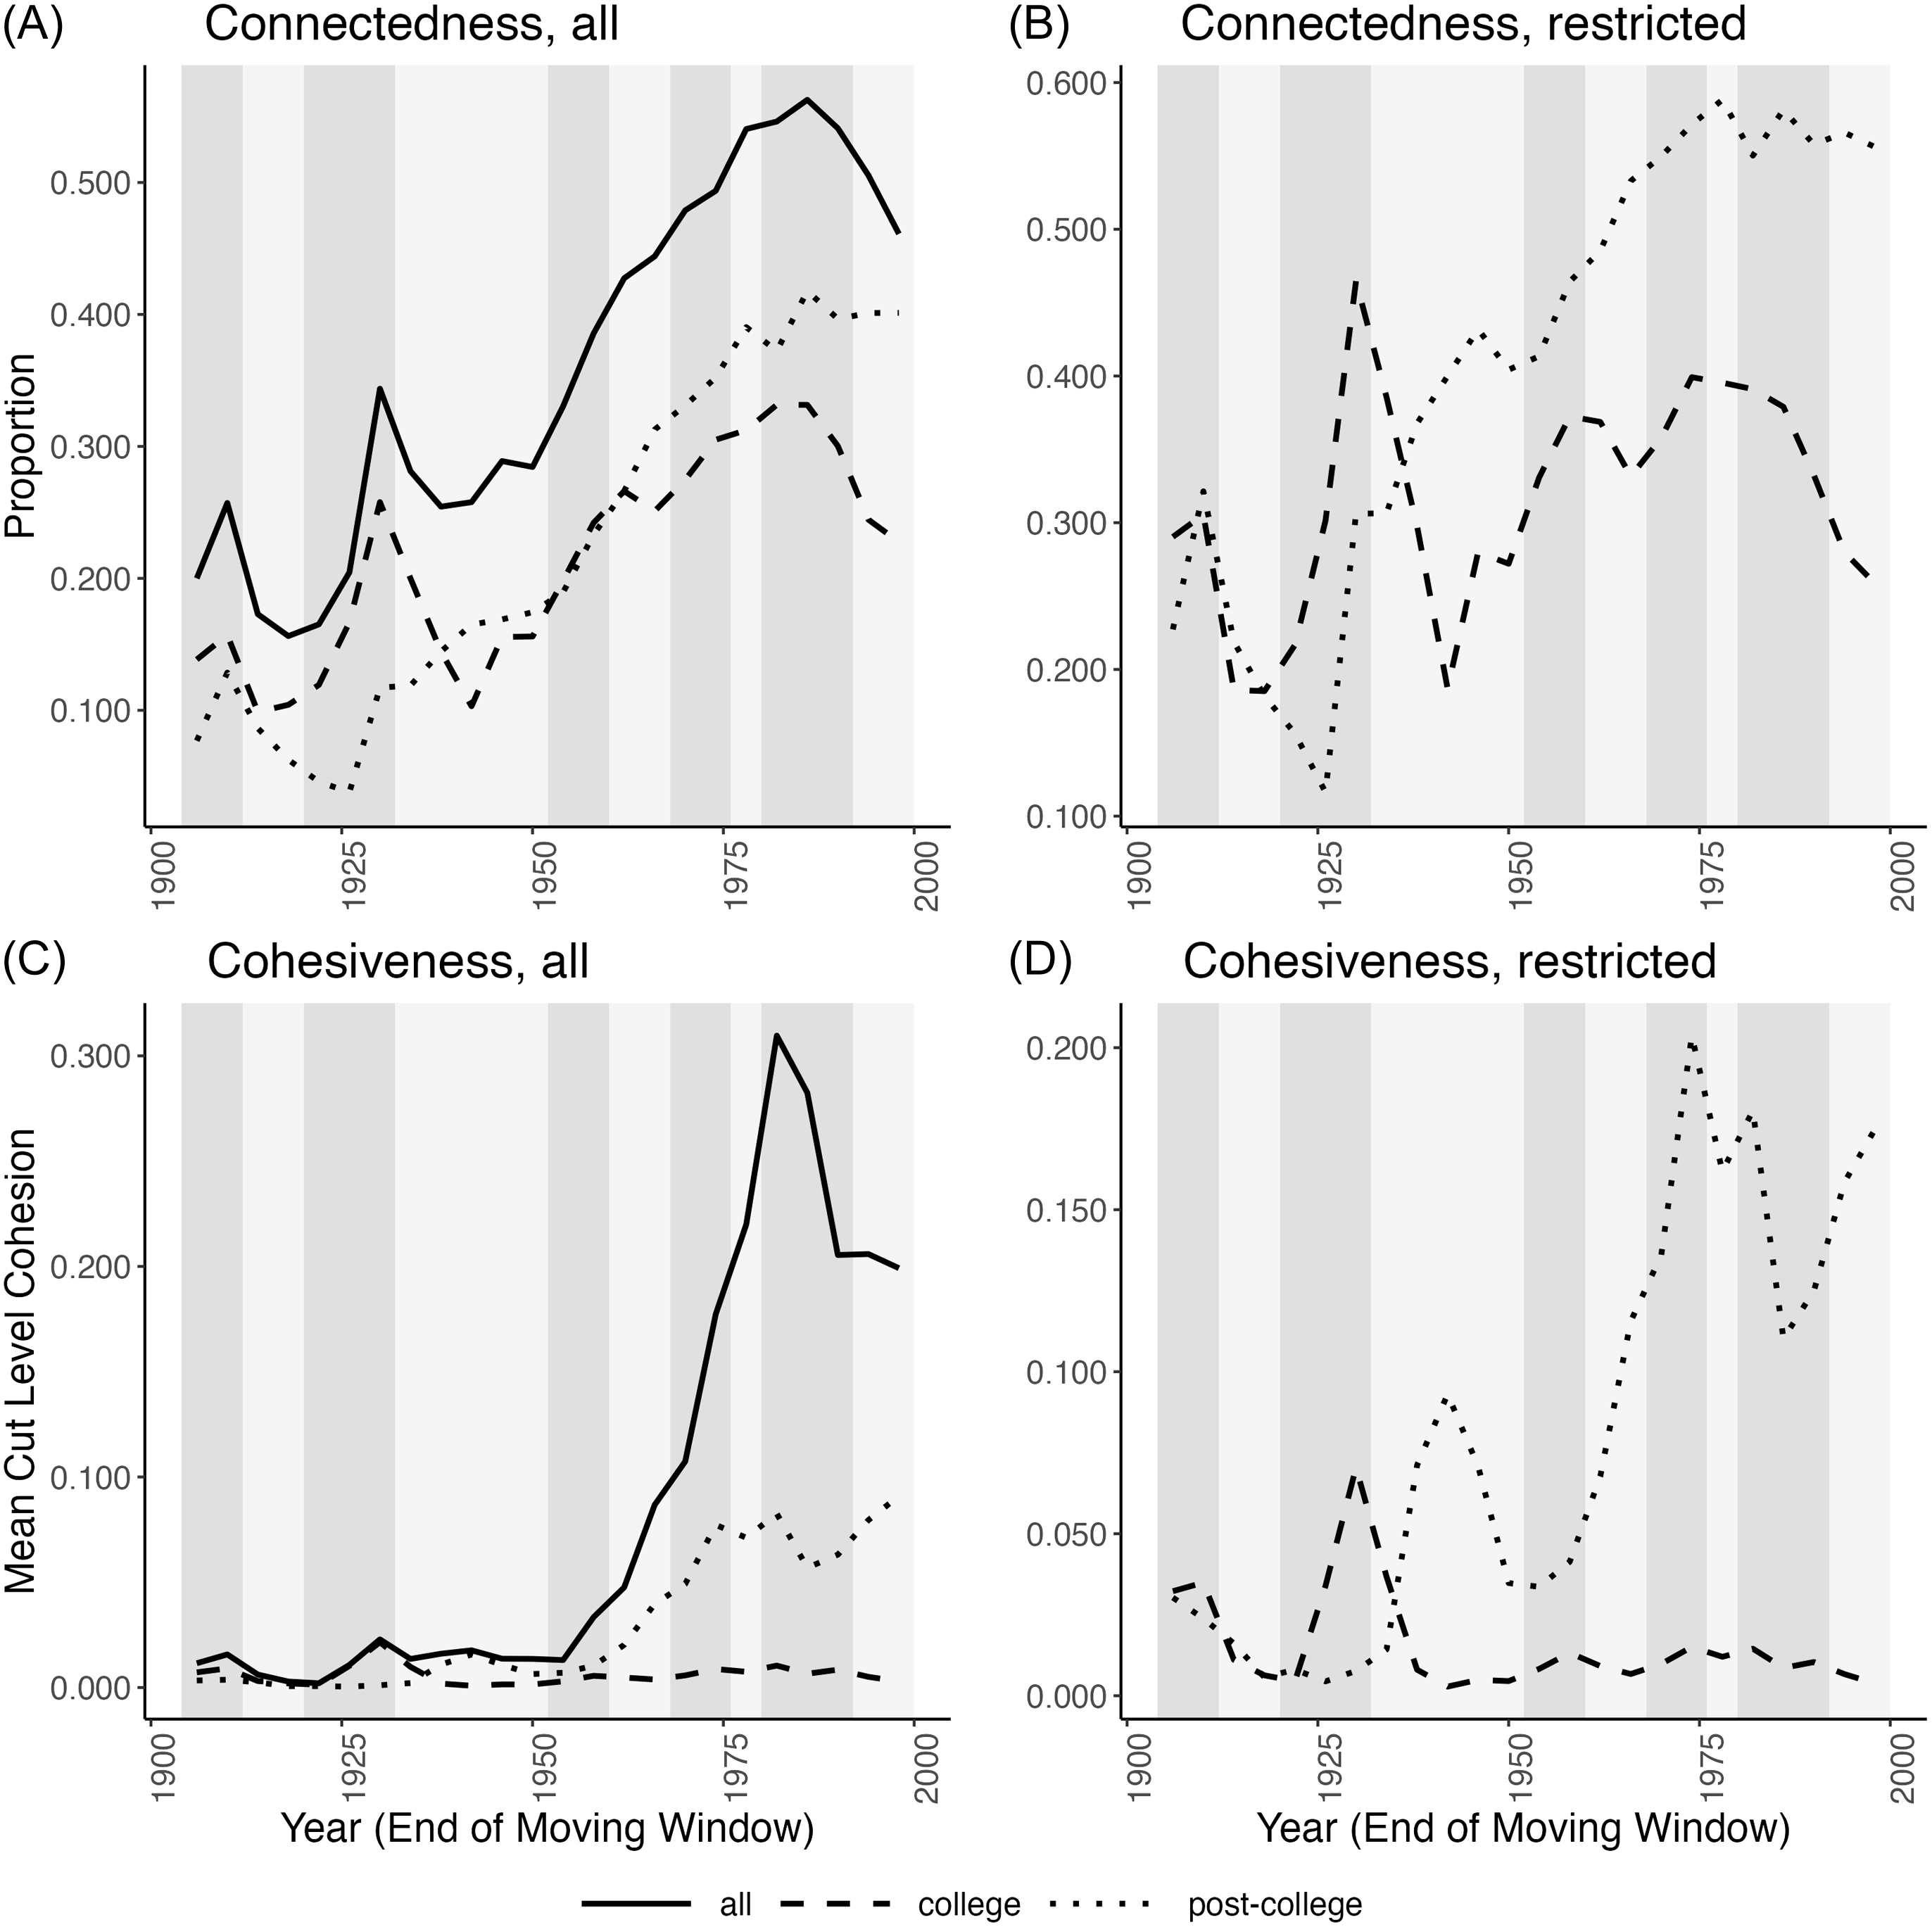
Fig. 1 shows the development of educational cohesion over time. Panel A presents, for each time window, the proportion of people in the sample with at least one educational tie (solid line), at least one college tie (dashed line), and at least one post-college tie (dotted line). The results demonstrate that a considerable, and increasing, number of elites crossed paths in schools and universities prior to being appointed to an elite position. The proportion of people with at least one educational tie, either college or post-college, rises from around 20 percent at the beginning of the study period to more than 55 percent by the end of the 1980s, before falling slightly to around 45 percent in 1998. The proportion of people with at least one college tie increases from around 10 percent in 1942 to more than 30 percent in the 1980s. Post-college ties show an even more pronounced increase from less than 10 percent to 40 percent.
Connectedness and cohesiveness of educational networks over time.
Note: The figures on the left (panels A and C) include all observations in the moving window; the figures on the right (panels B and D) restrict the analysis of college ties to those who attended college and the analysis of post-college ties to those who attended graduate school. Vertical bands show the party of the administration (light gray for Democrats and dark gray for Republicans).

Panel C presents an analogous graph for cohesiveness. Cohesiveness is relatively low for the first half of the twentieth century but then rises from .01 in 1954 to .3 in 1982, before declining to .2 at the end of the study period (solid line). Thus, not only is an ever-larger proportion of elites integrated into the educational network, that network also becomes more cohesive in terms of mean cut-level cohesiveness. Examining the two educational networks separately (dashed and dotted lines), however, only the network of post-college ties shows evidence of increasing cohesion after World War II.
While the denominators in the proportions in Panels A and C contain all people who were sampled in that time window, Panels B and D restrict the analysis of college (post-college) ties to those who received a college (graduate) degree. It is worth emphasizing that conditioning the analyses in this way tells a different, but not necessarily a more accurate story. Even if the observed increase was merely a function of more people attending college (graduate school) (which they are not), this would not change the fact that cohesion increases, with all the possible consequences of high elite cohesion discussed above.Footnote 5 Nonetheless, comparing Panels B and D to Panels A and C provides a sense of the extent to which the changes discussed so far are due to changes in the proportion of elites who attended college (graduate school). Looking at Panel B, the proportion of people with a post-college tie among those who attended a graduate institution triples over the century. The proportion of people with a college tie, however, no longer shows consistent evidence of increasing cohesion, suggesting the increase in Panel A is largely due to a rise in the proportion of people attending college, not a growing tendency to form ties among those who attended college. Similarly, Panel D shows a strong increase in cohesiveness for the graduate network, but no change for the college network.
These findings point to fundamental changes in US elite recruitment. The documented increase in the proportion of elites with a college tie went hand in hand with the decrease of another historically important source of elite cohesion – the family. While I do not have data on the kinship relations among the administrative elites studied here, previous work has shown that the percentage of members of Congress with relatives in Congress declined from more than 40 percent in 1789 to less than 10 percent at the end of the twentieth century (Bó et al. Reference Bó, Dal Bó and Snyder2009). Assuming a similar decline for political appointees, one may argue that family-based cohesion was initially substituted with college-based cohesion. But as more and more Americans went to college during the twentieth century, colleges appear to have lost their role as cohesion-producing institutions among future political appointees (see also Brint and Yoshikawa Reference Brint and Yoshikawa2017), and elite cohesion shifted again, this time to graduate education (for a related argument about intergenerational mobility, see Torche Reference Torche2011). While recruitment at least up until the 1930s tended to rely more on undergraduate cohesion, after the 1950s it focused more heavily on post-college ties.
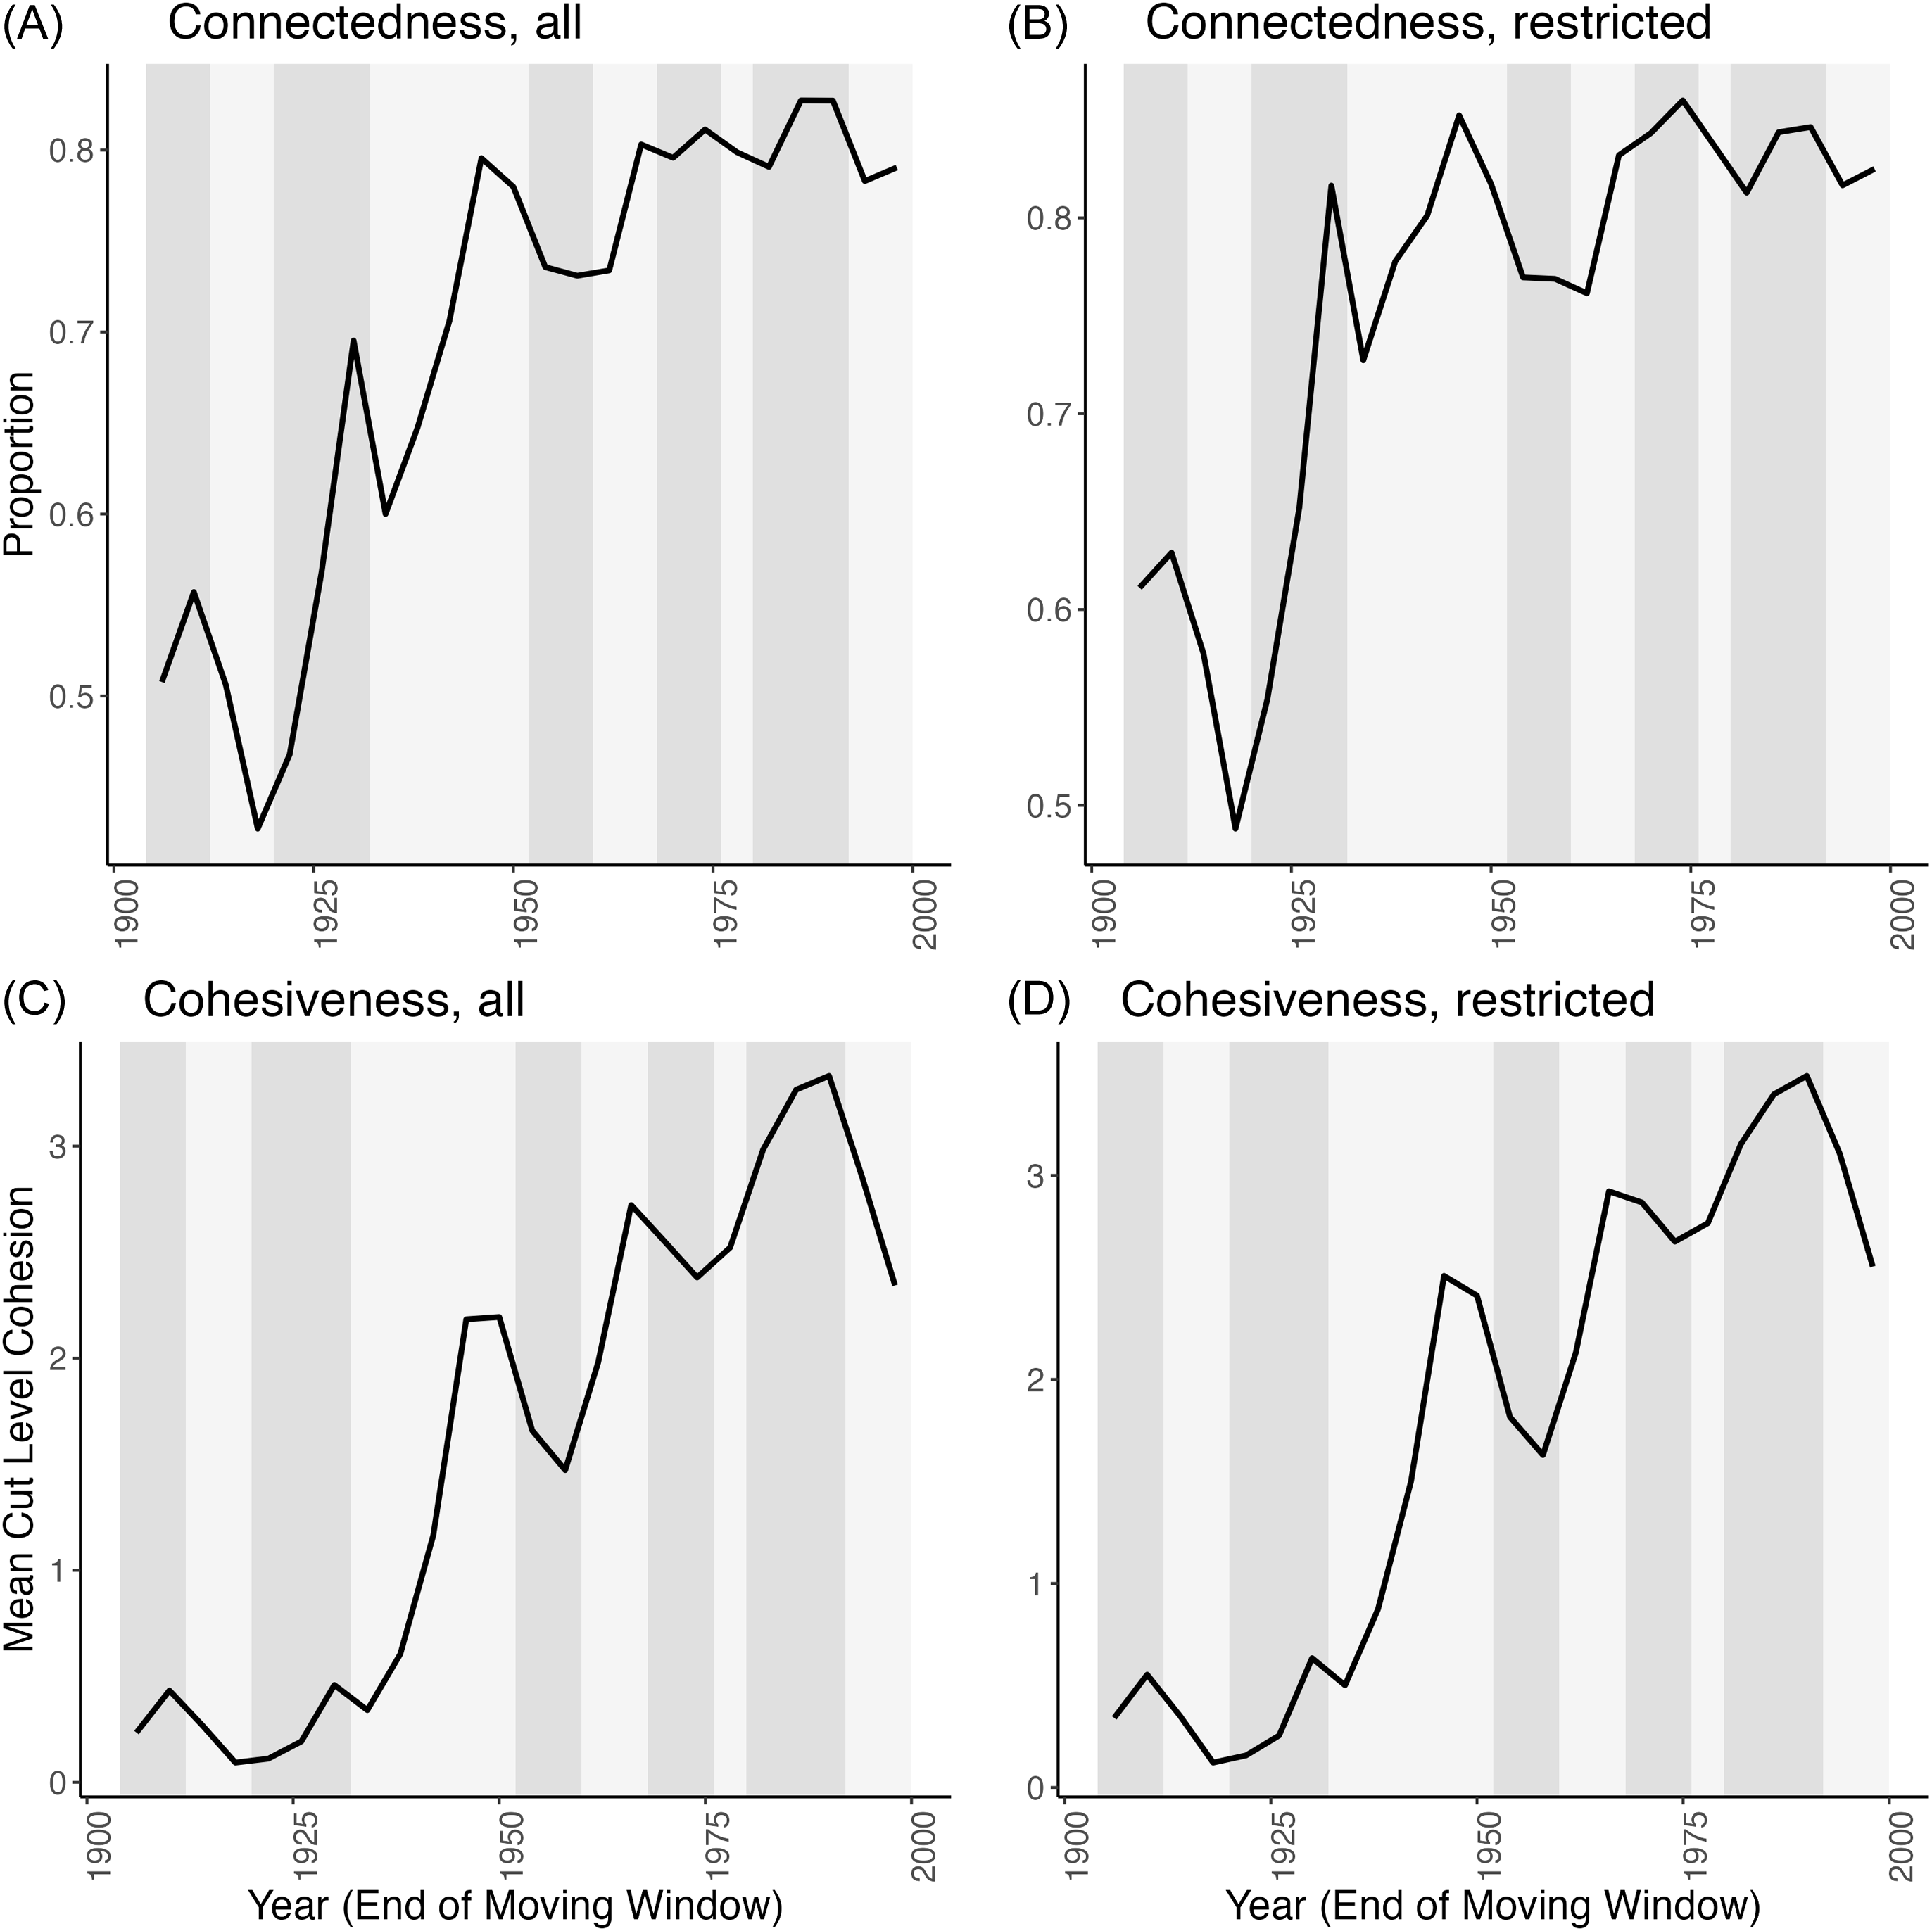
Fig. 2 presents analogous measures of connectedness and cohesiveness for the co-working networks, both in an unrestricted and a restricted version. The co-working networks are overall noticeably more cohesive than the co-educational networks. Like the co-educational networks, they exhibit significant changes over time. The proportion of people with at least one workplace tie increases from around 40 percent at the beginning of the twentieth century to 75 percent in 1950 (Panel A) and cohesiveness jumps from .1 in 1934 to 1.9 in 1950 (Panel C). This rise goes hand in hand with the expansion of the American administrative state that began during World War I and further intensified during the New Deal Era and World War II. This puts Mills’ observations about post-World War II America into perspective. The decades leading up to the publication of The Power Elite, in which Mills voiced deep concern with the concentration of power in the hands of a small “power elite,” also witnessed a dramatic growth in cohesion among political appointees based on their shared work experience in the federal government.Footnote 6 After World War II, the proportion of non-isolates no longer increases, and even declines slightly, but stays well above 60 percent. Cohesiveness, on the other hand, increases further to 2.4 in 1990.
Connectedness and cohesiveness of workplace networks over time.
Note: See Fig. 1, except that Panels B and D restrict the analysis to people who worked in the federal government prior to their elite appointment.
The restricted analyses show similar patterns. As early as 1930, more than four out of five political appointees with previous work experience in the federal government had a tie to at least one other person who had previously worked in the federal government (Panel B). In addition, the decline in connectedness towards the end of the time period that could be seen in Panel A has disappeared, indicating that it was driven by a decline in the proportion of people with prior government experience. The pattern for cohesiveness is almost identical to the one in the unrestricted version, although at a higher level, now climbing to around 4.0 in 1990 (Panel D).
Finally, instead of analyzing educational and workplace ties separately, I pool them into a combined network. I do this because overlap between the two sets of ties is relatively low: the percentage of educational ties contained in the workplace ties is consistently below 20 percent, while the percentage of workplace ties contained in the college ties is never more than 5 percent. In other words, the two types of ties tend to be substitutes rather than complements, suggesting that pooling them would lead to higher values of connectedness and cohesiveness. As can be seen in Fig. 3, this is indeed the case. The proportion of non-isolates rises from around 50 percent in the first quarter of the twentieth century to 85 percent in the Carter administration (Panel A), and cohesiveness increases from below .5 to more than 3.5 (Panel C). The restricted versions (Panels B and D) are almost identical because most people in the sample either had a college/graduate education or had worked in the federal government.
Connectedness and cohesiveness of combined networks over time.
Note: See Fig. 1, except that Panels B and D restrict the analysis to people who went to college or graduate school or worked in the federal government prior to their elite appointment.
While these two measures of cohesion demonstrate important structural changes over time in both types of networks, as well as the combined network, they do not fully characterize the overall topology of these networks. Fig. 4, therefore, presents the combined network for four selected time windows: the beginning of the time series (1898–1906), just before the rapid increase in cohesiveness that begins in 1934 (1926–1934), halfway through the time series (1946–1954), and the time window with the highest level of cohesiveness (1982–1990). (Analogous graphs for the educational and workplace networks can be found in Appendix D.)
Graphs of combined networks for four time windows.
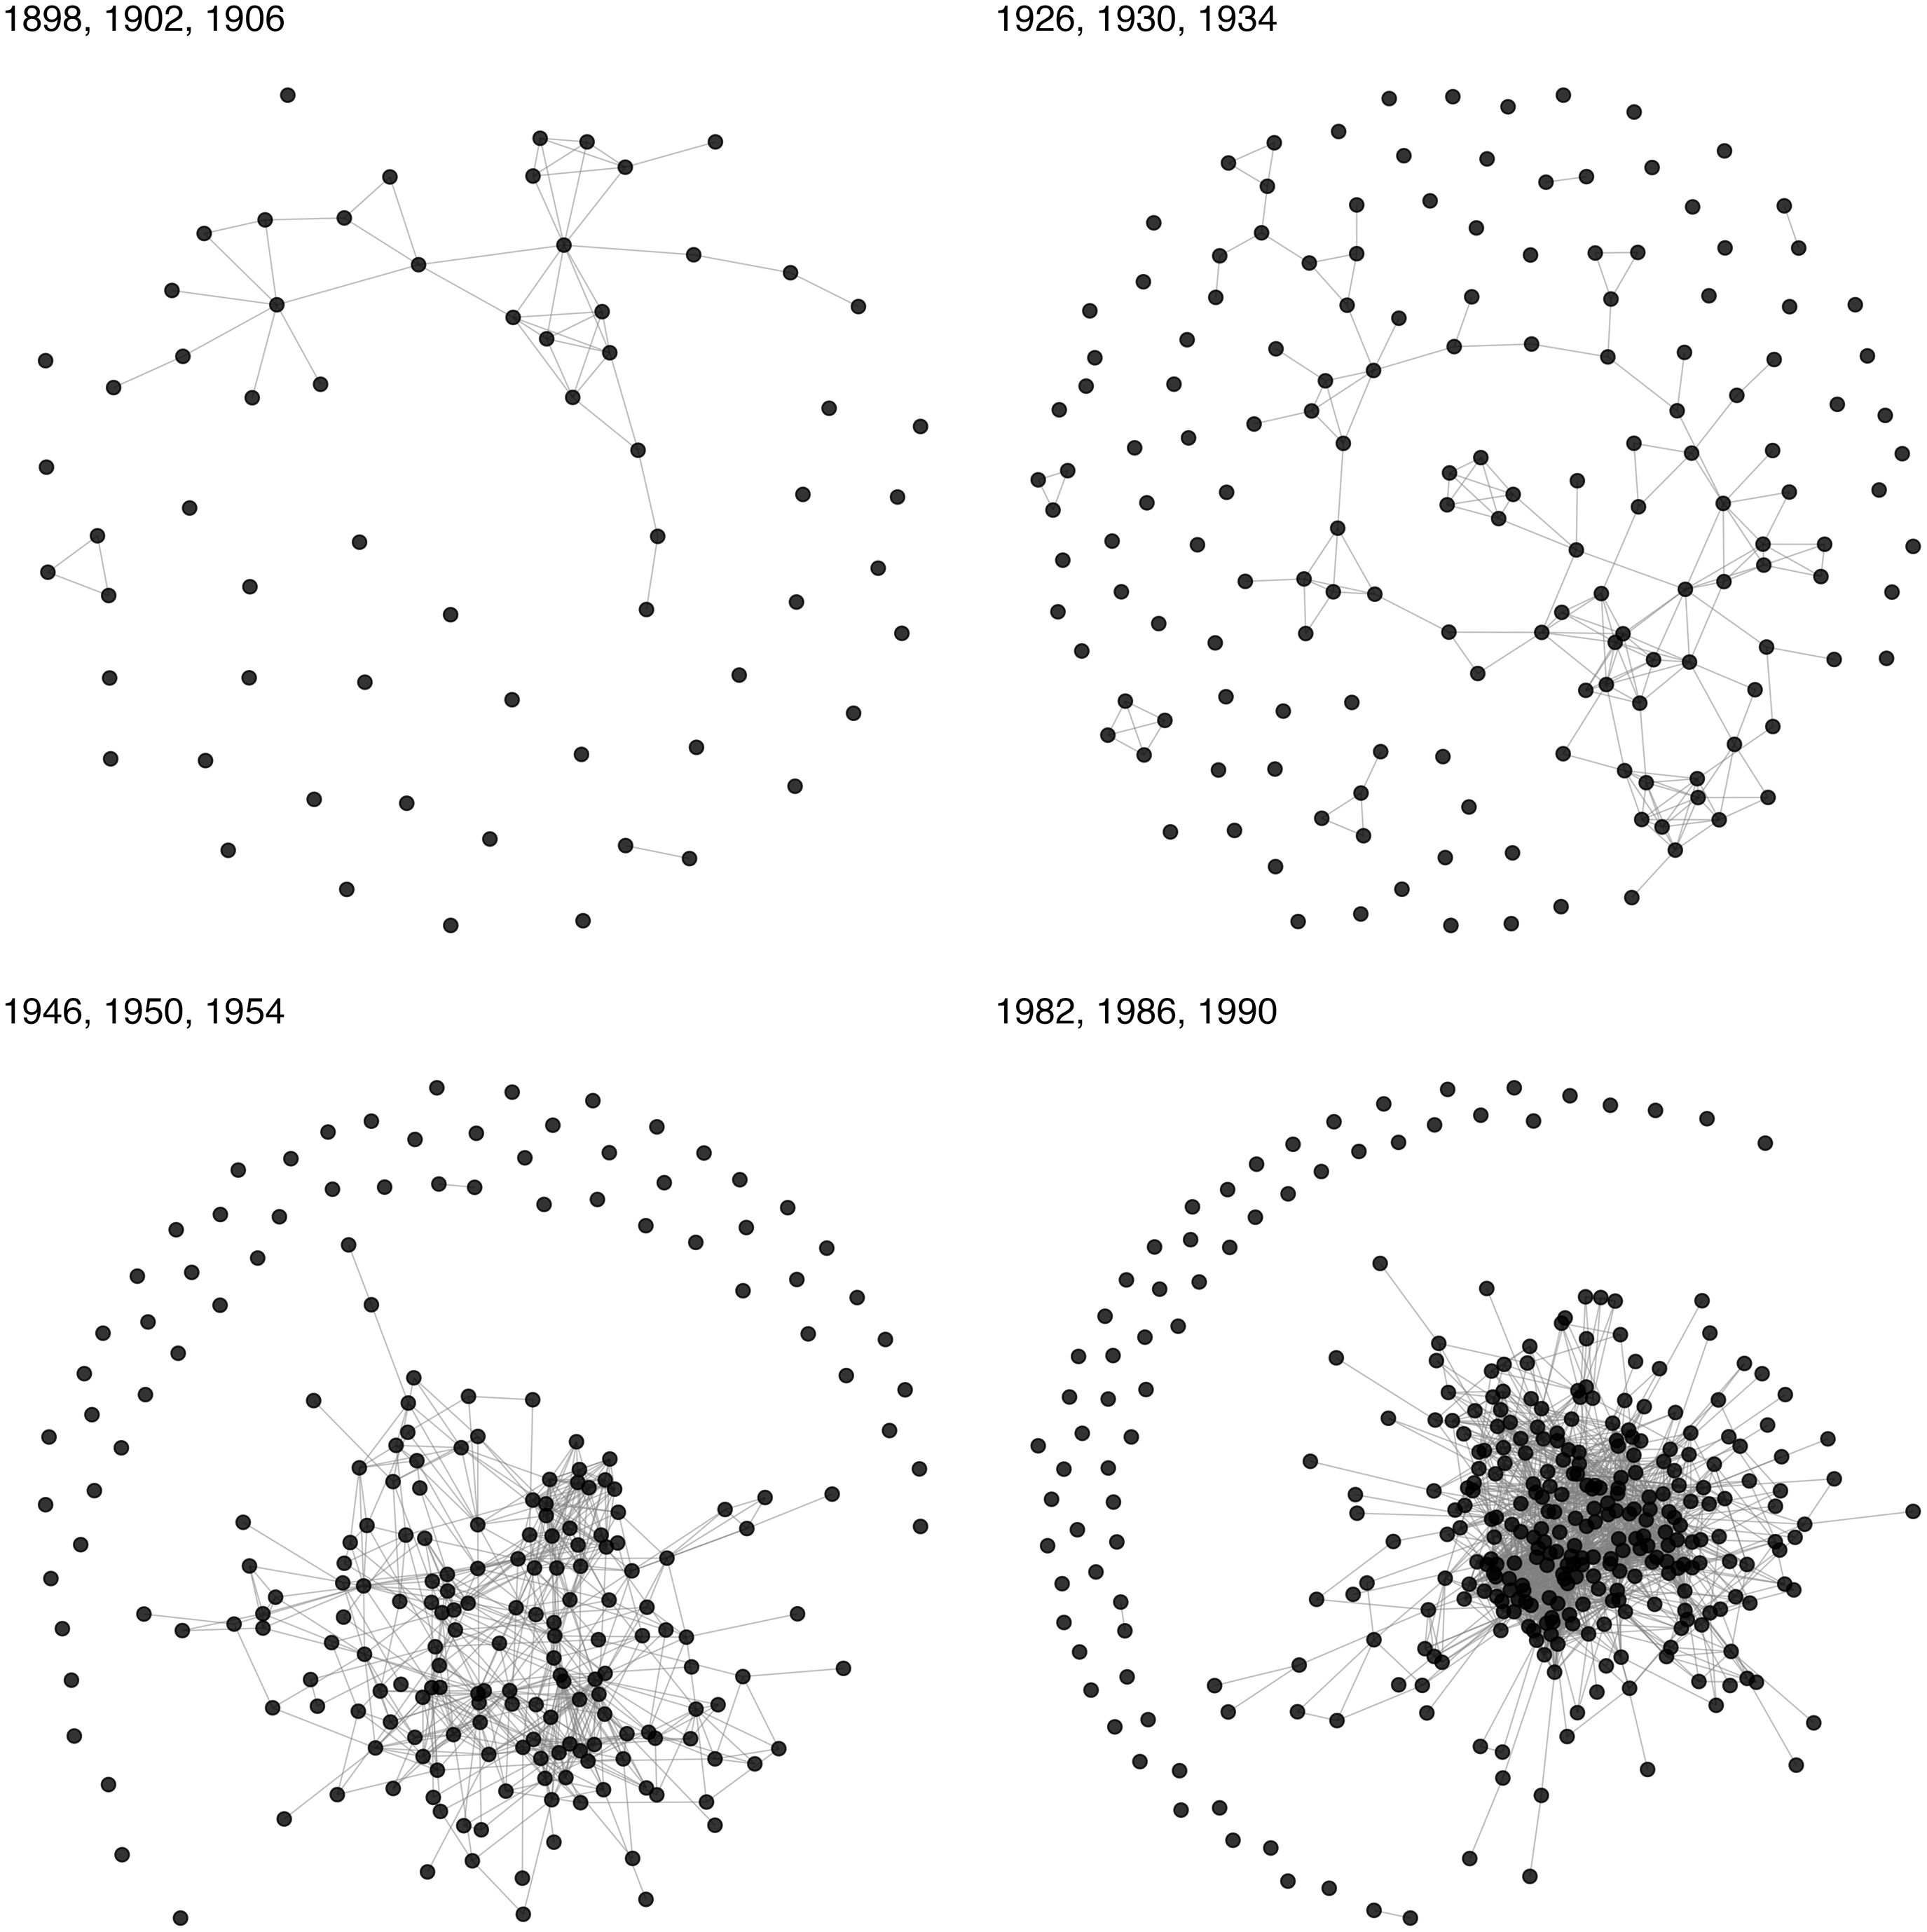
The four network graphs confirm earlier findings: the proportion of isolates declines over time and the nodes become more densely connected. But they also show an important additional feature: all four networks consist of one large component, a few smaller components, and several isolates. Thus, instead of the network splintering into multiple disconnected subgroups, the political appointees who have a tie are almost all part of one large component. In the first time window (1898–1906), 28 of the 65 (45 percent) nodes are part of the largest component, only five are in smaller components, and 32 are isolates. In the last time period (1982–1990), the network consists of 353 nodes, with 295 (84 percent) in the largest component, only four in smaller components, and 54 isolates.
Overall, these analyses provide evidence of a marked increase in elite cohesion based on education and, in particular, prior shared work experience in the federal government. As the American state grew in size and complexity, elite recruitment relied more heavily on people whose career paths had crossed in educational institutions or during their prior service in the state.
It is important to emphasize that these findings are based on a series of cross-sections and do not imply persistent elite networks over time. Political appointees’ careers are highly sensitive to changes in administration, leading to partisan cycles in which incoming governments replace a large share of their predecessors’ appointees to ensure ideological alignment with administrative agencies (Spenkuch et al. Reference Spenkuch, Teso and Xu2023). This dynamic is evident in my data. When a new administration from the same party takes office, on average, 44 percent of the sampled appointees had been appointed to their position by an earlier administration, whereas only 24 percent had been appointed by a previous administration when control shifts to the opposing party.Footnote 7 Clearly, there is high turnover driven by changes in government, particularly when party control shifts. Although this turnover limits continuity in personnel across administrations, 72 percent of all ties link appointees who served under different administrations, indicating substantial cross-administration connections. Moreover, high turnover does not change the fact that, at any given moment, there is considerable cohesion among those directing the administrative state.
A critical question that follows from this is whether the ties studied here predominantly foster within-party cohesion or provide cross-party connections. When excluding independents and appointees for whom party affiliation is unavailable, I find that 54 percent of educational ties and 62 percent of workplace ties connect political appointees of the same party. This indicates a tendency toward intra-party connections, particularly in workplace ties. Nevertheless, a sizable proportion of ties link individuals across party lines. This finding aligns with the patterns observed in Fig. 4: rather than producing distinct partisan clusters, these ties increasingly integrate elites from different parties into a single, cohesive component.
Organizational cohesion
So far, I have shown that a growing number of political appointees are connected to others who served around the same time. But do individuals who share a tie attain elite positions within the same government agency, or do they end up in different agencies? This question is important because it provides insight into the potential role of the ties studied here. A high proportion of intra-agency ties, for example, might suggest their significance for elite recruitment. In contrast, a high prevalence of inter-agency ties may indicate that these connections play a crucial role in fostering collaboration, facilitating information sharing, or coordinating policy initiatives across agencies. Answering this question thus leads to a deeper understanding of the dynamics of elite cohesion within the broader structure of the American state.
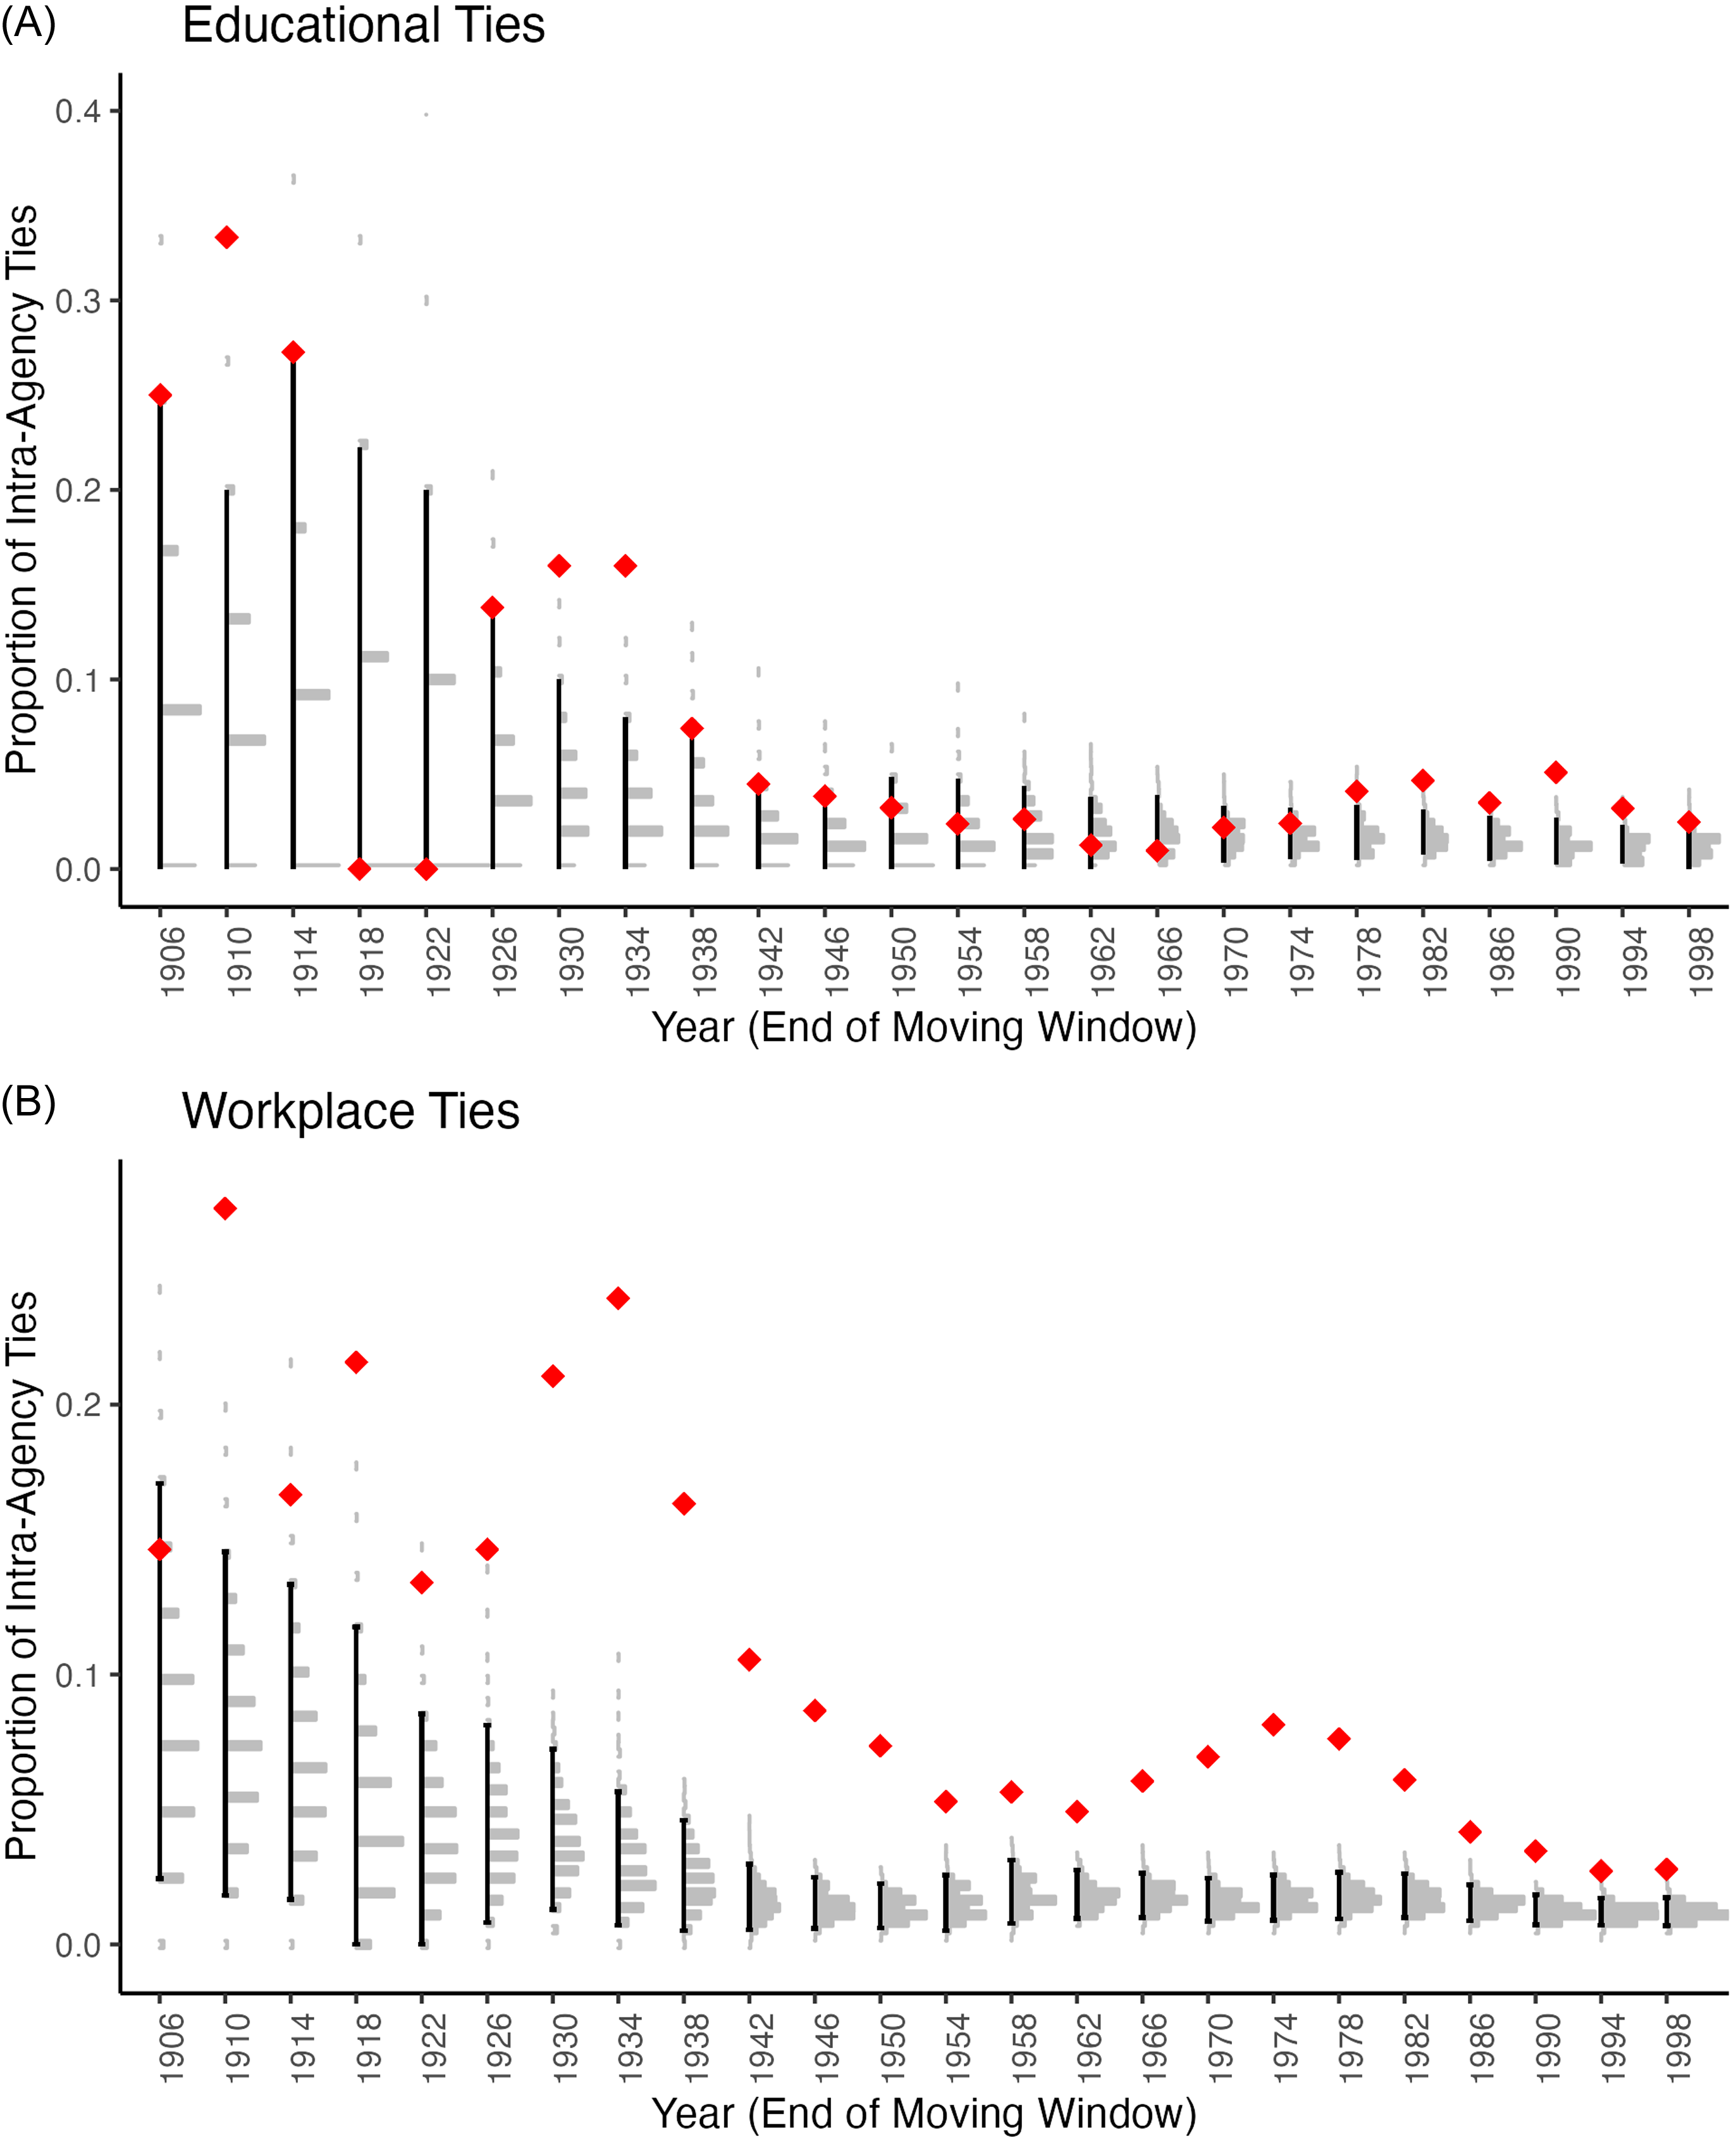
The squares in Fig. 5 show, for each time window, the proportion of intra-agency educational ties (Panel A) and workplace ties (Panel B). While at the beginning of the time series the proportion of intra-agency educational ties reaches levels close to 30 percent (which is not surprising given the small number of agencies at the time), it never exceeds 10 percent after 1934 and 5 percent after 1950. With respect to workplace ties, the share of intra-agency ties reaches levels above 20 percent in the first third of the twentieth century but then remains below 10 percent.
Concentration of educational and workplace ties in government agencies.
Note: The squares show the observed proportions, the histograms the simulated proportions under random assignment of people to government agencies, and the black bars the 2.5th and 97.5th percentiles of the distributions of simulated proportions.

These low values can be explained by the sampling strategy used to construct the dataset. Because only two people were sampled per agency in each sample year, the potential for intra-agency ties to appear in the data is relatively low. Even when combining data from three sample years using the moving window approach, this potential remains limited. Therefore, it may be more informative to compare the observed values to those obtained from a model of random tie creation. To do this, I randomly reshuffle the government agencies to which individuals were appointed and recalculate the proportion of intra-agency ties for the simulated dataset. I repeat this process 1,000 times to generate a distribution of proportions under random assignment of individuals to government agencies. This distribution reflects the expected proportion of intra-agency ties if the presence of a tie was independent of where in the federal government individuals are appointed.
The resulting distributions are shown as gray histograms in Fig. 5. Although the proportion of intra-agency educational ties is relatively low throughout the entire time period, from 1926 to the end of World War II, and again from 1978 onwards – and thus coinciding with the increasing dominance of post-college education – educational ties consistently cluster in government agencies to a higher extent than expected under random assignment. For workplace ties, this pattern is even more pronounced: the proportion of intra-agency ties is consistently and significantly higher than expected under random assignment. Put differently, sharing a tie increases the likelihood that two individuals will end up in elite positions within the same government agency.
These findings suggest that the connections examined here may have played a role in the recruitment process. This hypothesis is further supported by the fact that 87 percent of intra-agency educational ties and 83 percent of intra-agency workplace ties link appointees who were appointed in different years so that one was already working in the agency when the other was appointed. Although my data can provide no direct evidence that these relationships were instrumental in the hiring process, the findings align with a view of elite recruitment based on preexisting connections, where appointees recommend individuals they know from school or prior work experience for appointments.
Nonetheless, the vast majority of educational and workplace ties provide connections across, rather than within, agencies. While a detailed examination of these inter-agency ties is beyond the scope of this study, an example helps illustrate their structure. Fig. 6 presents the undirected agency network for the two terms of the Clinton administration (sample years 1994 and 1998), shown both as a network graph (top) and as an adjacency matrix (bottom). In the graph, node shapes reflect a standard classification of agencies: circles for cabinet agencies, triangles for independent agencies and commissions, and squares for agencies within the Executive Office of the President (EOP).
Network of government agencies, 1994–1998.
Note: The nodes represent the agencies of the federal government in which the elites were sampled. Circles show cabinet departments, squares agencies belonging to the Executive Offices of the President, and triangles independent agencies and commissions. An edge is created between two agencies if elites from those two agencies shared an educational or workplace tie. The edge width is proportional to the number of such ties connecting two agencies. The node size is proportional to the number of ties within that agency. In the corresponding adjacency matrix, the darker the cell the larger the number of ties connecting two agencies. The rows and columns are arranged based on the solution from a hierarchical clustering analysis using Ward’s method as implemented in the R library hclust.
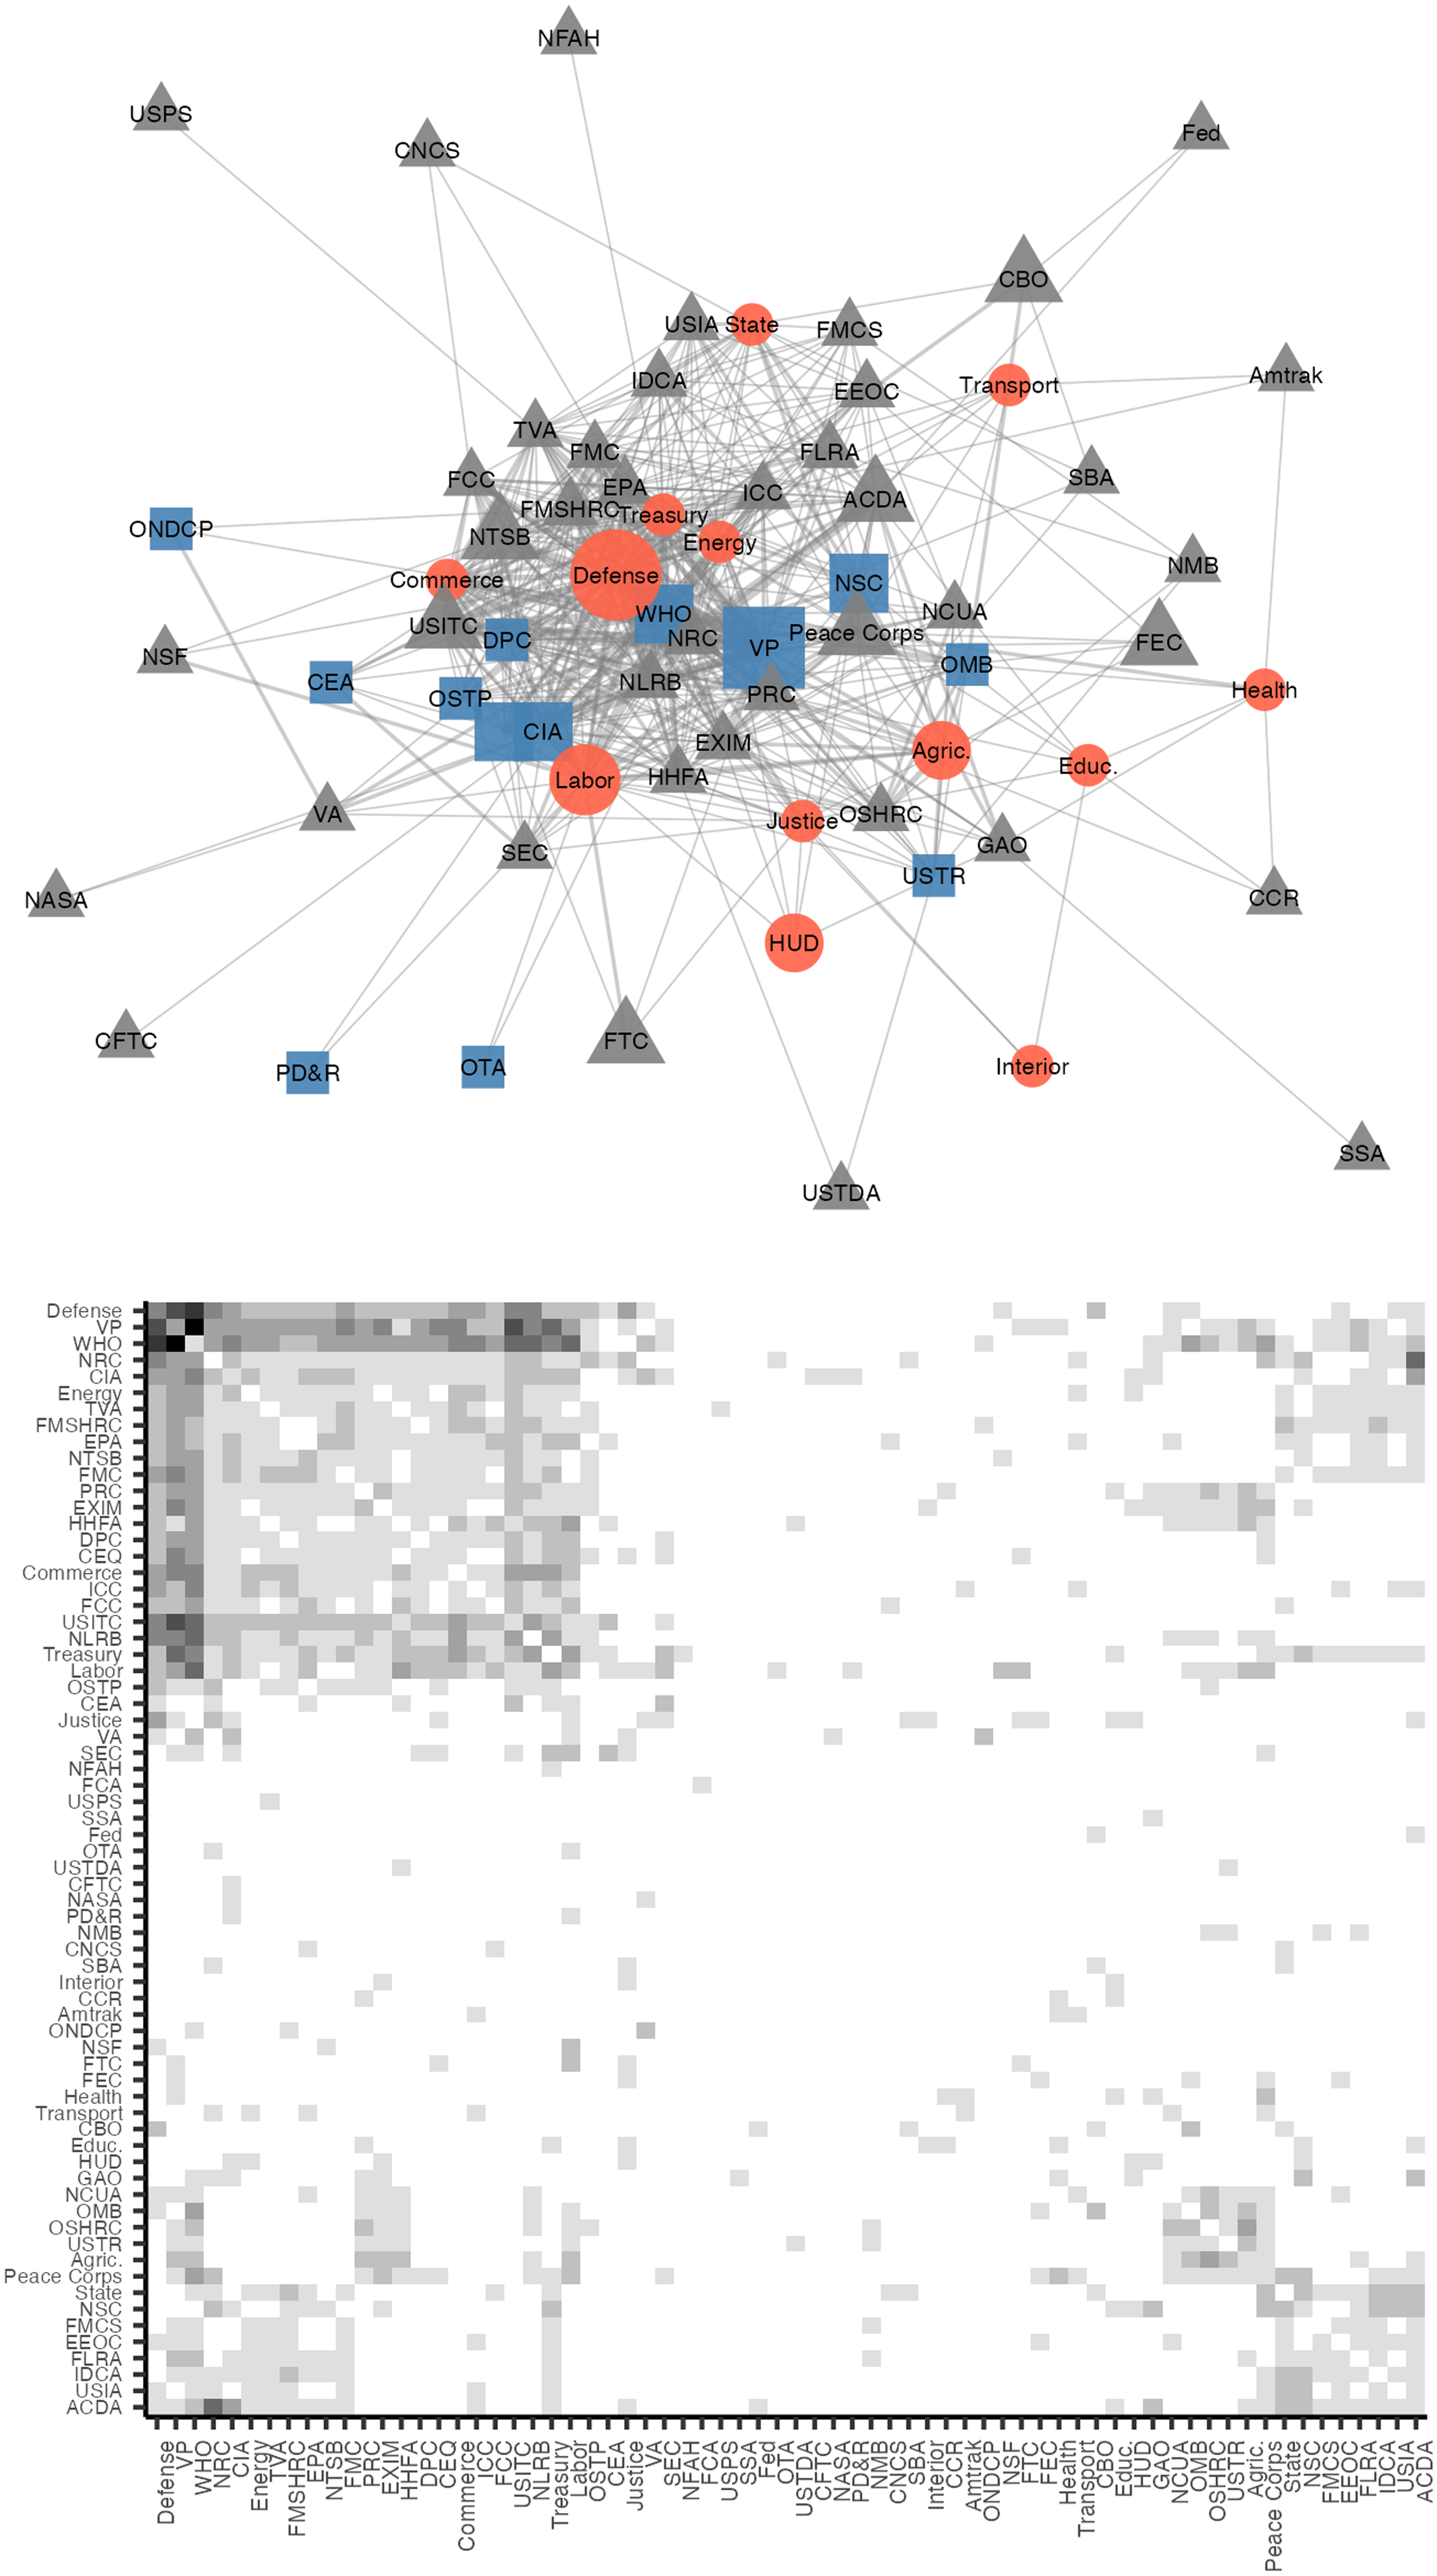
This visualization reveals several key features. First, educational and workplace ties create connections among a large number of government organizations. Of the 76 unique agencies sampled at these two-time points, 67 appear in this network. These agencies are connected by 548 edges. Moreover, the three types of agencies – cabinet agencies, EOP agencies, and independent agencies and commissions – are highly interconnected instead of constituting distinct clusters. Second, the two organizations with the highest degree of centrality are the White House Office (WHO)Footnote 8 and the Office of the Vice President (VP), followed by the Departments of Treasury and Defense, the CIA, and the Nuclear Regulatory Commission (NRC). The centrality of the WHO and VP during the 1990s, which also share the largest number of inter-agency ties, reflects the increasing centralization of political authority within the executive branch throughout the twentieth century (e.g., Moe Reference Moe, Chubb and Peterson1985). This centralization story is not restricted to the WHO and VP but also includes other agencies close to the oval office like the CIA, the Council of Economic Advisors (CEA), the Office of Management and Budget (OMB), and the Domestic Policy Council (DPC). It thus appears that elite cohesion is particularly strong in agencies close to the White House and in the major cabinet agencies. Third, there is some thematic clustering in the network. For example, a cluster centered on foreign policy links agencies such as the State Department, the National Security Council (NSC), the Arms Control and Disarmament Agency (ACDA), the United States Information Agency (USIA), and the International Development Cooperation Agency (IDCA). Finally, the network structure reflects the political context of the post-Cold War era, with a notable emphasis on arms control and nuclear regulation.
Conclusion
Most research on elite cohesion in America has focused on economic elites, and particularly on ties formed through shared membership on corporate (and occasionally non-corporate) boards. In contrast, political elites – especially the political appointees at the top of the American administrative state – have received comparatively little attention. Using a novel dataset of the career histories of more than 2,000 political appointees, this article provides the first systematic descriptive examination of change in social cohesion among this group between 1898 and 1998, focusing on connections formed through educational institutions and federal government agencies. The findings reveal significant trends that challenge the conventional portrayal of political appointees as disconnected “in-and-outers.”
Even though the American state lacks the institutionalized recruitment channels found in more “statist” countries, a substantial proportion of political appointees’ career paths intersected in schools and federal government agencies prior to their elite appointments. Education-based cohesion increased notably in the three decades following World War II, and by the late 1980s, approximately 55 percent of the sampled elites shared at least one educational tie with another political appointee (Fig. 1). Workplace-based cohesion rose significantly in the first half of the twentieth century, peaking during World War II, when 75 percent of the sampled elites had a workplace tie (Fig. 2). Thus, as the American administrative state expanded and became more organizationally complex from the 1930s onward, educational institutions and, in particular, federal government agencies played an increasingly central role in fostering social ties among those responsible for managing it. These ties connected core agencies of the state (Fig. 6), potentially facilitating information sharing and the coordination of policy initiatives.
Nearly 50 years ago, Robert Putnam (Reference Putnam1976: 110) observed in his survey of the literature on elite recruitment that “members of a newly formed British cabinet see around the table men and women with whom they have worked closely for decades, whereas newly appointed US cabinet officials often must be introduced to one another and to the president.” Similarly, work by Hugh Heclo and others in the 1970s and 1980s portrayed political appointees as “in-and-outers,” individuals from diverse private-sector backgrounds whose career paths rarely crossed before they assumed elite administrative positions (Heclo Reference Heclo1977; Mackenzie Reference Mackenzie1987). To the best of my knowledge, there has been no significant update to this notion of political appointees since then. Yet the findings in this article paint a different picture: by the late twentieth century, more than 80 percent of the sampled elites shared at least one tie with others serving in elite positions around the same time (Fig. 3), forming highly cohesive networks (Fig. 4). By highlighting the similar backgrounds and experiences of many political appointees, these findings contribute to research on political elites and elite networks (e.g., Best and Higley Reference Best and Higley2018) as well as the structure of American elite recruitment (e.g., Aberbach, Putnam, and Rockman Reference Aberbach, Putnam and Rockman1981).Footnote 9
Although elite cohesion increased throughout most of the twentieth century, there are signs of decline toward the end of the period. Determining whether this decline is temporary or part of a more permanent shift will require analysis of more recent data, but if cohesion did indeed begin to wane in the 1990s, this trend would coincide with another major transformation in American politics: the rise of elite polarization. In fact, Mann and Ornstein (Reference Mann and Ornstein2006: 232) suggest that increasing polarization among politicians could be partially attributed to declining levels of elite cohesion. Alternatively, since many of the political appointees studied in this article required Senate confirmation, and polarization in the Senate began to intensify in the 1990s (Moody and Mucha Reference Moody and Mucha2013), it is also possible that the causal error points the other way and that rising polarization contributed to a reduction in cohesion.
Cohesion’s possible connection to political polarization points to two main avenues for future research. First, future research should generate and test hypotheses about the causes of the changes in elite cohesion documented in this paper. One possible explanation lies in changes in the appointment process, including its professionalization with the establishment of the Office of Presidential Personnel in 1977, the increasing centralization of authority in the presidency, and the growing politicization of the bureaucracy (Lewis Reference Lewis2008; Moe Reference Moe, Chubb and Peterson1985).
In addition to these institutional explanations, increasing cohesion may reflect efforts by elites to create unity in response to state expansion and growing task complexity. Seen through the lens of agency theory, the dominant approach to elite recruitment in political science and public administration (Moe Reference Moe1984; Shapiro Reference Shapiro2005), there is always a potential misalignment between the interests of appointees (agents) and those of the President (principal). As a result, recruitment must balance competence and loyalty (Lewis Reference Lewis2008). Personal relationships can mitigate this principal-agent problem (Jiang Reference Jiang2018), which becomes especially important as the state expands and differentiates across functional and geographic lines. While competence is crucial in identifying an initial pool of qualified candidates, connections to individuals in relevant positions within the state can provide valuable information about loyalty. Connections to the President (not measured in this study) are undoubtedly the most consequential, but ties to other officials (such as those captured in my data) may serve as indirect links to the President and shape appointment decisions. It is not unlikely that current appointees recommend candidates they have encountered along their path to elite positions. Recruiting elites who share similar norms, values, and extensive social ties is one way organizations, including states, can address agency problems and foster cohesion across subunits (Granovetter and Tilly Reference Granovetter, Tilly and Smelser1988: 203). The clustering of ties within agencies at a higher rate than expected by chance (Fig. 5) lends support to this argument.
Second, research on interlocking directorates made significant progress when scholars began to explore the relationship between cohesion and elite behavior. Similarly, understanding the consequences of cohesion among administrative elites is crucial. Scholars in the power elite tradition might interpret the findings of this article as evidence of a cohesive oligarchy controlling the American state and undermining democratic governance. However, these connections may also be important to the effective functioning of the administrative state. As the research on elite cohesion discussed in this article has shown, shared backgrounds and personal relationships foster mutual recognition, common worldviews, and a willingness to transcend zero-sum thinking – factors that contribute to the capacity for collective action. Just as the “revolving door” creates interorganizational networks between government agencies and private sector organizations (Etzion and Davis Reference Etzion and Davis2008) that facilitate information exchange and the diffusion of cultural frames (Li Reference Li2023; McCrain Reference McCrain2018), the ties examined here forge inter-agency connections that can foster collaboration across state organizations. Yingyao Wang’s (Reference Wang2024) recent study of Chinese bureaucrats provides an illustrative example, demonstrating how shared career trajectories lead to similar outlooks on the economy and thus influence policy development.
This raises further questions about the implications of elite cohesion. Might it help mitigate jurisdictional struggles stemming from fragmented policy implementation, where the same authority is delegated to multiple agencies (e.g., Farhang and Yaver Reference Farhang and Yaver2016)? And how does it influence inter-agency communication (Kapucu Reference Kapucu2006) and learning (Yaver Reference Yaver2016)? Alongside systematic large-N studies like the one presented here, addressing these questions will require more focused and detailed investigations of administrative networks, akin to Carpenter’s (Reference Carpenter2001) work on bureau and division chiefs below the executive level.
Supplementary material
The supplementary material for this article can be found at https://doi.org/10.1017/ssh.2025.16
Acknowledgements
I wish to thank William McAllister, whose generous support made this project possible. I am also grateful for thoughtful comments from John Levi Martin, Georg Rilinger, Ben Merriman, the reviewers and editors at Social Science History, and the participants of the 2024 Sunbelt Conference. This research was supported by NSF grant #0321561.


 Open access