

1. INTRODUCTION
Glaciers and glacial lakes are key indicators of climate change and variability. In the context of global warming, it is widely accepted that the majority of glaciers on the Tibetan Plateau (TP) and its surroundings have experienced accelerated reduction (Bolch and others, Reference Bolch2012; Yao and others, Reference Yao2012; Wei and others, Reference Wei2014; Song and others, Reference Song, Ke, Huang and Richards2015; Zemp and others, Reference Zemp2015; Yang and others, Reference Yang, Guo, Yao, Zhu and Wang2016) and glacial lakes have increased in both number and area (Bolch and others, Reference Bolch, Buchroithner, Peters, Baessler and Bajracharya2008; Komori, Reference Komori2008; Wang and others, Reference Wang2012, Reference Wang, Siegert, Zhou and Franke2013b, Reference Wang, Du and He2014; Nie and others, Reference Nie, Liu and Liu2013; Jain and others, Reference Jain, Sinha, Chaudhary and Shukla2015; Zhang and others, Reference Zhang, Yao, Xie, Wang and Yang2015; Song and others, Reference Song, Sheng, Ke, Nie and Wang2016) in recent decades. However, these glaciers and glacial lakes on the TP show strong spatial and temporal heterogeneities, given the diversity of climatic conditions and complex topography. Glaciers on the western TP have had slight mass gain or a balanced mass budget in the Western Kunlun (Neckel and others, Reference Neckel, Kropáček, Bolch and Hochschild2014; Kääb and others, Reference Kääb, Treichler, Nuth and Berthier2015; Ke and others, Reference Ke, Ding and Song2015) and Karakoram (Bolch and others, Reference Bolch2012; Gardelle and others, Reference Gardelle, Berthier, Arnaud and Kääb2013) in the last decade. Glaciers in the Himalayas show extensive mass loss. Loss rates generally decrease from there to the continental interior and are lowest in the eastern Pamir (Bolch and others, Reference Bolch2012; Yao and others, Reference Yao2012; Neckel and others, Reference Neckel, Kropáček, Bolch and Hochschild2014). Regional heterogeneities of glaciers and climate change will inevitably change glacial lakes as compared with such lakes at seven selected study sites along the Hindu Kush Himalayan range. These changes arise from different local patterns of temperature and precipitation variability. In the east (India, Nepal and Bhutan), glacial lakes were larger and more numerous than in the west (Pakistan and Afghanistan), and glacial lake area increased continuously between 1990 and 2009. By contrast, during the same period, glacial lake area shrank in the Hindu Kush and Karakorum (Gardelle and others, Reference Gardelle, Arnaud and Berthier2011). This finding appears in good agreement with current glacier mass-balance observations (Yao and others, Reference Yao2012; Kääb and others, Reference Kääb, Treichler, Nuth and Berthier2015). Thus, global warming, resulting in glacial meltwater increase and/or retreating and thinning glacier tongues, has provided more space for lake basins and been commonly cited as the primary contributor to glacial lake growth.
Nonetheless, little is known about the driving mechanism of spatial patterns of glaciers and glacial lakes throughout the Hengduan Shan in the southeastern TP. The exceptions are for glacier and glacial lake variations and their causes in the Bugyai Kangri (Liu and others, Reference Liu, Guo, Nie, Liu and Xu2016) and Yigong Zangbo and Nyang River basins (Song and others, Reference Song, Sheng, Ke, Nie and Wang2016), which are adjacent to the Hengduan Shan. Some researchers have studied glaciers and glacial lakes in certain regions or typical glaciers in Hengduan Shan. For example, from the 1970s to 2009, glacier area in the Boshula Shan shrank by 12.7%, while the area of glacial lakes increased by 26.8% (Wang and others, Reference Wang, Yao and Yang2011). Total glacial lake area expanded by 26% in the Mekong and Salween basins between 1990 and 2010 (Zhang and others, Reference Zhang, Yao, Xie, Wang and Yang2015). The area of 74 glaciers in the Gongga Shan shrank by 11.3% from 1966 to 2009 (Pan and others, Reference Pan2012). The surface area of Hailuogou glacier decreased by 3.5% between 1966 and 2007 (Liu and others, Reference Liu2010). Since the early 1900s, there has been a tendency toward retreat of seven monsoonal temperate glaciers in the Hengduan Shan (Li and others, Reference Li2009). However, we still lack comprehensive understanding of glacier and glacial lake distributions and evolution across the entire Hengduan Shan in recent decades. To remedy this, the objective of the present work was to overview the spatiotemporal distributions and variation of glaciers and glacial lakes in those mountains, based on Landsat images from 1990 to 2014.
2. STUDY REGION
The Hengduan Shan area is on the southeastern TP. Most of the area is characterized by a series of parallel mountain ranges and rivers running south–north (Table 1). With sharp altitudinal variation, this is typical of highland and ravine landforms (Fig. 1). Altitude decreases from northwest to southeast. Most mountain altitudes in the south are above 4000 m, and in the north they exceed 5000 m. There is a barrier effect of the mountain ranges for moisture from the southwest and southeast. Water and heat transport in valleys show a major north–south corridor and diffusion effects, which together with the mountain barrier effects form a terrain corridor-barrier effect. The Hengduan Shan lie at the confluence of Indian and Pacific ocean summer moisture, and this complex atmospheric situation causes differences in climate between the western and eastern areas (He and others, Reference He2003; Cao and others, Reference Cao, Li, Yao, He and Nian2009). Correspondingly, moisture transfer can be also characterized by an obvious monsoon period change in the study area. The winter monsoon period is from December to April, with less precipitation. May–October is the summer monsoon period, and hot and humid southeast Pacific air and the Indian Ocean southwest monsoon penetrate the region, heralding the start of the rainy season, with precipitation accounting for 75–90% of the annual total (Li and others, Reference Li2011b). Average annual air temperature is 9.13°C, and mean minimum and maximum annual precipitation were reported at 473 and 1745 mm, with regional average 779 mm, based on records from 27 meteorological stations (Supplementary Table S1). During summers of 1960–2008, the increase in temperature was 0.12°C per decade and the increase was more apparent at higher altitudes, from 0.05°C per decade below 3000 m a.s.l. to 0.20°C per decade above 3000 m a.s.l. (Li and others, Reference Li2011b). Precipitation exhibited a non-significant increase of 6.0 mm per decade, but began to decrease and fluctuate in 2000 (Li and others, Reference Li2011b). Annual potential evapotranspiration had a decreasing tendency beginning in the 1960s, at a rate of −0.17 mm a−1, but an increasing tendency from 2000 to 2009 (Zhu and others, Reference Zhu2012). Monsoonal temperate glaciers developed widely across the Hengduan Shan (Li and Su, Reference Li and Su1996; Shi and Liu, Reference Shi and Liu2000; Wang and others, Reference Wang, Du and He2014), and a tendency toward glacier retreat has been observed from ~1900 to 2007 (Li and others, Reference Li2009) and 1966–2009 (Pan and others, Reference Pan2012).
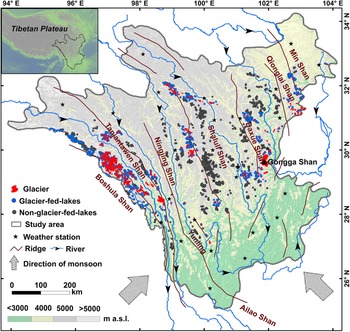
Spatial distribution of glaciers, glacial lakes and terrain of longitudinal ranges and gorges in the Hengduan Shan.

Number and area of glacial lakes in the Hengduan Shan, during 1990, 2000 and 2014

3. DATA AND PROCESSING
3.1. Data sources
The study data mainly involves multi-temporal Landsat images, the Shuttle Radar Topography Mission digital elevation model (SRTM DEM version 4, with resolution 3 arcsec), the air temperature and precipitation data, and the China Meteorological Forcing Dataset (CMFD). We used 84 ortho-rectified Landsat TM/ETM+/OLI images, which were obtained via the US Geological Survey Earth Explorer interface (http://earthexplorer.usgs.gov/) for the years 1990, 2000 and 2014 (Supplementary Table S2), to extract glacier and glacial lake information. To fill gaps caused by poor-quality images, we used images from 1 to 2 years around the aforementioned base years. The SRTM DEM from the Consultative Group for International Agriculture Research (http://srtm.csi.cgiar.org) was used to derive slope and elevation information for the Hengduan Shan. Air temperature and precipitation data between 1970 and 2014 were selected based on the continuity and longest period of data standards, from 27 China Meteorological Administration (http://www.escience.gov.cn) station records (Fig. 1, Supplementary Table S1). The CMFD (http://westdc.westgis.ac.cn/data/) used for our study area was developed by the Data Assimilation and Modeling Center for Tibetan Multi-spheres, Institute of TP Research, Chinese Academy of Sciences (Supplementary Fig. S1).
3.2. Glacial lake and glacier boundary extraction
Data processing mainly involved extracting glacier and glacial lake area information from remote-sensing images. Automatic and semiautomatic methods of water-pixel extraction have typically been developed to acquire glacial lake boundaries (Huggel and others, Reference Huggel, Kääb, Haeberli, Teysseire and Paul2002; Gardelle and others, Reference Gardelle, Arnaud and Berthier2011; Li and others, Reference Li, Sheng and Luo2011a). We first computed the normalized difference water index (NDWI) from blue and near-infrared (NIR) bands of the Landsat TM/ETM+ images (McFeeters, Reference McFeeters1996; Huggel and others, Reference Huggel, Kääb, Haeberli, Teysseire and Paul2002):
 $${\rm NDWI =} \displaystyle{{{\rm NIR}{\rm -} {\rm Blue}} \over {{\rm NIR + Blue}}}.$$
For the Landsat OLI imagery, the green and shortwave infrared 1 (SWIR1) bands were selected, so the associated equation (Du and others, Reference Du2014) is
 $${\rm NDWI =} \displaystyle{{{\rm Green}{\rm -} {\rm SWIR1}} \over {{\rm Green + SWIR1}}}.$$
Mountain shadows usually have spectral characteristics similar to those of glacial lake water. However, the water surface slope is theoretically much smaller than that of the shadows. Thus, to eliminate terrain shadows from binary images of water and non-water, each image was overlaid by a slope map derived from the SRTM DEM, and water pixels with slope gradient <5° were assumed to be lakes, and otherwise to be shadows. We then performed manual editing. Totally, ~5% of lake area disturbed by shadows or snow/ice was manually edited. Finally, integrating terrain and imaging features, glacial lake sizes >0.0025 km2 at elevations >3000 m were retained. Moreover, glacial lakes were classified as glacier-fed (supraglacial lakes, lakes contacting the glacier terminal or margin and lakes not contacting the glacier but directly receiving glacier meltwater) or non-glacier-fed (not directly receiving glacier discharge), according to whether glacier meltwater discharged into the lake as determined by Landsat images and Google Earth.
We first used the image ratio method to extract glacier boundaries following the methodology of Guo and others (Reference Guo2015), and then manually edited those boundaries with the combined assistance of Google Earth images and vector data of the second Chinese Glacier Inventory and Glacier Area Mapping for Discharge in Asian Mountains glacier inventory (Guo and others, Reference Guo2015; Nuimura and others, Reference Nuimura2015). The Hengduan Shan contain primarily monsoonal temperate glaciers, most of which are covered by debris at their termini/sides or by snow. Given the limitations of our method, it is difficult to extract the outlines of many debris-covered glaciers in such mountains (Andreassen and others, Reference Andreassen, Paul, Kääb and Hausberg2008; Paul and others, Reference Paul2013). Hence, for debris-covered glaciers and poor-quality images of glacial areas, we used visual characteristics (such as surface textures, supraglacial lakes, outlets of subglacial streams near glacier termini and landforms of lateral moraine) for manual identification of glacier outlines (Guo and others, Reference Guo2015).
We analyzed relative average change rates of areal difference in both the west and east zones of glacial lakes, by each 10 km × 10 km normalized grid cell (Fig. 2). The change rate (% a−1) is calculated as
 $$ \hbox{Change rate of glacial lake} = \displaystyle{{A_{{\rm y}2} - A_{{\rm y}1}} \over {A_{{\rm y}1} N_{\rm y}}} 100,$$
where the variable A is total glacial lake area in each 10 km × 10 km grid cell, and the subscript denotes the year. N y is the time interval of different periods.
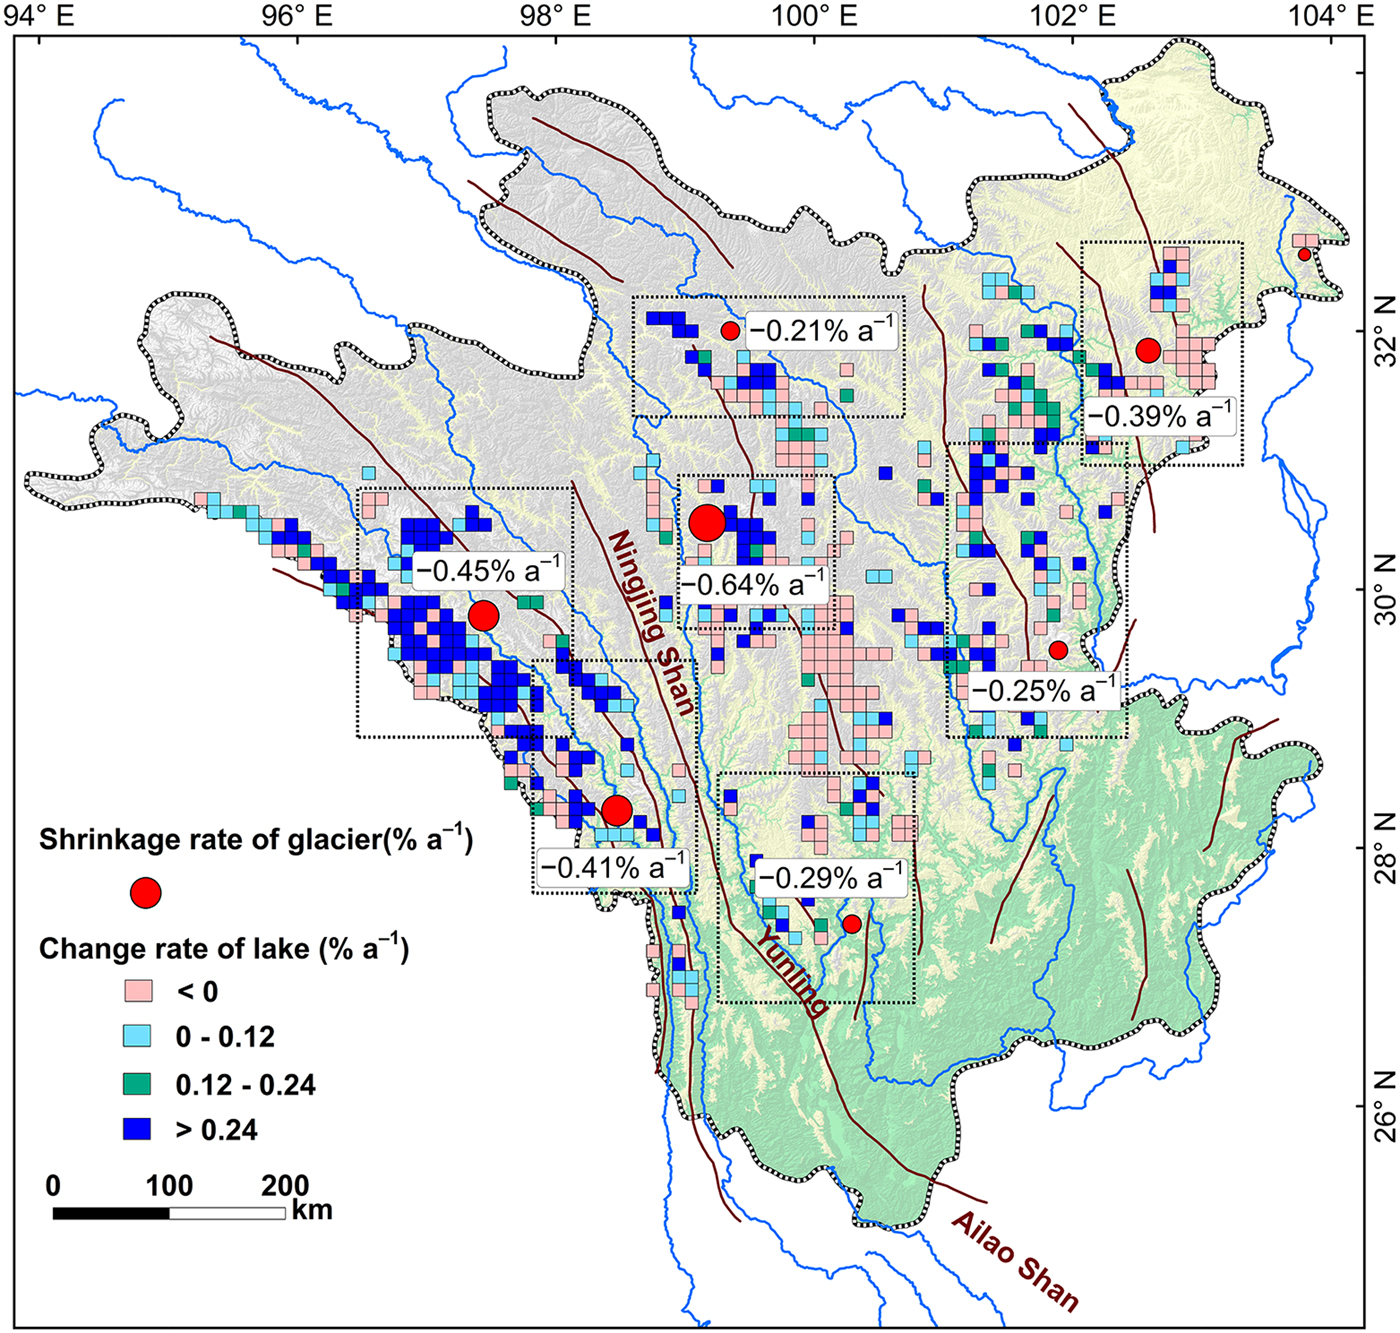
Change rate of lake area in each 10 km × 10 km grid cell and shrinkage rate of glacier area from 1990 to 2014 in the Hengduan Shan (shrinkage rates were calculated for average glacier change within rectangles defined by dashed lines).
The accuracy of extracted glacier and glacial lake information depends on pixel resolution, image quality, radiometric and geometric corrections, classification algorithms, threshold value selection and expert experience (Hall and others, Reference Hall, Bayr, Schöner, Bindschadler and Chien2003; Paul and others, Reference Paul, Huggel and Kääb2004; Salerno and others, Reference Salerno2012). It is difficult to describe accuracies precisely because of a lack of ground-based measurements. Here, we used the method of Hanshaw and Bookhagen (Reference Hanshaw and Bookhagen2014) for calculating glacier and glacial lake area uncertainties. The method assumes that error associated with area measurement has a normal or Gaussian distribution. We first calculated the number of pixels comprising the area measurement outline, using perimeter divided by grid-cell size. This number was multiplied by 0.6872 (±1σ), using the assumption that ~69% of the pixels are subject to errors. Finally, this number was multiplied by half the area of a single pixel, assuming that the uncertainty for each pixel is half a pixel, as follows.
 $${\rm Error(1\sigma ) = (}P{\rm /}G{\rm )\; 0}{\rm. 6872}\; G^2 {\rm /2,}$$
where P is the glacier or glacial lake perimeter, G is the image spatial resolution and σ is the variance.
However, debris-covered glaciers, upper glacier areas in scenes with imperfect snow conditions and turbid lakes are more difficult to identify and may produce larger uncertainties when extracting the boundaries of glaciers and glacial lakes. To reduce additional errors caused by these, as much as possible, more human-interactive examination was used for each Landsat image false-color composite, in conjunction with high-resolution Google Earth historic imagery.
4. RESULTS
4.1. Spatial distribution and temporal development of glacial lakes
A total of 3235 glacial lakes with overall area 255.8 ± 31.6 km2 were identified in the Hengduan Shan, on the basis of Landsat images from 2014. The lakes were more densely distributed in the western and eastern parts, and sparsely distributed in the central part (Fig. 1). In the central Hengduan Shan, Ningjing Shan glacial lakes were the least in number and area of all mountains in the study area, accounting for just 3.6% and 2.7 ± 0.4% of the total number and area. In the western part of Ningjing Shan, glacial lakes constituted 37.4% of the total number and 27.0 ± 3.9% of total area. In the eastern mountains, these were 59.0% of the total number and 70.3 ± 8.1% of the total area of glacial lakes (Table 1).
During the study period, the glacial lake area showed a slight increase, at an average rate of 0.12 ± 0.03% a−1. However, there were contrasting glacial lake evolutions within the region (Table 1). We investigated the spatial differences of glacial lake areal expansion by analyzing the mean change rate of lake area in each 10 km × 10 km normalized grid cell across the Hengduan Shan (Equation 3). We observed that glacial lakes grew extensively in area from 1990 to 2014 in the western Ningjing Shan, where 77% of all grid cells had a mean positive change rate. In contrast, lake area in the eastern Ningjing Shan had a widespread decrease over the same period, where more than half the grid cells (59%) had a negative average change rate (Fig. 2). More specifically, in terms of specific mountain glacial lake average change, Ningjing Shan and Shaluli Shan glacial lakes had no obvious change (−0.02 ± 0.03 to +0.04 ± 0.02% a−1). In the western Ningjing Shan, glacial lake area exhibited persistent and accelerated expansion, with an average rate of 0.56 ± 0.16% a−1. In the east, each mountain showed a declining trend, with average rate of decrease −0.24 ± 0.05% a−1 (Table 1). On interdecadal timescales, we observed that these glacial lakes substantially increased in area, at a rate of 0.49 ± 0.08% a−1 during the decade 1990–2000. However, glacial lake area had a slower rate of decline (−0.14 ± 0.01% a−1) during the subsequent period 2000–14. Although the glacier-fed lake area had a high expansion rate (+0.57 ± 0.35% a−1) from 1990 to 2000 followed by a slower rate (+0.34 ± 0.10% a−1) from 2000 to 2014, non-glacier-fed lake area increased (+0.45 ± 0.33% a−1) before 2000 and then decreased (−0.40 ± 0.10% a−1) after that year, which was the main cause of glacial lake interdecadal variability.
4.2. Spatial distribution and temporal evolution of glaciers
We inventoried 1886 glaciers in the Hengduan Shan, with a total area of 1298.8 ± 62.1 km2 in 2014. Compared with other mountains in the study area, the glaciers were most sparsely in number and area and sparsely distributed in Ningjing-Yunling Shan, representing 1.4% and 0.6 ± 0.1% of the total number and area, respectively. Additionally, in the mountains western Ningjing Shan, there was a concentration of glaciers, particularly in Boshula Shan, accounting for 55.4% and 47.1 ± 2.4% of total number and area, respectively. Eastern mountain glaciers were more disperse; here, Shaluli Shan had the largest number of glaciers at 262, with an area of 204.1 ± 9.4 km2. This constituted 13.9% and 15.7 ± 0.7% of the total number and area, respectively. This was followed by Daxue Shan, where glaciers numbered 202 and had an area of 280.2 ± 10.0 km2, 10.7% and 21.6 ± 0.8% of the total figures (Table 2).
Number and area of glaciers in the Hengduan Shan, during 1990, 2000 and 2014

Most glaciers in the Hengduan Shan showed a strong and sustained retreating trend, with an average rate of −0.40 ± 0.28% a−1 during the observation period. The decline was most pronounced in Boshula Shan and Taniantawen Shan in western Ningjing Shan, where glacier area decreased at an average rate of −0.44 ± 0.27% a−1. The smallest rate of glacier decline was in Daxue Shan in the eastern part of Ningjing Shan, with a rate of decrease of −0.25 ± 0.20% a−1 during 1990–2014 (Table 2, Fig. 2). On an interdecadal timescale from 1990 through 2014, glaciers showed a trend of sustained and rapid retreat, with an areal rate of decrease −0.32 ± 0.15% a−1 during 1990–2000. This rate changed to −0.47 ± 0.27% a−1 over 2000–14 (Table 2).
5. DISCUSSION
5.1. Corridor-barrier effect on the spatial distribution patterns of glaciers and glacial lakes
The relief of the southeast TP is oriented north–south as the longitudinal range-gorge region (LRGR), causing a barrier effect of the mountain ranges for moisture from the southwest. This leads to heavy rainfall in the western study area. Water and heat transport in valleys showed major north–south corridor and diffusion effects, which together with the mountain barrier effects formed the terrain corridor-barrier effect. In summer (June–August), the boundary of the Pacific Ocean water vapor effect was on a line ~100°E, between the Indian and Pacific oceans, near the Ailao Shan (Fig. 1). Thus, those mountains comprise important dividing lines for the LRGR (Wu and others, Reference Wu, Pan, Cao, He and Xiao2012). The Hengduan Shan lie to the north of the LRGR, where the corridor-barrier effect, formed by high mountains and deep valleys oriented latitudinally, has major impacts on the distributions and changes of glaciers and glacial lakes. First, altitudes of the Ningjing Shan range are 4000–5000 m, lower than in the western Taniantawen Shan and eastern Shaluli Shan. Because the Ningjing-Yunling Shan is affected by parallel high-altitude mountains on both sides, there is an east–west airflow that does not penetrate the rain shadow region. As revealed by the CMFD (He and Yang, Reference He and Yang2011), the Ningjing Shan range lies in the center of the rain shadow, characterized by notably lower annual precipitation than on either side (Supplementary Fig. S1). Consequently, Ningjing Shan is a mountain range where glaciers and glacial lakes have a smaller number and area, and are sparsely distributed across the study area. Second, under the background of regional warming and the majority of mountain glaciers in retreat, the varying change rates of glacial lakes in the western and eastern Ningjing Shan were very hard to ascribe to responses to different rates of glacier decline. The main cause for the great difference of glacial lake area change between the eastern and western Hengduan Shan was probably associated with the barrier effect of mountain ranges on moisture from the southwest. The Ningjing Shan (at the northern periphery of the Pacific Ocean water vapor effect) was found to be an important dividing line for moisture, corresponding well with the southern Yunling–Ailao Shan. Thus, we conclude that the three mountain ranges (Ningjing, Yunling and Ailao Shan) together form an important geographic boundary on the southeastern TP.
However, because altitude decreases from northwest to southeast and there are deeply incised valleys in the Hengduan Shan, the south is conducive to northward warm air transport. The north favors southward cold air flow, in which case there is a powerful north–south corridor effect on water and heat transport and diffusion through the longitudinal gorges. This resulted in only slight differences between the south and north with respect to the distributions and changes of glaciers and glacial lakes. During 2014 in the southern Hengduan Shan (whose average elevation is ~4000 m), the areas of glaciers and glacial lakes were similar to those in the north (where mountains exceed 5000 m elevation). In the southern area, the area of glaciers accounted for 40.0 ± 1.6% and that of glacial lakes for 43.0 ± 5.1% of the total areas. Furthermore, the area changes of glaciers and glacial lakes differed little in magnitude between the southern and northern parts of each mountain range over the period 1990–2014 (Fig. 2). Overall, we believe that non-zonal, corridor-barrier effects are the main cause of the small differences between the north and south and large differences between east and west with respect to the distributions and changes of glaciers and glacial lakes in the Hengduan Shan.
5.2. Glacier and glacial lake variations and climate change
Changes of glaciers and precipitation have directly affected the evolution of glacial lakes, but mechanisms differ by region/basin (Song and others, Reference Song, Huang and Ke2013; Wang and others, Reference Wang, Xiang, Gao, Lu and Yao2015; Zhang and others, Reference Zhang, Yao, Xie, Wang and Yang2015). There is probable correlation between Hengduan Shan climate fluctuations and the change of glaciers and glacial lakes, given the highland and ravine landforms. We found that 96% of weather stations revealed strong atmospheric temperature increase. The mean rate of increase in annual air temperature in the mountains was +0.03°C a−1 (p = 0.0). There was a non-significant increasing trend of annual precipitation at 63% of stations, with a rate +0.3 mm a−1 (p = 0.7). This was gleaned from records of 27 China Meteorological Administration stations from 1970 to 2014 (Supplementary Table S1). Therefore, an observable temperature increase and slight precipitation increase probably drove the extensive decrease of glacier area and increase of glacial lake area over the past 24 years in the Hengduan Shan. Relative to other regions, the mainly maritime glaciers in the Hengduan Shan are sensitive to climate change, and their shrinkage is the most pronounced on the TP (Yao and others, Reference Yao2012). However, the glacier changes showed substantial regional differences, influenced by regional terrain, climate, glacier size and other factors. We observed that ~4% of glaciers in the study area remained stable, and ~2% even grew in size (36 glaciers grew, at an average increase rate of +0.21 ± 0.14% a−1). On the other hand, a recent study demonstrated that the average increase rate of glacial lake area from 1990 to 2010 over the TP and Tian Shan mountains reached +1.2% a−1 (Zhang and others, Reference Zhang, Yao, Xie, Wang and Yang2015) and +0.8% a−1 (Wang and others, Reference Wang2013a), respectively. However, comparing our results with those of the aforementioned studies, the expansion rate of glacial lakes in the Hengduan Shan is much smaller. This may be because the Hengduan Shan is a humid glacierized region, which is subject to greater precipitation, thereby supporting more substantial non-glacier-fed lakes than those of the TP and Tian Shan. The number and area of non-glacier-fed lakes were 58% and 63.0 ± 5.4% of the totals in the Hengduan Shan, respectively. Given a lack of significant increase in regional precipitation, these lakes showed a small rate of decrease (−0.06 ± 0.11% a−1) over 1990–2014, producing declines on average of glacial lake expansion rate across the entire research area.
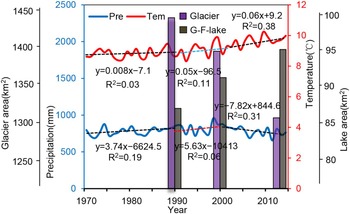
There is clear coupling between interdecadal changes of glaciers and glacial lakes and the climate of the Hengduan Shan (Fig. 3). The temperature in those mountains showed widespread and rapid increase from 1970 to 2014, and this increase accelerated beginning ~1990. On the interdecadal timescale, continuous warming has directly accelerated glacier ablation in the mountains since 1990. This explains the rapid glacier retreat on the TP, which corresponded well with glacial melt and glacier-fed lake expansion (+0.44 ± 0.29% a−1). In addition, the average expansion rate of glacier-contact lakes was more than six times that of non-glacier-contact lakes. These changes were directly caused by retreating and thinning glacier tongues, providing more meltwater and/or space for lake development upstream (Wang and others, Reference Wang, Xiang, Gao, Lu and Yao2015; Song and others, Reference Song, Sheng, Ke, Nie and Wang2016). Furthermore, rainfall slightly increased from 1970 to 2000, followed by a marked decreasing trend during 2000–14. There was an increase in mean annual precipitation at a rate of +5.6 mm a−1, contemporaneous with a rapid increase of non-glacier-fed lakes (+0.45 ± 0.30% a−1) from 1990 to 2000. That precipitation decreased (−7.8 mm a−1) over 2000–14, closely corresponding to the shrinkage of non-glacier-fed lakes (−0.40 ± 0.10% a−1) during 2000–14. The present results indicate the powerful role of precipitation fluctuations on the evolution of non-glacier-fed lakes.
Variation of temperature and precipitation during 1970–2014, recorded by 27 weather stations in the Hengduan Shan.

6. CONCLUSIONS
During the past 24 years, glacier area decreased at an average rate of −0.40 ± 0.26% a−1, and glacial lakes increased at a rate of +0.12 ± 0.03% a−1. These were likely associated with rapid temperature rise and a slight precipitation increase in the mountains. Compared with other parts of the TP, glaciers had a strong trend of retreat, while glacial lakes slightly expanded. In addition, the interdecadal variation differences of glacier-fed and non-glacier-fed lakes imply interdecadal fluctuations of temperature (which modulated glacier melt) and precipitation.
The Ningjing-Yunling Shan mountain range is an important geographic transition line for east–west moisture, given the corridor-barrier effect. Our results indicate that the ranges of the Ningjing-Yunling Shan in concert with the southern Ailao Shan form an important geographic boundary on the southeastern TP. In the mountains to the west of this boundary, glaciers and glacial lakes were well developed, with widespread rapid expansion of those lakes. In the mountains east of the boundary, glaciers and glacial lakes were scattered, and the lakes were predominantly shrinking. However, the strong north–south corridor effect on water and heat transport and diffusion resulted in very slight differences between south and north, with respect to the distributions and changes of glaciers and glacial lakes.
SUPPLEMENTARY MATERIAL
To view supplementary material for this article, please visit https://doi.org/10.1017/jog.2017.14
ACKNOWLEDGEMENTS
We thank Chen Shiyin, Huang Rong, Zhu Xiaoxi, Li Yuejia, Peng Xin, Shu Meihai and Zhu Zhihong for data collection and processing. This project was supported by National Science Foundation of China (41271091, 41571061), Ministry of Science and Technology of China (2013FY111400), Fund of Sate Key Laboratory of Cryosphere Science (SKLCS-OP-2017-05), Foundation of Chinese Academy of Sciences (HHS-TSS-STS-1501) and Postgraduate Innovation Fund of Hunan University of Science and Technology (CX2015B472).


 Open access