


Introduction
Araceae are a large family of monocots with more than 4,500 species distributed worldwide, mostly concentrated in tropical and subtropical regions (Zotz et al. Reference Zotz, Weigelt, Kessler, Kreft and Taylor2021a). Anthurium Schott and Philodendron Schott are the genera with the highest number of species (Croat Reference Croat, Jørgensen and León-Yánez1999, Boyce and Croat Reference Boyce and Croat2011). The centres of Araceae species diversity are located in Central and South America, followed by Southeast Asia and Africa (POWO 2024). In the tropics, aroids are found in a wide variety of habitats, extending from dry to pluvial rainforest, through swamps to cloud forests and montane plains (Croat Reference Croat1988). A large portion of members of Araceae are structurally dependent using trees or other plants as support, but relatively few of them are true epiphytes (Zotz et al. Reference Zotz, Almeda, Bautista-Bello, Eskov, Giraldo-Cañas, Hammel, Harrison, Köster, Krömer, Lowry, Moran, Plunkett and Weichgrebe2021b). A large proportion of the remaining species are hemiepiphytes and nomadic vines (NV) (Croat Reference Croat1988, Reference Croat, Jørgensen and León-Yánez1999, Kelly Reference Kelly1985, Moffett Reference Moffett2000, Shaw Reference Shaw, Lowman and Rinker2004, Acebey and Krömer Reference Acebey and Krömer2008, Leimbeck and Balslev Reference Leimbeck and Balslev2001, Williams-Linera and Lawton Reference Williams-Linera, Lawton, Lowman and Nadkarni1995, Acebey et al. Reference Acebey, Krömer, Maass and Kessler2010, Mayo et al. Reference Mayo, Bogner and Boyce1997, Sperotto et al. Reference Sperotto, Acevedo-Rodríguez, Vasconcelos and Roque2020). In the botanical literature, many climbing aroids are called ‘vines’, but are described as ‘hemiepiphytes’ or ‘nomadic vines’. According to Moffett (Reference Moffett2000), nomadic vines are plants that, during their lifetime, shift position continuously while maintaining a relatively unchanging length. They lose their initial roots, grow forward, and leave behind the previous growth while undergoing relatively small changes in overall configuration and mass.
Hemiepiphytes, on the other hand, start epiphytically, but later rely on adventitious root contact with the soil (Zotz et al. Reference Zotz, Almeda, Bautista-Bello, Eskov, Giraldo-Cañas, Hammel, Harrison, Köster, Krömer, Lowry, Moran, Plunkett and Weichgrebe2021b). These terms have been employed by many authors; however, their use has been contested in recent studies suggesting that the assigned categories may often not match the in situ life cycles of these plants (Bautista-Bello et al. Reference Bautista-Bello, Krömer, Acebey, Weichgrebe and Zotz2021, Einzmann et al. Reference Einzmann, Weichgrebe, Kohlstruck and Zotz2024, Zotz et al. Reference Zotz, Bautista-Bello, Kohlstruck and Weichgrebe2020). Ambiguity is most pronounced in nomadic vines while assignment is less of a problem in the case of hemiepiphytes (Zotz et al. Reference Zotz, Almeda, Bautista-Bello, Eskov, Giraldo-Cañas, Hammel, Harrison, Köster, Krömer, Lowry, Moran, Plunkett and Weichgrebe2021b and references therein). In this study, we refer to vines and nomadic vines simply as climbing aroids, focusing solely on terrestrial species that maintain a connection to the ground throughout their ontogeny since the details of their life cycle are still unclear.
Due to the floristic importance of this family, most ecological studies with aroids have focused on species richness and geographical distribution patterns, and few of them study their establishment strategy and other ecological aspects (e.g., Balcázar-Vargas et al. Reference Balcázar-Vargas, Peñuela-Mora, Van Andel and Zuidema2012, Reference Balcázar-Vargas, Van Andel, Westers and Zuidema2015, Clemente-Arenas et al. Reference Clemente-Arenas, Trujillo-Rodriguez, Hilário, Irume, Zartman and de Toledo2022, Einzmann et al. Reference Einzmann, Weichgrebe, Kohlstruck and Zotz2024, Gamez-Cardenas and Zuluaga Reference Gamez-Cardenas and Zuluaga Trochez2022, López-Portillo et al. Reference López-Portillo, Ewers, Angeles and Fisher2000). The categorization of a given species as either true or facultative epiphyte, nomadic vine or hemiepiphyte is frequently highly inconsistent between studies (Bautista-Bello et al. Reference Bautista-Bello, Krömer, Acebey, Weichgrebe and Zotz2021, Zotz et al. Reference Zotz, Bautista-Bello, Kohlstruck and Weichgrebe2020), which causes substantial problems in meta-analyses of community structure and dynamics (Mendieta-Leiva and Zotz Reference Mendieta-Leiva and Zotz2015).
Although a climbing habit is prominent among aroids, there is limited research on the community structure of this group. Studies of a few Heteropsis Kunth and Philodendron species suggest that distribution patterns on host trees can vary both horizontally and vertically (Balcázar-Vargas Reference Balcázar-Vargas2013, Orihuela and Waechter Reference Orihuela and Waechter2010, Knab-Vispo et al. Reference Knab-Vispo, Hoffman, Moermond and Vispo2003). This variation is driven by a number of factors, including the life form of the host, host size, host identity, temperature, humidity, and light intensity (Petter et al. Reference Petter, Wagner, Wanek, Sánchez-Delgado, Zotz, Cabral and Kreft2016, Woods Reference Woods2013). Among these factors, host size has been shown to be a critical determinant of abundance and diversity in many cases. Specifically, larger and older hosts represent both larger overall targets, larger and more diverse microhabitats and also a longer time span for colonization, which leads to increased diversity and abundance. However, it is important to note that this correlation has mostly been established for epiphytes and for a few hemiepiphytic species (Ding et al. Reference Ding, Liu, Zang, Zhang, Lu and Huang2016, Gonzalez et al. Reference González, Quiel, Zotz and Bader2017, Orihuela and Waechter Reference Orihuela and Waechter2010, Woods et al. Reference Woods, Cardelús and Dewalt2015, Zotz and Vollrath Reference Zotz and Vollrath2003).
Host location mechanisms in climbing aroids, such as skototropism and random searching, are likely influenced by host size and forest structure. Skototropism, observed in species like Monstera gigantea (Roxb.) Schott, involves directional growth toward shaded environments, guiding seedlings to large tree trunks that provide stable support and favourable microhabitats (Strong and Ray Reference Strong and Ray1975). This mechanism may be particularly effective in dense forests with complex vertical structures, where larger hosts reaching the canopy create strong shading cues.
In contrast, when large hosts are scarce or unevenly distributed, climbing aroids may rely on random searching mechanisms. For example, Heteropsis seedlings exhibit growth in multiple directions from the same infructescence, appearing to explore the environment without clear external cues such as light or barriers (Balcázar-Vargas et al. Reference Balcázar-Vargas, Peñuela-Mora, Van Andel and Zuidema2012, Benavides Reference Benavides2010, Clemente-Arenas et al. Reference Clemente-Arenas, Trujillo-Rodriguez, Hilário, Irume, Zartman and de Toledo2022, Orihuela and Waechter Reference Orihuela and Waechter2010). This strategy allows seedlings to opportunistically attach to any nearby host, regardless of its size or shade conditions.
Beyond host location, disturbances such as tree falls might play a role in shaping the community structure of structural-dependent plants like aroids. The canopy gaps created by tree falls often increase light availability, facilitating recruitment through seed germination, dispersal, and the regeneration of vegetative fragments (Benavides et al. Reference Benavides, Wolf and Duivenvoorden2013, Chazdon Reference Chazdon1986). However, because aroids depend on host trees for structural support, tree falls can also lead to their displacement or collapse along with their supporting trees (Spicer and Ortega Reference Spicer and Ortega2023). This dual role of tree falls—promoting colonization while potentially dislodging structural-dependent species—highlights their complex influence on the structure and dynamics of these plants.
In this study, we document the community structure of climbing aroids in 0.56 ha of lowland rainforest in Los Tuxtlas, Veracruz, Mexico. We focus on species richness, hosts associations, distribution patterns, and responses to disturbances such as tree falls. We aimed to answer the following questions: a) What is the community structure of climbing aroid in terms of species richness, abundance, and density in a lowland tropical forest? b) Are aroid species associated with specific host life forms? c) Which are the vertical and host size distribution patterns of climbing aroids within the forest? d) Do host size and density predict the probability of establishment across ontogenetic classes of climbing aroids? Answering this question provides insight into the mechanisms of host searching. We expect smaller aroid individuals to be overrepresented on larger hosts in the forest (in terms of diameter) due to the influence of skototropism. e) How does tree fall and host density affect the climbing aroid community over a year? Tree hosts are essential substrates for colonization; however, their falls can lead to both the dislodging and recruitment. We expect tree falls to affect species abundance, driving changes in community structure.
Materials and methods
Study area
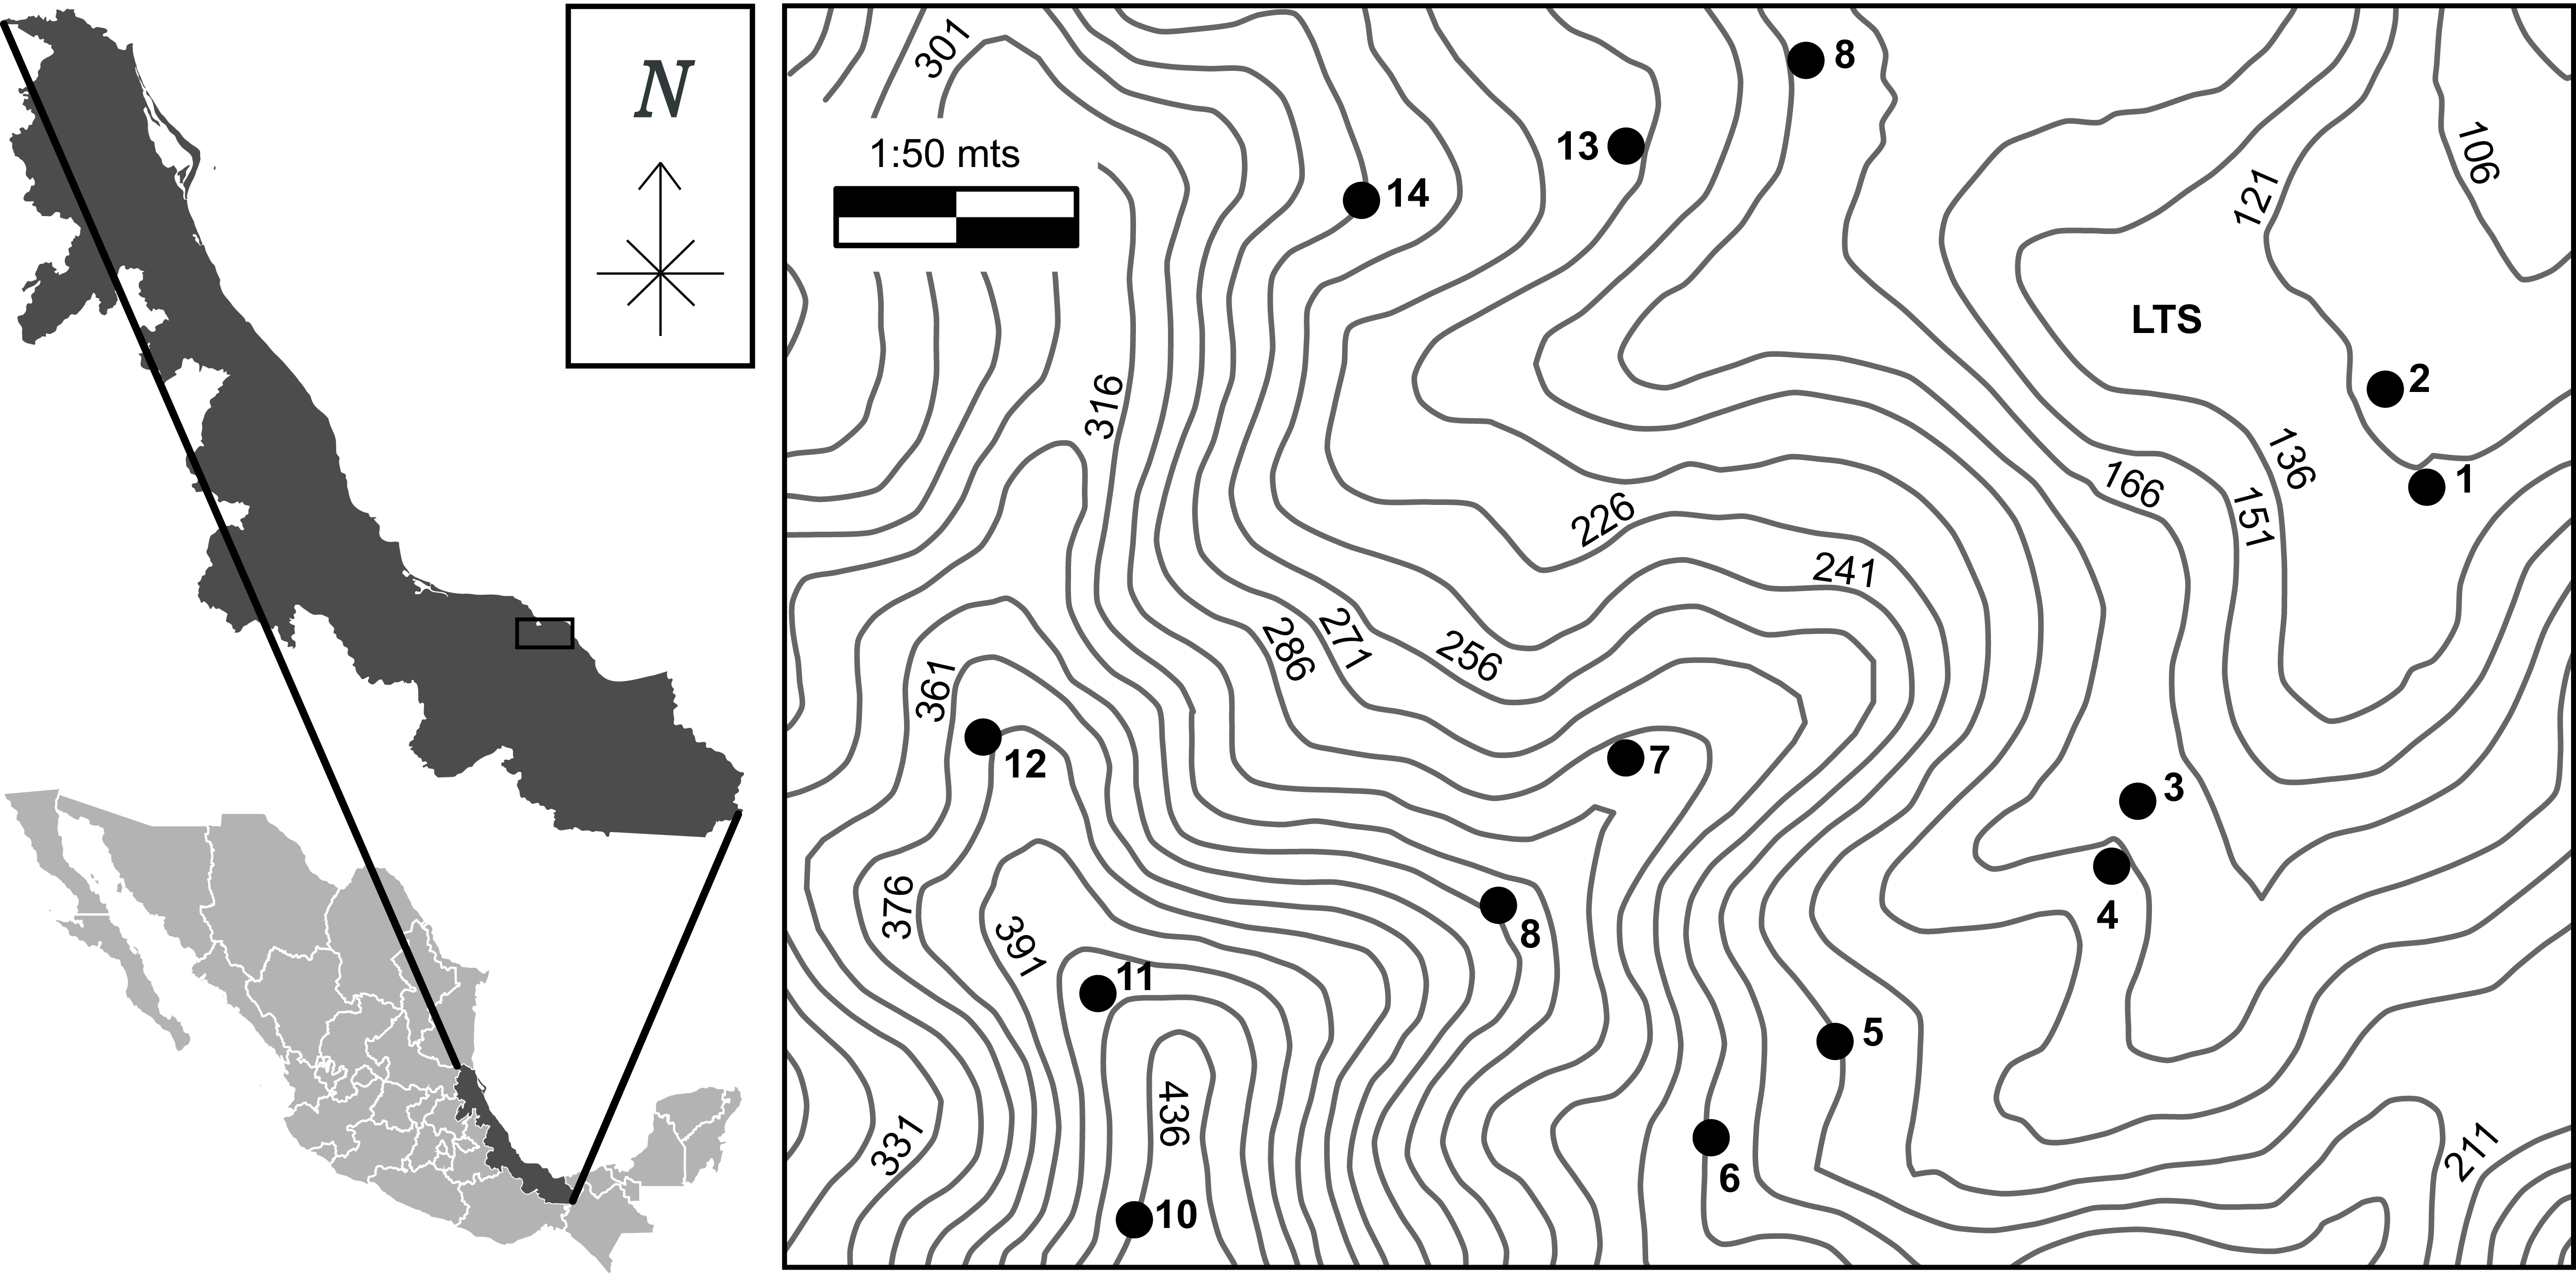
The study area is located in a range of 20–400 m a.s.l. within Los Tuxtlas Biological Station (18°35′ 06′ N, 95° 04′ 37′ W) run by the Universidad Nacional Autónoma de México (UNAM) in the state of Veracruz, Mexico. Rainfall follows a seasonal pattern, with maximum rainfall from June to February and a drier season from March to May. According to Köppen’s classification, this corresponds to a humid tropical climate, marked by high temperatures (Gutiérrez-García and Ricker Reference Gutiérrez-García and Ricker2011) (Figure 1). The topography encompasses a mixture of low rugged hills, steep slopes, and creeks at the mean valley. The tropical evergreen forest exhibits a nuanced gradient marked by various structural elements, which results in a noticeable difference between the ridge plots and mean valley plots. The overstory is primarily composed of species belonging to Fabaceae, Lauraceae, and Moraceae, while the understory is dominated by Annonaceae, Arecaceae, and Rubiaceae (Bongers et al. Reference Bongers, Popma, Meave del Castillo and Carabias1988). The mean valley stands out with its high level of shade and humidity, as well as numerous creeks traversing the area and high abundance of the palm Astrocaryum mexicanum Liebm. ex Mart., which creates a physiognomic difference compared to the understory of the ridge. The Reserve has a diverse flora, particularly abundant in Araceae and lianas/vines (Acebey and Krömer Reference Acebey and Krömer2008, Campos et al. Reference Campos, Kelly and Delgado2004, Ibarra-Manríquez et al. Reference Ibarra-Manríquez, Rendón-Sandoval, Cornejo-Tenorio and Carrillo-Reyes2015, Villaseñor et al. Reference Villaseñor, Ortiz and Campos-Villanueva2018).
Location of the study area at the biological station Los Tuxtlas (LTS), Veracruz, Mexico. Dark circles represent each plot at the study area. Elevation quotes are indicated by contour lines.
Data collection
In 2020 and 2022, we conducted two censuses of the climbing aroids. In both surveys, we recorded all individuals with climbing life form and all hosts and potential hosts in 14 plots of 20 × 20 m each. The plots were chosen haphazardly throughout the area from 20 to 400 m a.s.l., ensuring a minimum distance of at least 250 metres between them. In each plot, we measured the diameter at breast height (DBH) for all life forms of potential hosts, i.e., trees, shrubs, lianas, and palms ≥ 1cm DBH (for hosts < 1.3 m in height, stem diameter was recorded at half the trunk height, for branched trees and shrubs, the DBH was measured for each stem, using the average in the analysis), species identity, total height employing a laser distance metre (Leica DISTO A5, Leica Geosystems, Switzerland) or a measuring tape in the case of small individuals. Additionally, each host was uniquely identified by labelling and assigning a distinct number for easy recognition in the subsequent census. Furthermore, each plot was divided into 16 smaller subplots of 5 × 5 m. The abundance of both climbing aroids and their hosts in each of these subplots was meticulously recorded in order to gain a more detailed understanding of the climbing aroids/host relations.
Each aroid individual was carefully inspected for adventitious roots and for shoot connections with the ground. In the case of individuals only connected to the ground by roots, a careful search was made for traces of a shoot to record whether there had been a connection via the main shoot at an earlier stage. For each individual, the identity was recorded, as well as the maximum height of the host (apex height) and the overall size of the shoot, denoted as the total plant length. Due to the complexity of this work, aroid individuals were not tagged. We recorded whether individuals had produced branches that climbed up additional host(s) or which were hanging down freely from the individual´s main shoot. This study considered as individual each plant or cluster of aroids that had no connection with others following a similar approach as in epiphytes (Sanford Reference Sanford1968). Each individual was assigned to one of three ontogenetic classes prior to statistical analysis (class 1: small, class 2: medium, and class 3: large) using mainly the criteria of shape and size of the leaves as in Bautista-Bello et al. (Reference Bautista-Bello, Krömer, Acebey, Weichgrebe and Zotz2021). After thoroughly examining the three assigned categories, we found no evidence of species other than those classified as ‘climbing’ or ‘nomadic vine’ in our dataset. Hemiepiphytes like Philodendron radiatum Schott were excluded because they did not fit our definition of ‘climbing’ aroid.
Ray (Reference Ray1990) distinguished three categories of climbing aroids based on leaves and shoot development: isomorphic, allomorphic, and metamorphic. Isomorphic plants do not undergo noticeable changes in leaf size or shape during their development. Allomorphic species experience gradual changes in leaf size and/or shape and metamorphic ones undergo an abrupt change in leaf form. Based on this, allomorphic and metamorphic species (e.g., Syngonium chiapense Matuda, Syngonium podophyllum Schott, Monstera acuminata K. Koch.) were categorized primarily based on heteroblastic development and leaf size. Isomorphic species (e.g., Philodendron hederaceum (Jacq.) Schott) were categorized based on subtle changes in leaf morphology and total plant size. Aroid and tree species were identified with expert advice of Santiago Sinaca and the Araceae taxonomy guide of flora of Veracruz (Croat and Acebey Reference Croat, Acebey and Castillo-Campos2015).
Data analysis
Host associations, vertical and host size distribution patterns
To determine whether aroid species were associated with specific host life forms (tree, shrub, liana, palm), a chi-square test of independence was conducted. Since some expected frequencies were below 5, Yates’ continuity correction was applied. This test compared the observed frequencies of aroid species across host life forms to their expected frequencies, enabling to identify significant associations.
To assess the vertical and host size distribution patterns of climbing aroids, Kruskal-Wallis tests were conducted due to the lack of normality in the data. For vertical distribution, the maximum height reached by the apex of each individual was used, while the host size distribution was analysed based on the DBH of the recorded hosts. Significant differences between species were identified through post hoc Dwass-Steel-Critchlow-Fligner (DSCF; non-parametric, suitable for unequal variances, can be used with non-normally distributed data sets) pairwise comparisons.
Host size and density as predictors of ontogenetic class establishment
To validate the assigned ontogenetic classes, Pearson correlation analyses were conducted to evaluate the relationship between ontogenetic class and two independent morphometric traits: total plant length and apex height. These morphometric traits were not used in the ontogenetic class assignment process but were analysed post-classification to assess whether the predefined classes corresponded to distinct size categories. Once the ontogenetic classes were validated, a multinomial logistic regression model was used to examine whether host size based on DBH of the recorded hosts and host density influenced the establishment probabilities across ontogenetic classes of climbing aroids. The analysis included 2,328 potential hosts recorded within 224 subplots of 25 m2, with host DBH (cm) and host density as predictors. The dependent variable had three ontogenetic classes of climbing aroids: class 1 (small individuals), class 2 (medium-sized individuals), and class 3 (larger individuals).
All statistical analyses described above were conducted using R version 4.5.0 (R Core Team 2021) with the ‘jmv’ R package (Selker et al. Reference Selker, Love and Dropmann2024). Graphs were generated using the Python library Matplotlib (Hunter Reference Hunter2007).
Effect of tree falls and host density on community structure
To assess the effect of tree falls and host density on aroid community structure over a year, a stepwise multiple regression was performed. The dependent variable was the difference in aroid species abundance between 2020 and 2022. Predictors included tree falls, host density, species, and their interactions. A stepwise selection procedure was used, with P < 0.05 as the criterion for variable inclusion. The final model included the main effects of tree falls and species, with their interaction being significant. This analysis was conducted using Minitab (LLC Reference Minitab2021).
To assess changes in the community structure of climbing aroid over a year, we conducted a non-metric multidimensional scaling (nMDS) analysis using a Bray-Curtis distance matrix based on species abundance. The ordination stress value was used to assess fit, with values below 0.2 considered acceptable for interpretation (Clarke Reference Clarke1993). To test for significant differences in community structure between years, we applied an Analysis of Similarities (ANOSIM) with 999 permutations. Finally, a Similarity Percentage (SIMPER) analysis was used to determine which species contributed most to the dissimilarity between years, based on changes in their relative abundance. These analyses were performed using PAST v. 2.17c (Hammer et al. Reference Hammer, Ryan, Hammer and Harper2001).
Results
Species richness, abundance, and density
In the studied 0.56 ha of lowland forest, we recorded 12 species of climbing aroids belonging to five genera (Table 1). The aroids abundance was 2,054 in 2020 and 1,603 in 2022. The average density of all species across the 14 plots ranged from 70 to 1,299 individuals ha–1for both years. The two species with the highest density were Rhodospatha wendlandii Schott, with 743 (2020) and 555 (2022) individuals ha–1, and M. acuminata with 736 (2020) and 557 (2022) individuals ha–1, followed by Anthurium flexile Schott with 488 (202) and 429 (2022) individuals ha–1. Relatively rare were Philodendron inaequilaterum Liebm, with an average density of 41 (2020) and 29 (2022) individuals ha–1, Philodendron sagittifolium Liebm and Syngonium chiapense with 93–66 and 64–52 individuals ha–1, respectively.
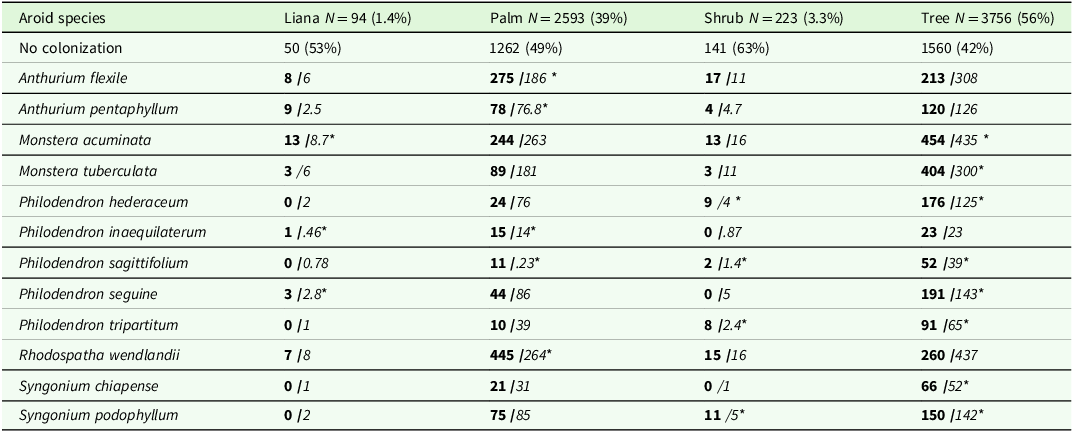
Abundance of 12 aroid species found on four different hosts life forms. Shown are the total numbers of potential hosts (N) for each life form and their corresponding percentages. The number of non-colonized hosts is given in the first row. Observed values are shown in bold and expected values in italics. Asterisks (*) indicate higher frequencies than expected by chance (P < 0.05). For expectations less than 5, we use the Yates correction. An association test was performed between species and host life forms. N values for aroid species and potential hosts combine data from 2020 and 2022. Data for each year are presented in Table S5
Host associations, vertical and host size distribution patterns
A total of 2,328 potential hosts with DBH ≥1cm were surveyed. Most of the 163 species were trees (133 species), six species were lianas, eight species palms, and sixteen species shrubs. A large majority of potential hosts (86%) were small, with a DBH <10 cm, larger ones (DBH > 30 cm) accounted for only 3%. A substantial majority of trees remained uncolonized, as only 37% (876 [2020]) and 33% (775 [2022]) were recorded as hosts for at least one climbing aroid. Aroid species differed significantly in their association with specific host life forms (χ² = 568, P = 0.001). Most species were more abundant than expected on trees from relative abundances, while A. flexile and R. wendlandii were much more common than expected on one of the five recorded palms (A. mexicanum) (Table 1).
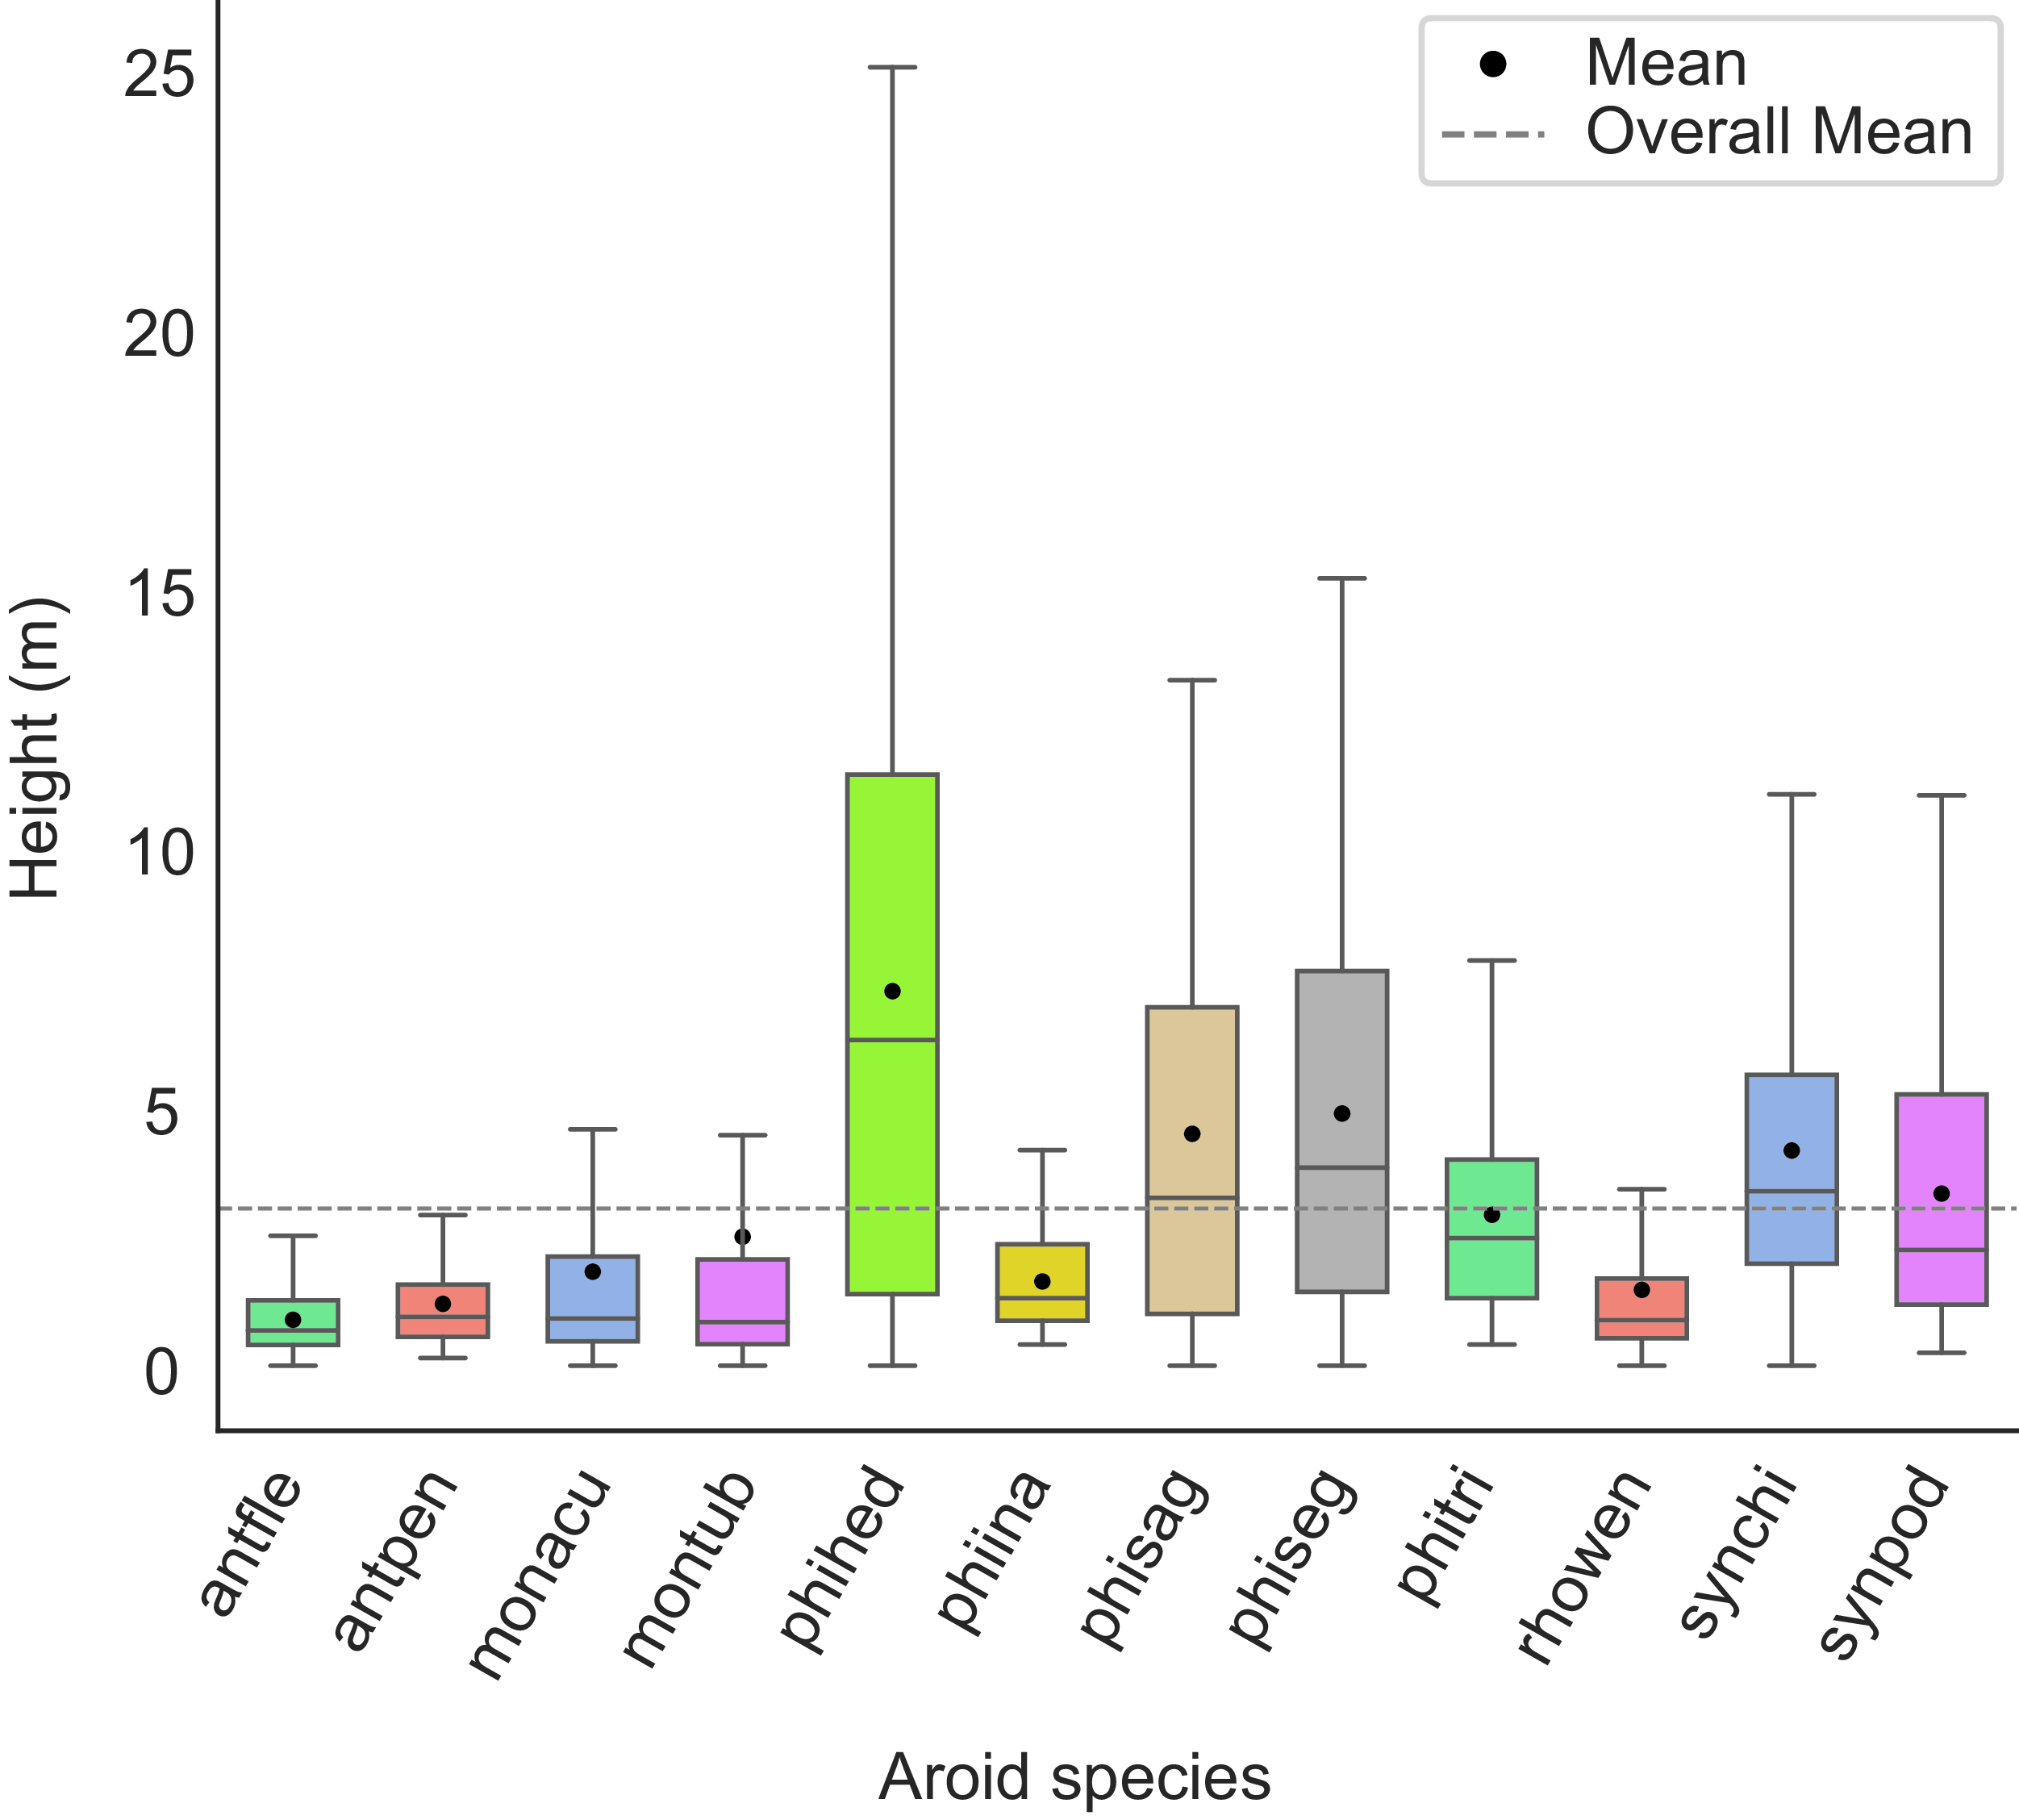
The mean canopy height across the plots was 6 m, with emergent trees reaching up to 36 m. Most climbers (90% of all individuals) were found at heights below 10 m, with an overall mean height of 2.42 m. Significant differences in vertical distribution among species were observed (χ²= 705, P = 0.001). A. flexile (M = 0.88 m, MD = 0.68 m) was distributed at significantly lower heights compared to all other species (P = 0.001), while P. hederaceum (Jacq.) Schott (M = 7.21 m, MD = 6.27 m) reached the greatest heights, significantly taller than the rest (P = 0.001) (Figure 2).
Vertical distribution of 12 climbing aroid species. The overall mean is represented as a dotted line, while species means are indicated by black circles. Abbreviations: Anthurium flexile (antfle), Anthurium pentaphyllum (antpen), Monstera acuminata (monacu), Monstera tuberculata (montub), Philodendron hederaceum (phihed), Philodendron inaequilaterum (phiina), Philodendron sagittifolium (phisag), Philodendron seguine (phiseg), Philodendron tripartitum (phitri), Rhodospatha wendlandii (rhowen), Syngonium chiapense (synchi) and Syngonium podophyllum (synpod). N = 3,657. ANOVA-KW (χ² = 705, P = 0.001).
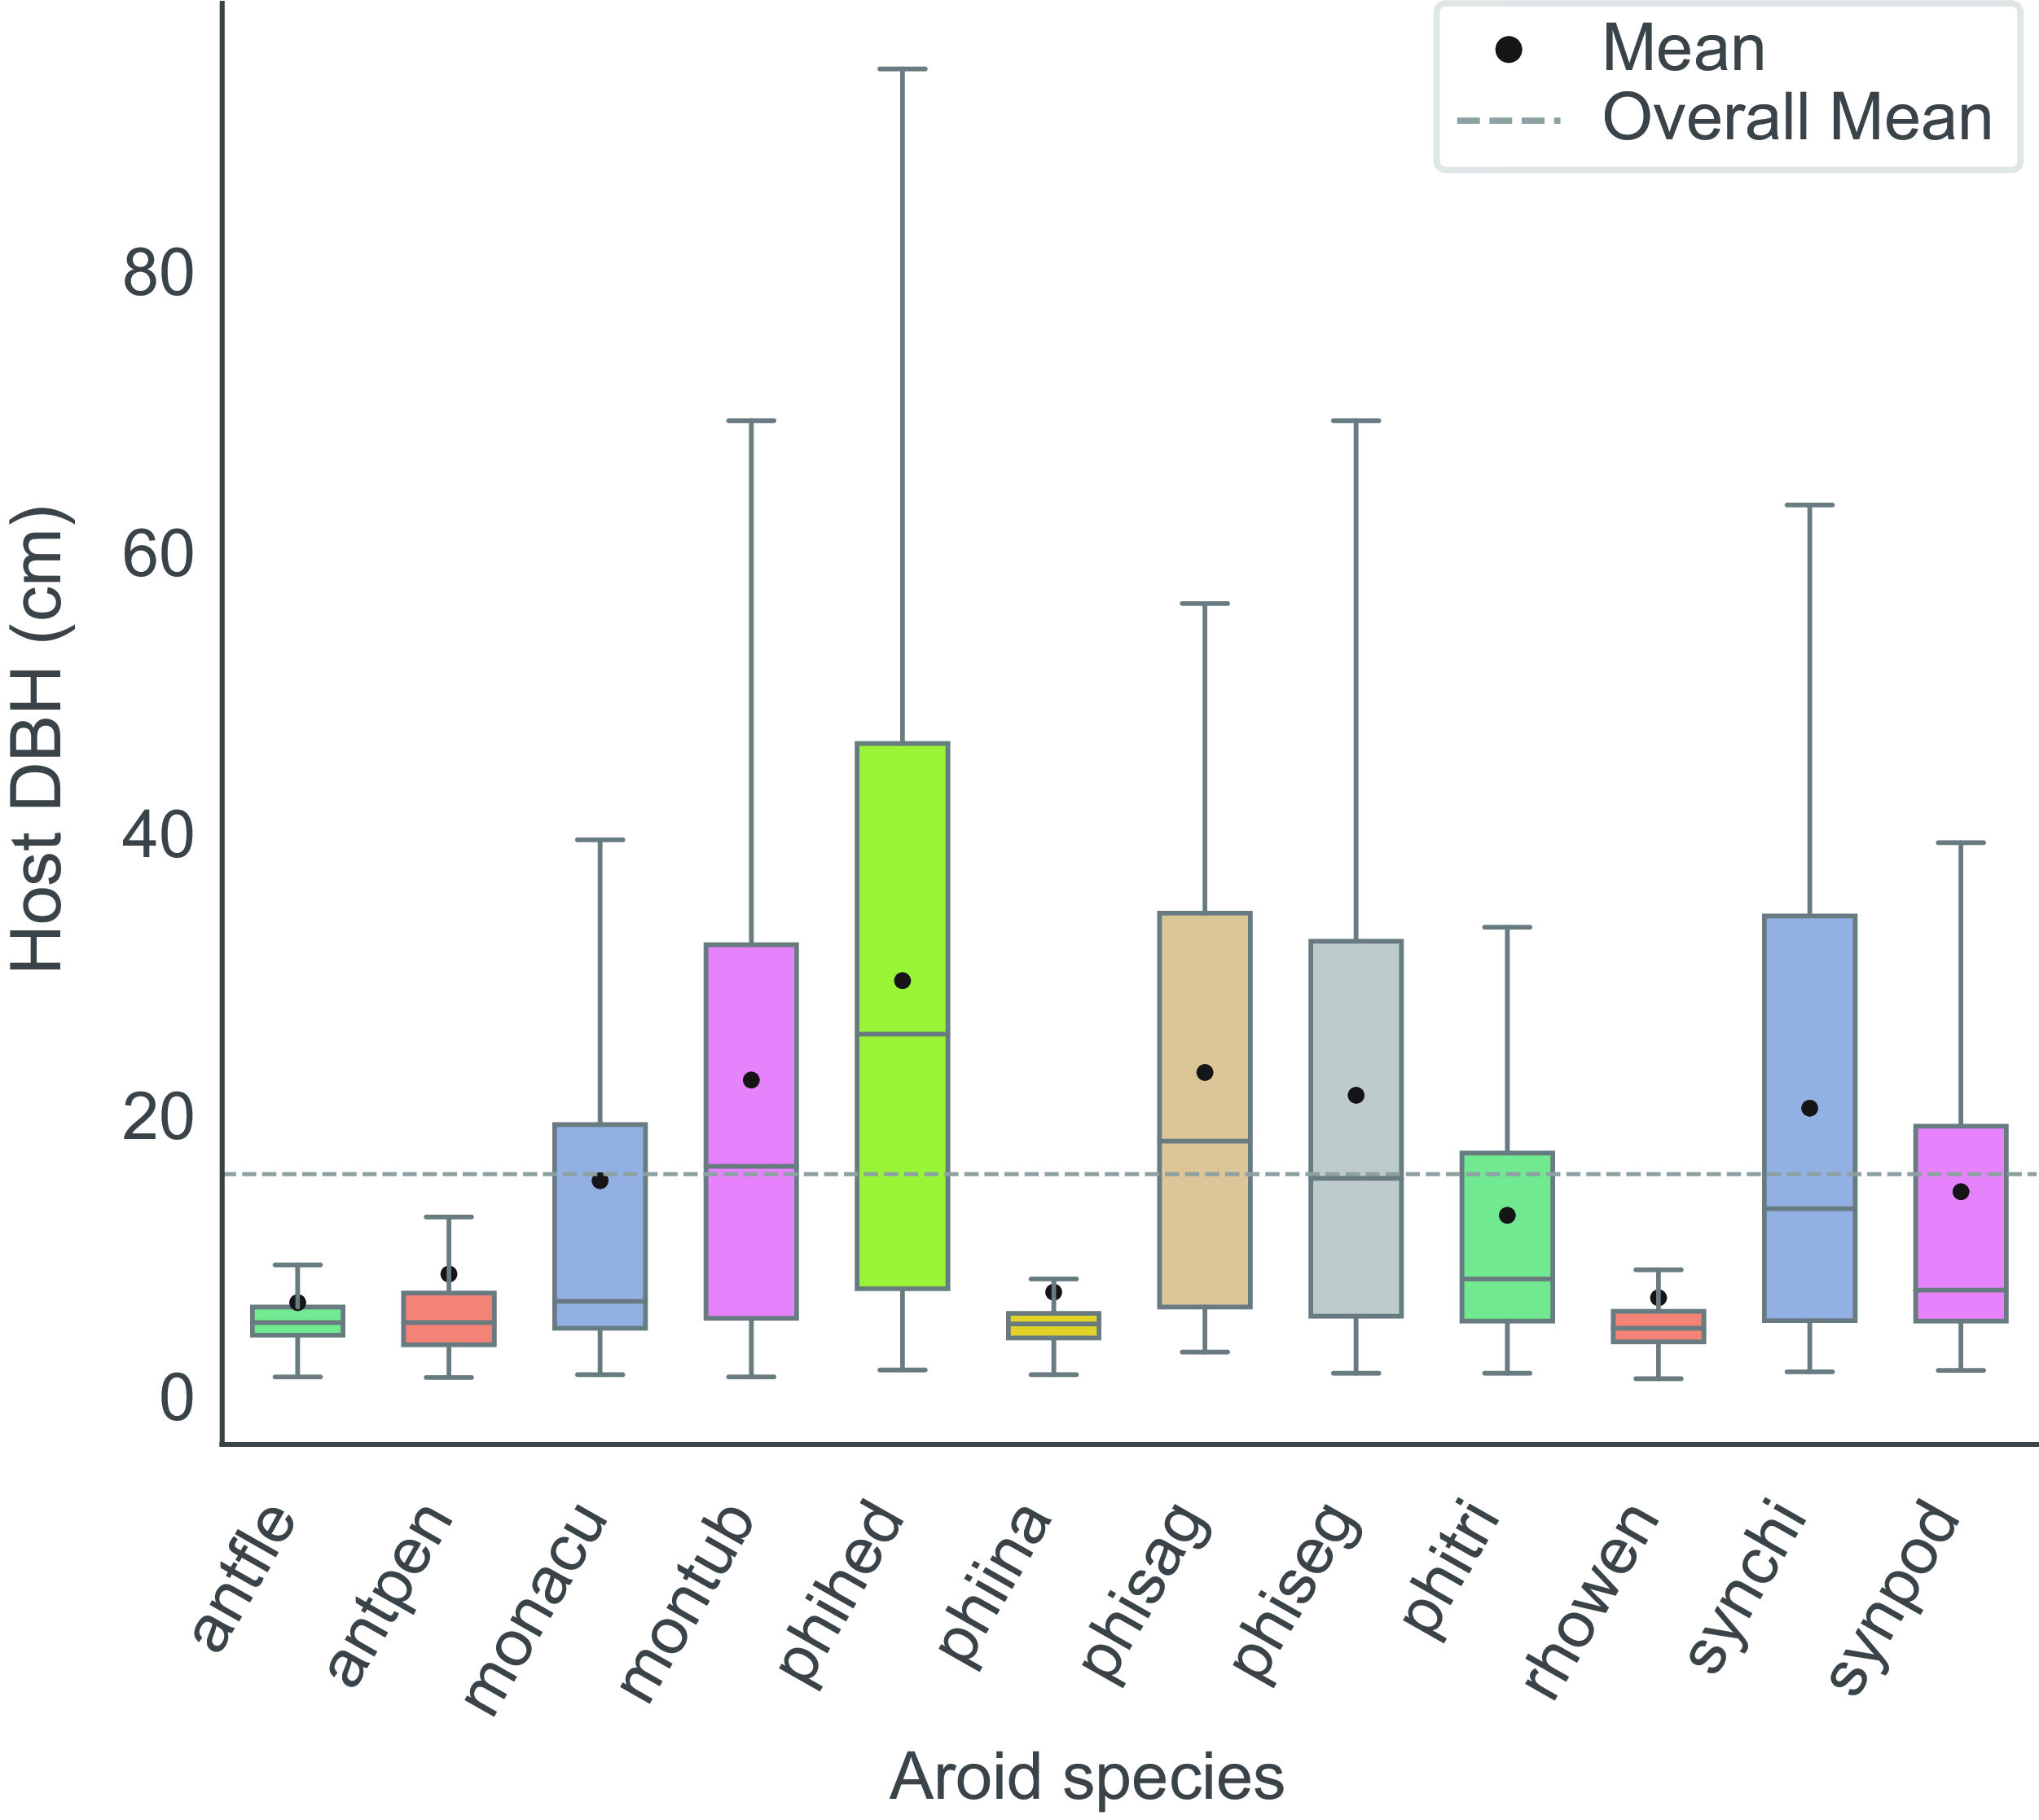
Similarly, significant differences in host size distribution were observed (χ² = 775, P = 0.001). Two species, A. flexible (M = 6.3 cm, MD = 4.9 cm) and R. wendlandii (M = 6.6 cm, MD = 4.5 cm), were predominantly found on small hosts, with their distributions significantly differing from those of the other species (P = 0.001). In contrast, species such as M. tuberculata Lundell (M = 22 cm, MD = 16 cm), P. hederaceum (M = 29 cm, MD = 25 cm), P. sagittifolium Liebm. (M = 22 cm, MD = 17 cm), P. seguine Schott (M = 21 cm, MD = 15 cm) and S. chiapense (M = 20 cm, MD = 13 cm) were primarily distributed on large hosts, also showing significant differences compared to the remaining species (P = 0.001) (Figure 3).
Host size distribution of 12 climbing aroid species (DBH ≥ 1 cm). The overall mean is represented as a dotted line, while species means are indicated by black circles. N = 3,657. ANOVA-KW (χ² = 775, P = 0.001). Abbreviations are explained in Figure 2.
Host size and density as predictors of ontogenetic class establishment
The assigned ontogenetic classes were validated by positive correlations with total plant length (R = 0.65, P = 0.001) and shoot apex height (R = 0.66, P = 0.001). These results confirm that the classes reliably represent developmental progression, as plant size and height consistently increase with advancing ontogenetic stages. Despite these results, it is not possible to estimate how long the transitions between ontogenetic classes take.
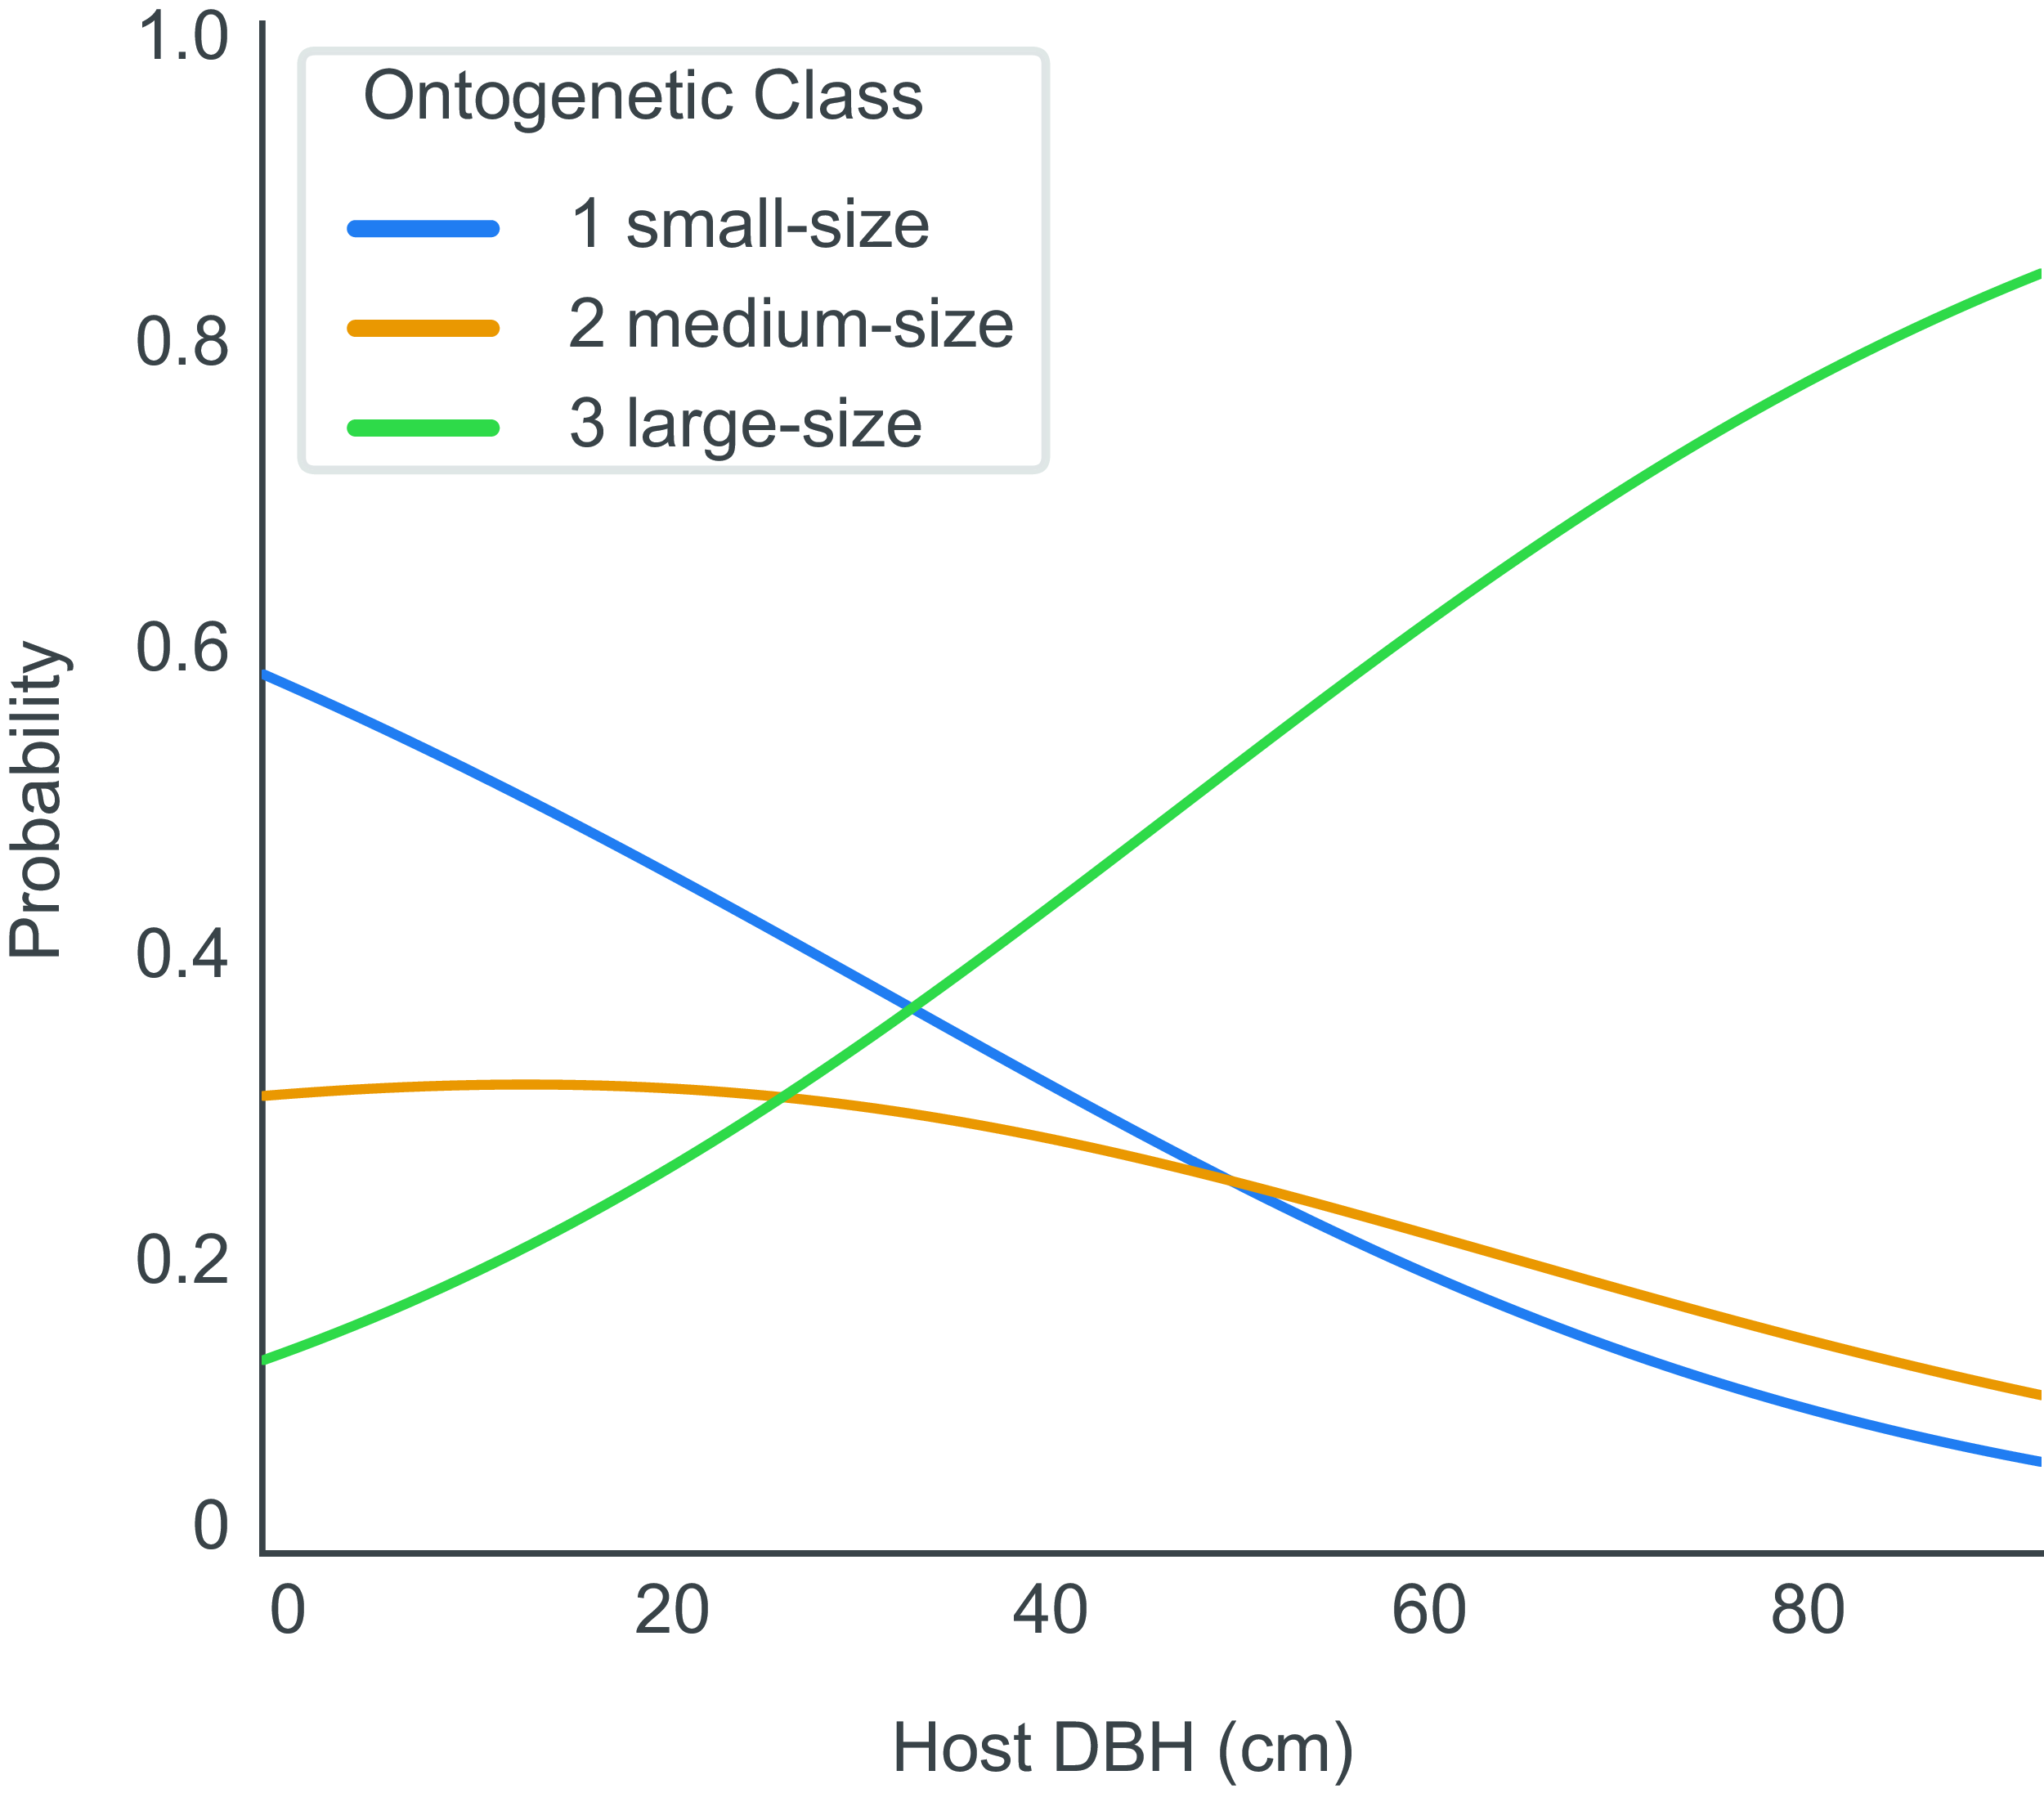
Between 2020 and 2022, individuals in class 1 decreased by 48% (1,185 to 611), while class 2 increased by 29% (468 to 606), and class 3 showed a minimal 4% decrease (401 to 386) (Table 2). Consistently across the 12 studied species, class 3 individuals (787) were found on large hosts (MD = 17 cm). In contrast, class 1 (1,796) and class 2 (1,074) individuals were primarily found on small hosts (MD = 5 cm). To explore the factors driving these patterns, we assessed whether host DBH (cm) and host density predict the establishment probabilities across ontogenetic classes. Only host DBH (cm) emerged as a significant predictor (Figure 4). Larger hosts increased the establishment probability for class 2 (β = 0.011, P = 0.001, OR (odds ratio) = 1.011) and class 3 (β = 0.0404, P = 0.001, OR = 1.0412), confirming a positive effect of host size on the establishment of more advanced ontogenetic stages. Class 1 individuals were more likely to establish on smaller hosts, indicating a negative association with host size. This might suggest that host size becomes more important during the ontogeny of climbing aroids.
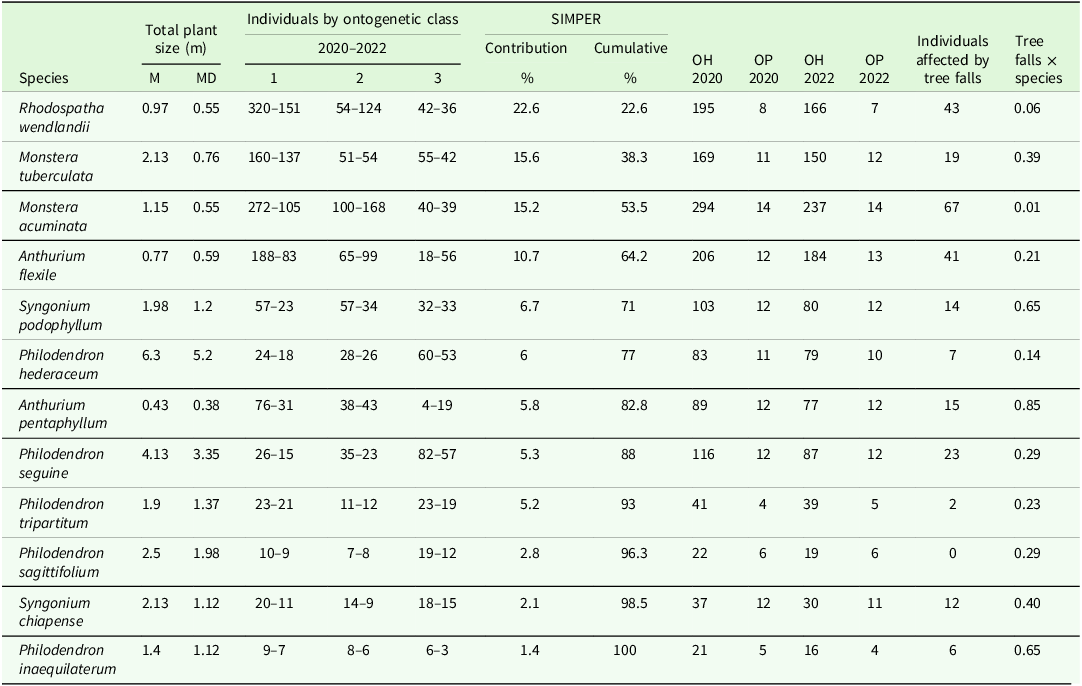
Summary of characteristics of the 12 species of climbing aroids recorded in 2020 and 2022. Both mean (M) and median (MD) total plant sizes are presented for each species. Number of individuals classified into three ontogenetic classes (1 = small, 2 = medium, 3 = large). The Similarity Percentage Analysis (SIMPER) indicates the individual and cumulative contribution of each species to community dissimilarity, presented in descending order. The number of occupied hosts (OH) and occupied plots (OP) are given for 2020 and 2022, respectively, as are the number of aroid individuals affected by tree falls. P-values for the effects of tree falls × species
Predicted probability of ontogenetic class establishment as a function of host DBH (cm) based on the multinomial logistic regression model.
Effect of tree falls and host density on community structure
The majority of host trees (92%) remained standing over the study period, and 1.3% represented new recruits. A total of 182 tree falls per year corresponds to an 8% turnover rate for the forest, though individual plots exhibited substantial variation. Tree falls were more frequent (11–20% annually) in plots on sloping areas. On average, these disturbances resulted in the fall of 6.7% of aroids. The significant interaction between tree falls and species revealed that tree falls significantly affected only M. acuminata (t = 3.81, P = 0.001), suggesting that its abundance decreases with increasing tree falls (Table 2).
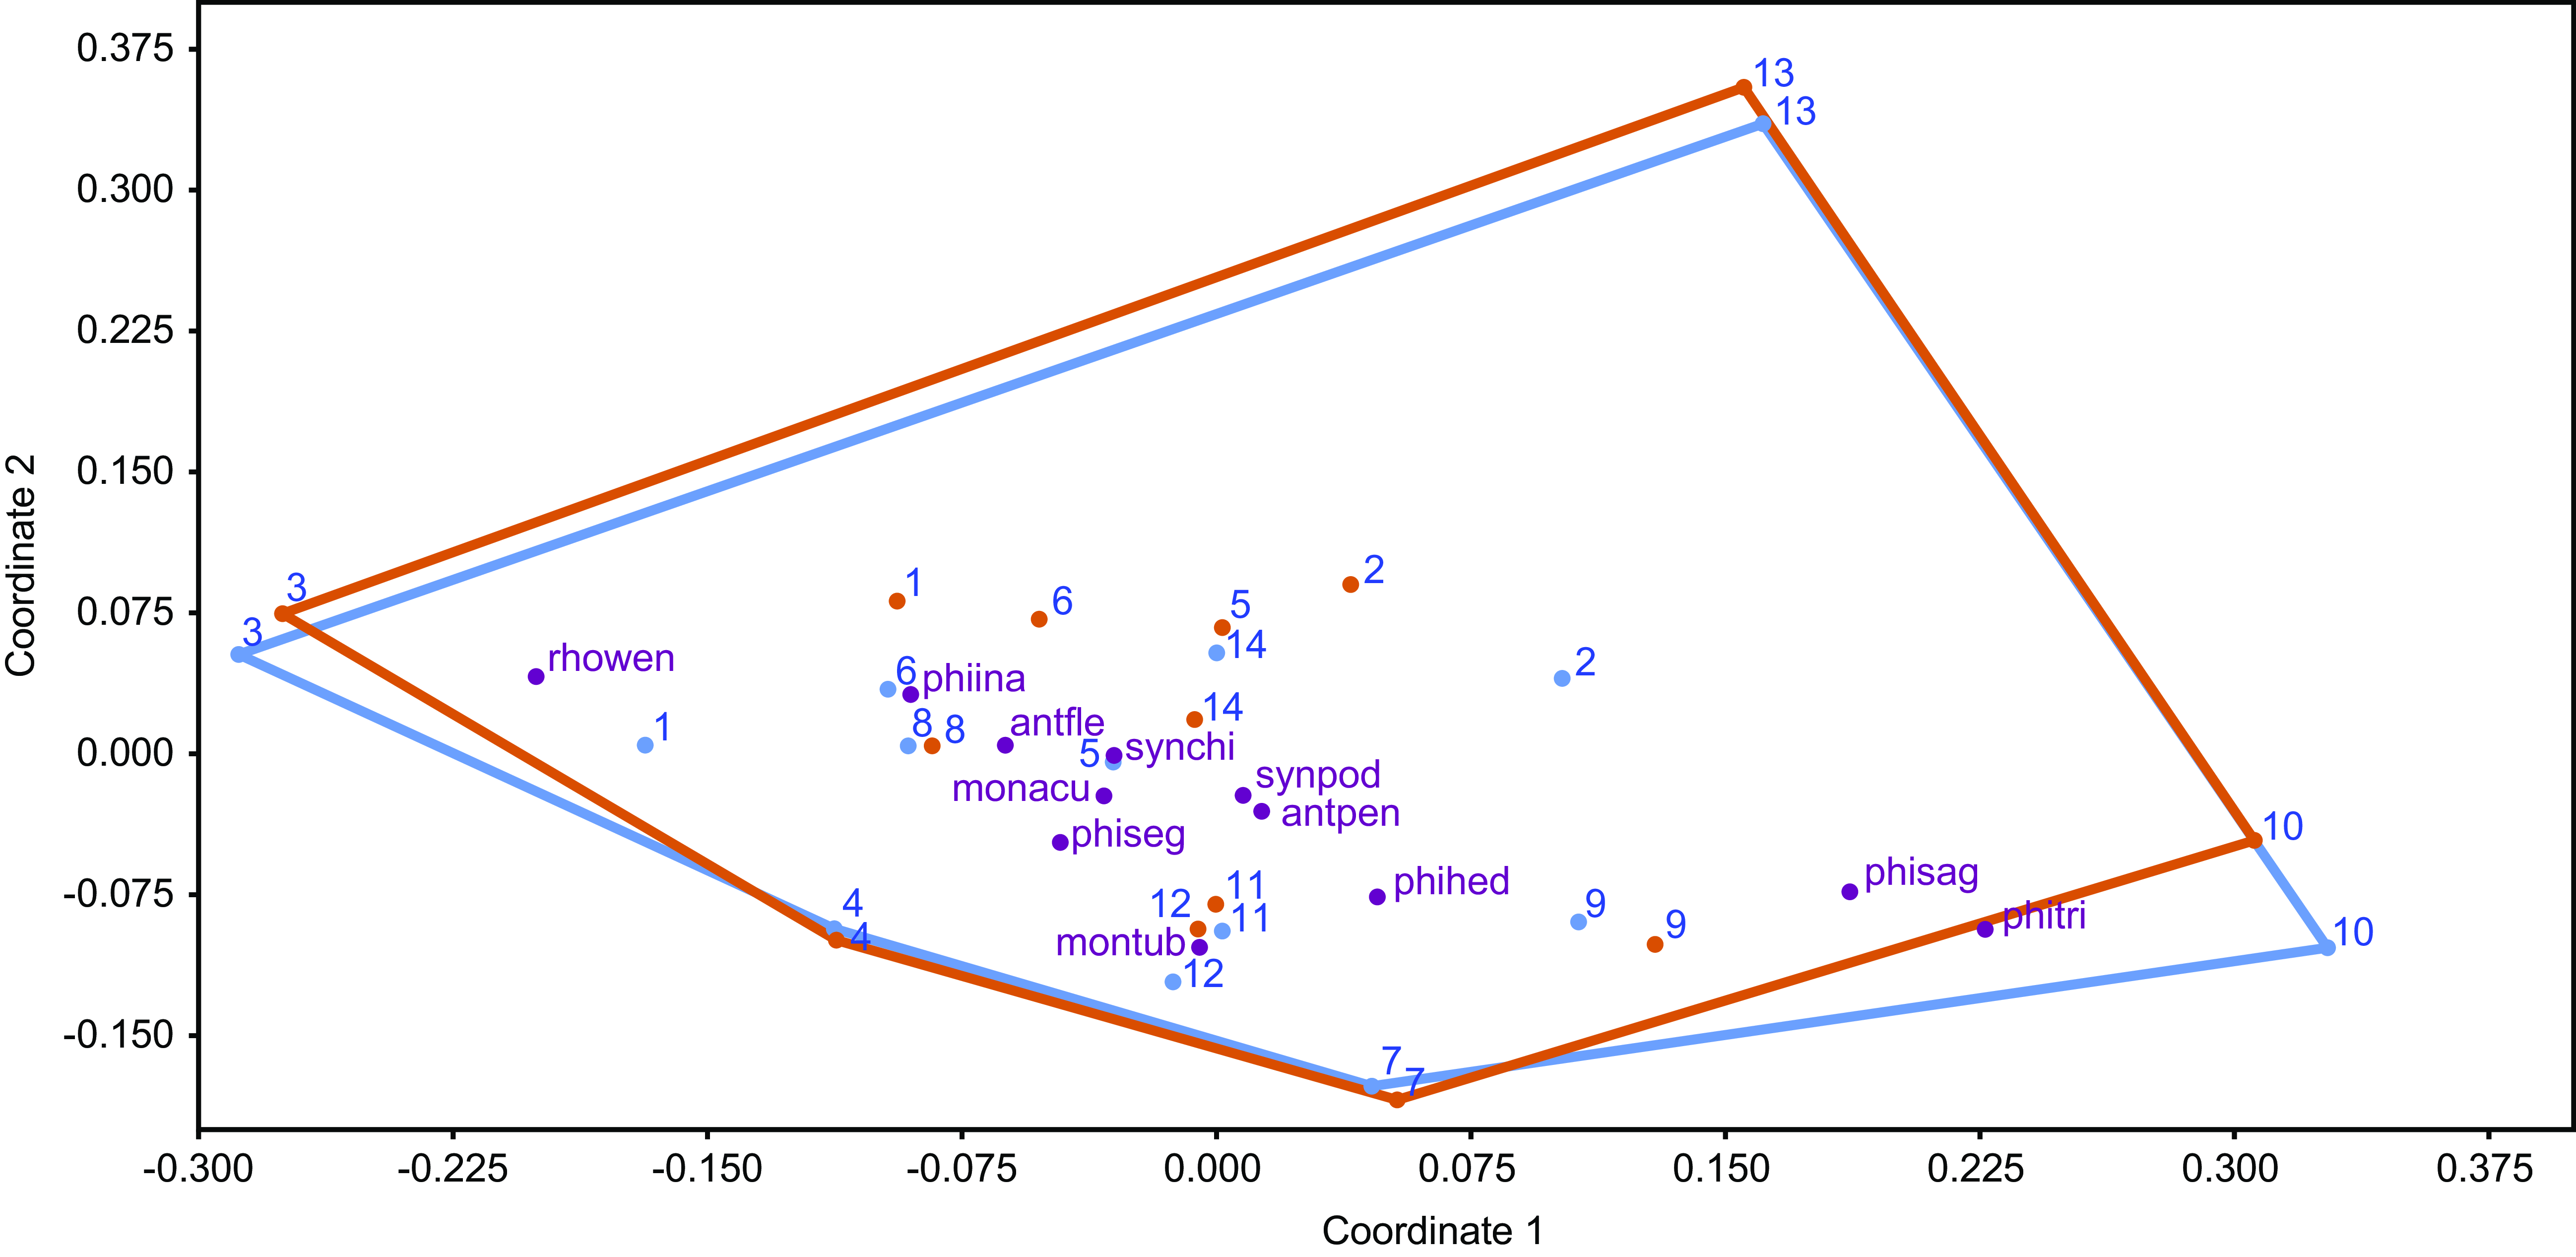
The NMDS ordination (Stress = 0.16) indicated a reasonable representation of community structure, with substantial overlap in convex hulls for 2020 and 2022, suggesting minimal differences between years (Figure 5). This was supported by the lack of statistically significant changes in community structure over a year (R = − 0.05, P = 0.93). In 2020, plots one, 11, and 12 recorded the highest abundance, with over 200 individuals each, while plots one, three, five and six experienced the greatest reductions in abundance between 2020 and 2022.
Distribution of aroid species in the two-dimensional space based on the dissimilarity of 14 plots. Blue colour indicates the year 2020, while orange indicates the year 2022. The position of each plot in the ordering is indicated by the numbers 1–14. The position of the aroid species is indicated by the abbreviations explained in Figure 2. (stress: 0.16, R= −0.05, P = 0.93).
Species distribution among plots was uneven: while most species were widespread, some (A. pentaphyllum (Aubl.) G. Don, M. tuberculata, P. hederaceum, P. tripartitum (Jacq.) Schott, and P. sagittifolium) were primarily found in ridge plots (nine, seven, 10, 11, and 12), whereas R. wendlandii showed a clumped distribution in mean valley plots (one, three, and eight). R. wendlandii contributed the most to compositional changes between years (22.6%), due to a marked decline in its relative abundance, especially in plots where it was initially most abundant. This decline was unrelated to tree falls, suggesting that other factors may have driven this reduction (Table 2).
Discussion
Species, abundance, and density
Our survey documented c. 2000 climbing aroids in 12 species in 14 plots covering 0.56 hectares, representing over 80% of the known climbing aroid species within the Los Tuxtlas Biosphere Reserve. There are a few data sets from the literature for comparison. For instance, Ortiz et al. (Reference Ortiz, de Stapf and Croat2019) found 3,000 individuals ha–1 (20 species/1,043 individuals-0.32 ha) in a Panamanian lowland semi-deciduous forest, while Clemente-Arenas et al. (Reference Clemente-Arenas, Trujillo-Rodriguez, Hilário, Irume, Zartman and de Toledo2022) documented 2,000 individuals ha–1 (36 species/4,226 individuals-2 ha) in the southern Amapá National Forest in Brazil. Einzmann et al. (Reference Einzmann, Weichgrebe, Kohlstruck and Zotz2024) reported 1,500 individuals ha–1 (14 species/1,056 individuals – 0.68 ha) on Barro Colorado Island (BCI), Panama. Thus, while our species richness appears relatively low compared to these studies, individual density in Los Tuxtlas is relatively high (approximately 3,500 individuals ha–1). However, it is difficult to directly compare these results due to variations in sampling methods, plot size, geographic location, and local environmental conditions across the studies. Another challenge is that most of these studies, except for Einzmann et al. (Reference Einzmann, Weichgrebe, Kohlstruck and Zotz2024), do not use a standard classification of ‘climbing’ aroids as discussed in Bautista-Bello et al. (Reference Bautista-Bello, Krömer, Acebey, Weichgrebe and Zotz2021), Zotz and Bader (Reference Zotz and Bader2011) and Zotz et al. (Reference Zotz, Bautista-Bello, Kohlstruck and Weichgrebe2020). This makes it even harder to compare the results directly.
Host associations, vertical and host size distribution patterns
Our results reveal clear patterns in the association between climbing aroids and the hosts life forms, as well as their vertical and host size distribution. The overall rate of host colonization (33–37%) aligns with findings by Einzmann et al. (Reference Einzmann, Weichgrebe, Kohlstruck and Zotz2024), who reported colonization rates of 16% in their study plots. Although the colonization rate in that study is about half of what we observed, both studies report colonization in less than half of the available hosts. This might suggest that, despite the abundance of potential hosts, only a limited subset might possess the characteristics necessary for successful colonization by climbing aroids.
Most climbing aroids in our study were found on trees and grew within 10 m above the ground, this vertical limit might be related to their reliance on ground contact via shoots or roots for water and nutrient uptake, a pattern observed in Heteropsis, Philodendron radiatum Schott, and Anthurium clavigerum Poepp., where ground connection supports survival and growth as plant ascent to the overstory. Additionally, structural constraints in roots—such as the lack of secondary growth (limiting vessel expansion) and dependence on root pressure to maintain hydraulic function—may restrict their ability to transport water effectively to greater heights potentially limiting their vertical distribution (Balcázar-Vargas and van Andel Reference Balcázar-Vargas and Van Andel2005, López-Portillo et al. Reference López-Portillo, Ewers, Angeles and Fisher2000, Meyer and Zotz Reference Meyer and Zotz2004).
Interestingly, within this general pattern, species such as A. flexile and R. wendlandii exhibited a marked association with palms, particularly A. mexicanum. These species were characterized by a low vertical distribution and were predominantly found on small hosts (DBH <6 cm). This association could be influenced by unique features of this palm, such as its architecture and the microclimatic conditions it provides. Another possible explanation is that plant size might play a role in determining the size of the chosen host. According to Croat (Reference Croat1988), smaller species, such as A. flexile and R. wendlandii, with mean plant sizes of 0.77 m and 0.97 m, might colonize smaller hosts because they do not need to reach great heights to flower and are generally small in overall size. A similar reasoning could apply to large individuals, explaining the pattern observed in P. hederaceum, which has a mean plant size of 6.3 m and was predominantly found on large host (DBH >20 cm) at mean heights of 7 m (Table 2). However, other factors, such as ontogenetic stage, could also contribute to these patterns.
Host size and host density as predictors of ontogenetic class establishment
Notably, among species distributed at higher vertical levels and on larger trees, most individuals belonged to class 3. Our results indicate a higher probability of finding large climber individuals (class 3) on large hosts, while small climber individuals (class 1) are more likely to establish on small hosts. This pattern may reflect differences in colonization strategies as plants progress through their ontogeny. These findings challenge our initial expectations, suggesting that skototropism might not be the sole mechanism driving host selection. Instead, other strategies, such as random host searching, might also play a role, offering new perspectives for understanding the observed ontogenetic distribution patterns in climbing aroids: (1) Prioritization: Small individuals might prioritize any host for initial support, regardless of its size, potentially sacrificing long-term growth. This prioritization could partly explain the observed decrease in class 1 individuals in the second census, although other factors may have contributed. Small plants are more vulnerable to environmental stressors, and climbing a small tree might restrict their access to light due to limited vertical support (Balcázar-Vargas et al. Reference Balcázar-Vargas, Van Andel, Westers and Zuidema2015). The observed 48% decrease in class 1 individuals between 2020 and 2022 suggests that mortality might have exceeded recruitment during this period. At the same time, class 2 individuals increased by 29%, which might indicate that some class 1 individuals transitioned to class 2, although this cannot be confirmed directly. Alternatively, multiple factors could have influenced the low recruitment of class 1 individuals in 2022 (Table 2). For instance, fluctuations in seed dispersal, a lack of safe sites for seed germination and seedling establishment, changes in microhabitat conditions (e.g., canopy cover, substrate availability), competition with other plant species, or variations in environmental conditions could have affected the establishment and survival of recruits (Harper Reference Harper1977).
(2) Selectivity: Larger and more established individuals (classes 2 and 3) may exhibit greater selectivity. They may actively seek out environments with greater resources through a repeated cycle of falling and rising until they find a larger host and reach the overstory (Ray Reference Ray1992). This behaviour could explain the tendency of class 3 individuals to occur on larger hosts, as has been reported for large Heteropsis individuals (Balcázar-Vargas et al. Reference Balcázar-Vargas, Peñuela-Mora, Van Andel and Zuidema2012, Knab-Vispo et al. Reference Knab-Vispo, Hoffman, Moermond and Vispo2003, Orihuela and Waechter Reference Orihuela and Waechter2010). Moreover, the tendency for larger individuals to establish on large hosts might reflect an ecological trade-off: while early establishment might be more flexible, later stages of development may require hosts with greater structural support.
Effect of tree falls and host density on community structure
Our expectations were partially met: M. acuminata was the only species to be negatively affected by tree falls. Although this species was widely distributed across the study area and had higher abundance in plots that experienced more tree falls between 2020 and 2022, its abundance declined over time in those same plots. This suggests that M. acuminata may be particularly vulnerable to disturbances caused by tree falls. Importantly, the observed reduction in abundance likely reflects the dislodgment of aroid individuals, which may remain alive despite being displaced, as documented by Spicer and Ortega (Reference Spicer and Ortega2023). Therefore, long-term monitoring of affected individuals is necessary to fully evaluate the true impact of tree fall disturbances over time.
Rhodospatha wendlandii was the most relatively abundant species in both years and contributed 22.6% to the overall dissimilarity in community composition. Despite its dominance, it experienced the largest decline in relative abundance. This decline was not linked to tree falls, suggesting the influence of other factors. Shifts in microclimate, such as changes in light availability or humidity, and intraspecific competition—particularly in plots where the species was highly abundant—may have driven this decline. Alternatively, the decline could reflect inherent fluctuations in the population dynamics of this species.
The heterogeneity of tropical forests, even at small scales, is well-documented. Topography, as well as canopy cover, might play crucial roles in shaping species distributions and abundances (Hutchings Reference Hutchings and Crawley1996, Robert Reference Robert2003, Svenning Reference Svenning2001). This is exemplified by the differences in physiognomy observed between ridge and mean valley plots, despite a small elevation difference of a maximum of 400 m in elevation. In the ridge plots, characterized by a more open canopy, species like M. tuberculata, P. hederaceum, and P. sagittifolium were more abundant. This could be attributed to adaptive traits enabling these species to thrive in environments with higher light exposure. Additionally, the observed variation in distribution patterns may be influenced by mechanisms by which species disperse and reproduce vegetatively. However, to assess this possibility, we would need to employ a long-term study tracking marked individuals, which should also provide insights into the dispersal modes of these species, including the relative contribution of clonal propagation and seed dispersal to their distribution patterns.
Conclusions
This study provides valuable insights into the community structure, host associations, and distribution patterns of climbing aroids in a lowland tropical forest in Los Tuxtlas, Mexico. Our findings suggest that apex height and total plant size might serve as reliable indicators of ontogenetic progression, contributing to a better understanding of developmental stages in these species. Additionally, host size (DBH) appears to influence the colonization and/or establishment of ontogenetic classes, indicating that this factor might play a key role in recruitment patterns.
Our results challenge the notion that skototropism is the sole mechanism of host selection, highlighting the potential role of random host searching and ontogenetic shifts in climbing strategies. Furthermore, we observed that the aroid community exhibits some degree of resilience to tree falls, though species-specific responses highlight the complexity of their ecological adaptations. Despite these findings, the limited timeframe of this study and the lack of comparative data constrain the generalization of our conclusions. Long-term monitoring and standardized methodologies are necessary to distinguish natural population dynamics from the effects of disturbances, ultimately providing a more comprehensive understanding of the ecological roles of climbing aroids. These findings lay the foundation for future research, particularly in assessing the adaptability of climbing aroids to environmental changes.
Supplementary material
The supplementary material for this article can be found at https://doi.org/10.1017/S0266467425100096
Acknowledgements
We thank Coates R. for logistical support at the Biological Station Tropical ‘Los Tuxtlas’ of the National Autonomous University of Mexico. We are thankful to Santiago S. Colin for valuable help in the field and plant identification.
Financial support
This study was supported by the Consejo Nacional de Ciencia y Tecnología (CONACYT) with the scholarship (No. 738851) awarded to APBB and by the Deutsche Forschungsgemeinschaft awarded to GZ (Zo 94/10–1).
Competing interests
The authors declare none.


 Open access