




Introduction
Land snails belong to the phylum Mollusca (the second-largest phylum in the animal kingdom) and play vital roles in ecosystems and for humans (Cobbinah et al. Reference Cobbinah, Vink and Onwuka2008; Lydeard et al. Reference Lydeard, Cowie, Ponder, Bogan, Bouchet, Clark, Cummings, Frest, Gargominy, Herbert, Hershler, Perez, Roth, Seddon, Strong and Thompson2004). Unfortunately, they are among the animal groups with the highest rates of extinction worldwide (Lydeard et al. Reference Lydeard, Cowie, Ponder, Bogan, Bouchet, Clark, Cummings, Frest, Gargominy, Herbert, Hershler, Perez, Roth, Seddon, Strong and Thompson2004; Régnier et al. Reference Régnier, Achaz, Lambert, Cowie, Bouchet and Fontaine2015). One major cause of their decline is habitat loss (Charrier et al. Reference Charrier, Nicolai, Dabard and Crave2013). In Côte d’Ivoire, since its independence in 1960, the economic development model was underpinned by the agricultural sector, which remains the main source of employment and the key sector for poverty reduction in rural areas (Kassoum Reference Kassoum2018). The practice of this policy has significantly contributed to the primary forest area reduction—over 80% from 1960 to 2000 (Koné et al. Reference Koné, Kouadio, Neuba, Malan and Coulibaly2014). The agricultural sector (little mechanised), based on the shifting burned cultivation technique, is the space-user (Kassoum Reference Kassoum2018). Significant fragmentation of forest cover and frequent changes in land-use types have resulted from recent rapid human population growth, which has increased demands for resources such as food, shelter, and fuel. The fragmentation and change in land-use types are pervasive, mostly around protected areas, because those areas evict the local communities from their ancestral lands, reducing their farmable areas (Bailey et al. Reference Bailey, McCleery, Binford and Zweig2015). This situation is often the basis of conflicts between protected area managers and local communities who complain of being robbed of their fertile lands (Ayivor et al. Reference Ayivor, Gordon and Ntiamoa-Baidu2013). Consequently, the remaining lands are intensively cultivated, resulting in constant and frequent changes in land-use types to meet various needs. Changes in land-use types alter the environmental conditions, including soil pH, soil moisture, plant, and deadwood cover (Wehner et al. Reference Wehner, Renker, Brückner, Simons, Weisser and Blüthgen2019). These changes can have adverse impacts on the land snail community, which is highly sensitive to local conditions related to the structure of the micro-habitat (Hylander et al. Reference Hylander, Nilsson, Jonsson and Göther2005). Indeed, although land snails comprise a large proportion of soil biodiversity in many ecosystems, a large number of species within this group are threatened or endangered due to anthropogenic activities (Régnier et al. Reference Régnier, Achaz, Lambert, Cowie, Bouchet and Fontaine2015).
Despite the threats facing land snails, their diversity remains largely undocumented in Côte d’Ivoire. However, understanding snail diversity is essential for informed decision-making regarding their conservation. In this study, we assessed land snail diversity and examined their response to different land-use types and some habitat attributes in and around Lamto Reserve, considering their potential as indicators of environmental changes (Douglas et al. Reference Douglas, Brown and Pederson2013). This study is among the first of its kind in West Africa and the first to be conducted in Côte d’Ivoire. We hypothesised that: (1) different land-use types would influence variations in land snail abundance and diversity, with undisturbed or less disturbed land-use types supporting higher abundance and diversity compared to disturbed land-use types; (2) certain land snail species would show an association with specific land-use types; (3) variations in land snail abundance and diversity would be linked to environmental variables, with seasonality amplifying its effect on abundance patterns.
Material and Methods
Study site
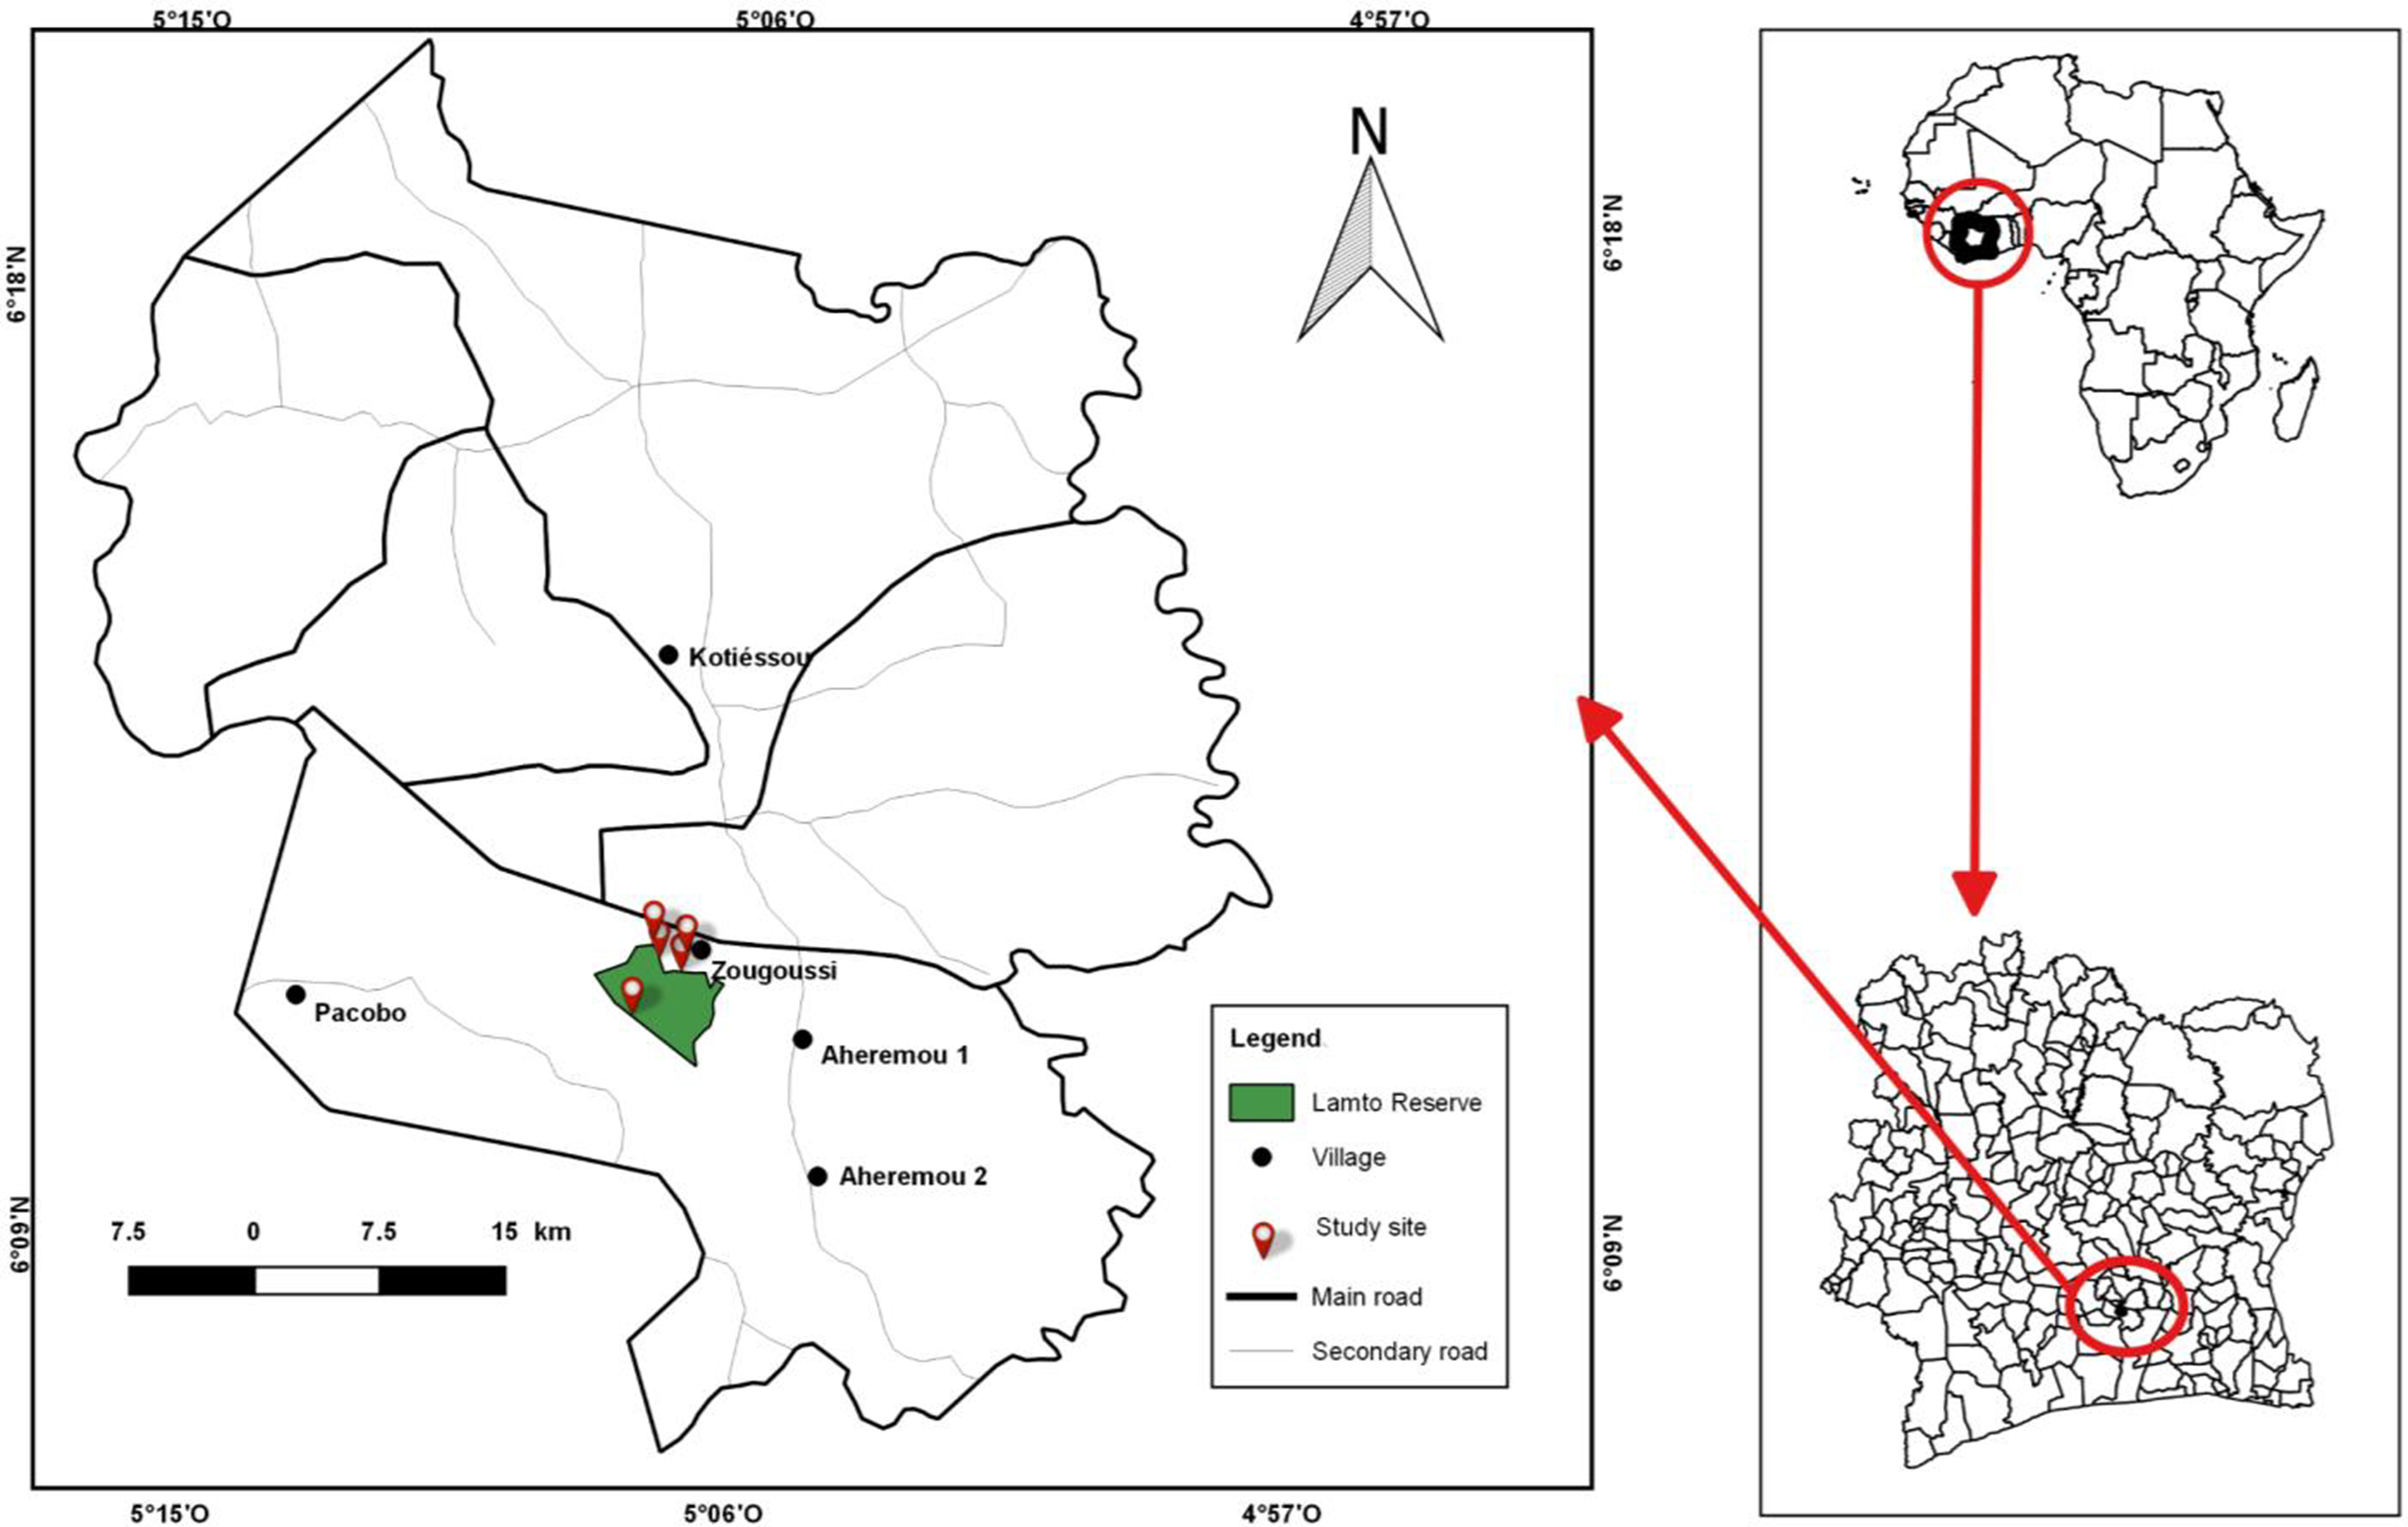
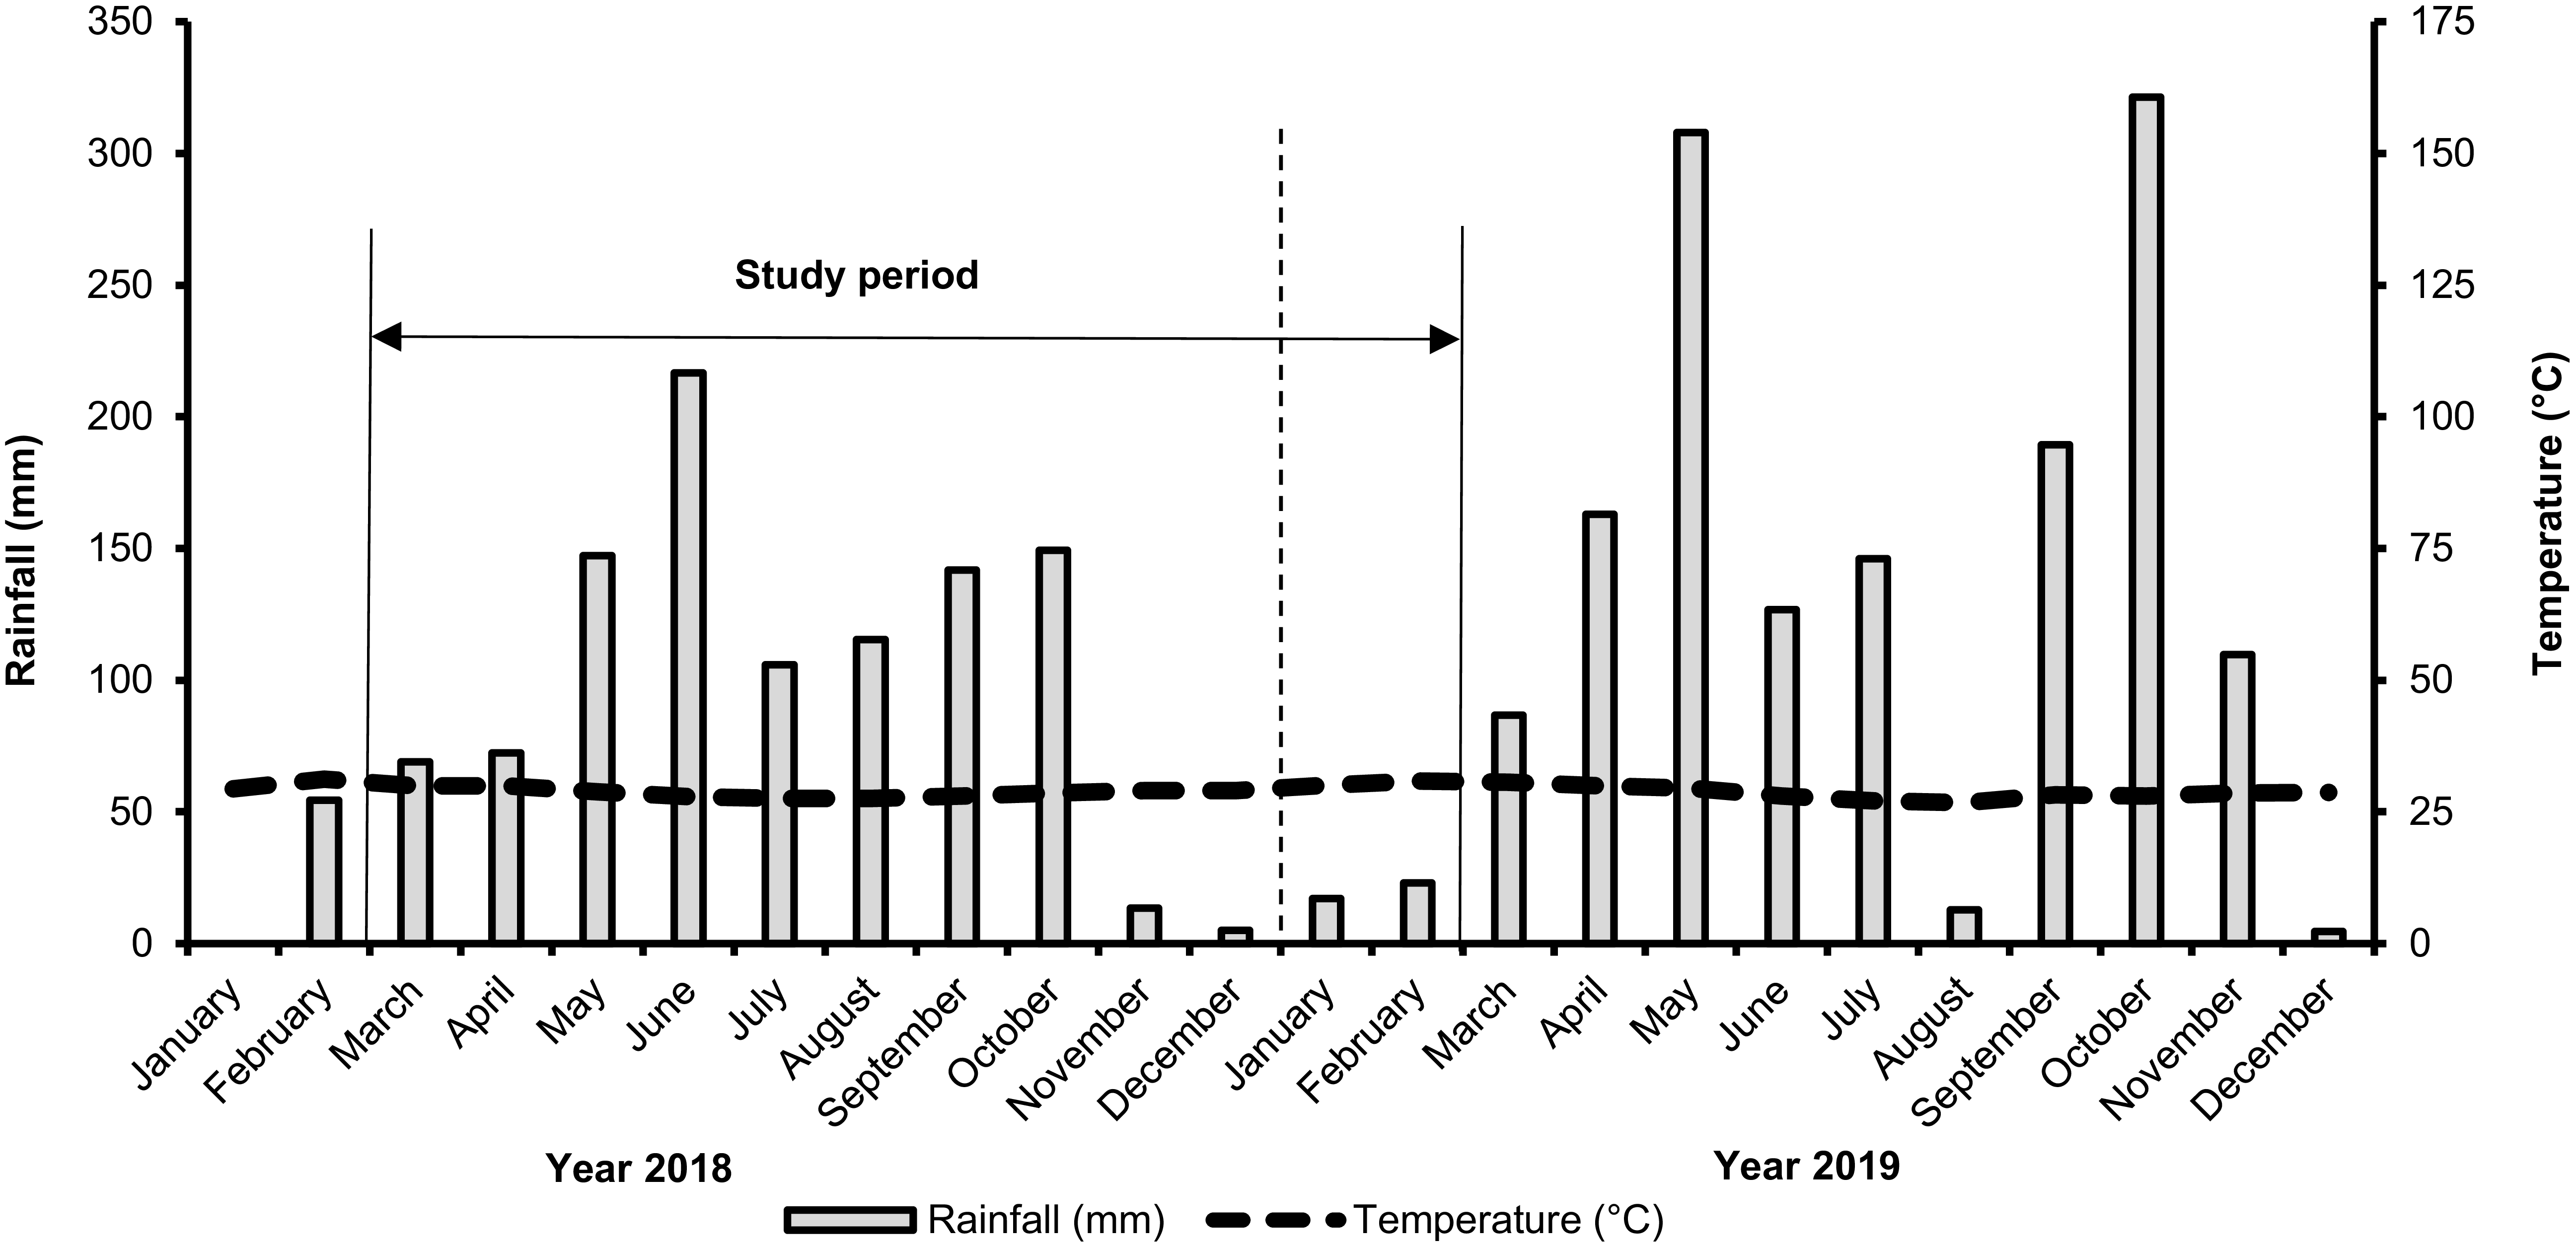
This study was conducted in central Côte d’Ivoire, specifically in the Lamto Reserve (6°13’ N; 5°02’ W) and in Zougoussi, a village located near the Reserve (Figure 1). In this area, the vegetation consists of typical Guinean savannah, where fire plays a crucial role in maintaining the savannah ecosystem. Without periodic fires, the favourable climate would facilitate the transformation of the landscape into a forest (Monnier Reference Monnier1968). Annual average temperature is 27°C, and the annual rainfall average is 1200 mm, allowing to classify the climate of this area as rainy regime (Pagney Reference Pagney, Lamotte and Tireford1988). It is a sub-equatorial type with four seasons: the long rainy season from March to July, the short dry season in August, the short rainy season from September to November, and the long dry season from December to February. However, during the study period, two main seasons were observed (Figure 2). The rainy season started in March and ended in October, while the dry season began in November and concluded in February.
Map of the study area showing the location of the Lamto Reserve and Zougoussi (a village near the Reserve), the sampling sites.

Ombrothermic diagra m of the study area during the study period (2018–2019). Data source: Geophysics Station of Lamto. The months where the precipitation charts are below the temperature band are dry, and the others are rainy.

The major land-use types, including the protected forest, the unprotected forest, the cocoa plantation, the teak plantation, and the 5-year-old fallow, were sampled monthly from March 2018 to February 2019. Apart from the protected forest, these land-use types were originally semi-deciduous forests. Prior to our collection, they were characterised based on their physical structure (vegetation and canopy cover) and the level of anthropogenic disturbance (unpublished data).
The protected forest is located in the Lamto Reserve, 7 km from Zougoussi (the village where the other land-use types are situated). It was initially an experimental area composed of grassland savannah with Andropogon, interspersed with shrubs (Devineau et al. Reference Devineau, Lecordier and Vuattoux1984). After more than 50 years of protection from bushfires, this area has transformed into a semi-deciduous forest. This forest was rich in shrubs, including Olax subscorpioidea Oliv., Morus mesozygia Stapf, Lannea nigritana (Scott-Elliot), Euclinia longiflora Salisb., Euadenia trifoliolata (Schumach. and Thonn.) Oliv., and Delonix regia (Hook.) Raf. Tree species such as Afzelia africana Pers., Antiaris toxicaria Lesch., Celtis zenkeri Engl., Funtumia africana (Benth.) Stapf, and Morus mesozygia Stapf were also abundant. The undergrowth was colonised by Olyra latifolia L., Erythroxylum emarginatum Thonn., Baissea zygodioides (K.Schum.) Stapf, and Diospyros soubreana F.White. The canopy was closed and dense, and human presence was limited to scientific research activities.
The unprotected forest had neither been cleared nor cultivated recently. It was last burned in 1966, making it 52 years old at the time of sampling. However, it was frequented by local communities and was likely subjected to the continuous collection of dead wood (for firewood) and standing wood for the manufacture of utensils, traps, and the construction of huts. The most frequent tree species were Albizia adianthifolia (Schum.) W.Wight, Antiaris toxicaria var. africana Scott-Elliot ex A. Chev., Baphia pubescens Hook.f., Berlinia grandiflora (Vahl) Hutch. and Dalziel, Ceiba pentandra (L.) Gaertn., Celtis zenkeri Engl., and Cola cordifolia (Cav.) R.Br. The undergrowth included many shrubs (Cola caricifolia (G.Don) K.Schum. and Chytranthus macrobotrys (Gilg) Exell and Mendonça) and herbaceous plants (Anchomanes difformis (Blume) Engl. and Eriosema griseum Baker). The canopy was closed and dense, but this forest was threatened by the advance of the agricultural front.
The cocoa plantation was 33 years old at the time of sampling and was regularly cleaned (at least 2 times/year). Pesticide (generally Imidaclopride 200 g/l) was applied only once per year. The floor cover was mainly composed of dead cocoa tree leaves, and the canopy was closed. There were species such as Antiaris toxicaria var. africana Scott-Elliot ex A. Chev. and Ceiba pentandra (L.) Gaertn., and the undergrowth was dominated by Griffonia simplicifolia (Vahl ex DC.) Baill., Mallotus oppositifolius (Geiseler) Müll. Arg., and Anchomanes difformis (Blume) Engl.
The teak plantation was 10 years old at the time of sampling and was not regularly cleaned, but was usually frequented by local communities. The undergrowth was not dense, contrary to the canopy that was closed and dense with a large amount of litter. There were species such as Ceiba pentandra (L.) Gaertn. and Cola cordifolia (Cav.) R.Br., and the undergrowth was dominated by Griffonia simplicifolia (Vahl ex DC.) Baill. and Millettia zechiana Harms.
The 5-year-old fallow was previously a yam crop area and had been left fallow after two years of cultivation. It was mostly dominated by Chromolaena odorata (L.) R.M.King and H.Rob. and Panicum maximum Jacq. even if there were the large tree species like Ceiba pentandra (L.) Gaertn. and Cola gigantea A.Chev.
Considering the history and all activities of local communities within these land-use types, we classified the rural land-use types as disturbed compared to the protected forest. However, the unprotected forest can be considered more stable than the other rural land-use types.
In each land-use type, 4 plots of 400 m2 (20 × 20 m) per plot were delimited for sampling.
Land snails sampling and identification
Land snails were sampled monthly using a combination of two techniques: direct search and litter sieving (De Winter and Gittenberger Reference De Winter and Gittenberger1998). Direct search consists of collecting the individuals directly in all their accessible micro-habitats, including dead woods, tree trunks, leaf litter, and under stones. Snails were searched actively on each plot for 1 hour by two people (De Winter and Gittenberger Reference De Winter and Gittenberger1998). The individuals collected (live or empty shells) were packaged in plastic bags, labelled, and brought to the laboratory for identification. Litter sieving technique allows to sample litter-dwelling micro-snails which could be detected only by litter sieving (Seddon et al. Reference Seddon, Tattersfield, Herbert, Rowson, Lange, Ngereza, Warui and AlIen2005). On each plot, litter and topsoil were collected monthly from five random quadrats, each measuring 1 × 1 m (Chokor and Oke Reference Chokor and Oke2011) and brought to the laboratory. Snail extraction was done using the dry sieving method (Chokor and Oke Reference Chokor and Oke2011). Samples were sieved with a 3 mm mesh size and exhaustively searched for micro-snails. Snails were identified based on morphological features using various publications (Abbott Reference Abbott1989; Bequaert Reference Bequaert1950; Daget Reference Daget, Lamotte and Roy2003; Oke Reference Oke2013; Rowson Reference Rowson2009). Some specimens could not be identified to the species level despite examination by a taxonomist at the Naturalis Biodiversity Center (Netherlands). The counts of unidentified species (e.g., 3 Limicolaria spp., 12 Curvella spp.) correspond to distinct morphological units in our sample, but their exact taxonomic status will require additional molecular analyses (e.g., comparison with reference sequences in databases such as BOLD or GenBank).
Environmental variables
Specific plant composition was evaluated using the method of surface survey. Canopy cover was assessed using a visual technique (Bunnell and Vales Reference Bunnell and Vales1990). Atmospheric temperature and relative atmospheric humidity were determined using a simple thermohygrometer up to one metre (Alvarez and Willig Reference Alvarez and Willig1993). The temperature and the relative humidity of litter and topsoil (representing the snail’s micro-habitat) were measured using a thermohygrometer with a sonde. Litter depth was measured using a carpenter’s metre (Amani Reference Amani2018). Soil granulometry was assessed using the method of Baize (Reference Baize1997).
Soil pH was measured using the electrometric method (soil/water suspension = 1:2.5), and the available iron content was determined by sodium dithionite extraction at 70°C, followed by analysis using atomic absorption spectrometry (Bruckert et al. Reference Bruckert, Gaiffe, Blondé and Portal1994). Calcium and magnesium were extracted from the soil using an ammonium acetate solution at pH 7, and their concentrations were determined by atomic absorption spectrometry (Bruckert et al. Reference Bruckert, Gaiffe, Blondé and Portal1994). Soil organic matter content was measured using dry combustion (loss-on-ignition) according to Schulte and Hoskins (Reference Schulte, Hoskins, Sim and Wolf2011).
Data analyses
Sampling completeness was tested by constructing sample-based species accumulation curves and by recording the auto-similarity or average between plots of the same land-use type (Cao et al. Reference Cao, Williams and Larsen2002). The observed (Sobs) and estimated (Jacknife 1) species accumulation curves were constructed using the software EstimateS 7.5 (https://purl.oclc.org/estimates) after 500 randomisations to ensure that the population of snails collected was statistically representative of the target community (Cao et al. Reference Cao, Williams and Larsen2002).
Alpha-diversity was measured by species richness (S), Shannon-Wiener index (H’) and its Evenness (E). To assess the effects of environmental variables on land snail diversity, we fitted multiple regression models for these indices using base R functions (lm, stats package), with complementary diagnostics conducted using the car and effects packages (R software version 3.6.2). Each index was analysed separately as a response variable, with environmental variables included as explanatory predictors, following standard approaches in quantitative ecology (Quinn and Keough Reference Quinn and Keough2002). Beta-diversity was evaluated using the Bray-Curtis index. Prior to calculating Bray-Curtis similarities, the abundance data were standardised to mitigate the effect of the largest differences and to better reflect variations in the composition of species assemblages (Legendre and Legendre Reference Legendre and Legendre1998). The results of this analysis were presented in the form of a dendrogram showing the similarity between land-use types. An analysis of similarities (ANOSIM) with 999 permutations was used to test the significance of these similarities, using the vegan package in R software version 3.6.2.
The abundance of species was estimated by the total number of individuals. Using the vegan package in R software version 3.6.2, we analysed the relationship between land snail abundances and environmental variables using redundancy analysis (RDA). RDA was selected because an initial Detrended Correspondence Analysis revealed a short gradient length (<3), suggesting that the species turnover in our dataset is primarily linear rather than unimodal. In such cases, linear-based methods like RDA are generally more appropriate than unimodal methods (e.g., Canonical Correspondence Analysis) (Šmilauer and Lepš Reference Šmilauer and Lepš2014; ter Braak Reference ter Braak, Jongman, ter Braak and van Tongeren1995). Prior to model construction, we conducted a Spearman correlation analysis on the environmental variables to assess potential multicollinearity (Gheoca et al. Reference Gheoca, Benedek and Schneider2021).
The significance of axes (those contributing most to the total variance) and the influence of environmental predictors were assessed using Monte Carlo permutation tests (999 iterations). Predictor selection was then performed based on the test results. To reduce noise in the data, only species with total abundances ≥10 individuals (across all land-use types) were included in the ordination analysis; the remaining species were classified as rare and excluded.
Association between land snail species and land-use types was assessed using the Indicator Value method (IndVal; Dufrêne and Legendre Reference Dufrêne and Legendre1997) implemented in the labdsv package (R version 3.6.2). The IndVal ranges from 0% (no association) to 100% (perfect association). Following previous studies (McGeoch Reference McGeoch1998; De Cáceres et al. Reference De Cáceres, Legendre, Wiser and Brotons2012; Nahmani and Rossi Reference Nahmani and Rossi2003), species with IndVal values ≥ 25% were considered to show a moderate association with a given land-use type, while significance was confirmed by permutation tests (P ≤ 0.05). This combined approach ensures both statistical robustness and ecological relevance.
The effect of seasons on snail abundance across land-use types was assessed using the Wilcoxon signed-rank test. Monthly fluctuations were analysed using the Friedman test, and the Conover test was used to identify the months with the most contrasting abundances.
After testing for normal distribution and homogeneity of variances using the car and performance packages in R software version 3.6.2, variations in abundance and diversity indices between different land-use types were examined using one-way ANOVA. Where significant differences were detected (P ≤ 0.05), Tukey’s Honest Significant Difference (HSD) post hoc test was applied to identify pairwise differences in diversity indices and abundance.
Results
Sampling completeness
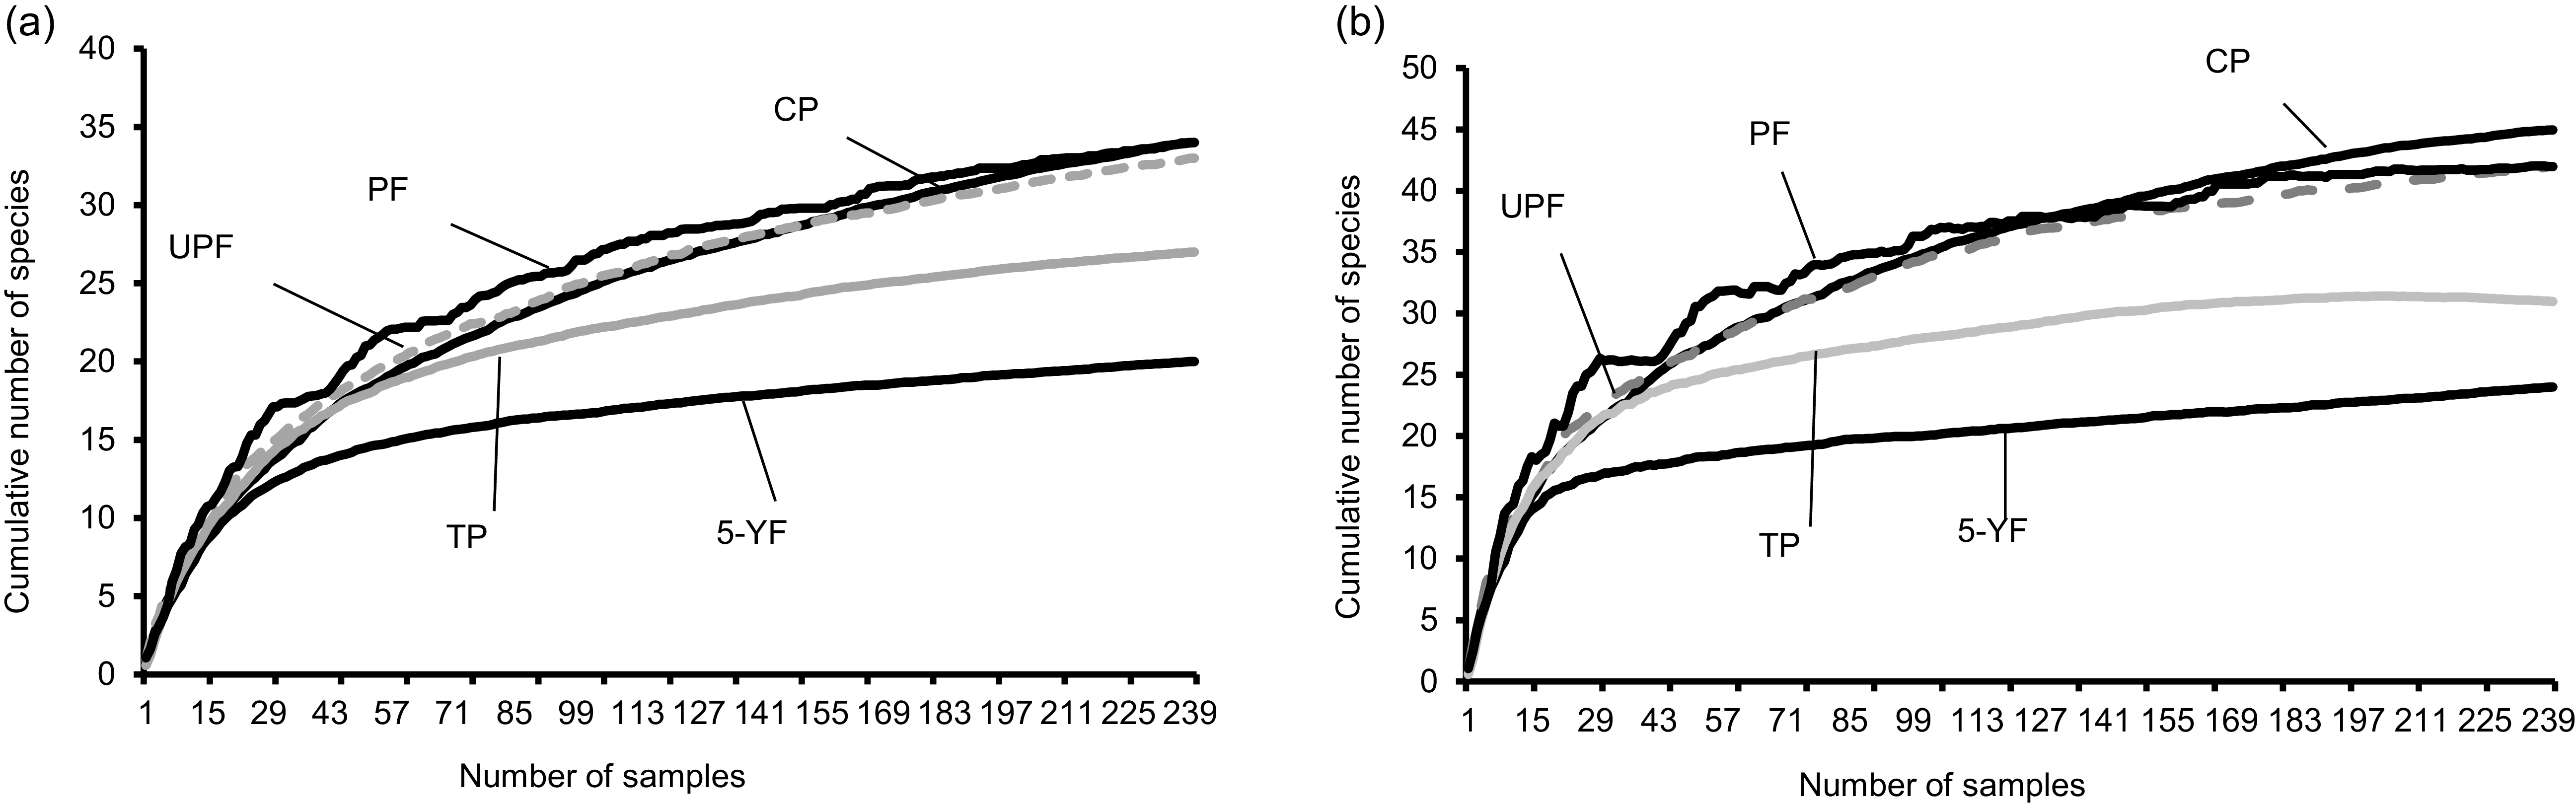
A total of 240 samples were collected for each land-use type. Species accumulation curves did not reach an asymptote (Figure 3), indicating that sampling was incomplete. Coverage estimates showed that 81.73% of expected species were detected in the protected forest, 79.42% in the unprotected forest, 76.49% in the cocoa plantation, 87.66% in the teak plantation, and 84.03% in the fallow.
Sample-based species accumulation curves of observed (a) and estimated richness (b) of land snails in the five land-use types. PF = Protected forest, UPF = Unprotected forest, CP = Cocoa plantation, TP = Teak plantation, 5-YF = 5-year-old fallow.

Species abundance and diversity across land-use types
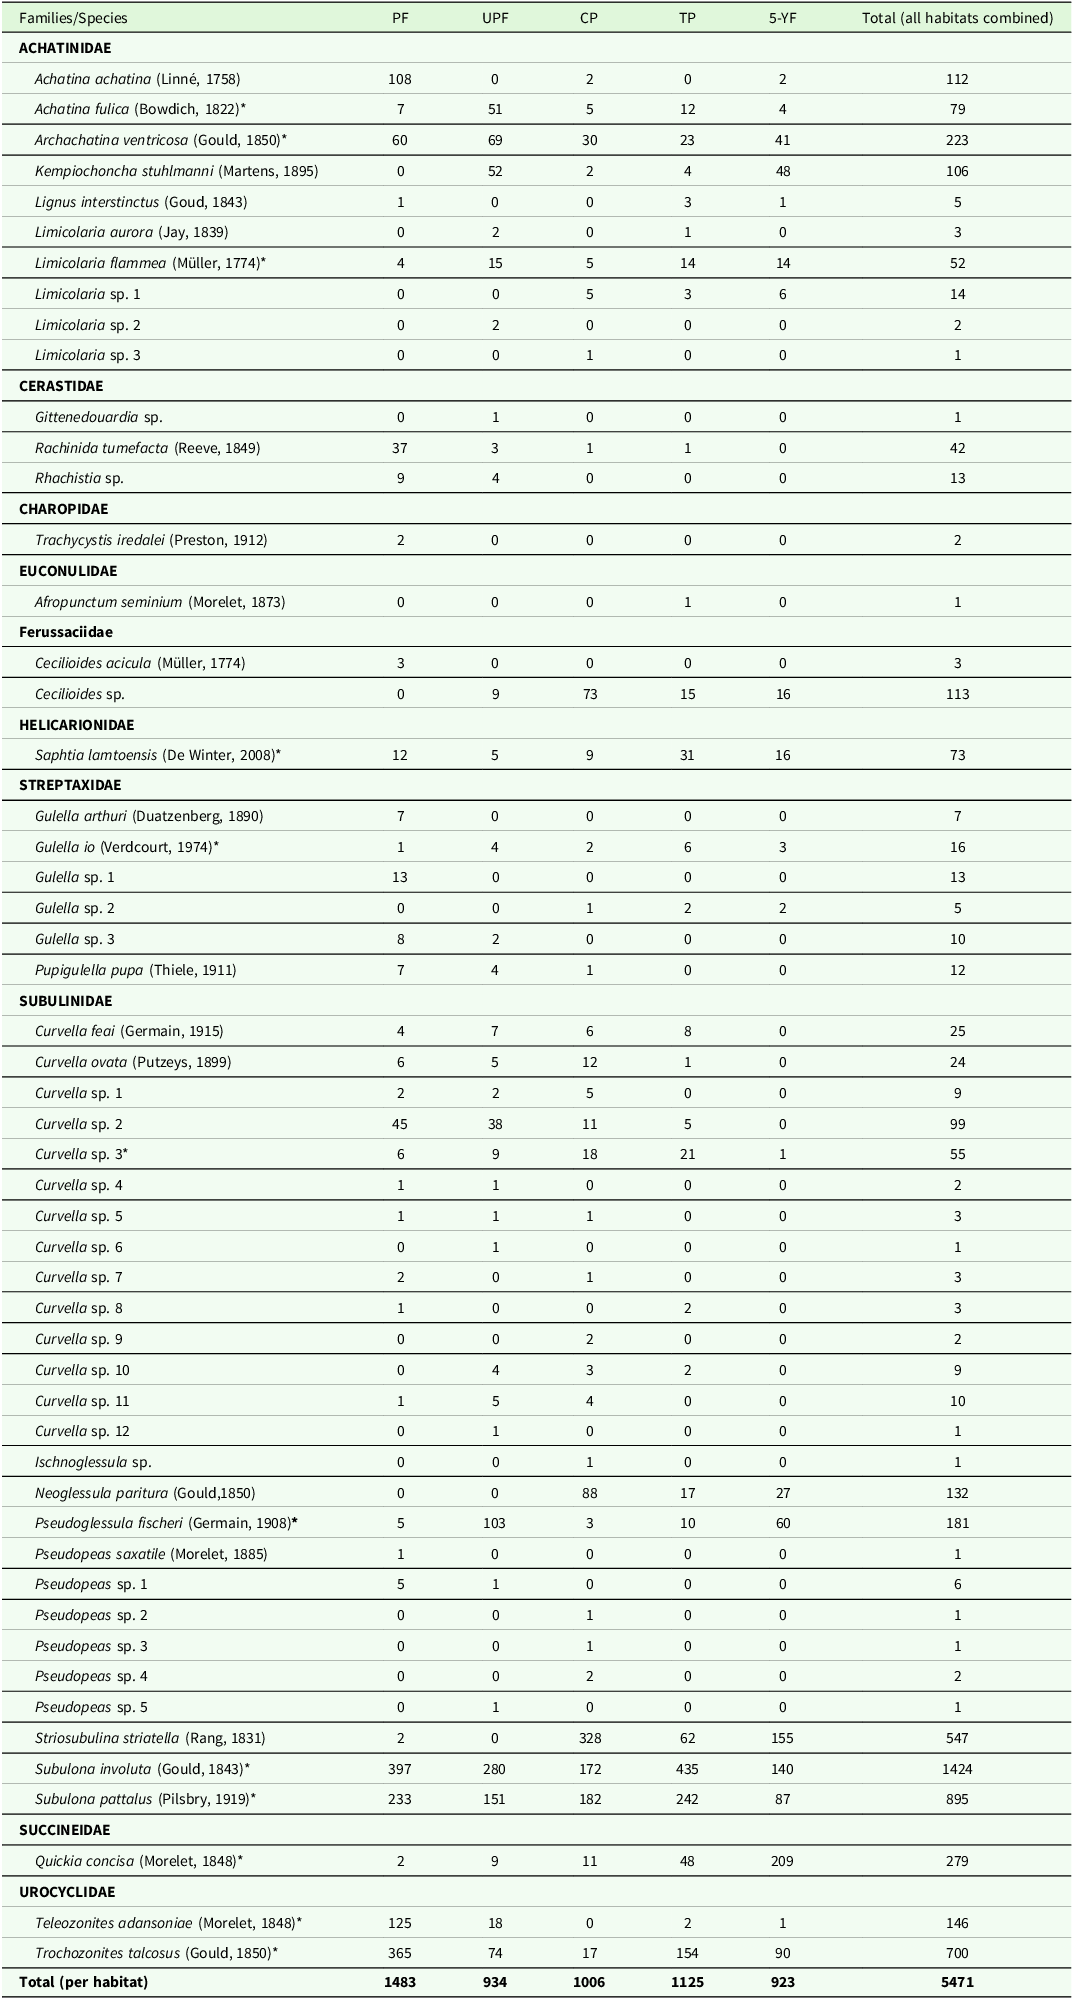
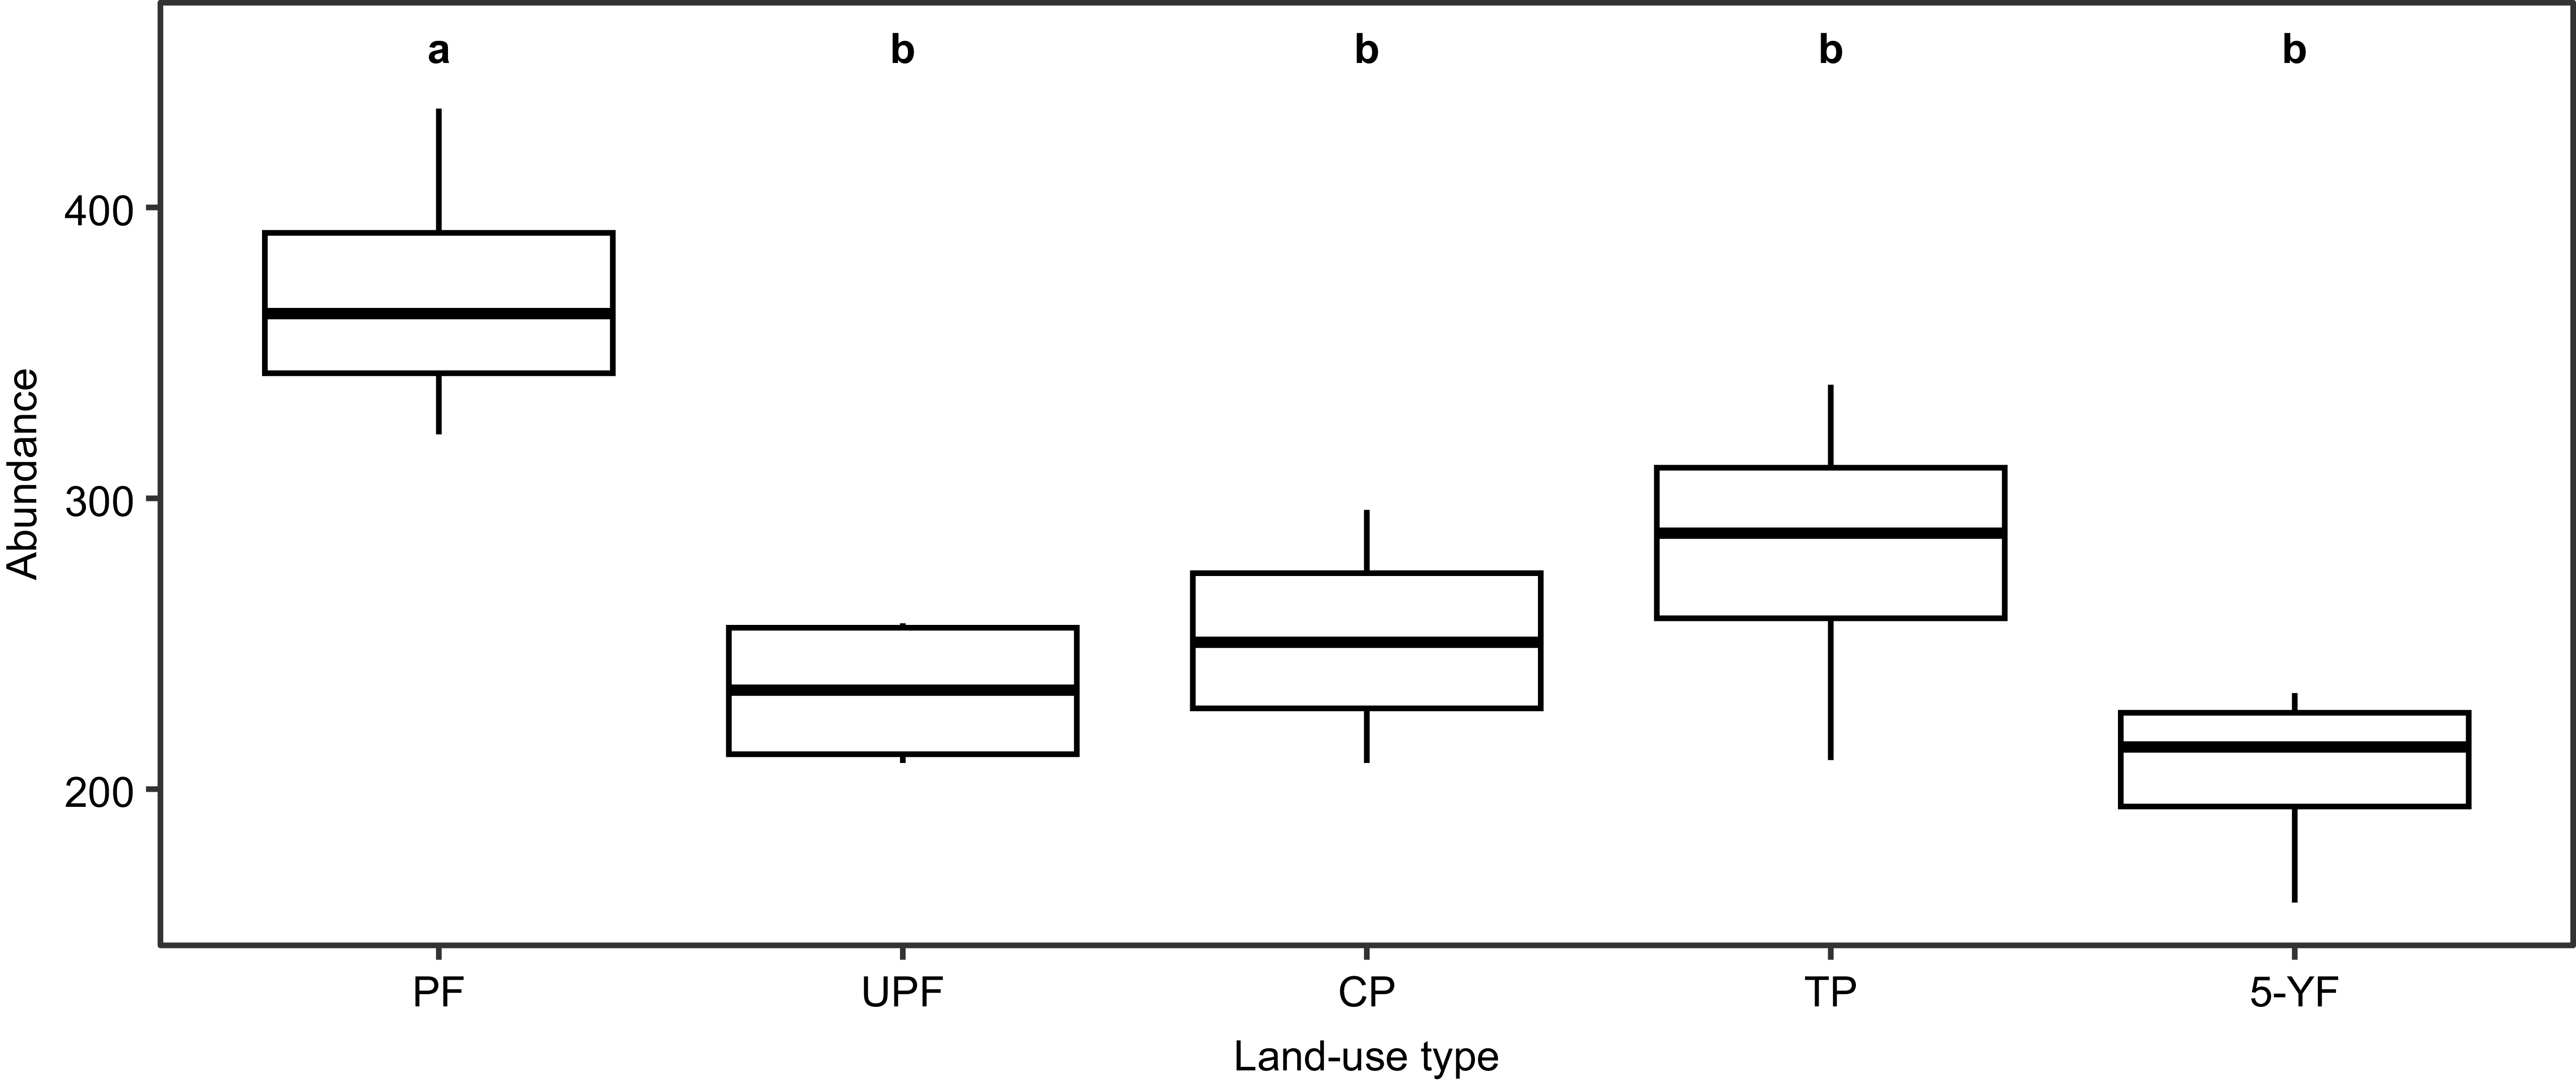
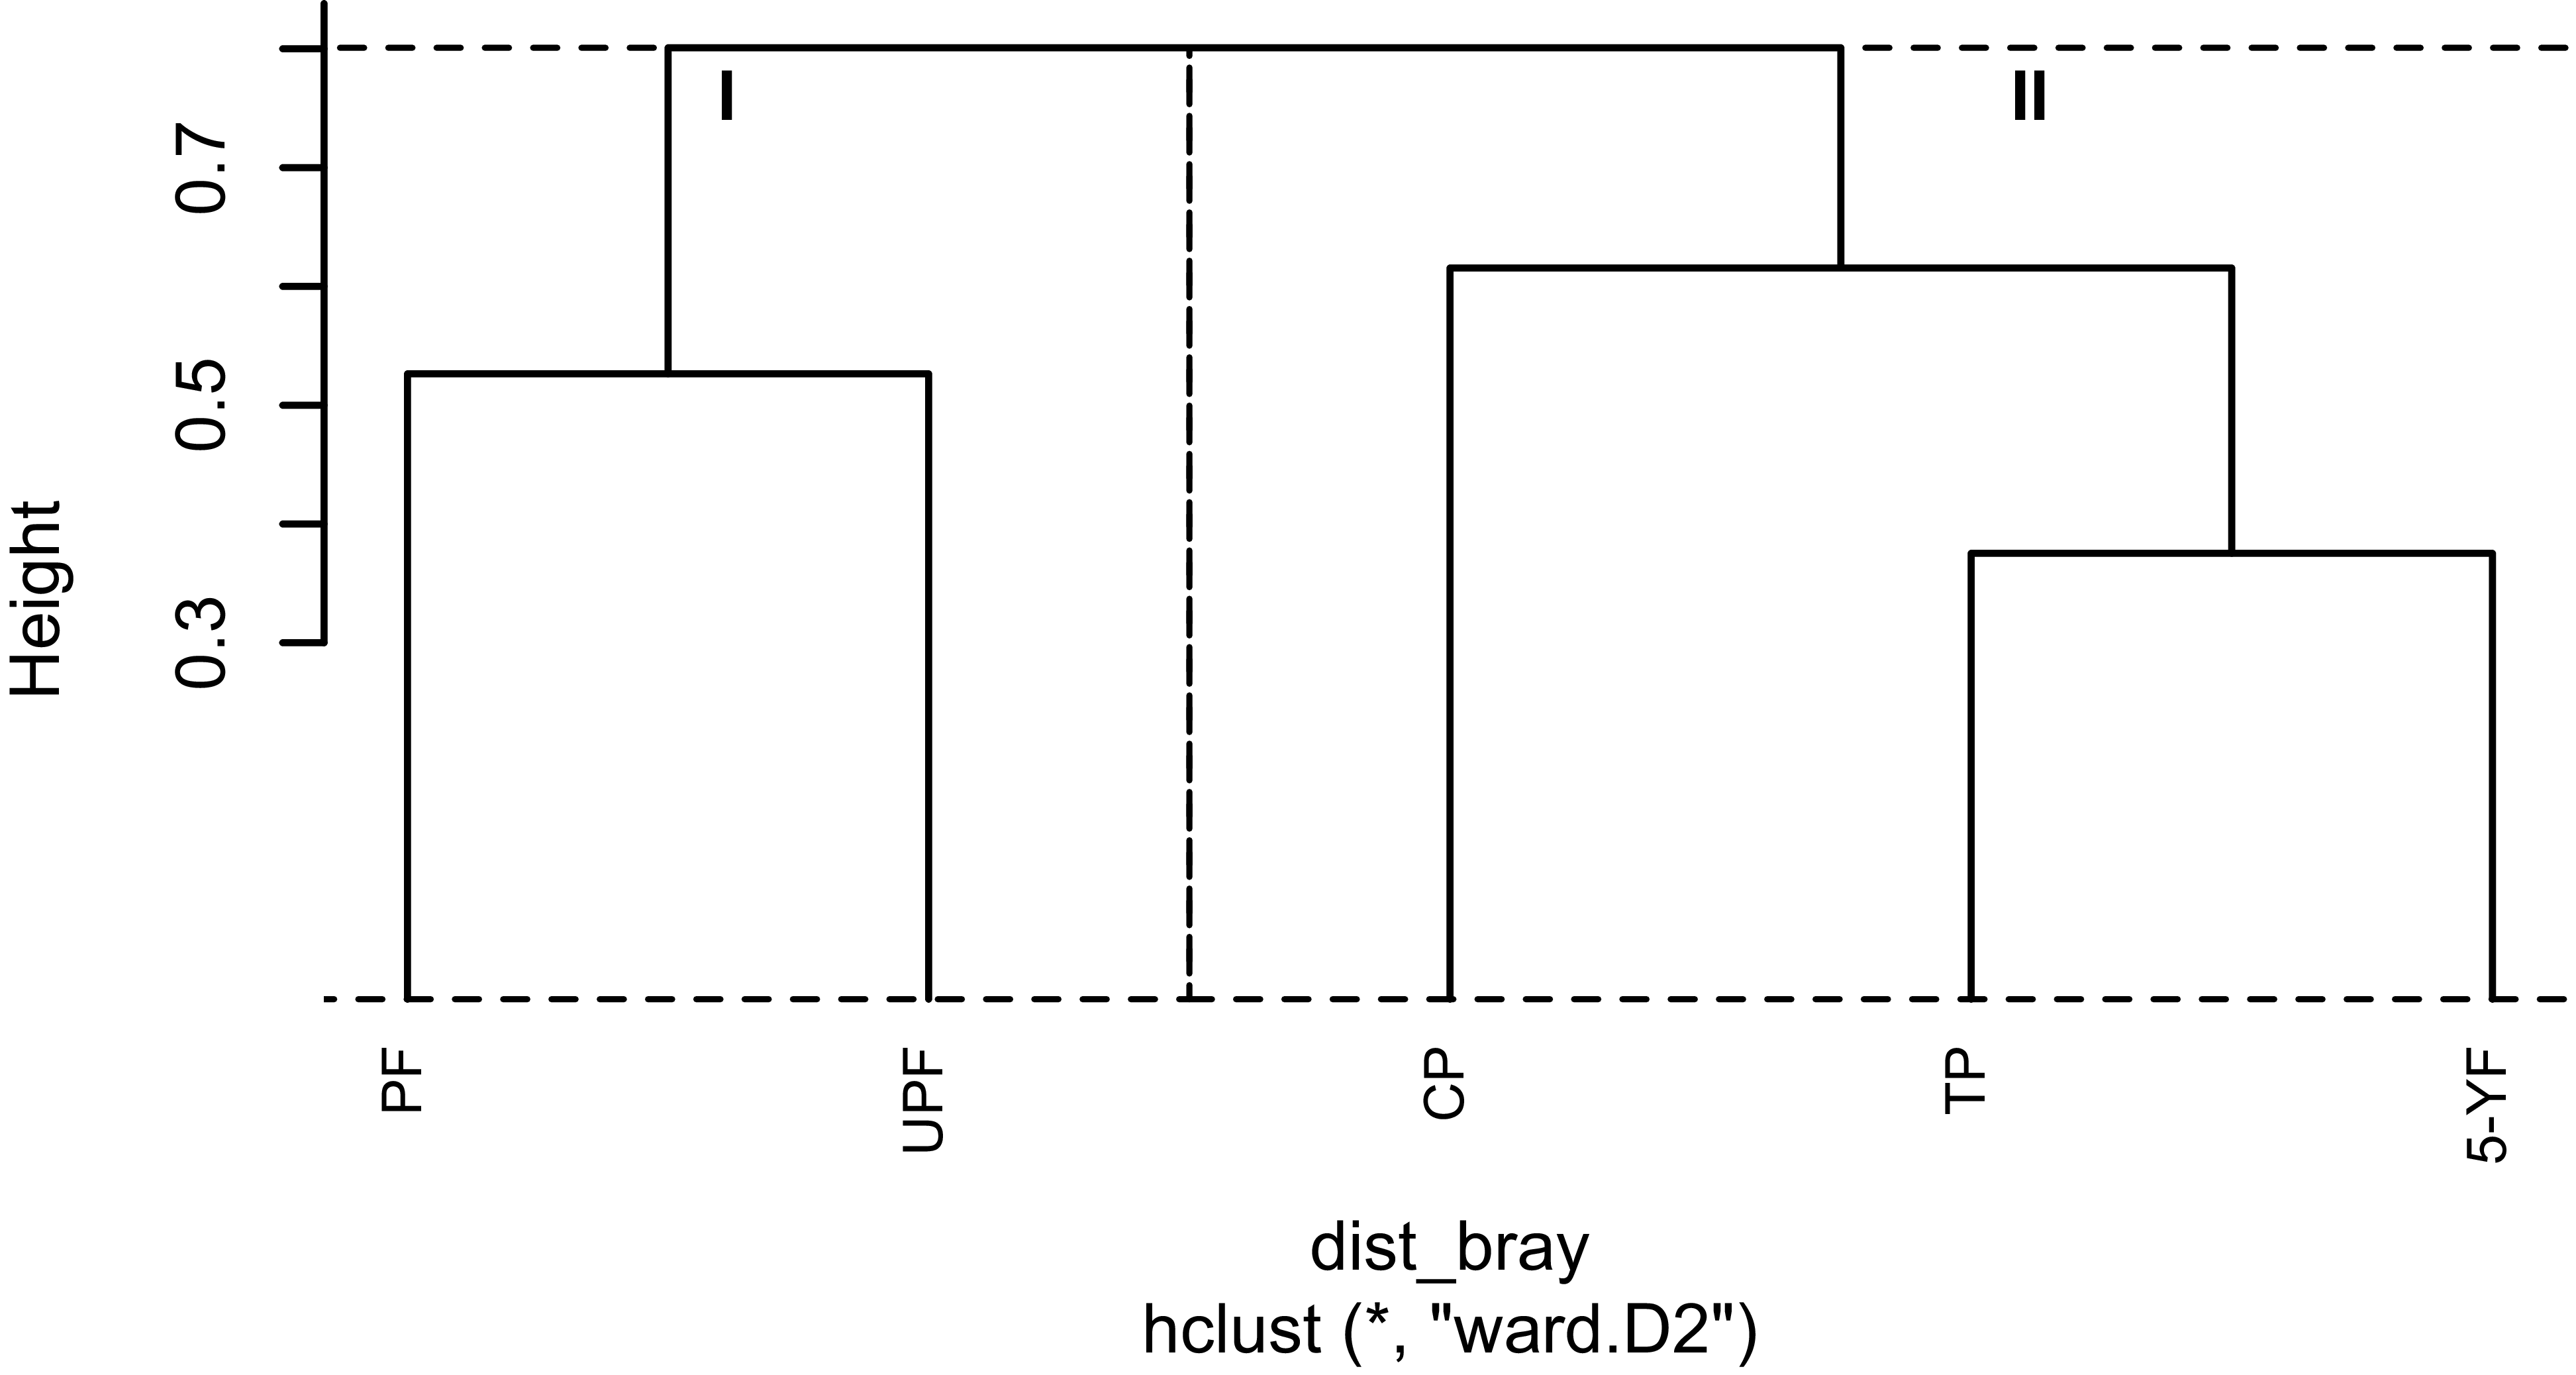
A total of 5471 land snail individuals, representing 53 species in 10 families, were sampled from 20 plots across five land-use types (Table 1). Abundance differed significantly (ANOVA, F = 9.59, P < 0.001), with higher values in the protected forest and the lowest in rural habitats (Figure 4). Species richness also varied significantly (ANOVA, F = 4.366, P = 0.015), peaking in forests and the cocoa plantation and reaching its lowest values in fallow (Table 2). Shannon diversity did not differ significantly (ANOVA, F = 2.145, P = 0.125), whereas evenness did (ANOVA, F = 6.094, P = 0.004), with lower values in the protected forest, teak, and cocoa plantations than in fallow (Table 2). Cluster analysis identified two main assemblages (Figure 5): one grouping the protected and unprotected forests, and another comprising the cocoa and teak plantations and fallow. This pattern suggests a shift in species composition between forested and cultivated habitats, although the separation was moderate and not statistically significant (ANOSIM, R = 0.184, P = 0.111).
Abundance of land snail species recorded in the five land-use types

Values represent the number of individuals per species. ‘Total (all habitats combined)’ represents the overall number of individuals across all land-use types; ‘Total (per habitat)’ indicates the sum within each habitat.
Species with (*) were common to all land-use types.
PF = Protected forest; UPF = Unprotected forest; CP = Cocoa plantation; TP = Teak plantation; 5-YF = 5-year-old fallow.
Diversity metrics of land snail assemblages across the five land-use types

Values represent means ± standard error for Shannon–Wiener diversity and evenness, and total counts for species richness.
Different letters (a and b) indicate statistically significant differences among land-use types according to Tukey’s HSD post-hoc test at α = 0.05. Land-use types sharing the same letter do not differ significantly.
PF = Protected forest; UPF = Unprotected forest; CP = Cocoa plantation; TP = Teak plantation; 5-YF = 5-year-old fallow.
Variation in the abundance of land snails across land-use types. Boxplots summarise data distributions: the central line represents the median, the box spans the interquartile range (25th–75th percentiles), and the whiskers extend to values within 1.5 × the interquartile range. Different letters displayed above the boxes (a and b) indicate significant differences in abundance among the land-use types, according to Tukey’s HSD post-hoc test (α = 0.05). Land-use types that share the same letter are not statistically different. PF = Protected forest; UPF = Unprotected forest; CP = Cocoa plantation; TP = Teak plantation; 5-YF = 5-year-old fallow.

Classification of land-use types based on their snail species composition with Bray-Curtis index using Ward’s hierarchical clustering. I and II are different groups formed. The y-axis (Height) indicates the dissimilarity between groups; higher junctions correspond to lower similarity. PF = Protected forest; UPF = Unprotected forest; CP = Cocoa plantation; TP = Teak plantation; 5-YF = 5-year-old fallow.

Common and indicator species and their abundance variation in response to environmental variables
Among the 53 species of land snails collected, 12 were found in all the land-use types (Table 2). Of these, 10 species, namely Archachatina ventricosa, Achatina fulica, Trochozonites talcosus, Subulona involuta, Quickia concisa, Pseudoglessula fischeri, Saphtia lamtoensis, Subulona pattalus, Teleozonites adansoniae, and Curvella sp. 3, showed sensitivity to changes in land-use types, as their abundances varied significantly. In contrast, 2 species (Limicolaria flammea and Gulella io) were not sensitive (P > 0.05).
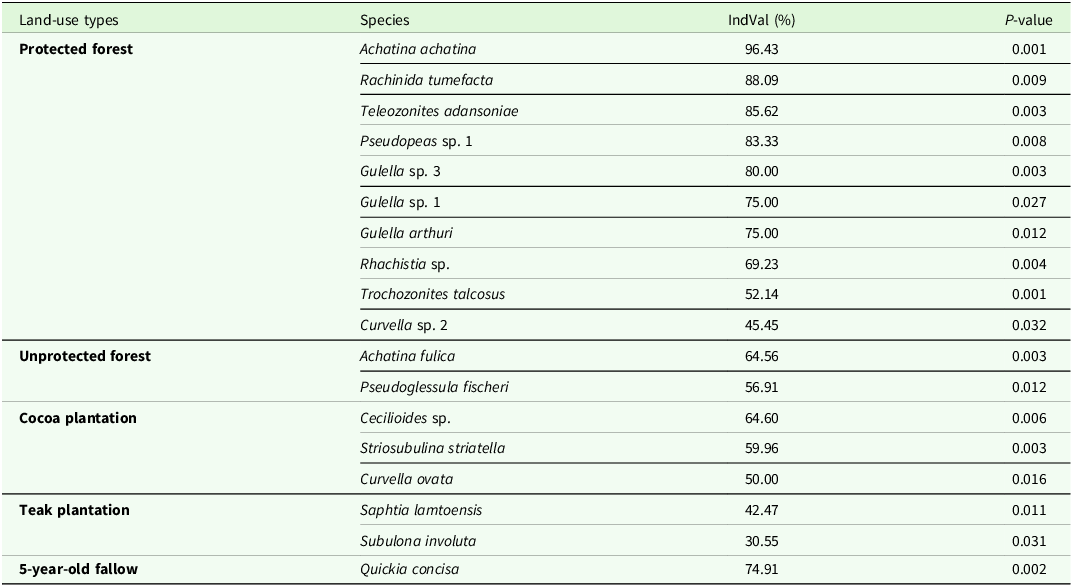
Overall, 18 species of the 53 collected were significantly associated with a particular land-use type (= indicator species) (Table 3). The protected forest hosted 10 species: Achatina achatina (96.43%), Rachinida tumefacta (88.09%), Teleozonites adansoniae (85.62%), Pseudopeas sp. 1 (83.33%), Gulella sp. 3 (80.00%), Gulella sp. 1 (75.00%), Gulella arthuri (75.00%), Rhachistia sp. (69.23%), Trochozonites talcosus (52.14%), and Curvella sp. 2 (45.45%). The unprotected forest had 2 species: Achatina fulica (64.56%) and Pseudoglessula fischeri (56.91%). The cocoa plantation included 3 species: Cecilioides sp. (64.60%), Striosubulina striatella (59.96%), and Curvella ovata (50.00%). The teak plantation contained 2 species: Saphtia lamtoensis (42.47%) and Subulona involuta (30.55%). Quickia concisa (74.91%) was associated with the fallow.
Indicator species of the five land-use types, identified through Indicator Value (IndVal) analysis

IndVal (%) values represent the strength of the association between each species and the habitat type, while P-values indicate the level of statistical significance.
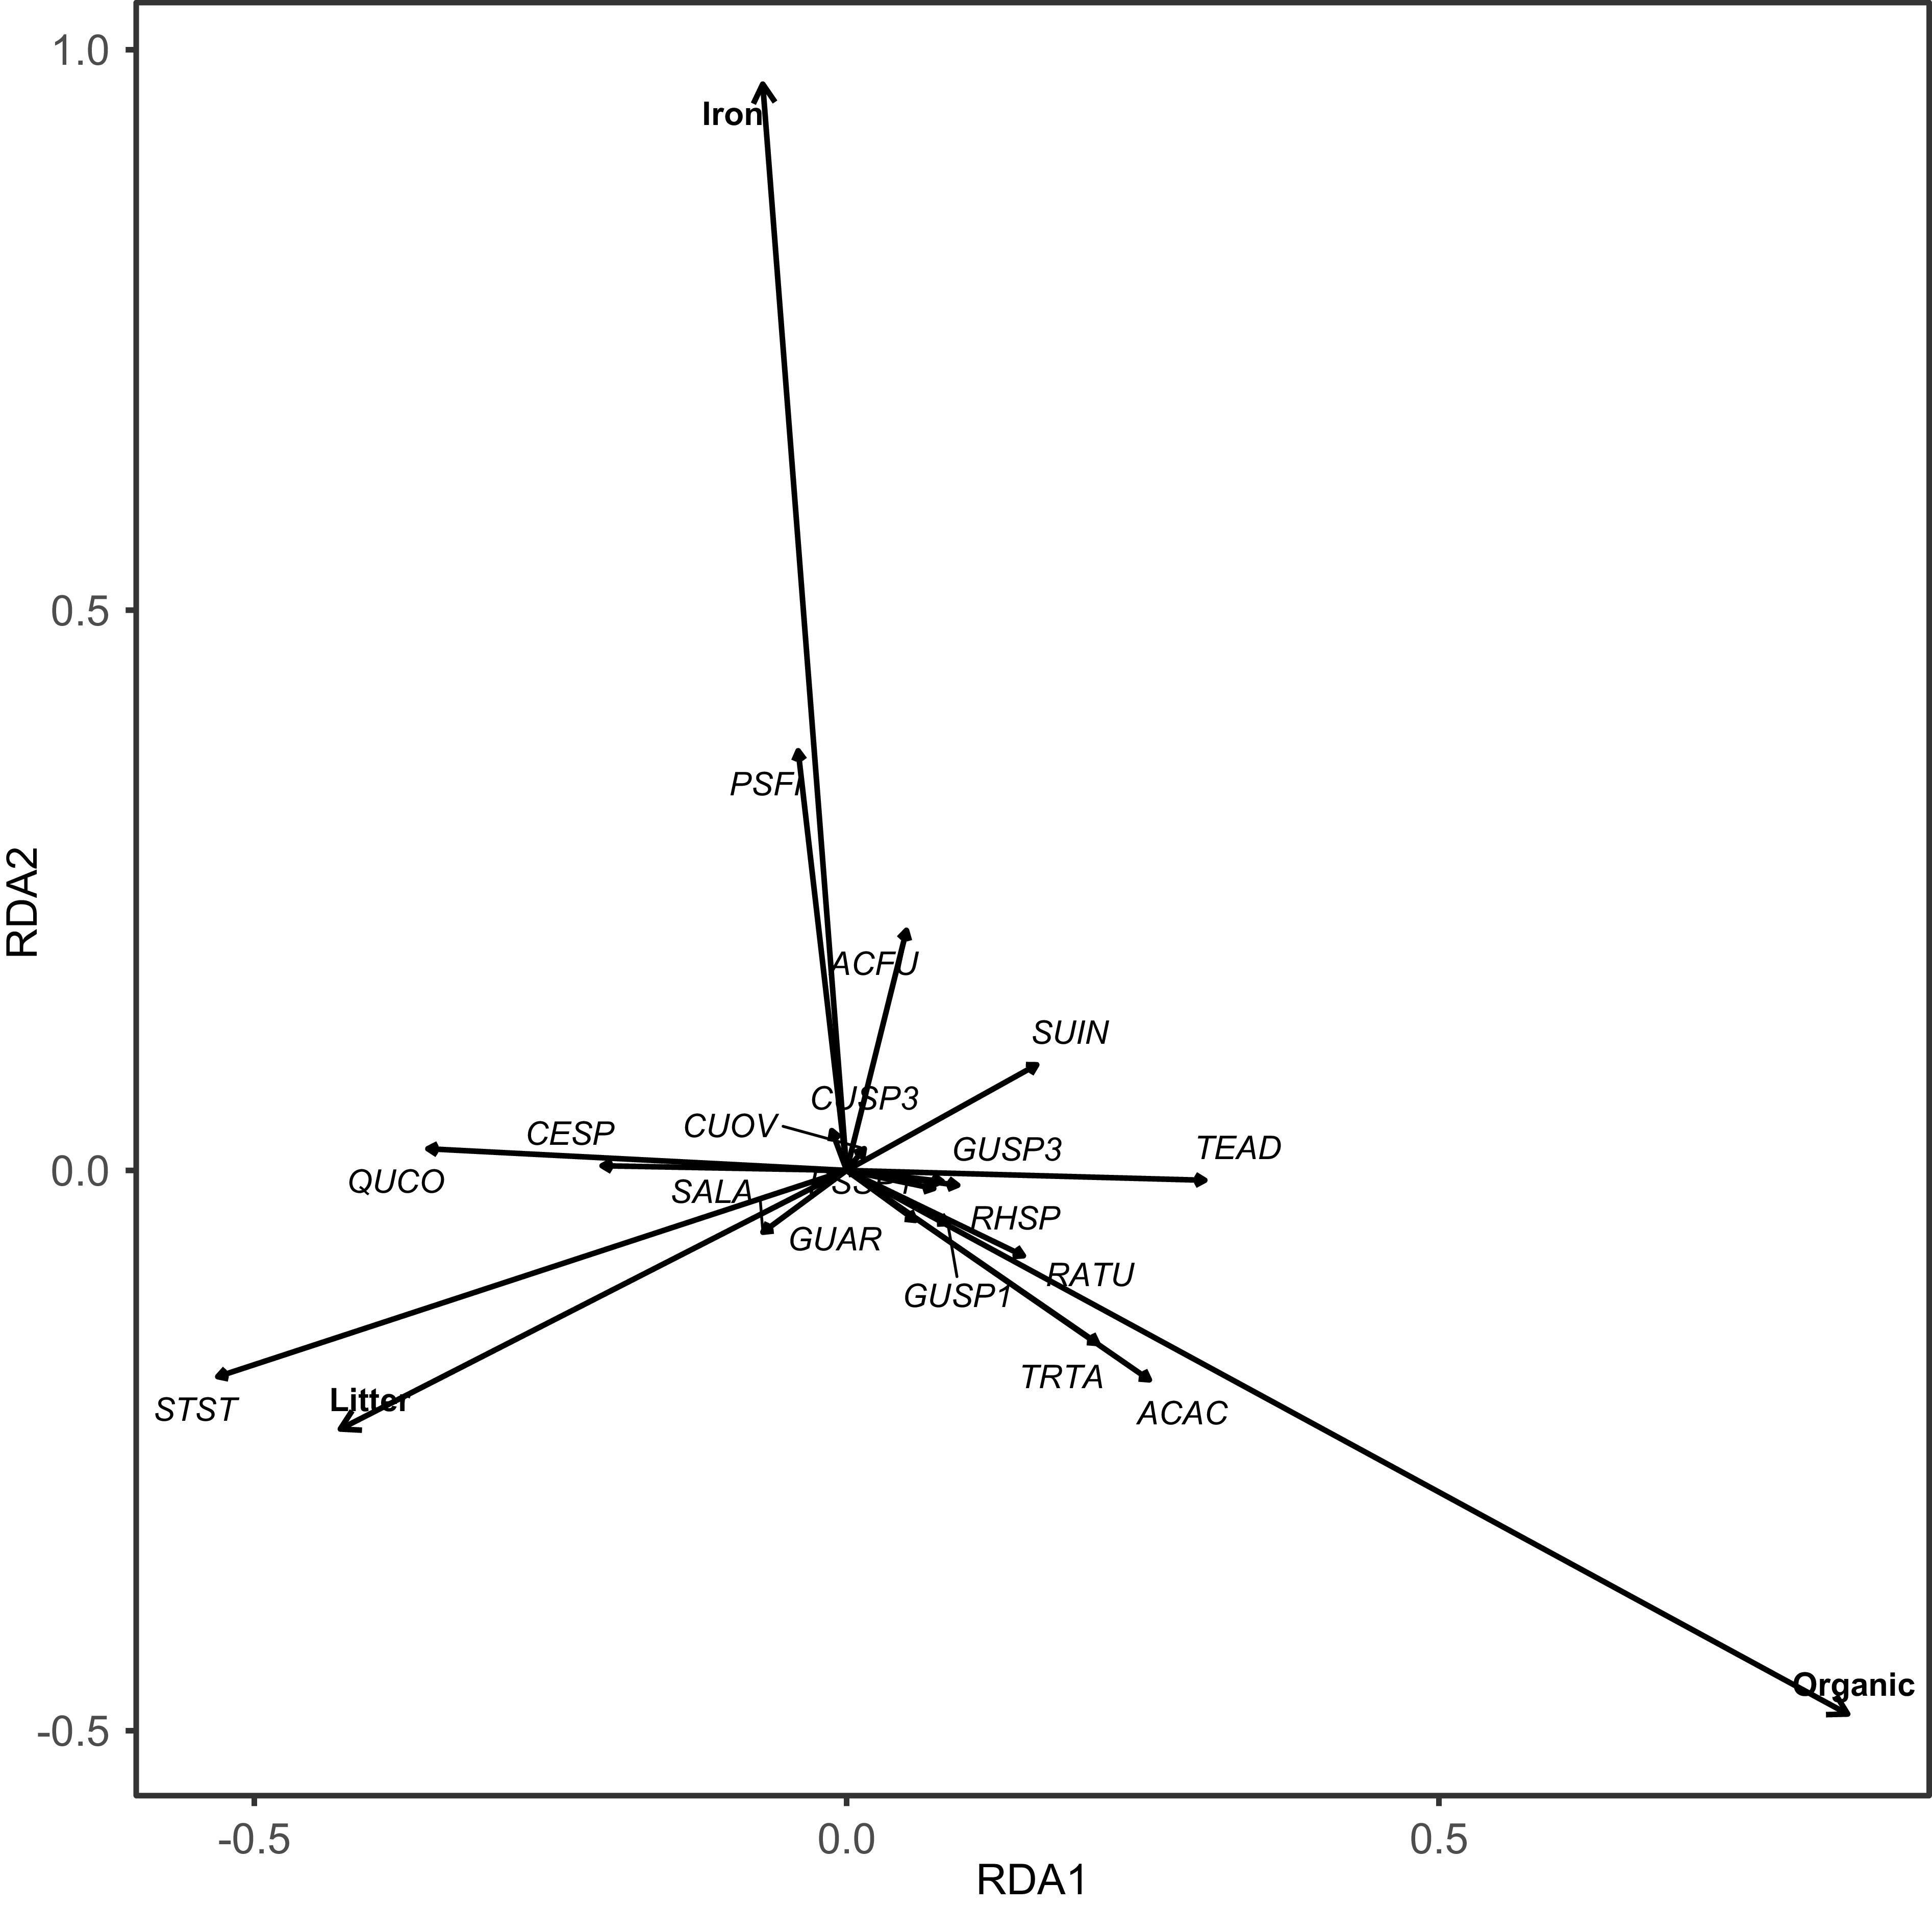
The RDA performed with the species matrix constrained by environmental variables revealed that the overall constrained model was significant (Monte Carlo test, 999 permutations, P = 0.001). Soil iron content (Monte Carlo test, F = 6.097, P = 0.004), soil organic matter content (Monte Carlo test, F = 6.422, P = 0.004), and litter depth (Monte Carlo test, F = 2.390, P = 0.005) together explained 45.75% of the variation in indicator snail abundances. Both the first axis (Monte Carlo test, F = 11.335, P = 0.001) and the second axis (Monte Carlo test, F = 4.464, P = 0.007) were significant, accounting for 63.32% and 24.94% of the total variance, respectively.
The predictors that contribute most to axis 1 are soil organic content and litter depth, which, with the abundances of Saphtia lamtoensis, Striosubulina striatella, Cecilioides sp., and Quickia concisa, were negatively correlated (Figure 6). In contrast, Achatina achatina, Trochozonites talcosus, Teleozonites adansoniae, Rachinida tumefacta, Gullela sp. 1, Gulella sp. 3, and Subulona involuta exhibited positive correlations.
Indicator land snail responses to the environmental variables in the ordination space generated by the first two axes extracted from the redundancy analysis with the species matrix constrained by the environmental variables. ACFU = Achatina fulica; TRTA = Trochozonites talcosus; ACAC = Achatina achatina; SUIN = Subulona involuta; QUCO = Quickia concisa; PSFI = Pseudoglessula fischeri; CESP = Cecilioides sp.; GUSP1 = Gulella sp. 1; STST = Striosubulina striatella; SALA = Saphtia lamtoensis; TEAD = Teleozonites adansoniae; CUOV = Curvella ovata; PSSP1 = Pseudopeas sp. 1; GUSP3 = Gulella sp. 3; CUSP3 = Curvella sp. 3; GUAR = Gulella arthuri; RHSP = Rhachistia sp.; RATU = Rachinida tumefacta. Litter = Litter depth; Iron = Iron content; Organic = Organic matter content.

The predictor that contributes most to axis 2 is soil iron content, which, with the abundances of Pseudoglessula fischeri and Achatina fulica, were positively correlated.
Curvella ovata appeared near the origin of both axes, indicating that it remains indifferent to variations in soil organic content, iron content, and litter depth (Figure 6).
Environmental variables and global species abundance variation
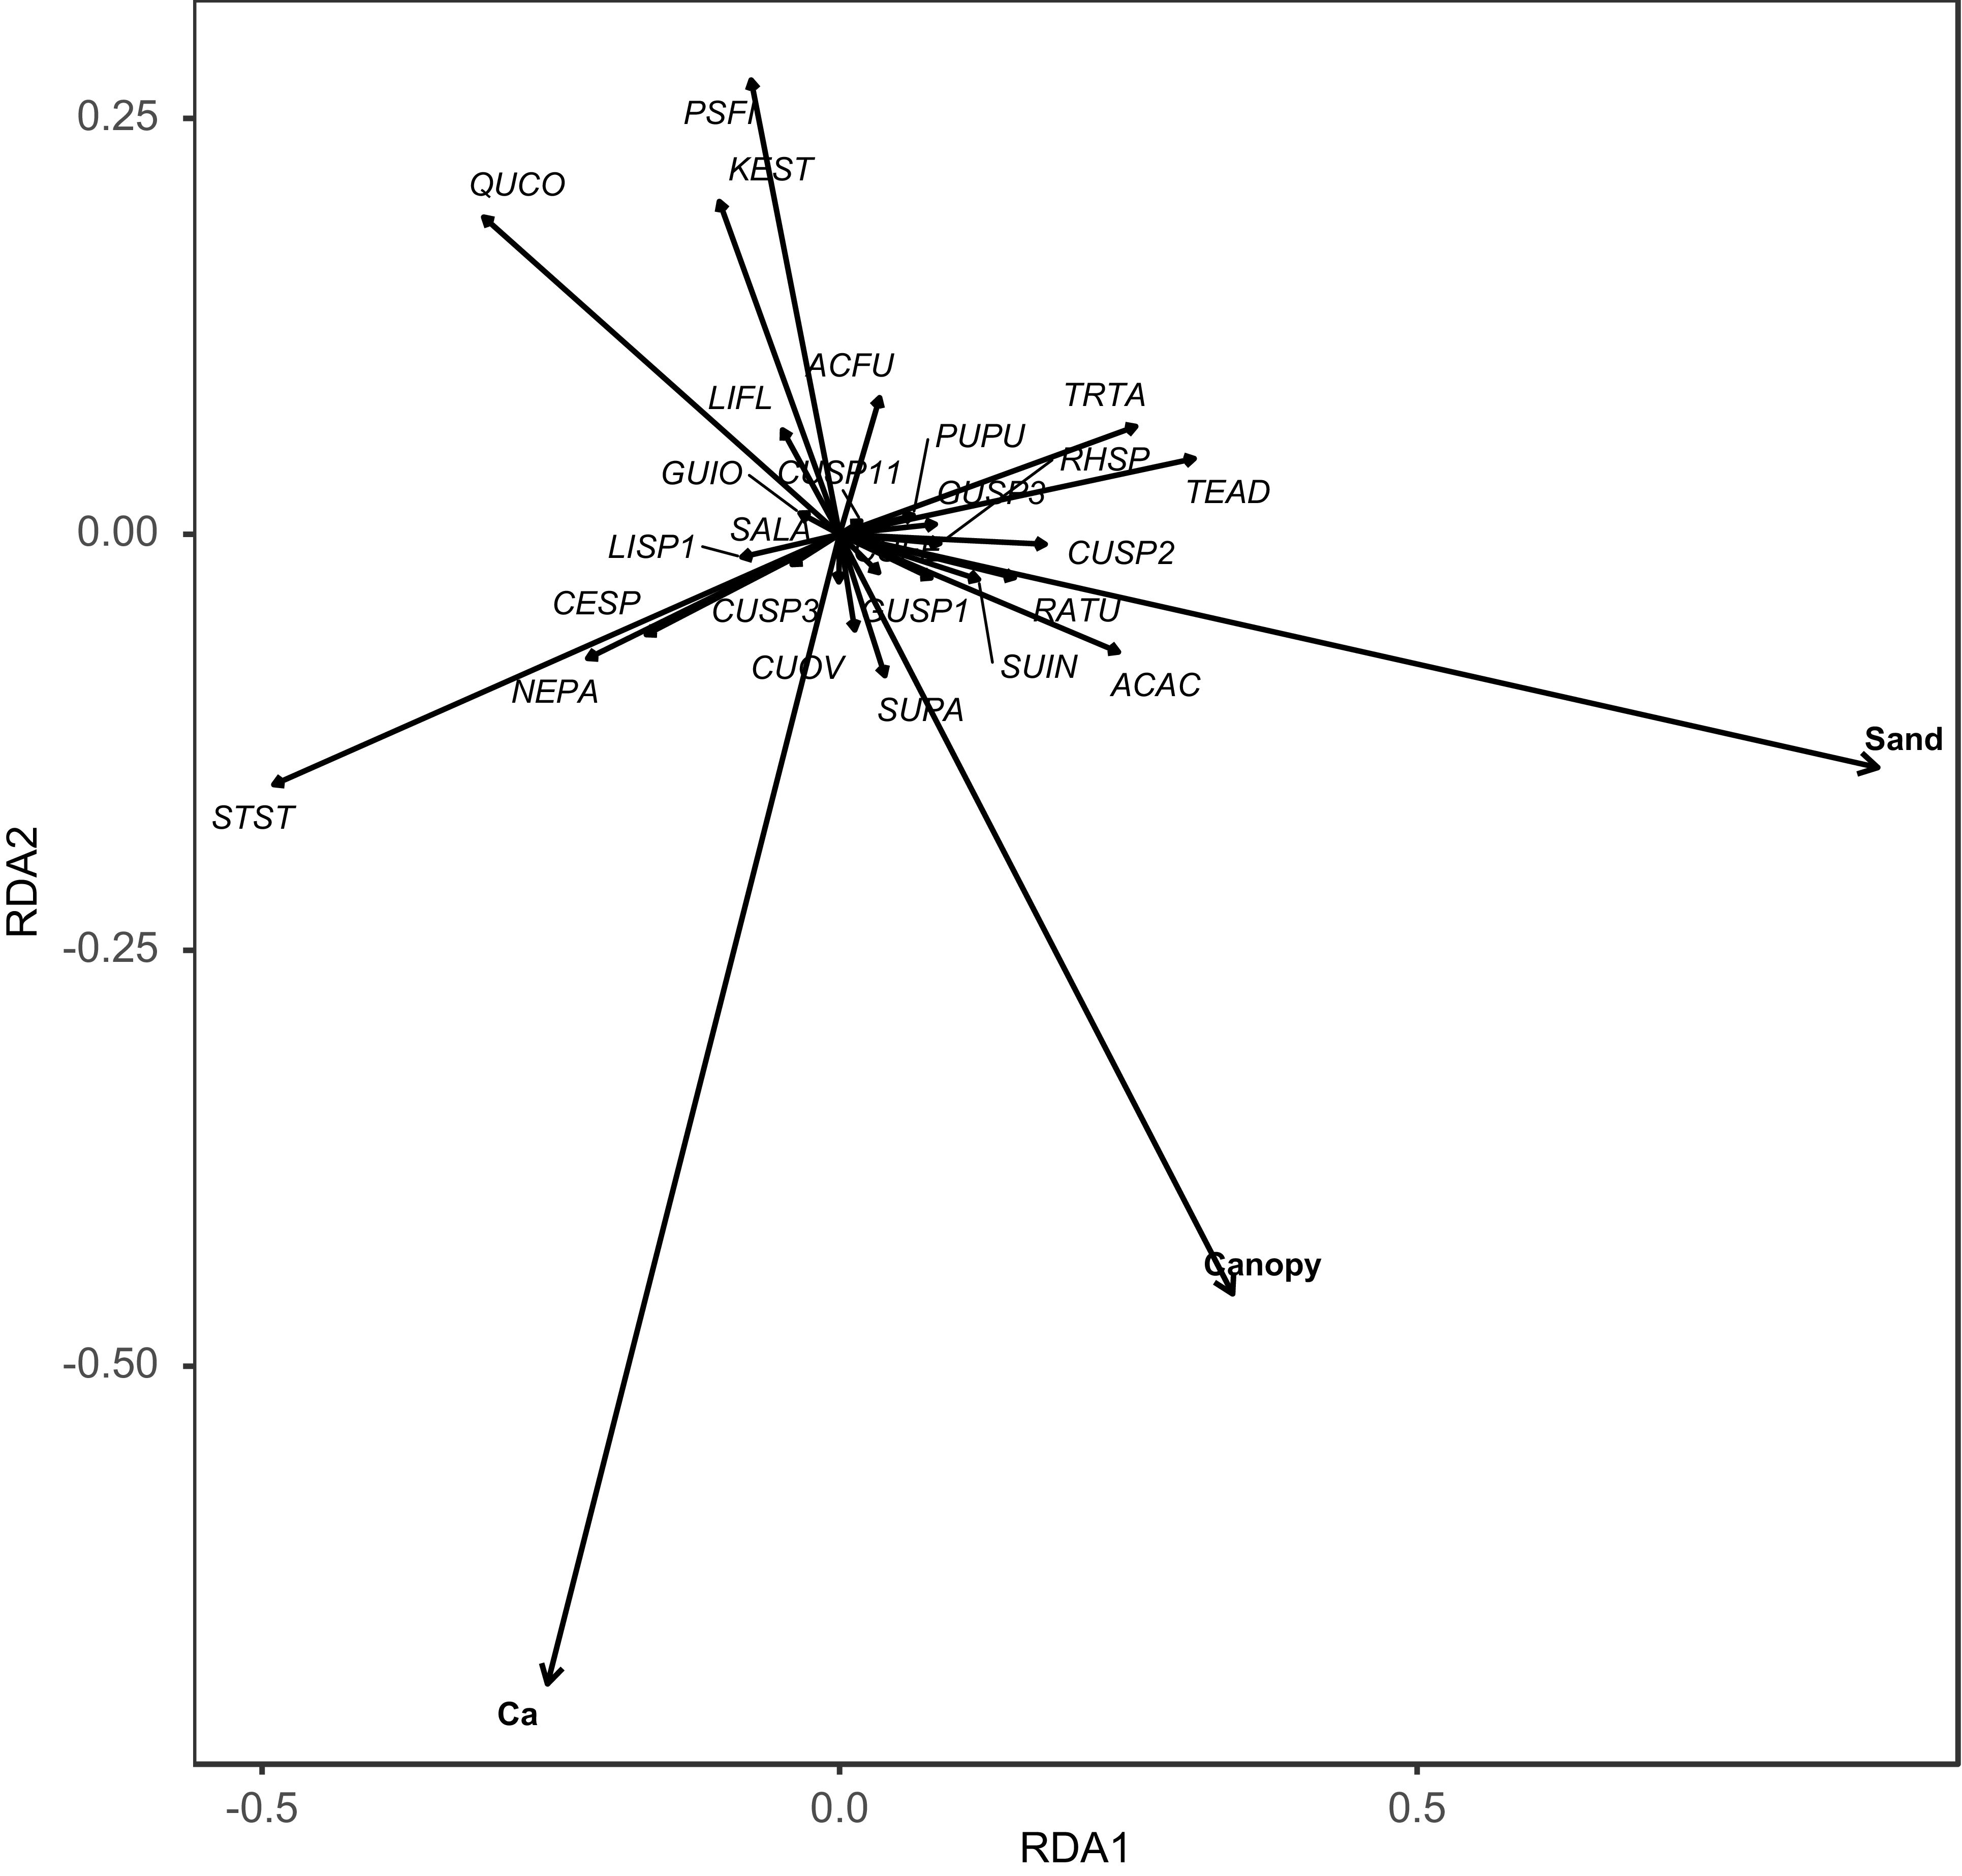
The RDA of the species matrix constrained by environmental variables showed that the overall model was significant (Monte Carlo test, 999 permutations, P = 0.001). Canopy cover (Monte Carlo test, F = 2.965, P = 0.006), soil calcium content (Monte Carlo test, F = 3.451, P = 0.016), and soil sand content (Monte Carlo test, F = 7.127, P = 0.002) explained global snail abundance patterns, together accounting for 49.76% of the constrained variation. The first axis (Monte Carlo test, F = 10.619, P = 0.001) and the second axis (Monte Carlo test, F = 3.099, P = 0.041) were both significant and explained 33.34% and 9.73% of the constrained variance, respectively.
The predictor that contributes most to axis 1 is sand content, which, with the abundances of Achatina achatina, Teleozonites adansoniae, Trochozonites talcosus, Curvella sp. 2, Rachinida tumefacta, and Subulona involuta, were positively correlated (Figure 7).
Global land snail responses to the environmental variables in the ordination space generated by the first two axes extracted from the redundancy analysis with the species matrix constrained by the environmental variables. ARVE = Archachatina ventricosa; ACFU = Achatina fulica; LIFL = Limicolaria flammea; TRTA = Trochozonites talcosus; ACAC = Achatina achatina; SUIN = Subulona involuta; QUCO = Quickia concisa; PSFI = Pseudoglessula fischeri; CUFE = Curvella feai; CESP = Cecilioides sp.; GUSP1 = Gulella sp. 1; STST = Striosubulina striatella; SALA = Saphtia lamtoensis; SUPA = Subulona pattalus; TEAD = Teleozonites adansoniae; CUOV = Curvella ovata; PUPU = Pupigulella pupa; NEPA = Neoglessula paritura; GUSP3 = Gulella sp. 3; LISP1 = Limicolaria sp. 1; KEST = Kempiochoncha stuhlmanni; CUSP3 = Curvella sp. 3; CUSP2 = Curvella sp. 2; RHSP2 = Rhachistia sp. 2; RATU = Rachinida tumefacta; GUIO = Gulella io; CUSP11 = Curvella sp. 11. Canopy = Canopy cover; Ca = Calcium content. Only species with abundance in all land-use types ≥10 individuals are plotted.

Quickia concisa, Pseudoglessula fischeri, Kempiochoncha stuhlman ni, Striosubulina striatella, Cecilioides sp., and Neoglessula paritura had opposite behaviour to the above-mentioned species since their abundances were negatively correlated with sand content.
The predictors that contribute most to axis 2 are canopy cover and calcium content, which, with the abundances of Subulona pattalus and Curvella ovata, were positively correlated. The abundances of Quickia concisa, Pseudoglessula fischeri, and Kempiochoncha stuhlmanni were negatively correlated with canopy cover and calcium content.
Archachatina ventricosa, Limicolaria flammea, Curvella feai, Gulella sp. 1, Saphtia lamtoensis, Pupigulella pupa, Curvella sp. 3, Gulella sp. 3, Rhachistia sp., Limicolaria sp. 1, and Curvella sp. 11 are located at the origin of the two axes, thus can be considered indifferent to calcium content, sand content, and canopy cover (Figure 7).
Environmental drivers of diversity indices: evidence from Multiple Regression Models
Multiple regression models revealed that several environmental variables significantly influenced the diversity indices (Table 4).
Results of multiple regression models examining the effects of environmental variables on diversity indices

(+) indicates a positive effect, (–) indicates a negative effect.
***P < 0.001, **P < 0.01, *P < 0.05.
For species richness, the model explained 60.1% of the variance (adjusted R² = 0.601, P = 0.001). Canopy cover had a highly significant positive effect, whereas temperature showed a significant negative effect. Litter and pH exhibited non-significant negative effects.
The Shannon index was explained by litter, calcium, and temperature, accounting for 33.5% of the variance (adjusted R² = 0.335, P = 0.023). Only litter showed a significant negative effect.
For evenness, the model explained 56.3% of the variance (adjusted R² = 0.563, P = 0.002). Canopy cover and litter had significant negative effects, whereas pH had a significant positive effect.
Human-driven changes in environmental variables structuring land snail communities
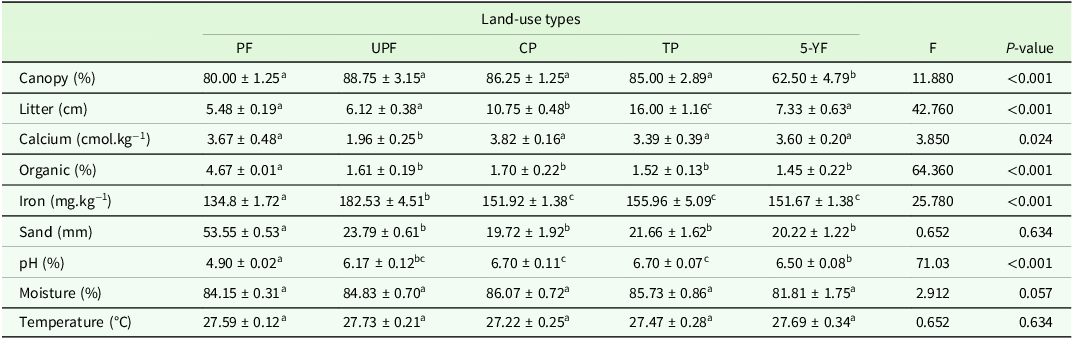
In total, 10 environmental variables—including canopy cover, litter depth, soil chemical properties (calcium, organic matter, iron, sand content, and pH), and microclimatic variables (moisture and temperature)—had a significant influence on the structure of snail communities (Table 5). The protected forest served as the reference condition for evaluating environmental alterations across the landscape. Canopy cover was significantly lower in the 5-year-old fallow (62.5 ± 4.79%) compared to all other land-use types, which showed similarly high values (80.0–88.8%). Litter depth increased markedly in cultivated land-use types, from 5.48 ± 0.19 cm in the protected forest to 10.75 ± 0.48 cm in the cocoa plantation and 16.00 ± 1.16 cm in the teak plantation. Soil chemical properties also shifted: organic matter declined sharply from 4.67 ± 0.01% in the protected forest to 1.45–1.70% in disturbed land-use types, while iron concentrations increased from 134.8 ± 1.72 mg·kg−1 to 151.7–182.5 cmol·kg−1. Soil pH rose from 4.90 ± 0.02 in the protected forest to 6.17–6.70 in anthropised land-use types. In contrast, soil moisture (81.8–86.1%) and temperature (27.2–27.7°C) did not differ significantly among land-use types, indicating that these microclimatic variables were relatively insensitive to land-use change (Table 5).
Changes in environmental variables influencing snail communities in protected and anthropised land-use types

Values are means ± standard error of canopy cover, litter depth, soil chemical properties (calcium, organic matter, iron, sand content, and pH), and microclimatic variables (moisture and temperature) across the five land-use types: PF = Protected forest; UPF = Unprotected forest; CP = Cocoa plantation; TP = Teak plantation; 5-YF = 5-year-old fallow.
Different letters (a, b, c) indicate significant differences among land-use types based on Tukey’s HSD post-hoc test (α = 0.05). Land-use types sharing the same letter are not statistically different.
Seasonal effects on the population dynamics of snails
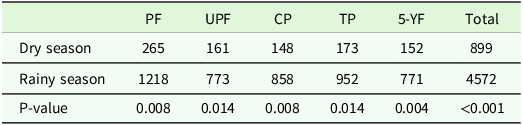
Table 6 shows the effect of seasons on the variation in snail abundance. Significant seasonal variation in snail abundance was observed across all five land-use types (Wilcoxon signed-rank test). Overall abundance increased from 899 individuals in the dry season to 4572 in the rainy season (W = 762, P < 0.001), with a similar trend observed within each individual land-use type (P < 0.05).
Seasonal variation in snail abundance across land-use types

PF = Protected forest; UPF = Unprotected forest; CP = Cocoa plantation; TP = Teak plantation; 5-YF = 5-year-old fallow.
The Friedman test indicated significant seasonal variation in snail abundance across months (χ² = 43.715, P < 0.001). Post-hoc Conover tests identified June as the month with the highest abundance and January as the month with the lowest, both significantly different from other months. This highlights notable temporal fluctuations in snail populations over the year.
Discussion
Our study provides clear evidence that land snail communities respond strongly to land-use change in tropical landscapes. Using a standardised effort of 240 samples per land-use type, we detected marked differences in diversity, abundance, and environmental filtering among habitats. Despite this substantial sampling effort, species accumulation curves did not reach asymptotes, indicating that some species remained undetected—a common outcome in tropical ecosystems characterised by cryptic or patchily distributed taxa (Colwell and Coddington Reference Colwell and Coddington1994; Gotelli and Colwell Reference Gotelli and Colwell2001). Nevertheless, sample coverage values of 76.49–87.66% fall within the range considered sufficient for robust ecological comparisons (Chao and Jost Reference Chao and Jost2012), confirming that our dataset adequately represents habitat-level patterns.
Snail abundance varied markedly among land-use types, peaking in the protected forest and declining sharply toward rural areas. This pattern highlights the central role of forest protection in maintaining favourable conditions for gastropod populations, notably through enhanced microclimatic stability, food availability, and reduced exposure to climatic stress and predation (Gheoca et al. Reference Gheoca, Benedek and Schneider2021, Reference Gheoca, Benedek and Schneider2023; Liu et al. Reference Liu, Feng and Yang2021; Rosin et al. Reference Rosin, Lesicki, Kwiecinski, Skorka and Tryjanowski2017). RDA identified canopy cover, soil calcium, and sand content as key drivers of abundance. Calcium is critical for shell formation and maintenance (Chen et al. Reference Chen, Yao, Zhang, Zhang, Qin and Guo2023), while moderately sandy, well-aerated soils facilitate movement, burrowing, and surface activity (Ansell and Trevallion Reference Ansell and Trevallion1969). However, excessively sandy soils reduce water retention (Andry et al. Reference Andry, Yamamoto, Irie, Moritani, Inoue and Fujiyama2009), limiting moisture availability—a fundamental constraint for terrestrial gastropods (Astor et al. Reference Astor, von Proschwitz, Strengbom, Berg and Bengtsson2017). Canopy cover further regulates ground-level temperature, humidity, and light, thereby shaping microhabitats essential for snail persistence (Wang et al. Reference Wang, Cai, Deng, Li, Dong, Zhou, Sun, Li, Song, Zhang and Zhou2023). The degradation of these conditions in rural areas likely explains the sharp decline in abundance beyond protected forest boundaries.
In spite of contrasting abundances, both forests and cocoa plantations maintained high and comparable species richness. This pattern suggests that certain managed systems, particularly agroforestry plantations, can retain a substantial fraction of forest-associated snail diversity when key structural attributes—such as canopy cover—are preserved (De Beenhouwer et al. Reference De Beenhouwer, Aerts and Honnay2013). Conversely, the low richness observed in fallow areas reflects early-successional habitat simplification, where reduced structural heterogeneity limits niche availability and constrains community assembly (Gheoca et al. Reference Gheoca, Benedek and Schneider2023). Multiple regression models confirmed canopy cover as the primary driver of species richness, underscoring the importance of shaded, humid, and thermally buffered microhabitats in reducing desiccation stress and promoting gastropod coexistence.
Although Shannon diversity remained relatively stable across land-use types, significant differences in evenness revealed shifts in dominance structure rather than species number. Forests and plantations were characterised by a few highly abundant species, whereas fallow habitats supported more evenly distributed assemblages dominated by disturbance-tolerant taxa. This pattern aligns with the idea that moderate disturbance can reduce competitive dominance and favour tolerant species without necessarily increasing richness (Seidl et al. Reference Seidl, Müller, Wohlgemuth, Wohlgemuth, Jentsch and Seidl2022). Environmental models further indicated that litter depth negatively affected both Shannon diversity and evenness, suggesting that thick litter layers—particularly in plantations—act as physical and microclimatic filters that restrict mobility and habitat accessibility, favouring only a subset of tolerant species (Bardgett and van der Putten Reference Bardgett and van der Putten2014; Dimitrakopoulos Reference Dimitrakopoulos2010). In contrast, the positive effect of soil pH on evenness suggests that slightly more alkaline conditions enhance nutrient availability and habitat quality, promoting more balanced species distributions (Barrow and Hartemink Reference Barrow and Hartemink2023).
Community composition broadly clustered according to habitat integrity, with forests forming a distinct group from plantations and fallow areas. Although ANOSIM results were not statistically significant, this likely reflects the persistence of generalist species across land-use types, resulting in moderate compositional differentiation driven primarily by changes in relative abundances rather than complete species turnover. Such patterns are common along tropical land-use gradients, where environmental filtering reshapes dominance structure without fully excluding tolerant taxa (Sousa et al. Reference Sousa, Bomfim, Franco, Cunha, Bastos, Costa, Cardoso and Michelan2024; Wang et al. Reference Wang, Ji, Zhao, Guo, Ji, Zhang, Yang, Wang and Wang2024).
Species–habitat associations further reinforced these patterns. The protected forest supported the highest number of indicator species, including Achatina achatina, Teleozonites adansoniae, and Gulella spp., which are strongly dependent on stable, humid microclimates and decomposing organic matter (Oke and Alohan Reference Oke and Alohan2006; Tattersfield et al. Reference Tattersfield, Seddon and Lange2001). Their indicator status reflects the maintenance of key forest attributes identified by the RDA, particularly high canopy cover and organic matter accumulation. In contrast, species associated with the unprotected forest and the cocoa plantation—such as Achatina fulica, Pseudoglessula fischeri, and Striosubulina striatella—are known for their ecological plasticity and tolerance to habitat disturbance, consistent with their association with soils low in organic matter typical of managed or disturbed environments (Lal Reference Lal2004; Raut and Barker Reference Raut, Barker and Barker2002; Rowson et al. Reference Rowson, Warren and Ngereza2010). The teak plantation hosted a limited set of moderately indicative species, reflecting intermediate conditions where litter accumulation provides shelter despite reduced microclimatic stability. The fallow was characterised by a single indicator species, Quickia concisa, adapted to open, high-light environments and early successional herbaceous litter.
Seasonality exerted a strong influence on snail abundance, with markedly higher densities during the rainy season. This reflects the fundamental dependence of terrestrial gastropods on moisture availability, which enhances activity, feeding, reproduction, and juvenile survival (Barker Reference Barker and Barker2001; Solem Reference Solem, Solem and van Bruggen1984). Increased rainfall and humidity reduce water-loss constraints, allowing snails to exploit a wider range of microhabitats (Cook Reference Cook and Barker2001; Denny Reference Denny1988), whereas dry-season conditions induce aestivation and refuge use, lowering detectability and apparent densities (Riddle Reference Riddle and Russell-Hunter1983). Enhanced litter decomposition and cooler, more stable microclimates during the rainy season further increase food availability and shelter, supporting higher population densities (Barker and Efford Reference Barker, Efford and Barker2004; Kagata and Ohgushi Reference Kagata and Ohgushi2013).
Taken together, our results highlight a clear conceptual pattern: land-use change restructures snail communities primarily through environmental filtering that alters microclimatic stability, soil properties, and habitat structure. While protected forests maximise abundance and support habitat-specialist species, agroforestry systems can conserve substantial diversity when canopy cover and litter resources are maintained. These findings underscore the conservation value of structurally complex agricultural landscapes and emphasise the importance of preserving key habitat attributes beyond protected areas.
Despite these insights, some limitations must be acknowledged. Taxonomic resolution was constrained by incomplete species-level identification for some specimens, potentially affecting richness and compositional estimates. Integrating molecular approaches such as DNA barcoding would help resolve taxonomic uncertainties (Fontaine et al. Reference Fontaine, van Achterberg, Alonso-Zarazaga, Araujo, Asche, Aspöck, Aspöck, Audisio, Aukema, Bailly, Balsamo, Bank, Belfiore, Bogdanowicz, Boxshall, Burckhardt, Chylarecki, Deharveng, Dubois, Enghoff, Fochetti, Fontaine, Gargominy, Lopez, Goujet, Harvey, Heller, van Helsdingen, Hoch, Jong, Karsholt, Los, Magowski, Massard, McInnes, Mendes, Mey, Michelsen, Minelli, Nafrıa, van Nieukerken, Pape, Prins, Ramos, Ricci, Roselaar, Rota, Segers, Timm, van Tol and Bouchet2012; Jörger et al. Reference Jörger, Norenburg, Wilson and Schrödl2013). Additionally, the 12-month sampling period may not fully capture interannual climatic variability known to influence gastropod populations (Nicolai and Ansart Reference Nicolai and Ansart2017). Long-term monitoring would therefore provide a more comprehensive understanding of temporal dynamics and improve predictions of land-use impacts under changing climatic conditions.
Conclusion
This study explored the impact of different land-use types on the diversity and abundance of land snails. It revealed that snail species richness was high and similar in the protected forest, unprotected forest, and cocoa plantation, but dropped drastically in the 5-year-old fallow. Species diversity and species composition did not differ significantly across land-use types. In contrast, snail abundance was significantly higher in protected forests compared to rural habitats, highlighting the importance of protected areas for the conservation of these species.
These results do not support our first hypothesis, which stated that different land-use types would influence variations in land snail abundance and diversity, with undisturbed or less disturbed habitats supporting higher abundance and diversity than disturbed ones.
Of the 53 species collected, 18 were habitat indicators, which supports our second hypothesis that certain land snail species would show an association with specific land-use types. Snail abundance was significantly influenced by canopy cover, soil calcium, and sand content, and varied with season, peaking during the rainy season and reaching its lowest levels in the dry season. Diversity indices were mainly determined by canopy cover and litter depth. These outcomes support the validity of our third hypothesis, which predicted that variations in land snail abundance and diversity would be linked to environmental variables, with seasonality amplifying its effect on abundance patterns. However, these findings on seasonality could be more robust if the study had been conducted over a longer period. Also, we are aware of the difficulties involved in identifying all snails down to the species level.
For better management of land snail biodiversity in this area, we suggest that local communities adopt practices such as agroforestry in plantations to maintain diverse vegetation structures and phytoremediation in fallows, for example, by using plants like Chromolaena odorata to restore soil quality and enhance snail habitats. These approaches could help preserve biodiversity while supporting local livelihoods. These results underscore the importance of habitat management for the conservation of land snails.
Acknowledgements
We thank Kouakou Pierre Claver Kouassi, Gnahoré Eric, and Adjoumani Kobenan Ange Pierre for their technical assistance during the fieldwork. We thank Dr Ton de Winter for his help during the identification of snail’s species.
Financial support
This research received no specific grant from any funding agency, commercial or not-for-profit sectors.
Competing interests
The authors declare none.



 Open access

