

1. INTRODUCTION
The motivation for this work was stimulated by the inertial confinement fusion (ICF)-relevant experiments on heavy ion stopping in ionized matter. These experiments, which used a unique combination of a powerful laser and a heavy ion linear accelerator (Hoffmann et al., Reference Hoffmann, Blazevic, Ni, Rosmej, Roth, Tahir, Tauschwitz, Udrea, Varentsov, Weyrich and Maron2005), have been carried out at the Gesellschaft fur Schwerionenforschung (GSI; Roth et al., Reference Roth, Stöckl, Süß, Iwase, Gericke, Bock, Hoffmann, Geissel and Seelig2000). Due to the effective ion energy loss on free electrons, one expects up to two-times higher heavy ion energy deposition in a plasma target compared with a cold target of the same areal density. Ion stopping in partially ionized plasmas depends on the fraction of free electrons, which is defined by the plasma ionization degree. Therefore for the correct interpretation of the ion energy loss measurements in plasma (Rosmej et al., Reference Rosmej, More, Rosmej, Wieser, Borisenko, Shevelko, Geissel, Blazevic, Jacoby, Dewald, Roth, Brambrink, Weyrich, Hoffmann, Golubev, Turtikov, Fertman, Sharkov, Faenov, Pikuz, Magunov and Skobelev2002), the plasma ionization degree in the heavy-ion beam (HIB)–plasma interaction region has to be as homogeneous as possible. Due to a mm-large diameter of the HIB, the size of the interaction region with the demanded homogeneous distribution of plasma ionization degree should be about 1 mm. In order to obtain a 1 mm large homogeneous laser energy distribution on a target surface one can use a phase plate or place a target behind the lens focus plane and irradiate the target with an annular shape of the laser beam. In this work it is shown, that rather homogeneous mm-size distribution of the plasma ionization degree can be achieved by irradiation of the target by the annular shape of the laser radial distribution.
Another application of the annular laser pulses is the laser-driven acceleration of protons from thin foils irradiated by hollow high-intensity laser beams in the regime of target normal sheath acceleration (TNSA) (Brabetz et al., Reference Brabetz, Busold, Cowan, Deppert, Jahn, Kester, Roth, Schumacher and Bagnoud2015). In this case, the use of annular beams aims at reducing the initial emission solid angle of the TNSA source (Brambrink et al., Reference Brambrink, Roth, Blazevic and Schlegel2006; Yu et al., Reference Yu, Jin, Zhou, Zhang, Zhao, Cao, Li, Gu, Zhan and Najmudin2013), due to a flattening of the electron sheath at the target rear side.
We have developed the Hydro ELectro IOnization 2D (HELIO2D) dynamics code that is used to describe the interaction of powerful laser radiation with solid targets. The self-consistent physical model describes the laser energy absorption, electron-ion energy coupling, kinetics of ionization and recombination, electron heat conductivity together with plasma dynamics. As opposed to the Radiative Arbitrary Lagrangian-Eulerian Fluid dynamics in two Dimensions (RALEF-2D) code (Ortner et al., Reference Ortner, Faik, Schumacher, Basko, Blazevic, Busold, Bedacht, Cayzac, Frank, Kraus, Rienecker, Schaumann, Tauschwitz, Wagner and Roth2015), the laser absorption is described using the wave equation for the laser pulse electric field. The system of hydrodynamic equations is solved using the high-order Godunov scheme in Eulerian coordinates in two-dimensional (2D) cylindrical geometry. The experiments on heating of Mg targets irradiated by the Nanosecond High Energy Laser for heavy Ion eXperiments (NHELIX) laser are simulated using the HELIO2D code describing the non-equilibrium heating of a target from the solid state to hot plasma. A good agreement obtained between the plasma parameters determined experimentally by spectroscopic measurements and the results of plasma dynamics modeling indicate the importance of correct description of underlying physical processes and target properties in a wide range of parameters.
2. MODEL
2.1. Basic Equation
We describe the processes of laser–matter interaction with the aid of a system of 2D hydrodynamic equations in cylindrical geometry. Previously, we developed and used for modeling of laser–matter interaction a wide-range 1D hydrodynamic model (Andreev et al., Reference Andreev, Veysman, Efremov and Fortov2003; Veysman et al., Reference Veysman, Cros, Andreev and Maynard2006; Reference Veysman, Agranat, Andreev, Ashitkov, Fortov, Khishchenko, Kostenko, Levashov, Ovchinnikov and Sitnikov2008; Agranat et al., Reference Agranat, Andreev, Ashitkov, Veysman, Levashov, Ovchinnikov, Sitnikov, Fortov and Khishchenko2007; Povarnitsyn et al., Reference Povarnitsyn, Andreev, Levashov, Khishchenko, Kim, Novikov and Rosmej2013; Reference Povarnitsyn, Andreev, Apfelbaum, Itina, Khishchenko, Kostenko, Levashov and Veysman2012a; Reference Povarnitsyn, Andreev, Levashov, Khishchenko and Rosmej2012b). Processes, considered in this paper are essentially multi-dimensional and our present approach is based on the 2D hydrodynamics completed with wide-range models of laser energy absorption, ionization, and radiation losses in plasma and electron–ion coupling (Povarnitsyn et al., Reference Povarnitsyn, Andreev, Apfelbaum, Itina, Khishchenko, Kostenko, Levashov and Veysman2012a; Reference Povarnitsyn, Andreev, Levashov, Khishchenko and Rosmej2012b; Reference Povarnitsyn, Andreev, Levashov, Khishchenko, Kim, Novikov and Rosmej2013). Basic equations of the model can be written as follows:
 $$\displaystyle{{\partial {\rm \rho}} \over {\partial t}} + \nabla ({\rm \rho} {\bf V}) = 0,$$
 $$\displaystyle{{\partial ({\rm \rho} {V_z})} \over {\partial t}} + \displaystyle{{\partial ({\rm \rho} V_z^2 + {P_\Sigma} )} \over {\partial z}} + \displaystyle{1 \over r}\displaystyle{{\partial (r{\rm \rho} {V_z}{V_z})} \over {\partial r}} = {F_z},$$
 $$\displaystyle{{\partial ({\rm \rho} {V_r})} \over {\partial t}} + \displaystyle{1 \over r}\displaystyle{{\partial (r{\rm \rho} V_r^2 )} \over {\partial r}} + \displaystyle{{\partial {P_\Sigma}} \over {\partial r}} + \displaystyle{{\partial ({\rm \rho} {V_z}{V_r})} \over {\partial z}} = {F_r},$$
 $$\eqalign{&\displaystyle{{\partial ({\rm \rho} {e_{\rm e}})} \over {\partial t}} + \nabla ({\rm \rho} {\bf V}{e_{\rm e}} + {\bf V}{P_{\rm e}}) \cr & \quad= - \nabla {{\bf q}_T} + {Q_L} - {Q_{{\rm ei}}} - {Q_{{\rm rad}}} - {Q_I} + {\bf V}\nabla {P_{\rm e}} + {\bf VF},} $$
 $$\displaystyle{{\partial ({\rm \rho} {e_{\rm i}})} \over {\partial t}} + \nabla ({\rm \rho} {\bf V}{e_{\rm i}} + {\bf V}{P_{\rm i}}) = {Q_{{\rm ei}}} + {\bf V}\nabla {P_{\rm i}},$$
 $$\displaystyle{{\partial Z} \over {\partial t}} + {\bf V}\nabla Z = \displaystyle{\Theta \over {{N_{\rm i}}}}.$$
Here ρ is the density, z is the direction of a laser pulse propagation, which is perpendicular to the target surface, and r is the transverse coordinate; V = (V z, Vr) is the velocity of plasma; P Σ = P e + P i is the total pressure with electronic P e and ionic P i parts; F = (F z, Fr) is the ponderomotive force; Q L is the density of inverse bremsstrahlung absorption rate; Q ei is the electron–ion coupling term; Z = N e/N i is the average charge of ions with the concentration of free electrons and ions being N e and N i, respectively; Θ is the total rate of thermal ionization; m i is the mass of heavy particles. The electron thermal flux is
 $${{\bf q}_T} = - {{\rm \kappa} _{\rm e}}{T_{\rm e}}\nabla {T_{\rm e}},$$
where κe is the electron thermal conductivity coefficient; the density of inverse bremsstrahlung laser energy absorption rate is
 $${Q_L} = {(8{\rm \pi} )^{ - 1}}{\rm \omega _0}{\rm Im}\{ {\rm \varepsilon} \} \left \vert{\bf E}\right \vert{^2},$$
where ω0 is the laser frequency, E is the amplitude of the laser electric field and ε is the complex permittivity of matter. The electron–ion coupling rate is
 $${Q_{{\rm ei}}} = {\rm \gamma _{{\rm ei}}}({T_{\rm e}} - {T_{\rm i}}),$$
where γei is the electron–ion coupling coefficient. The radiation losses due to the bremsstrahlung thermal radiation is
 $${Q_{{\rm rad}}} = 4{e^2}{\left( {\sqrt 3 \hbar c} \right)^{ - 1}}Z{N_{\rm a}}{{\rm \nu} _{{\rm ef}}}T_{\rm e}^2 /(m{c^2}),$$
where νef is the effective frequency of electron–ion collisions, m is the mass of electron and c is the light speed in vacuum. The density of power absorbed due to the thermal ionization (or emitted due to the recombination) is
 $${Q_Z} = {N_{\rm a}}\left[ {\displaystyle{\partial \over {\partial t}} + {\bf V}\nabla} \right]{{\rm \frak E}_{\rm I}},\quad {{\rm \frak E}_{\rm I}} = \sum\limits_{q = 1}^{{z_n}} {\displaystyle{{{N_q}} \over {{N_{\rm a}}}}} \sum\limits_{k = 1}^q {{U_k}}, $$
where U q is the potential of q-fold ionization, N q is the concentration of ions with charge q, z n is the charge of nucleus (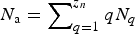 ${N_{\rm a}} = \sum\nolimits_{q = 1}^{{z_n}} {q{N_q}} $).
Wide-range coefficients of transport and optical properties κe, ε, γei, and νef as well as two-temperature equations of state in the form e e(ρ, T e), e i(ρ, T i), P e(ρ, T e), and P i(ρ, T i) are calculated according to the models described elsewhere (Andreev et al., Reference Andreev, Veysman, Efremov and Fortov2003; Agranat et al., Reference Agranat, Andreev, Ashitkov, Veysman, Levashov, Ovchinnikov, Sitnikov, Fortov and Khishchenko2007; Veysman et al., Reference Veysman, Cros, Andreev and Maynard2006; Reference Veysman, Agranat, Andreev, Ashitkov, Fortov, Khishchenko, Kostenko, Levashov, Ovchinnikov and Sitnikov2008; Povarnitsyn et al., Reference Povarnitsyn, Andreev, Levashov, Khishchenko and Rosmej2012b; Reference Povarnitsyn, Andreev, Levashov, Khishchenko, Kim, Novikov and Rosmej2013; Khishchenko, Reference Khishchenko2004; Reference Khishchenko2008)
2.2. Model of Ionization
Taking into account only collisional ionization and recombination and using the approximation of average ion, one can write the following expressions for the total rate of thermal ionization Θ, the density of power Q Z, and the energy  ${{\rm {\frak E}}_{\rm I}}$ spent for thermal ionization, similar to that used in (Andreev et al., Reference Andreev, Beigman, Kostin, Veisman and Urnov1998; Reference Andreev, Veysman, Efremov and Fortov2003):
 $$\Theta = ZN_{\rm a}^2 {\rm \kappa} (Z)[1 - Z/{Z_{{\rm eq}}}],$$
 $${\rm \kappa} (Z) \approx 6 \times {10^{ - 8}}{{\rm \xi} _Z}{e^{ - {U_Z}/{T_e}}}\left( {\displaystyle{{{U_{\rm H}}} \over {{U_Z}}}} \right){\left( {\displaystyle{{{U_{\rm H}}} \over {{T_{\rm e}}}}} \right)^{1/2}}{\rm \phi} \left( {\displaystyle{{{U_Z}} \over {{T_{\rm e}}}}} \right),$$
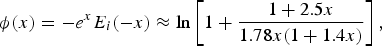 $${\rm \phi} (x) = - {e^x}{E_i}( - x) \approx \ln \left[ {1 + \displaystyle{{1 + 2.5x} \over {1.78x(1 + 1.4x)}}} \right],$
where Z eq = Z eq(N a, T e) is the equilibrium average ion charge at given temperature and density of plasma, determined according to More (More, Reference More1982) quasi-stationary formula; the factor 6 × 10⁻⁸ in the formula (12) has dimension cm3/s; ξZ is the number of electrons at the ionizing shell, 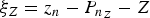 ${{\rm \xi} _Z} = {z_{n}} - {P_{n_{Z}}} - Z$, where n Z is the principal quantum number of the ionizing shell, P n = 2, 10, 18, … for n = 1, 2, 3, … is the number of electrons in the closed electronic shells; U H is the potential of ionization of hydrogen;
 $$\eqalign{{U_Z} &= {U_{[Z + 1]}} {\rm \Delta} Z + {U_{[Z]}}(1 - {\rm \Delta} Z),\quad \Delta Z = Z - [Z];\cr & {U_0} \equiv 0,}$$
where [Z] denotes the integer part of Z;
 $${\rm \frak E}_{\rm I} = {\Sigma _U}(Z) - {\Sigma _U}(Z_{\rm ini}),\quad {\Sigma _U}(Z) = \int_0^Z {U_Z} (Z)dZ,$$
where Z ini = Z eq(t = 0) is the initial average charge of ions at a given point, dependent on the initial density ϱ(t = 0) = N a(t = 0)m a and initial (room or zero) temperature T e(t = 0) at this point.
With the account of formula (14) for U Z one can obtain the following expression for ΣU:
 $$\eqalign{{\Sigma _U} = & Z{U_1},\quad Z < 1; \cr {\Sigma _U} = & Z{U_1} + {(Z - 1)^2}({U_2} - {U_1})/2,\quad Z \in [1;2], \cr {\Sigma _U} = & \displaystyle{{{U_1}} \over 2} + \sum\limits_{k = 1}^{n - 1} {{U_{\rm k}}} + \left( {Z - n + \displaystyle{1 \over 2}} \right){U_n} \cr & + {(Z - n)^2}\displaystyle{{{U_{n + 1}} - {U_n}} \over 2},\quad Z \in [n;n + 1],\quad n = [Z] \ge 2} $$
The formula (11) for the density of power of ionization expenses Q I (or emission of energy in the case of recombination) in the considered case of average ion model should be rewritten as
 $$\matrix{ {{Q_{\rm I}} = \Theta {U_Z} - {N_{\rm a}}{\rm div}U \displaystyle{\partial \over {\partial {N_{\rm a}}}}[{\Sigma _U}(Z) - {\Sigma _U}({Z_{{\rm min}}})],} \hfill \cr} $$
where Θ is defined by (12), the potential of ionization U Z is defined by (14), and derivatives ∂ΣU/∂N a are determined by (16) with the values U n replaced by the values ∂U n/∂N a.
2.3. Wave Equation for the Electric Field Strength and Equation of State
To calculate the inverse bremsstrahlung absorption rate (8) one should calculate the module of electric field strength |E|. In the considered case of normally incident linearly polarized laser pulse with the transverse radius much above its wavelength the distribution of the module of electric field E in space and time can be found by means of the 2D wave equation
 $$[\partial _z^2 + {\Delta _r} + {\rm \varepsilon ]}E = 0,$$
which is solved in the domain z∈[d, D] and r∈[0, R], ε(z < d) = 1, ε(z > D) = const, R ≫ R w, where R w is the laser pulse waist. Boundary conditions on z are:
 $${\rm \varepsilon} {\left. {\displaystyle{{\partial E} \over {\partial z}}} \right\vert_{z = D}} = - \left( {{\rm \varepsilon} + \displaystyle{{{\Delta _r}} \over 2}} \right)\left[ { - i\sqrt {\rm \varepsilon} E{\vert_{z = D}}} \right],$$
 $${\rm \varepsilon} {\left. {\displaystyle{{\partial E} \over {\partial z}}} \right\vert_{z = d}} = - \left( {{\rm \varepsilon} + \displaystyle{{{\Delta _r}} \over 2}} \right)\left[ {2{F_{\vert\vert}}{F_ \bot} + iE{\vert_{z = d}}} \right],$$
where F || = F ||(t) is the longitudinal envelope, F ⊥ = F ⊥(r, z = d) is the transverse envelope of the pulse at z = d. Boundary conditions on r are:
 $${\left. {\displaystyle{{\partial E} \over {\partial r}}} \right\vert_{r = 0}} = 0,\quad E{\vert_{r = R}} = 0.$$
For closure of the system (1)–(5) by relations of the form P e(ρ, T e), P i(ρ, T i), e e(ρ, T e), e i(ρ, T i) we use the semiempirical two-temperature equation of state (EOS) for Mg (Agranat et al., Reference Agranat, Andreev, Ashitkov, Veysman, Levashov, Ovchinnikov, Sitnikov, Fortov and Khishchenko2007; Khishchenko, Reference Khishchenko2004; Reference Khishchenko2008).
The EOS is constructed so that the total free energy has a form ℱ(ρ, T i, T e) = ℱi(ρ, T i) + ℱe(ρ, T e), composed of two parts. The first item ℱi(ρ, T i) = ℱc(ρ) + ℱa(ρ, T i), in turn, consists of electron–ion interaction term ℱc (calculated at T i = T e = 0 K) and contribution of thermal motion of ions ℱa. The second term ℱe(ρ, T e) is the thermal contribution of electrons described by the ideal Fermi-gas model.
3. EXPERIMENTAL SET UP
Experiments were carried out at the NHELIX laser system at GSI in Darmstadt, Germany. NHELIX is a standard Nd: glass/Nd: YAG laser with λlas = 1.06 μm (Schaumann et al., Reference Schaumann, Schollmeier, Rodriguez-Prieto, Blazevic, Brambrink, Geissel, Korostiy, Pirzadeh, Roth, Rosmej, Faenov, Pikuz, Tsigutkin, Maron, Tahir and Hoffmann2005), which consists of oscillator, preamplifier, and six Nd: glass amplifiers (the length amplifier rod varies from 16 up to 64 mm). The oscillator is equipped with two etalons selecting and operating the 1064 nm wavelength and the Q-switch built of a polarizer and Pockels cell. The oscillator delivers a laser pulse with energy 15 mJ and duration of 15 ns. The pulse is amplified to the maximum energy of 100 J after 64 mm amplifier giving the peak power about 7 GW. The laser beam is transported to the target chamber by the kinked 10 m tube system and focused inside the target chamber. As the typical future experiments in the Z6 area deal with the interaction of HIBs with laser produced plasmas, the mirror and the focusing lens in the target chamber have 7 and 5 mm holes, which open the target for the ion beam collinearly with the laser beam. The laser focal spot should be larger than the ion beam diameter (0.1–3) mm2 that leads to laser intensity on the surface of a flat target in the range (0.2–6) × 1012 W/cm2.
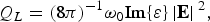
The present experiment was performed with the laser energy of 36 J. The laser radiation is focused with a plane-convex lens (diameter 100 mm, focal length f = 130 mm) on the Mg target surface in the ring spot (see Fig. 1). A study of the laser intensity distribution has shown that there are no hot spots inside the focal ring. Meanwhile, the holes in the mirror and focusing lens affect the laser radiation flux density at the center of the focusing area decreasing the intensity to the value about 2 × 10¹¹ W/cm2. The soft X-ray line radiation from the plasma in the direction normal to the target surface was studied with the spherically bent mica crystal spectrograph (Faenov et al., Reference Faenov, Pikuz, Erko, Bryunetkin, Dyakin, Ivanenkov, Mingaleev, Pikuz, Romanova and Shelkovenko1994; Skobelev et al., Reference Skobelev, Faenov, Bryunetkin, Dyakin, Pikuz, Pikuz and Shelkovenko1995). The curvature radius of a crystal was 150 mm. The spectrograph was installed in the focusing spectrometer with spatial resolution 2D (FSSR-2D) scheme to cover the spectral range 0.74–0.79 nm at the second reflection order of the mica crystal with the demagnification of 2.4. The spectral resolution was λ/δλ ≈ 4000. The X-ray emission spectra were recorded by the charge-coupled device (CCD) (20 μm pixel size) allowing 1D spatial resolution δ ≈ 50 μm along the direction parallel to the target surface. Thus, the size of plasma X-ray emission zone in the surface plane is measured.

Fig. 1. Image of the laser focal spot (a) on a target surface and the intensity traces along (b) and transverse (c) the incidence plane.
The spatial distribution of the X-ray emission in the plane x–z perpendicular to the target surface was studied in these experiments using the 15 μm pinhole camera with the magnification of about 2. X-ray pinhole images were recorded on the direct exposure film (DEF) protected from visible and ultraviolet radiation by a filter that contained two layers of 1 μm polypropylene coated from both sides by 0.1 μm of Al (energy cut off is about 400 eV). The same filter was used for the protection the CCD detector.
4. EXPERIMENTAL DATA
The X-ray pinhole image of Mg-plasma is shown in Figure 2. The full width at half maximum size of emission zone in the target plane (x-axis direction) is rather big (≈1.4 mm). One can clearly see two peaks in the intensity distribution in Figure 2b, which correspond to two parts of the focal spot ring shown in Figure 1. The plasma expansion region in the z-axis direction with intense X-ray emission [Fig. 2c] also has the size of about the same value. It means that a large-scale plasma is produced in the experiment even with rather small laser pulse energy.

Fig. 2. The pinhole image of expanding laser produced plasma of Mg – (a). film density traces along – (b) and transverse – (c) the target surface.
Figure 3 shows the 1D spatially resolved spectra of Mg-plasma in the spectral region of the 1s3p 1P1–1s2 1S0 (Heβ) and 1s4p 1P1–1s2 1S0 (Heγ) lines of Mg XI ion obtained by the FSSR spectrometer in a single laser shot. The spatial resolution was in the direction perpendicular to the laser beam incidence plane (y-axis direction). The spatial distribution of the Heβ and Heγ line intensity are shown in Figures 3b and 3c, respectively. The visible size of emission zone for the Heβ and Heγ lines is smaller compared with the pinhole image size in Figure 2. An evident reason is due to lower 400 eV cut off photon energy of the pinhole image. The Heβ and Heγ photon energy is much higher (around 1.8 keV). Thus, the spectral image size about 0.9 mm corresponds to the internal plasma area of the pinhole image with higher electron temperature.

Fig. 3. (a) – experimental data for the X-ray emission spectra in the region of the Heβ and Heγ lines of Mg XI (circles) and the results of model calculations (solid curve). Spatial dependence of the Heβ – (b) and Heγ – (c) line intensities in the direction parallel to the target surface plane.
5. MODELING OF THE Heβ AND Heγ LINES IN Mg-PLASMA
The parameters of Mg-plasma produced by the ns laser pulse from the solid target are estimated using the modeling of the Heβ and Heγ line shape and intensities and the intensity of the dielectronic satellites of the latter line formed by the 4p → 1s transitions from the autoionizing states in the Li-like Mg-ion (Magunov et al., Reference Magunov, Faenov, Skobelev, Pikuz, Dobosz, Schmidt, Perdrix, Meynadier, Gobert, Normand, Stenz, Bagnoud, Blasco, Roche, Salin and Sharkov2003; Faenov et al., Reference Faenov, Magunov, Pikuz, Skobelev, Gasilov, Stagira, Calegari, Nisoli, de Silvestri, Poletto, Villoresi and Andreev2007). The results of modeling are compared with the measurements in Figure 3a.
It should be noted, that the observed width of the lines relates to the instrumental resolution indicated above. Its value corresponds to the effective ion temperature T i = 600 eV, that can be considered as the maximum estimation for the expanding plasma velocity. It agrees with an independent estimation from the experimentally observed plasma size in the z-axis direction and the laser pulse duration: νi ~ z/τL ≈ 0.05/(15 × 10−9) = 3.3 × 106 cm/s.
The electron density Ne could be obtained from the modeling of the Heγ line wings formed due to the Stark broadening in the quasi static electric microfield in plasma. Generally the central part of the line is determined by the Doppler broadening in expanding plasma (instrumental line width in our case). It is dominant for the transition n → 1 with low principal quantum number n, such as the Heβ line. The collisional and radiation widths can be neglected and the line profile is described by the following formula
 $$\matrix{ {{I_n}({\rm \lambda} ) \propto {{\rm \lambda} ^{ - 1}}\sum\limits_{\rm \alpha} {\int {\left\{ {W(F,{F_0}){A_{{\rm \alpha} 1}}(F)} \right.}}} \hfill \cr {\left. {{D_{{T_i}}}\left[ {({\rm \lambda} - {{\rm \lambda} _{{\rm \alpha} 1}}(F))/{{\rm \lambda} _{n1}}c)} \right]} \right\}dF,} \hfill \cr} $$
where A α1(F) and λα1(F) are the transition probability and the wavelength of the Stark line component α at the field strength F, respectively, W(F, F 0) is the microfield distribution function for the average field F 0 = 2.6Ze(N e/Z)2/3, where  ${D_{{T_i}}}({\rm \nu} ) = \exp ( - {{\rm \nu} ^2}/{\rm \nu} _i^2 )/({{\rm \pi} ^{1/2}}{{\rm \nu} _i})$ is the Maxwell ion velocity distribution function at the temperature ${T_i} = M{\rm \nu} _i^2 /2$. In the present calculations we consider the linear Stark approximation for the wavelength shift λα1 − λn1 = c αF.
The present modeling of the Heγ line shape is shown in Figure 4b. It is clearly seen that the wings of Heγ line are very weak and only the maximum level of electron density could be estimated. Such an estimation gives the electron density value N e = 1.5 × 1020 cm−3. At this density value the optical depth of the Heγ line followed from the level kinetics calculation is small even at plasma size 0.2 mm (τ4 = 0.4). Corresponding optical depth of the Heβ line is τ3 = 1.3. The level kinetic calculations give low dependence of the Heβ and Heγ line intensity ratio on the electron temperature at the selected density value. The electron temperature value T e = 240 eV used in the kinetic calculations was obtained from the experimental intensity ratio of the Heγ line and the strongest dielectronic satellites fitted by the theoretical dependence and discussed below. The stationary ionization distribution in the optically thin Mg-plasma of 240 eV and 1020 cm−3 electron density results in the ratio of H- to He-like Mg-ion fraction N H/N He = 0.017. The ratio N H/N He = 0.2, required for the description of measured spectra, is reached at the same electron temperature and density if the optical thickness of 1 mm Mg-plasma layer is taken into account. The increase of the plasma ionization degree at the same electron temperature in optically thick plasmas can be explained by the rise of the population of the ion excited states compared with the optically thin case. This can magnify up to two-times the total ion ionization rate, defined as an integral over the expected input of the bound electrons ground and excited states. In He- and H-like ions, the electron binding energy of the ground state with the principal quantum number n = 1 is at least four-times larger than those of excited states (n = 2, 3…). The exponential dependence of the collisional ionization rates on the electron binding energy leads to a strong influence of the population of the bound electron excited states on the total ionization rate. The consequence of this is higher ion mean charge in optically thick plasmas, compared with the optically thin case. It is due to competition between the recombination and excitation population channels of the level 1s4p 1P1 that follows from kinetic calculations (Fig. 5). The intensity of Heβ does not change significantly, since the excitation channel dominates for the 1s3p 1P1 level population. The optical line depth produces additional line broadening and intensity damping that was accounted for in the uniform slab approximation.

Fig. 4. Spectral line shape of the Heβ – (a) and Heγ – (b) lines in Mg XI. Experimental data are shown by circles. Calculations according to (22) at N e = 1.5 × 1020 cm−3, T e = 240 eV and with instrumental width, corresponding to the upper limit of T i = 600 eV, are normalized to the Heγ peak intensity. Dashed curve is obtained with stationary state populations. Solid curve corresponds to the population ratio of H-like and He-like ions 0.2 (0.017 is the stationary value).

Fig. 5. Electron temperature dependence of the recombination to excitation population channels calculated in the stationary collision-radiation model at the electron density N e = 1.5 × 1020 cm−3 for the 1s3p 1P1 level (curve labeled by triangles) and the 1s4p 1P1 level (curve labeled by squares).
The intensity ratio of the Heγ line and the strongest dielectronic satellites is defined as follows
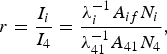 $$r = \displaystyle{{{I_i}} \over {{I_4}}} = \displaystyle{{{\rm \lambda} _i^{ - 1} {A_{if}}{N_i}} \over {{\rm \lambda} _{41}^{ - 1} {A_{41}}{N_4}}},$$
where A if is the i → f transition rate, N i is the level population density.
From the collisional-radiative model (CR-model) calculations the 1s4p 1P1 level population is
 $${N_4} = {\rm \beta _4}{N_{\rm e}}{N_{\rm H}} + {s_4}{N_1},$$
where β4(N e, T e) and s 4(N e, T e) are the recombination and excitation population coefficients, respectively, N H is the H-like ion ground state population.
The population density of corresponding autoionizing state i is defined by
 $${N_{\rm i}} \approx \displaystyle{{{C_{\rm i}}{N_{\rm e}}} \over {{A_i} + {\Gamma _{\rm i}}}}{N_1},\quad {A_i} = \sum\limits_{m < i} {{A_{im}}}. $$
The values of collisional relaxation (ionization and deexcitation) rates of autoionizing states estimated with the Lotz and Mewe formula at N e = 1020 cm−3 are smaller than corresponding autoionization rates Γi ~ 1013 s−1. The dielectronic capture rate C i and the autoionization rate Γi are coupled by the detail balance relation
 $${C_{\rm i}} = 1.66 \times {10^{ - 22}}\displaystyle{{{g_i}} \over {{g_1}}}{\Gamma _{\rm i}}\displaystyle{{\exp [ - \left( {{E_{\rm i}} - {E_{{\rm Li}}}} \right)/{T_{\rm e}}]} \over {T_{\rm e}^{3/2}}}. $$
Here, E i and E Li are the excitation energies of an autoionizing state and the ionization potential for the Li-like ion, correspondingly, and g i is the statistical weight of the level i.
Combining (23)–(26) one obtains the intensity ratio
 $${r_i} = 0.99 \times {10^{ - 34}}\displaystyle{{{{\rm \lambda} _{41}}} \over {{{\rm \lambda} _i}}}{Q_{if}}\displaystyle{{{N_{\rm e}}\exp [ - \left( {{E_{\rm i}} - {E_{{\rm Li}}}} \right)/{T_{\rm e}}]} \over {T_{\rm e}^{3/2} {s_4}(1 + p)}},$$
where the factor Q if = g iAifΓi/(A i + Γi) is independent of the plasma parameters and
 $$p({N_{\rm e}},{T_{\rm e}}) = \displaystyle{{{\rm \beta _4}{N_{\rm e}}{N_{{\rm II}}}} \over {{s_4}{N_1}}}$$
is the ratio of recombination and excitation channel level populations. Calculations in the CR-model [see, e.g., (Magunov et al., Reference Magunov, Faenov, Skobelev, Pikuz, Dobosz, Schmidt, Perdrix, Meynadier, Gobert, Normand, Stenz, Bagnoud, Blasco, Roche, Salin and Sharkov2003)] shows (see Fig. 5) that the Heβ line is induced at the electron density N e = 1.5 × 1020 cm−3 mainly due by the electron excitation from the ground state, while for the Heγ line the recombination channel is of the same efficiency.
The most intensive overlapping dielectronic satellites shown in Figure 3a are formed by the 1s2p(3P)4p 2D5/2 → 1s22p 2P3/2 [λi = 0.77279 nm, Q if = 7.13 × 10¹² s−1 from (Skobelev et al., Reference Skobelev, Faenov, Bryunetkin, Dyakin, Pikuz, Pikuz and Shelkovenko1995)] and 1s2p(3P)4p 2D3/2 → 1s22p 2P3/2 (λi = 0.77269 nm, Q if = 1.41 × 10¹² s−1) transitions. Comparison of the experimental intensity ratio with calculated electron temperature dependence of (27) for these lines gives the electron temperature T e = 240 eV. Uncertainty of the estimation is about 20% (±60 eV) due to experimental errors (especially in the Heγ satellite line intensities) and also due to an accuracy of atomic constants used for model calculations.
6. RESULTS OF HYDRODYNAMIC SIMULATION AND DISCUSSION
In this section we present the results of simulation of the laser–matter interaction to highlight the multi-stage nature of this process. Simulation is performed in 2D cylindric geometry rz within the numerical domain of size −9.5 ≤ z ≤ 0.5 mm and r ≤ 2.5 mm. The time interval is 0 ≤ t ≤ 20 ns. Parameters of the laser pulse are similar to ones in experiment described above. The space–time profile of the laser pulse is approximated by the expression
 $$I(r,t) = {I_L}\exp [ - {(r - {r_0})^4}/\Delta {r^4}]\exp [ - {(t - {t_0})^2}/{\rm \tau} _L^2 ]$
with the laser peak intensity I L = 2 × 10¹¹ W/cm2, r 0 = 0.6 mm, Δr = 0.3 mm, τL = 15 ns, and t 0 = 15 ns.
Initially, the free surface of the Mg target is located at the position z = 0 and the target thickness is 0.5 mm. The laser pulse falls perpendicular to the target along the axis z from the left. In our simulation the size of the hydrodynamic cells is 10 μm both in axial z and radial r directions that is much greater than the laser wavelength λ = 1.06 μm. To properly resolve this characteristic scale and accurately describe the process of the laser energy absorption inside the laser plume we use an additional fine electrodynamic mesh with the size of mesh cell 0.05 μm. Data exchange between coarse hydrodynamic and fine electrodynamic meshes is maintained by the bilinear interpolation technique. Hydrodynamic equations in our numerical algorithm are solved by means of the high-order Godunov method in Eulerian coordinates. Earlier, it was successfully applied for simulation of a subpicosecond laser–metal interaction for pulses of low intensities, when only melting and evaporation were involved (Povarnitsyn et al., Reference Povarnitsyn, Itina, Sentis, Levashov and Khishchenko2007). This approach describes shock and rarefaction waves without noticeable smearing and admits effective spatial splitting. Equations for the electric field are solved using the alternating directions method (Peaceman & Rachford, Reference Peaceman and Rachford1955).
Numerical modeling gives us opportunity to follow the multi-stage evolution of the laser–matter interaction. Already by the time of t ≈ 0.5 ns after the initiation of the laser pulse the temperature of electrons and ions near the surface of the target exceeds 16.5 eV that causes intensive evaporation of substance at the surface. Sharp growth of the electron and ion pressures results in triggering of the hydrodynamic motion of the target material in the vicinity of the free surface. By the time of 5 ns the formation of high-temperature (~60 eV) low-density plasma (~10−2N cr) in front of the target is observed, see Figure 6. Mean charge of ions varies from 6 to 8 in the zone of intensive absorption of the laser pulse. Plasma with such parameters can effectively absorb the laser energy and shields the main target. A bagel-shaped form of the laser spot is the reason of tore-shaped plasma plume which eventually undergoes a collapse on the axis of symmetry r = 0. At the moment 5 ns the leading edge of the plasma plume comes to the axis of symmetry and the radial velocity of the plume edge is about 107 cm/s.

Fig. 6. Contour plots of the plume parameters by time of t = 5 ns: (a) – Temperature of ions, eV; (b) – temperature of electrons, eV; (c) – mean charge of ions; (d) – concentration of electrons normalized to the critical one.
In Figure 7 one can observe the plasma compression occurring at the axis of symmetry and resulting in the increase of plasma density (see Fig. 7d). In this moment the shock wave appears and reflects from the axis of symmetry and moves back into the plume (see Fig. 8a). The other important feature of the process at this moment is the formation of zone with high-temperature and ionization degree which is distant from the target surface, see Figures 7a–7c. This is an indication that the laser light is effectively absorbed in the plume before it reaches the target.

Fig. 7. The same as in Figure 6 but for t = 10 ns.

Fig. 8. The same as in Figure 6 but for t = 15 ns. Dashed blue curve in panel (c) bounds the region with more than 70% concentration of ten-fold ionized ions (that is Mg XI).
The next stage of the plasma plume evolution corresponds to the moment t = 15 ns when the intensity of the laser pulse reaches the maximum 2 × 10¹¹ W/cm2. The propagation of the shock wave is evidently visible in Figure 8a. The maximal temperature of ions is now behind the shock wave front where the plasma undergoes additional compression. In Figure 8d one can see the distribution of the concentration of electrons normalized by the critical value N cr ≈ 1021 cm−3. The profile of the electron concentration is essentially 2D in the range of electron concentrations from 10−2 to 10−1 where the laser energy absorption takes place, and the use of 2D equations for the description of the laser and plasma dynamics in this case is necessary.
Finally we consider the moment of t = 20 ns after the pulse initiation. In Figure 9 we see the shock wave propagation with the radial speed about 8 × 106 cm/s. Axial expansion speed of the plume boundary can be estimated from data for different moments and it is about 3.5 × 107 cm/s at the moment t = 20 ns. Near the axis of symmetry the cumulation effect produces the jet that travels at slightly higher speed (up to 3.7 × 107 cm/s). Velocities of the plasma expansion in the region of densities (from 0.1 to 1.0)N cr is much smaller and can be estimated from Figures 8 and 9 as 2.5 × 106 cm/s that corresponds to 3.3 × 106 cm/s estimated from the experimentally observed plasma size in the y-axis direction [see Fig. 2c].

Fig. 9. The same as in Figure 6 but for t = 20 ns. Dashed blue curve in panel (c) bounds the region with more than 80% concentration of ten-fold ionized ions (that is Mg XI).
The maximum of electron temperature in the time domain of the laser pulse peak intensity, for t from 15 to 20 ns, is about 180 eV and the maximum of ion temperature does not exceed the temperature of electrons at this stage (see Figs. 8 and 9a, 9b). The mean charge of ions at this time interval in the region of the higher electron temperature (where the electron density is about 0.1N cr = 1020 cm−3) is close to 10, as shown in Figures 8 and 9c by dashed (blue) lines. At longer time, t > 20 ns, the laser pulse intensity starts to drop and subsequent dynamics of the plasma spread will be governed by the interplay of the electron heat conductivity, the rate of recombination, and rarefaction of plasma.
The indicated above results of plasma dynamics simulation correspond to the analysis of spectroscopic measurements, where the spectral line shape of the Heβ and Heγ lines of Mg XI ions (see Figs. 3 and 4) were reproduced with the electron plasma density of 1.5 × = 1020 cm−3and temperature 240 ± 60 eV. Note also that the simulated size of hot region with ion state Mg XI is about 1 mm (Figs. 8 and 9) that is about the measured spatial distribution of emitted lines in Figures 3b and 3c.
7. SUMMARY AND CONCLUSIONS
We have developed a self-consistent physical model that is used for simulation of main processes occurring in plasma created by nanosecond laser pulses. To simulate effects of ionization and subsequent recombination we apply the model of mean ion. Transport properties of the plasma are calculated using the wide-range model of frequency of electron–ion collisions. Laser energy absorption in our model is due to the inverse bremsstrahlung mechanism and in the beginning of the absorption process electrons have an essentially higher temperature than ions. To describe this initial stage of absorption we use the two-temperature decomposition of energy equation. Description of the substance behavior in this state has been achieved using the two-temperature equation of state in which the separation on electron and ion components has been performed (Agranat et al., Reference Agranat, Andreev, Ashitkov, Veysman, Levashov, Ovchinnikov, Sitnikov, Fortov and Khishchenko2007; Khishchenko, Reference Khishchenko2004; Reference Khishchenko2008). This model was used to simulate the experiment on heating of Mg targets irradiated by NHELIX laser. The results of plasma dynamics simulation correspond to the plasma parameters determined experimentally by spectroscopic measurements. The correct description of the laser absorption and the properties of heated matter have been achieved by means of wide-range models. It is shown, that rather homogeneous mm-size distribution of the plasma ionization degree can be obtained by the irradiation of the target by the annular shape of the laser radial distribution using 15 ns pulse with the energy about 40 J.
ACKNOWLEDGMENTS
Theoretical part of the work performed by the team of JIHT RAS was supported by RSF grant 14-50-00124.


