


Introduction
The preservation of genetic diversity is recognised as an important aspect of conservation biology (Haig et al. Reference Haig, Miller, Bellinger, Draheim, Mercer and Mullins2016). Small populations frequently suffer from inbreeding depression and loss of adaptive potential due to reduced genetic diversity. Inbreeding reduces survival and fecundity as a result of an increase in the expression of deleterious alleles or a loss of heterozygote advantage, thus directly increasing the extinction risk of small populations (Reed and Frankham Reference Reed and Frankham2003). In the long-term, maintaining sufficiently high genetic variation within species and populations is key to preserving their ability to adapt to new environmental conditions (Crandall et al. Reference Crandall, Bininda-Emonds, Mace and Wayne2000). In an era of rapid environmental change driven by human activity, the observed decline of many populations is expected to reduce genetic diversity and thus jeopardise their long-term persistence. Hence, monitoring temporal changes in the genetic diversity of wild populations can help inform management actions and provide an indication of the strength of human impact.
The Corncrake Crex crex, is a grassland bird species of high conservation concern throughout Europe (Schäffer and Koffijberg Reference Schäffer and Koffijberg2004). Its main threat is the intensification of agricultural practices, and especially early mowing which strongly reduces the survival of fledglings (Tyler et al. Reference Tyler, Green and Casey1998). Such practices have resulted in severe declines in Corncrake populations in several western European countries (Koffijberg et al. Reference Koffijberg, Hallman, Keišs and Schäffer2016). For example, France has experienced a 90% reduction in Corncrake numbers in the last 30 years (Hennique et al. Reference Hennique, Mourgaud, Deceuninck and Chanson2013). Whether this demographic decline in Corncrake populations has affected their genetic diversity has never been assessed. Reductions in population size and demographic bottlenecks are usually associated with a loss of allelic richness and a reduction in heterozygosity (Reed and Frankham Reference Reed and Frankham2003). However, incoming gene flow from other, genetically diverse or different, populations can help maintain genetic diversity. In the Corncrake, a recent population genetics study revealed high genetic diversity within, and large levels of gene flow among, European populations (Fourcade et al. Reference Fourcade, Richardson, Keišs, Budka, Green, Fokin and Secondi2016). However, temporal changes in genetic diversity in specific populations have not been investigated. Therefore, it remains unknown whether the most isolated and threatened Corncrake populations are losing genetic diversity as a result of their demographic decline.
In this study, we examined the changes in genetic diversity that have occurred over a 12-year period in a Corncrake population in western France that experienced a two-fold decline in numbers during this period. Individuals were sampled and genotyped in 2000, 2011 and 2012, and we estimated allelic richness, heterozygosity and effective population size in each year to test for a decline in genetic diversity over this period. We also estimated the number of private alleles among pairs of temporal samples and analysed temporal population structure to assess whether this population changes genetically over time.
Methods
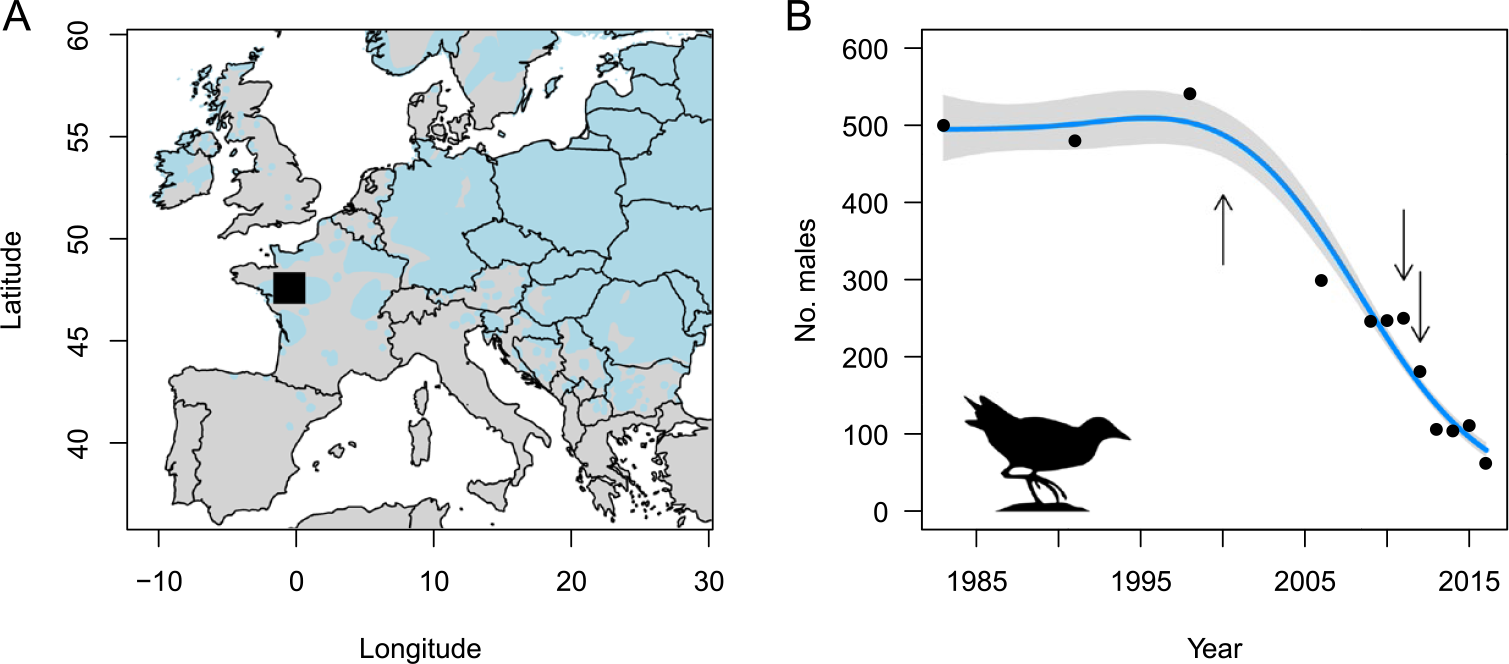
The Corncrake is a migratory bird that breeds in floodplain meadows and extensive grasslands across the Palearctic. The mechanisation of mowing and the abandonment of traditional haymaking practices has led to a decline of Corncrake populations throughout western Europe during the last century (Schäffer and Koffijberg Reference Schäffer and Koffijberg2004). In France, a national monitoring scheme of calling Corncrake males implemented in the 1980s, revealed that the number of individuals declined from c.2,000 males in 1983 to c.200 in 2016. At the same time, the national distribution of Corncrakes became highly fragmented and contracted in the floodplain meadows around the city of Angers (-0.1154°W, 47.4216°N; see Figure 1A) in western France, which now hosts the majority of breeding Corncrakes in France. In this region, the number of calling males has severely declined in the past decades, from c.500 in 1983 to only c.60 in 2016 (Figure 1B).
A) The Corncrake sampling site near Angers in France shown as a black square, with the estimated European distribution of the Corncrake in grey (left). B) The Corncrake population size in the study region over time based on the number of singing males recorded during annual surveys (right). For visualisation purpose, the line shows the estimated trend ± confidence interval according to a Poisson generalized additive model with k = 4 for the smooth term. The years of sampling (2000, 2011 and 2012) are represented as arrows.
We used 55 blood samples from male Corncrakes, collected around Angers from 25 and 30 individuals in 2011 and 2012, respectively, that were previously used to assess the genetic structure of populations at the European scale (Fourcade et al. Reference Fourcade, Richardson, Keišs, Budka, Green, Fokin and Secondi2016). We also analysed 24 blood samples that were collected in 2000. Birds were captured using playbacks between May and July as described in Fourcade et al. (Reference Fourcade, Richardson, Keišs, Budka, Green, Fokin and Secondi2016). All birds were ringed which ensured that no individual was sampled twice. We extracted genomic DNA from blood samples using a salt extraction protocol and genotyped all individuals at 15 microsatellite markers, including eight Corncrake-specific markers (Gautschi et al. Reference Gautschi, Klug Arter, Husi, Wettstein and Schmid2002) and seven markers conserved across bird species (Dawson et al. Reference Dawson, Horsburgh, Küpper, Stewart, Ball, Durrant, Hansson, Bacon, Bird, Klein, Krupa, Lee, Martín-Gálvez, Simeoni, Smith, Spurgin and Burke2010, Reference Dawson, Ball, Spurgin, Martín-Gálvez, Stewart, Horsburgh, Potter, Molina-Morales, Bicknell, Preston, Ekblom, Slate and Burke2013). The full genotyping procedure followed the protocol described in Fourcade et al. (Reference Fourcade, Richardson, Keišs, Budka, Green, Fokin and Secondi2016).
We computed the observed and expected heterozygosity, as well as the rarefied allelic richness, of each locus in each sampling year, using the “hierfstat” R package (Goudet Reference Goudet2005). Significance of the differences between sampling years across loci were assessed by ANOVA tests. We calculated the number of private alleles per locus among pairs of temporal samples to estimate the number of alleles lost and gained between two consecutive samples, i.e. between 2000 and 2011, and between 2011 and 2012. Effective population size was estimated using the linkage disequilibrium approach implemented in NeEstimator 2.1 (Do et al. Reference Do, Waples, Peel, Macbeth, Tillett and Ovenden2014), excluding rare alleles with a frequency of < 0.05. Additionally, we tested for temporal differentiation of the sampled population. First we computed pairwise indices of population differentiation between sampling years: G’’ ST, an unbiased and standardized analogue of F ST (Meirmans and Hedrick Reference Meirmans and Hedrick2011), and D (Jost Reference Jost2008), a measure based on the number of alleles instead of on heterozygosity. Confidence intervals around these indices were calculated based on a bootstrap approach with 10,000 permutations as implemented in the “diveRsity” R package (Keenan et al. Reference Keenan, McGinnity, Cross, Crozier and Prodöhl2013). Finally, we implemented the clustering algorithm of the program structure (Pritchard et al. Reference Pritchard, Stephens and Donnelly2000), which uses a Bayesian approach to assign each individual a membership probability to an a priori number of genetic clusters. We ran 10 structure replicates for K = 1, K = 2 and K = 3 clusters with the following settings: admixture model with correlated allele frequencies (Falush et al. Reference Falush, Stephens and Pritchard2003), and 100,000 burn-in steps followed by 500,000 iterations. We also used the LOCPRIOR option, which makes use of prior information to facilitate the detection of weak genetic structures (Hubisz et al. Reference Hubisz, Falush, Stephens and Pritchard2009), here the prior knowledge being the different years of sampling as genetic clusters.
Results
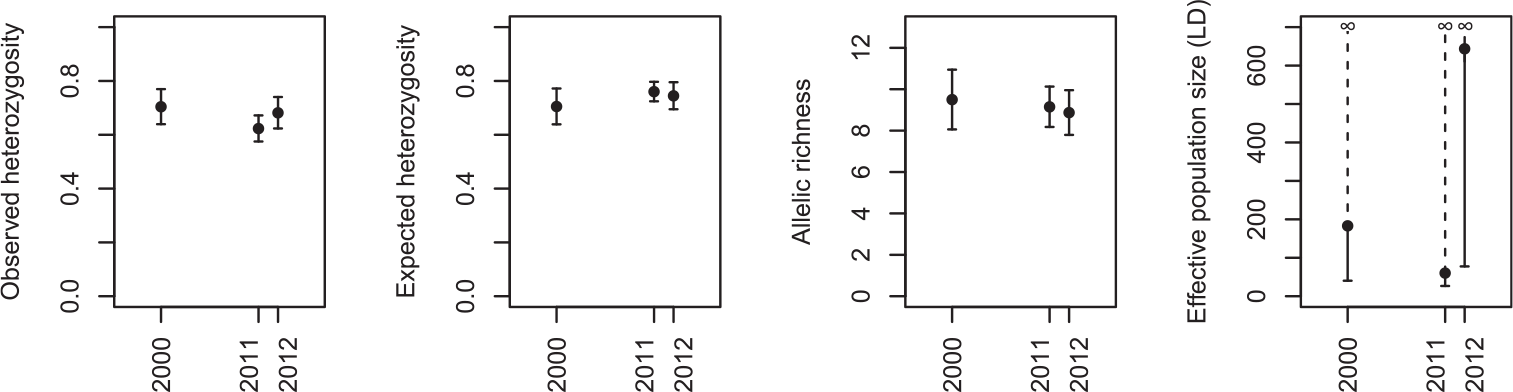
There was no evidence for a decline in genetic diversity over time (Figure 2). Observed heterozygosity was 0.70 (± 0.07 SE) in the oldest sample (2000), 0.62 (± 0.05) in 2011 and 0.68 (± 0.06) in 2012 (F 2, 28 = 2.84, P = 0.08). Similarly, there was almost no difference between sampling years in terms of expected heterozygosity, with a mean of 0.70 (± 0.07 SE) in 2000, 0.76 (± 0.04) in 2011 and 0.75 (± 0.05) in 2012 (F 2, 28 = 2.07, P = 0.15). There was a very small non-significant decrease in allelic richness over time, from 9.50 (± 1.44) alleles per locus in 2000 on average, to 9.15 (± 0.10) in 2011 and 8.87 (± 1.08) in 2012 (F 2, 28 = 0.49, P = 0.62). Finally, although the mean estimate of effective population size was highly variable between years (183.3 in 2000, 60.5 in 2011 and 643.9 in 2012), the upper confidence interval was always infinity, showing that there was no signal of linkage disequilibrium in our data that can distinguish it from being indeterminably large.
The change in genetic diversity in the Angers population of Corncrakes between sampling years, expressed as estimates of observed heterozygosity, expected heterozygosity, rarefied allelic richness (mean across loci ± standard error), and effective population size based on linkage disequilibrium (± 95% confidence intervals).
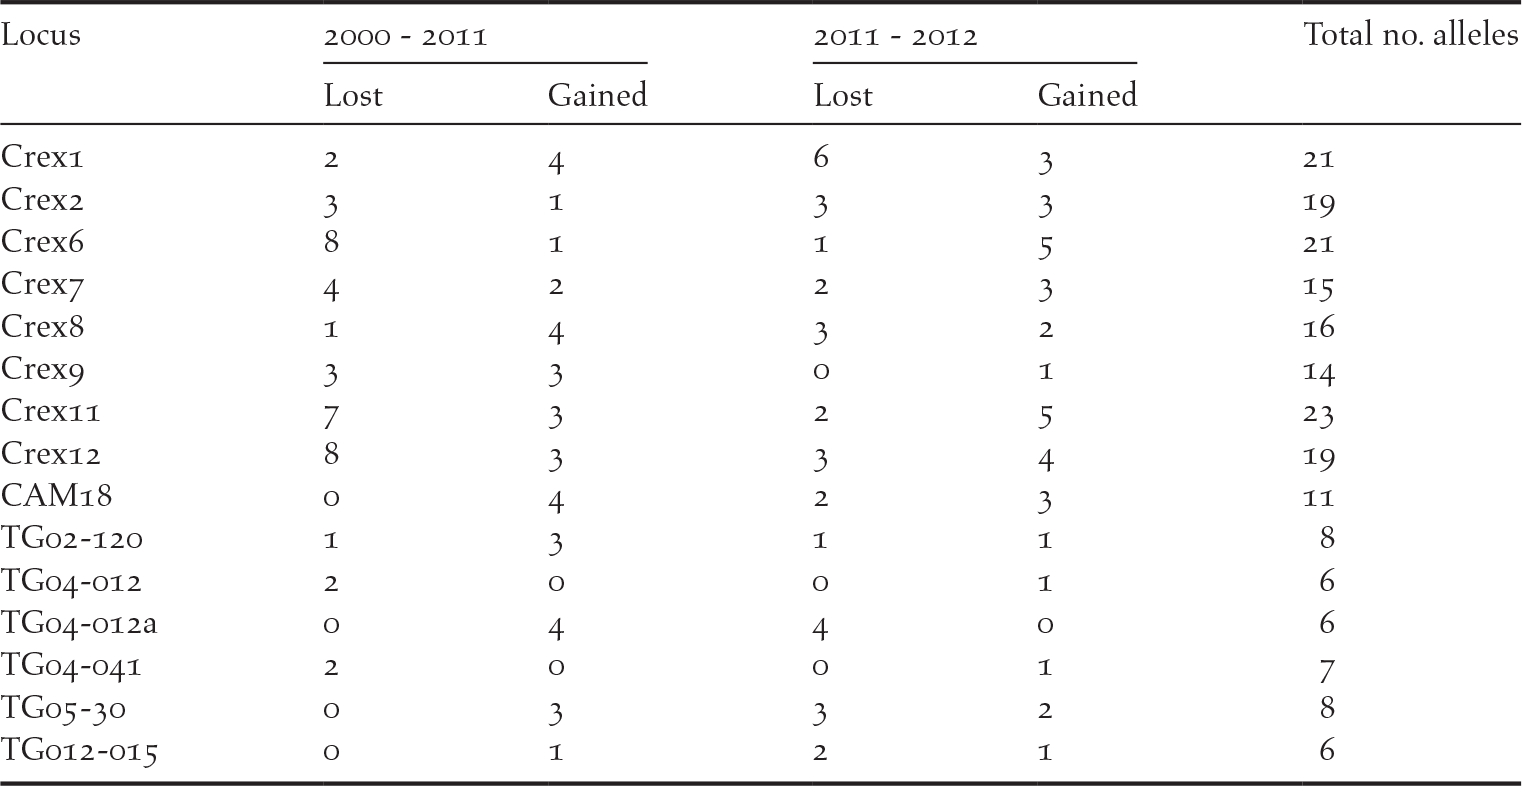
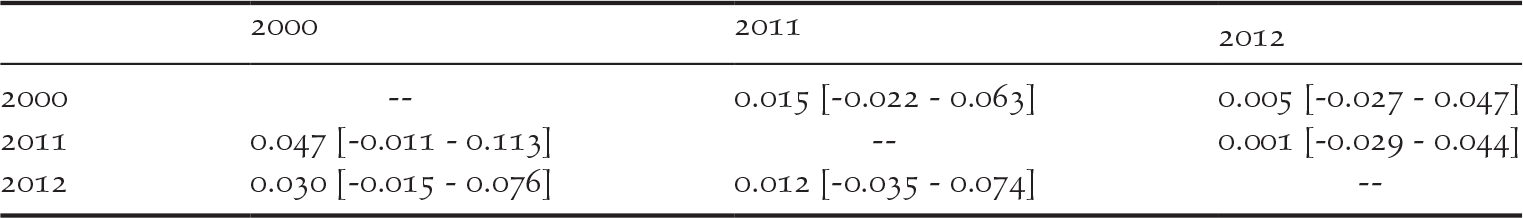
We detected private alleles among pairs of consecutive sampling years at all loci, with a total of 41 alleles lost and 36 new alleles gained between 2000 and 2011, and 32 alleles lost and 35 new alleles gained between 2011 and 2012 (Table 1). Pairwise measures of genetic differentiation between years were not significant, as bootstrap confidence intervals always included zero (Table 2). However, we note that G’’ ST and D calculated between the samples collected in 2000 and those collected in 2011 or 2012 were considerably larger than between 2011 and 2012 (Table 2). structure provided no evidence for a temporal genetic structure either, as shown by a larger likelihood for one genetic cluster and an estimated membership of individuals to two or three genetic clusters that did not match the temporal structure of the data (Figure S1 in the online supplementary material). Nevertheless, we observed that samples collected in 2011 and 2012 were more closely related to each other than with the 2000 sampling. For instance, assuming K = 2, samples from 2000 were assigned to the red cluster of Figure S1 by 80% on average, while the mean membership for this cluster was 62% for the samples collected in both 2011 and in 2012.
Number of private alleles detected in two pairs of consecutive sampling (2000–2011 and 2011–2012), showing the number of alleles lost and gained over time. Results are presented for each locus, with the total number of alleles detected in this population over the three sampling years.
Pairwise genetic differentiation in the western France population of Corncrakes between sampling years, expressed as G’’ ST below diagonal and D above diagonal. Numbers in brackets show the 95% confidence intervals obtained through 10,000 permutations.
Discussion
We demonstrated that, despite a strong and continuous demographic decline, the Corncrake population of western France did not undergo a reduction in its genetic diversity. Not only did the genetic diversity remain stable, it was also remarkably high for a population estimated at around 180 males (in 2012). In light of the available data, the most likely scenario is that genetic diversity was maintained by gene flow from distant populations that have not suffered from the same demographic decline. Although the evidence remains scarce, there are records of occasional, within-season, long-distance movements (up to 1,500 km) revealed by ring recoveries (Schäffer and Koffijberg Reference Schäffer and Koffijberg2004, Koffijberg et al. Reference Koffijberg, Hallman, Keišs and Schäffer2016) and song analyses (Mikkelsen et al. Reference Mikkelsen, Dale and Holtskog2013). There is also some evidence of (limited) synchrony in population fluctuations at the European scale, revealed by simultaneous peaks of abundance (Koffijberg et al. Reference Koffijberg, Hallman, Keišs and Schäffer2016). These abundance peaks have been hypothesised to be caused by extreme weather events in distant, highly productive, areas (e.g. Russia) that prompt long-distance dispersal of individuals in search of more favourable breeding grounds (Koffijberg et al. Reference Koffijberg, Hallman, Keišs and Schäffer2016). Alternatively, marginal populations may be regularly supplemented by migrants coming from the core populations in years following exceptionally high breeding productivity.
If the maintenance of genetic diversity was achieved by regular immigration events, we should observe a gradual change in the genetic characteristics of the original population. In this regard, we showed that several alleles were lost, while others were gained, between each temporal sample, suggesting either differences in the origin of individuals from one year to another, or that they originate from a highly diverse population. Moreover, the estimates of effective population size estimates could not be distinguished from infinity, which implies that the samples originated from a much larger population than the few hundred individuals recorded in the study area. We also observed what might be a sign of a slow temporal differentiation. Altogether, genetic evidence supports the idea that Corncrakes in western France do not belong to a genetically distinct population but rather to a larger European population. Most likely, the most productive sites of eastern Europe act as source populations, sending dispersing individuals into sink populations in western Europe where the local conditions remain unfavourable for successful breeding and demographic growth. In support of this hypothesis, we previously described large levels of gene flow among European populations of Corncrakes that we attributed to asymmetric dispersal from eastern to western populations (Fourcade et al. Reference Fourcade, Richardson, Keišs, Budka, Green, Fokin and Secondi2016).
The fact that the extreme decline in Corncrake numbers in the western France population was not followed by a similar decrease in their genetic diversity is good news from a conservation perspective. For example, it is known that low levels of heterozygosity, when they reflect reduced genetic diversity at immune-related loci, can result in a higher susceptibility to pathogens (Hawley et al. Reference Hawley, Sydenstricker, Kollias and Dhondt2005). In this regard, we have already noticed that western European Corncrake populations, including France, did not suffer from higher malaria prevalence than the larger populations of eastern Europe (Fourcade et al. Reference Fourcade, Keiss, Richardson and Secondi2014). These results suggest that, as it is not genetically depleted, the population may be able to recover successfully if effective management actions are implemented.
Longer genetic monitoring may be needed to rule out the possibility that a slow decline of genetic diversity is occurring or will occur in the future. Despite the regular input of new alleles, allelic richness showed a slight non-significant trend towards decline. It might be an early warning of a loss of genetic diversity, since allelic richness is usually more sensitive to a decrease in population size than heterozygosity (Allendorf Reference Allendorf1986). Unfavourable changes in the demographic regime of eastern European populations – as observed in many farmland birds (Reif and Vermouzek Reference Reif and Vermouzek2018) – may weaken the incoming gene flow in western European populations, including France. In the absence of annual monitoring between 1998 and 2006, it is also unknown whether population decline started before or after 2000 (Figure 1). Samples from the 1980s or earlier, when Corncrake numbers where high both at the local and national levels (Hennique et al. Reference Hennique, Mourgaud, Deceuninck and Chanson2013), would help identifying the association between demography and genetic diversity in Corncrake populations. Accordingly, previous analyses using approximate Bayesian computation suggested that contemporary genetic data were compatible with a scenario of ongoing population decline (Fourcade et al. Reference Fourcade, Richardson, Keišs, Budka, Green, Fokin and Secondi2016). So far, the agri-environmental schemes implemented in France to protect the Corncrake have failed to halt its decline. Future environmental policies should now take advantage of the fact that genetic diversity has been maintained up to now in order to implement effective conservation strategies that may reverse the unfavourable demographic trend, before a severe loss of genetic diversity does occur.
Supplementary Material
To view supplementary material for this article, please visit https://doi.org/10.1017/S0959270919000327
Acknowledgements
The authors want to thank people who helped collecting Corncrake samples in the field: Gilles Mourgaud, Édouard Beslot, Emmanuel Séchet in 2011–2012 and Franck Noël in 2000. We acknowledge funding from Plan Loire Grandeur Nature, European Regional Development Fund, Région des Pays de la Loire, Angers Loire Métropole, Direction Régionale de l’Environnement, de l’Aménagement et du Logement (DREAL) and Département Maine-et-Loire.


 Open access