


Introduction
During the first year of the COVID-19 pandemic, dramatic and sudden changes occurred in how and where families acquired food and the prices they paid for it. The pandemic affected household income for millions of Americans and made it more difficult for families to acquire food because of mobility restrictions, supply chain disruptions, increased prices, and school closures that reduced access to school breakfast and lunch programs. Many households increased their food at home (FAH) expenditures and subsequently reduced their expenditures for food away from home (FAFH) (Ellison et al. Reference Ellison, McFadden, Rickard and Wilson2021; Marchesi Reference Marchesi2022; Zeballos and Dong Reference Zeballos and Dong2022). Generally, FAH is associated with better diet quality than FAFH (Todd et al. Reference Todd, Mancino and Lin2010), yet the combination of rising food prices, regular stockouts in stores, increases in unemployment, and the stress of the pandemic may have led some households to purchase cheaper, nutrient-poor foods. Indeed, in a review of articles published before the end of 2021, Nosi et al. (Reference Nosi, Aquilani and Fulco2023) detailed the mixed findings related to food choices in the beginning of the pandemic. While some households substantially increased cooking and intake of healthy foods, others utilized more energy-dense, convenience foods as a way to cope with the stresses associated with the pandemic (Nosi et al. Reference Nosi, Aquilani and Fulco2023).
Under the Families First Coronavirus Response Act (Public Law 116-127) of March 2020, state agencies that administer the Supplemental Nutrition Assistance Program (SNAP) were granted additional flexibilities to address temporary increased need for food assistance based on actual conditions in affected areas. Changes in SNAP during the first year of the pandemic included emergency allotments to provide SNAP households with additional benefits to purchase food and SNAP operation waivers, such as extending certification periods and waiving interview requirements for initial applications and recertifications (Center on Budget and Policy Priorities [CBPP], 2023).Footnote 1 The emergency allotments increased SNAP benefits to the maximum allowed for each household based on its size (USDA 2023a). Furthermore, benefits increased under a cost-of-living adjustment in October 2020. In addition to changes in SNAP, meal replacement benefits were provided to replace school meals during school closures for children who receive free or reduced-price meals (known as P-EBT), even if their families did not participate in SNAP.
The purpose of this study was to determine the extent to which changes in SNAP during the first year of the pandemic affected nutritional quality of food purchases by SNAP households with children using national Circana Consumer Network household-based scanner data. We focused on households with children because of the greater effects of the pandemic on households with children, which were more likely to suffer job and income losses and have higher rates of food insufficiency compared to households without children (Armantier et al. Reference Armantier, Koşar, Pomerantz and van der Klaauw2020). In addition, we considered differences across households of different races and ethnicities. We focused on the first year of the pandemic and the initial emergency response when all states were fully participating in SNAP program changes.
Food security among SNAP-participating households was higher after the start of the pandemic than prior to pandemic, and the differences did not appear to be attributable to changes in who participated in SNAP (Brady et al. Reference Brady, Harnack, Widome, Berry and Valluri2023). However, studies on diet quality, all of which used data limited to a specific geographic region or retail chain, found small and mixed effects of SNAP during the pandemic. For example, Lo et al. (Reference Lo, Duffy and Ng2023) used weekly transaction data from large chain grocery stores across North Carolina to analyze diet quality and found that SNAP participants had a decrease in mean share of total calories from sugar-sweetened beverages (SSBs) and less healthy food as compared to pre-pandemic but an increase in the mean share of total calories from processed meats. Lee et al. (Reference Lee, Poole, Zack, Fiechtner, Rimm and Kenney2023) analyzed data from the Massachusetts Statewide Food Access Survey conducted from October 2020 through January 2021 and found that using SNAP, regardless of food sufficiency status, was associated with lower diet quality based on responses to a food frequency questionnaire. Using data from the California Family Health Study, Molitor and Kehl (Reference Molitor and Kehl2023) analyzed dietary recall data from 1,714 mothers before and after the availability of enhanced COVID-19 pandemic benefits and concluded that increased SNAP and unemployment benefits may have reduced dietary inequities among families from low-income households, but they did not compare SNAP and nonparticipating households. Using scanner data from one store chain, Conlin et al. (Reference Conlin, Harris-Lagoudakis, Haughey, Jung and Wich2024) also found mixed results of changes in overall healthfulness of grocery store purchase after the introduction of the COVID-19 vaccine with changes varying by market and household demographics. In addition, Elliott et al. (Reference Elliott, Satterfield, Solorzano, Bowen, Hardison-Moody and Williams2021) conducted qualitative interviews with low-income mothers about their use of safety net programs throughout the pandemic and found that while the increases in SNAP benefits were welcome, they were often still not enough to support their food needs. Women in this study reported rationing behaviors and the need to shop at cheaper stores for cheaper foods (Elliott et al. Reference Elliott, Satterfield, Solorzano, Bowen, Hardison-Moody and Williams2021). The purchase of cheaper foods may be associated with lower dietary quality; however, this was not investigated.
Using national Consumer Network data on actual food purchases of SNAP-participating and income-eligible nonparticipating households (referred to as SNAP-eligible in this paper) before and during the pandemic, we calculated expenditure-based measures of the nutritional quality of food purchases developed for use with household-based scanner data. Food purchases and food consumption choices are closely linked; thus, household-based scanner data allowed us to infer differences in nutritional quality of SNAP versus similar nonparticipating households with children. Because other external factors, such as increases in unemployment benefits, stimulus payments, and increased food prices, could also have affected food purchases, our methodology compared SNAP households with SNAP-eligible households rather than focusing solely on changes in food purchases for SNAP households. Understanding the effects of immediate changes in SNAP during the pandemic can provide information about whether rapid and substantial changes in SNAP can affect not only food security but also nutrition security in terms of the healthfulness of food purchases.Footnote 2 Thus, results of analyses could help inform future program changes in response to changing market conditions, emergencies, and other external events.
Many low-income households that participate in SNAP also participate in WIC if the household includes a pregnant, postpartum, or breastfeeding woman; an infant; or a child up to 5 years old.Footnote 3 SNAP households that also participated in WIC during the pandemic may have also benefited from changes made to the WIC program under the Families First Coronavirus Response Act. Specifically, the Act allowed USDA’s Food and Nutrition Service (FNS) to issue waivers to state agencies to allow them to continue to serve WIC participants during the COVID-19 pandemic. Examples of these waivers included extending certification periods, allowing for food package substitutions, and not requiring participants to physically come to WIC clinics (USDA, FNS, n.d.b).Footnote 4 To account for the fact that some SNAP households also participate in WIC, we included a measure of WIC participation in the analysis.
Data and methods
We conducted the analyses using Consumer Network data for 2019 and 2020 that include all food purchases made in retail stores by a national panel of U.S. households, self-reported indicators of SNAP and WIC participation, self-reported indicators of payment type for each food purchase transaction (including use of SNAP and WIC benefits), geographic location (region and county population size category), race of the household as reported by the respondent (Asian, Black, White, and other), and self-reported ethnicity of the household (Hispanic, non-Hispanic). We describe the identification of SNAP-participating and SNAP-eligible households in the data, calculation of nutritional quality measures, and the demographic characteristics of households and then describe the regression modeling approach.
Data sources and identification of SNAP households
The Consumer Network data are derived from the National Consumer Panel (NCP), which is an operational joint venture between Circana and NielsenIQ. Households in the NCP rescan purchases for each shopping trip at the detailed product level, including packaged foods with barcodes and random weight foods (Muth et al. Reference Muth, Okrent, Zhen and Karns2019) and thus provide detailed information about their food purchasing patterns. Circana creates Consumer Network data using the NCP. We focused on households with children and selected those with family members that are less than 18 years of age in 2019 based on the reported birthdates.
We classified a household as participating in SNAP if it used SNAP benefits for at least one shopping trip during the year or, for a few additional households, responded yes to the annual survey question administered by the NCP in June or July each year.Footnote 5 We used both variables to identify SNAP households to be more inclusive of all potentially participating households. Households tend to underreport SNAP participation in surveys (Carlson and Llobrera Reference Carlson and Llobrera2022), but using the method of payment indicator assists with more accurately identifying SNAP households as shown in Gregory (Reference Gregory2025).Footnote 6 We included households in the analysis if they participated in SNAP in both 2019 and 2020 but not if they participated in only one of the years. Otherwise, changes in food purchases could have been associated not only with changes in SNAP but also changes in participation status (Muth et al. Reference Muth, Love, Okrent, Bock, Creel, Ellison, Karns and Mancino2025). We classified a household as SNAP-eligible if its income level in 2019 or 2020 would have made it eligible (setting aside the asset limitation), it did not report using SNAP as a payment method, and it did not respond yes to the survey question regarding SNAP participation in both 2019 and 2020. Circana provides household income in ranges; to err on the side of including a larger number of households with low income, we assigned the lower end of the reported range for each household for the purposes of determining income eligibility. We then used the “gross monthly income” limits for households in fiscal years 2019 and 2020 (separate higher limits were used for Alaska and Hawaii) to determine whether each household met the criteria.Footnote 7
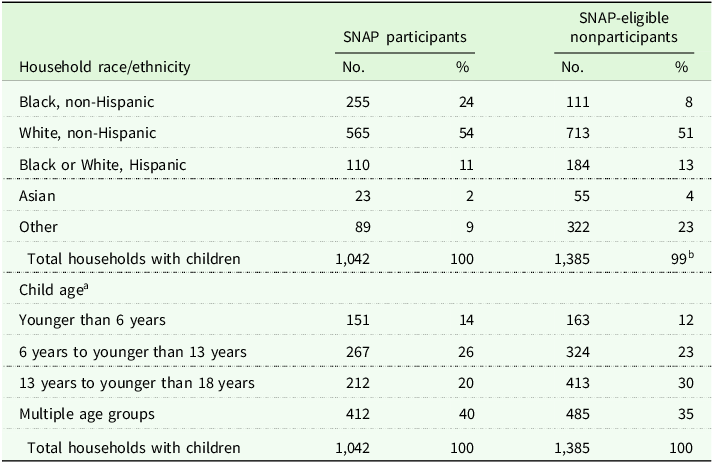
Table 1 shows the number of households with children by race and ethnicity and by child age included in the analysis data set for the 1,042 SNAP households and the 1,385 SNAP-eligible households.Footnote 8 We excluded households from the analysis data set if they reported purchases in fewer than 9 months in either 2019 or 2020 (approximately 64 households) to limit the amount of imputation required for missing values of the nutritional quality measures used in the study. For both types of households, about half of the households identified themselves as White, non-Hispanic, and the other half were distributed across Black, non-Hispanic, Hispanic, Asian, and Other. The percentage of Black, non-Hispanic households was somewhat larger for SNAP households than SNAP-eligible households, and the percentage of households in the “other” category was lower for SNAP households. The percentages of households with children across each of the age ranges were similar across SNAP and SNAP-eligible households with the largest portion having children in a combination of age ranges. Appendix Table A-1 also shows the weighted distribution of households by race and ethnicity and by child age using the weights provided by Circana that are calculated using control totals derived from Census Bureau data (Muth et al. Reference Muth, Sweitzer, Brown, Capogrossi, Karns, Levin, Okrent, Siegel and Zhen2016). Because the weighted and unweighted distributions are very similar, participants in the NCP appear to mirror the general population.
Demographic summary of households with children in the Circana Consumer Network data included in the analysis, 2019–2020

aChild age is determined based on the birthdates (year and month) of children in the household.
bColumn does not add to 100 due to rounding.
Note: Households had to report at least 9 months of purchases during each year to be included in the analysis.
Source: Authors’ calculations using Circana Consumer Network data for 2019 and 2020.
Expenditure-based nutritional quality measures
Under the assumption that food purchases and food consumption are closely related, we calculated five expenditure-based measures of household nutritional quality using the Consumer Network data. The benefit of using expenditure-based measures is that it is not necessary to have measures of nutrient levels for every UPC, which can result in substantially more missing values particularly for less frequently purchased items. All five measures rely on the use of the USDA’s Economic Research Service (ERS) Food Purchase Groups (EFPGs), which ERS developed based on the food-based groupings used in the Dietary Guidelines for Americans (DGAs). The EFPGs were designed to categorize foods according to characteristics such as ingredients, nutritional content, and convenience level (Sweitzer et al. Reference Sweitzer, Byrne, Page, Carlson, Kantor, Muth, Karns and Zhen2024). The EFPGs comprise 90 subgroups within the following groups: grains; vegetables; fruit; dairy; meats and protein foods; prepared meals, sides, and salads; and other foods. We mapped each product code and random weight code in the Consumer Network data to an EFPG and then calculated the total expenditures for each household by month for each EFPG.
Two of the nutritional quality measures – USDAScore1 and USDAScore2 – are calculated by first estimating per-person expenditure shares by food group and then combining them into an overall measure of household nutritional quality using an approach developed by ERS (Volpe and Okrent Reference Volpe and Okrent2012). The approach compares the share of food expenditures by households to the market basket cost categories in USDA’s Thrifty Food Plan (TFP) where higher scores indicate expenditure shares are closer to TFP recommendations (USDA, 2021). The TFP shows minimum expenditures for several food groups necessary to meet the DGAs by sex and age of household members. We mapped the EFPGs described above to the TFP market basket categories and then summed the total expenditures by TFP for use in the calculations (see Appendix Table B-1).
Following Volpe and Okrent (Reference Volpe and Okrent2012), USDAScore1 is calculated as
 $$USDAScore{1_{im}} = {1 \over {\sum\nolimits_c {{{\left( {hhshar{e_{icm}} - TFPshar{e_{ic}}} \right)}^2}} }}$$
and USDAScore2 is calculated as
 $$USDAScore{2_{im}} = {1 \over {\sum\nolimits_c {\left. {{{\left( {hhshar{e_{icm}} - TFPshar{e_{ic}}} \right)}^2}} \right|} hhshar{e_{icm}} \gt 0}}$$
where hhshare icm is the share of grocery expenditures by household i for food category c in month m and TFPshare ic is the share of grocery expenditures for a household of similar age and sex composition in the TFP.
We calculated TFPshare ic using the estimated costs for each market basket category in the TFP based on the age and sex of each person in the household for the 15 age-sex groups provided in USDA, FNS (2021).Footnote 9 For example, if a household comprised a female, 20–50 years of age; a male, 1 year of age; and a female, 6–8 years of age, we obtained the costs for each market basket category from the table for each of those age-sex combinations. We then summed up the costs for each market basket category across the individuals in the household to derive household costs for each market basket. The share of TFP expenditures for a market basket category was calculated based on the household rather than individual costs.
The first scoring method in Equation (1) is the simplest and operates on the assumption that Consumer Network households report most of their grocery purchases. Household scores are penalized for expenditure shares that deviate from the TFP recommendations. The second scoring method in Equation (2) allows for the possibility that some households do not record all their purchases and accounts for this by including only food purchases that are greater than zero. However, one limitation of the USDAScore1 and USDAScore2 is that they are not directly interpretable. Although these nutritional quality measures are unbounded, higher scores mean greater adherence to the DGAs. Another limitation of the USDA measures is that it penalizes any deviation from the TFP recommendation even if the deviation may be healthful. For example, a household that purchases more than the TFP recommended share on vegetables would be penalized. Although this is generally not the case for households in the sample, alternative measures like the Grocery Purchase Quality Index (GPQI) are worth examining because it caps the penalty on each food group based on the Health Eating Index criteria.
The GPQI is a validated comprehensive measure of the nutritional quality of food purchases (Brewster et al. Reference Brewster, Guenther, Jordan and Hurdle2017, Reference Brewster, Durward, Hurdle, Stoddard and Guenther2019) that is bounded and more directly interpretable compared to the USDAScores. As with the USDAScores, higher values indicate better nutritional quality. Similar to Volpe and Okrent, the GPQI compares reported household food purchases in each market basket category with the optimal TFP amounts. However, the GPQI additionally scales this adherence between household and the TFP market basket costs to the Healthy Eating Index (HEI). We adapted the GPQI method in Brewster et al. (Reference Brewster, Guenther, Jordan and Hurdle2017, Reference Brewster, Durward, Hurdle, Stoddard and Guenther2019) to use the 2015 HEI in place of the 2010 HEI and the 2021 TFP market basket costs (with adjustments for changes in price levels).
The HEI contains the adequacy and moderation components shown in Appendix Table B-2 with adherence to each component scored from 10 to 20 points. If all components are included, the maximum score is 100 and would reflect perfect adherence to the DGAs. In our calculations, we are able to use the subcomponents that correspond to whole foods as purchased and thus exclude fatty acids, sodium, and saturated fats resulting in a maximum score of 70. For added sugars, we included TFP market baskets that comprise foods that are sweeteners added to foods or foods that typically contained added sugars (e.g., soft drinks, cookies, candy bars).
For the adequacy components, the GPQI equation is calculated as the ratio of hhshare icm to TFPshare ic for these market basket categories. These ratios are then applied to the maximum points (HEImax c ) associated with each of the HEI adequacy components shown in Table A-2:
 $$Adequat{e_c} = \min (HEIma{x_c},\;HEIma{x_c}*hhshar{e_{icm}}/TFPshar{e_{ic}})$$
If the ratio of hhshare icm to TFPshare ic is greater than 1.0, then the maximum HEI score is used. For the moderation components, a ratio of 1.0 or less for hhshare icm to TFPshare ic corresponds to compliance with the DGAs, and the maximum points are assigned. Brewster et al. (Reference Brewster, Guenther, Jordan and Hurdle2017, Reference Brewster, Durward, Hurdle, Stoddard and Guenther2019) established the cut points (cutpt c ) for assigning a minimum score of zero using the 85th percentiles in the FoodAPS 2012–2013, which are 4.9 for refined grains and 16.7 for sweets and sodas. Ratios at these cut points or higher are assigned a zero and ratios from 1.0 to these cut points are assigned scores linearly descending from the maximum points to zero as follows:
 $$Mo{d_c} = HEIma{x_c}\ {\rm{*}}\ (\max (0,\min (1,1 - (((hhshar{e_{icm}}/TFPshar{e_{ic}}) - 1)/(cutp{t_c} - 1)))))$$
The GPQI as adapted for our use is the sum of the adequacy components from Equation (3) and the moderation components from Equation (4) with maximum score of 70.
For the last two nutritional quality measures, we calculated measures of total fruit and vegetable expenditures and total sugar-sweetened beverage expenditures. We selected these categories of foods as key indicators of healthier and less healthy food and beverage purchases by households. For the fruit and vegetable and the sugar-sweetened beverage expenditures measures, we summed all purchase amounts in dollars for the relevant EFPGs.Footnote 10
Some households did not report food purchases for every month (1,230 household-months out of a total of 55,821 or 2.2%). To minimize potential bias associated with missing data, we imputed nutritional quality measures for each missing household-month. Although it is plausible that a household did not purchase food from retail outlets for an entire month, we assumed the missing values are likely because households paused reporting of purchases for some reason such as vacation. We used the Multiple Imputation by Chained Equation package (“mice package”) (van Buuren and Groothuis-Oudshroorn, Reference van Buuren and Groothuis-Oudshoorn2011) in R (R Core Team 2023) to perform multiple imputations of missing nutritional quality measures (Rubin Reference Rubin1987). We calculated 10 imputations separately for pre-pandemic and pandemic time frames. Then we analyzed the data with imputations with generalized linear models for complex survey data, using the Analysis of Complex Survey Samples (“survey package”) in R (Lumley Reference Lumley2023), to account for the clustering of months within households. The final step was to combine the parameter estimates and standard errors from each of the 10 models to estimate the multiply-imputed parameter estimates and standard errors.
Other household demographic variables
In addition to race and ethnicity, the Consumer Network data contain several other demographic variables that could be associated with food purchasing patterns. Because race and ethnicity were key variables of interest in the analyses, we retained them as independent variables in the regression model described below. To determine which additional demographic variables to include, we used nonparametric methods to determine the most parsimonious model. Specifically, we used regression trees (Breiman et al. Reference Breiman, Friedman, Olshen and Stone1984) to find a subset of possible independent variables and used this subset of variables in a statistical learning approach to select the most parsimonious model (Hastie et al. Reference Hastie, Tibshirani and Friedman2009). We used the Classification and Regression Trees (CART) package (referred to as “tree package”) (Ripley Reference Ripley2023) in R (R Core Team 2023) to eliminate some of the possible independent model variables. We started with 26 possible independent variables and reduced it to 18 for the statistical learning approach. The statistical learning approach used 5-fold cross-validation to determine which variables were the best independent variables combined to predict the nutritional quality outcome measures. Given the 18 possible independent variables from the regression tree analysis, the cross-validation looked at all possible combinations with up to 10 variables in the model. The models with the smaller mean squared error provided a subset of variables to include in the regression model.
Based on the results of the statistical learning model and CART analysis, the demographic variables included in the model, beyond race and ethnicity, were household size (1 to 8 members), child age category (or multiple ages), whether the household has a female head, whether the household head is married, whether the household head is employed as a professional or manager, the highest education level of the household head, rural/urban indicators, and whether the household owns a pet.Footnote 11 Additionally, we included an indicator for whether the household participated in WIC using the same approach as for SNAP participation (i.e., the response to the survey question and use of WIC as a method of payment).Footnote 12 In the Consumer Network data, 142 SNAP households (14%) and 36 SNAP-eligible households (3%) appeared to have participated in WIC in 2019 and 2020.
Modeling approach
For each nutrition measure, we estimated the following equation where i indexes households and m indexes months in the data set:
 $$N{Q_{im}}\; = {\beta _0} + {\beta _1}{C_m} + {\beta _2}SNA{P_i} + {\beta _3}{C_m}SNA{P_i} + {\beta _4}MONTH + \sum\nolimits _{j = 1}^J{\gamma _j}{Z_{ij}} + {\varepsilon _{im}}.$$
NQ im represents each of the five nutritional quality measures for household i in month m, C m = 1 in the pandemic months and 0 otherwise, SNAP i = 1 if the household participated in SNAP and 0 otherwise; MONTH represents monthly fixed effects, Z ij is a vector of other household characteristics identified based on the statistical learning model and CART analysis described above and including WIC participation, and ϵ im is the regression residual.Footnote 13 The association between changes in SNAP and the nutritional quality of food purchases during the first year of the pandemic is measured by the interaction term, β 3.Footnote 14 Because March 2020 was a transition month from the pre-pandemic to pandemic period, we dropped it from the analysis data set.
Other factors beyond SNAP participation may also have affected nutritional quality of food purchases. In particular, receipt of additional unemployment benefits and stimulus money during the pandemic and changes in food prices could also have affected food purchase decisions. However, evidence shows that much of the initial stimulus benefits were saved or used to pay down debt (Coibion et al. Reference Coibion, Gorodnichenko and Weber2020). Changes in prices for food-at-home were mixed with some foods, such as meat, poultry, and fish, increasing substantially, and others, such as fresh fruits and vegetables, increasing at similar rates in 2019 and 2020 (USDA, ERS, 2025). Our approach attempted to control for these and other external factors by comparing SNAP households with SNAP-eligible households over the same period.
Results
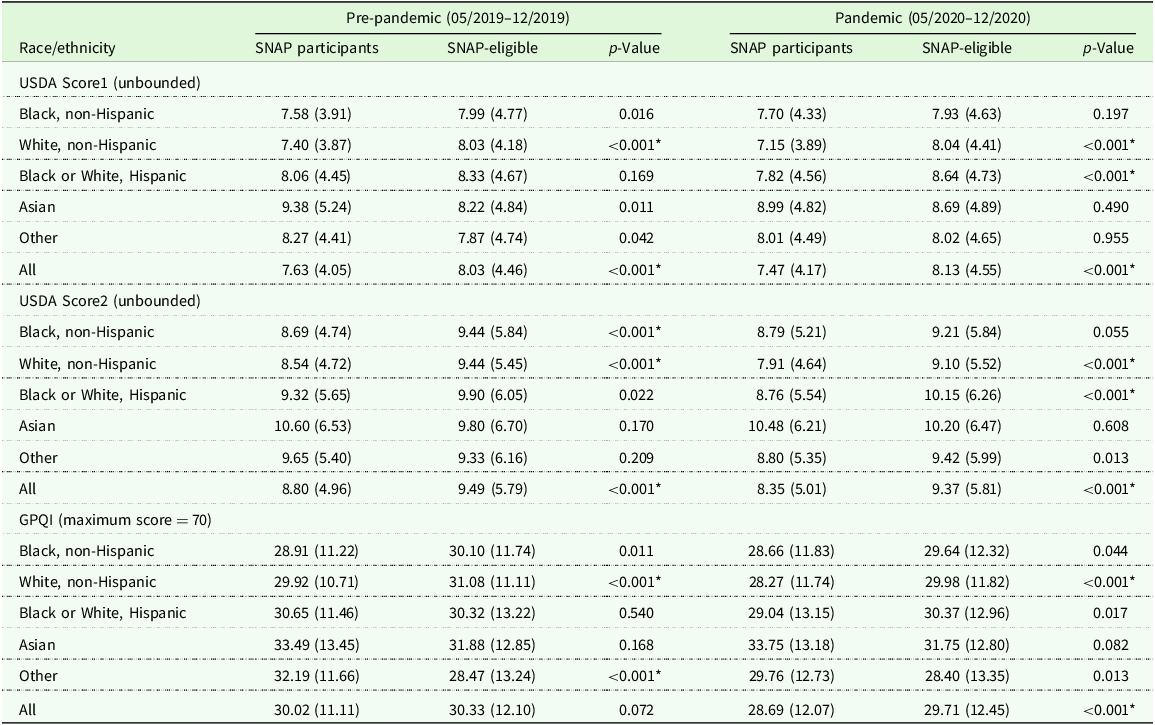
Table 2 compares the means and standard deviations of the USDAScore1, USDAScore2, and GPQI (composite nutritional quality measures) for SNAP and SNAP-eligible households by race and ethnicity (weighted results are shown in Appendix Table A-2 and A-3).Footnote 15 We compared pooled May 2019–December 2019 (pre-pandemic) measures with May 2020–December 2020 (pandemic) measures so that any differences would not be caused by seasonal variation in food purchases. For all households combined, SNAP-eligible households had statistically significantly higher composite nutritional quality measures than SNAP households in the pre-pandemic and pandemic periods, with the exception of the GPQI in the pre-pandemic period, but the magnitudes of the differences were not large. Specifically, for all households combined, the USDAScore1 was 5% lower pre-pandemic for SNAP participants versus SNAP-eligible households (7.63 versus 8.03) and 9% lower during the pandemic (7.47 versus 8.13). Similarly, USDAScore2 was 8% lower for SNAP participants pre-pandemic (8.80 versus 9.49) and 8% lower during the pandemic (8.35 versus 9.37). In contrast, differences in the GPQI were not statistically significant pre-pandemic but 4% lower for SNAP participants during the pandemic (28.69 versus 29.71). The differences by race and ethnicity showed varying patterns. The only race/ethnicity group for which the nutritional quality scores were statistically significantly higher for SNAP participants was Other (not Black, White, Asian, or Hispanic) in the pandemic period. All composite scores were higher for SNAP-eligible White, non-Hispanic households in both periods; USDAScore1 and USDAScore2 were higher for SNAP-eligible Black or White, Hispanic households only in the pandemic period; and USDAScore2 was higher for SNAP-eligible Black, non-Hispanic households in the pre-pandemic period.
Means (standard deviations) of monthly nutritional quality measures for SNAP and income-eligible nonparticipating households with children in the pre-pandemic and initial pandemic periods

Note: USDA = U.S. Department of Agriculture; GPQI = Grocery Purchase Quality Index.
*Indicates statistical significance at p = 0.05 after applying the Holm-Bonferroni correction for multiple comparisons.
Source: Authors’ calculations using Circana Consumer Network data for 2019 and 2020.
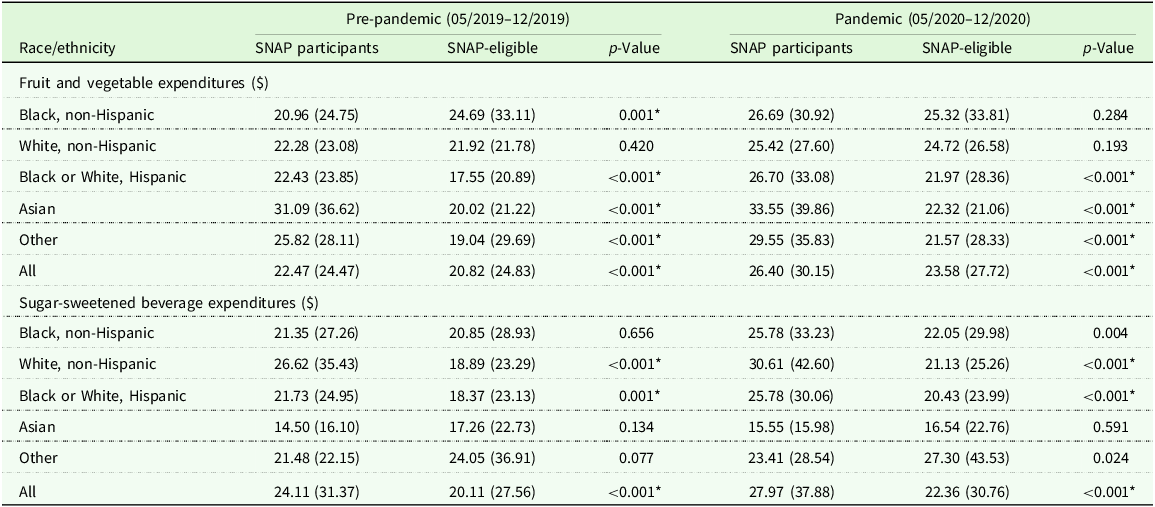
Table 3 compares means and standard deviations for the food expenditure measures. For all households combined, SNAP households spent more than SNAP-eligible households on fruits and vegetables ($1.65 more per month pre-pandemic and $2.82 more during the pandemic for all households) but also more on SSBs ($4.00 more per month pre-pandemic and $5.61 more during the pandemic for all households). For Black or White, Hispanic and Asian households, SNAP participants spent more on fruits and vegetables then SNAP-eligible households in the pre-pandemic and pandemic periods. For Black, non-Hispanic households, SNAP participants spent less on fruits and vegetables but only in the pre-pandemic period. White, non-Hispanic and Black or White, Hispanic SNAP participants spent more than SNAP eligible households on SSBs in the pre-pandemic and pandemic periods, but differences for other groups were not statistically significant. For almost all (except Asian, SNAP-eligible) groups, expenditures for fruits and vegetables and SSBs increased from the pre-pandemic to pandemic periods for SNAP and SNAP-eligible households, which might reflect the fact that households increased FAH purchases overall.
Means (standard deviations) of monthly food expenditure measures for SNAP and income-eligible nonparticipating households with children in the pre-pandemic and initial pandemic periods

Note: USDA = U.S. Department of Agriculture; GPQI = Grocery Purchase Quality Index.
*Indicates statistical significance at p < 0.05 after applying the Holm-Bonferroni correction for multiple comparisons.
Source: Authors’ calculations using Circana Consumer Network data for 2019 and 2020.
Figure 1 shows the monthly values for the composite nutritional quality measures (USDAScore1, USDAScore2, and GPQI) for all households by SNAP participation from January 2019 through December 2020, and Figure 2 shows the expenditure measures (Appendix Figure A-1 and A-2 shows weighted figures). All three composite measures were higher for SNAP-eligible households than SNAP households with a relatively similar absolute difference over the pre-pandemic and pandemic periods. USDAScore2 and GPQI showed greater downward trends in nutritional quality after the pandemic began compared to USDAScore1. Fruit and vegetable expenditures for SNAP households were mostly higher than for SNAP-eligible households, but the differences were relatively small. In contrast, SSB expenditures for SNAP households were much greater than for SNAP-eligible households. For SNAP and SNAP-eligible households, fruit and vegetable and SSB expenditures initially increased at the beginning of the pandemic and then started to decline within a few months. Some of these changes likely occurred because households shifted some or all FAFH to FAH expenditures initially (Okrent and Zeballos Reference Okrent and Zeballos2022), causing the composition of FAH expenditures to change, but then began to shift back to FAFH as pandemic restrictions began to ease (Marchesi and McLaughlin Reference Marchesi and McLaughlin2024).
Trends in monthly mean nutritional quality measures for SNAP and SNAP-eligible households with children, January 2019–December 2020.

Trends in monthly mean food expenditure measures for SNAP and SNAP-eligible households with children, January 2019–December 2020.

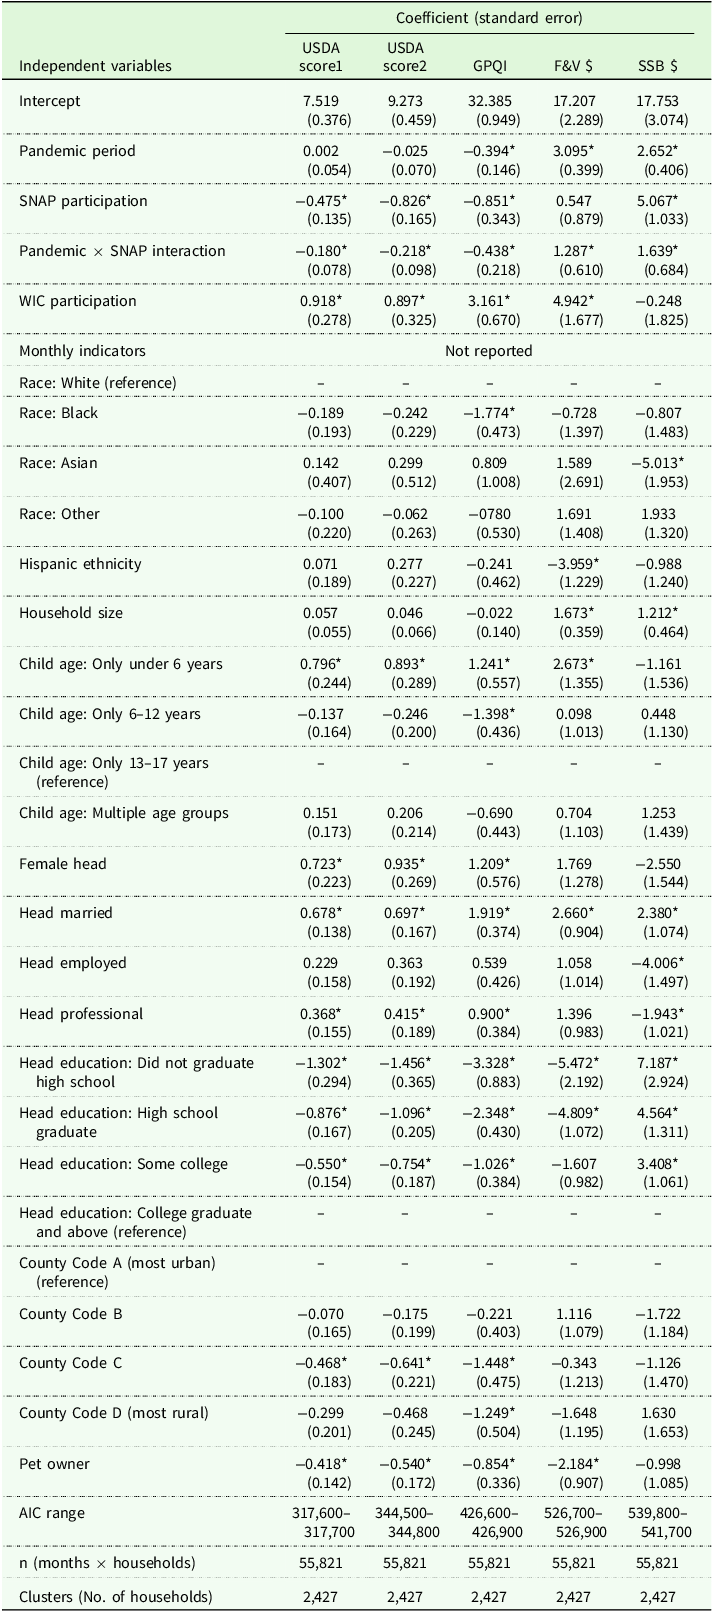
Table 4 shows the results of the regression model for each of the nutritional quality measures. As measured by the coefficient on the interaction term, SNAP participation was associated with statistically significantly lower USDAScores and GPQI during the pandemic, but the differences were only about 2% or less. The interaction term was positive and statistically significant for fruit and vegetable expenditures but also for SSB expenditures, suggesting that households that received increased benefits may have increased purchases of both healthy and less healthy foods. Specifically, SNAP households spent $1.29 (6%) more per month for fruits and vegetables and $1.64 (7%) more per month for SSBs when controlling for other household characteristics. Using average national prices per 100 grams from the Food-at-Home Monthly Area Prices (Sweitzer et al. Reference Sweitzer, Byrne, Page, Carlson, Kantor, Muth, Karns and Zhen2024) adjusted for inflation, the expenditure change for fruits and vegetables (based on fresh apples as a proxy) translates to 3.7 more 100-gram servings of whole fresh fruit (about three 1-cup servings of fresh apples). Likewise, the expenditure change for SSBs translates to roughly 10.5 more 100-gram servings of SSBs (about three 12-ounce sodas) per month.
Results of regression models of the effects of SNAP on nutritional quality measures for households with children, 2019–2020

*p > 0.05.
Note: F&V = fruit and vegetable; SSB = sugar-sweetened beverage; WIC = Special Supplemental Nutrition Program for Women, Infants, and Children; AIC = Akaike Information Criteria.
Source: Authors’ calculations using Circana Consumer Network data for 2019 and 2020.
WIC participation was associated with statistically significantly higher nutritional quality for all measures, which could be because WIC benefits are prescribed for specific types of foods that increase adherence to the DGAs. Race and ethnicity variables were generally not statistically significant, which could be because sample sizes for some subgroups were small. The exceptions were that Black households had slightly lower nutritional quality as measured by the GPQI and Asian households had lower SSB expenditures. Households that had only children under 6 years of age, households with a married head of household, and households with higher levels of education generally had higher nutritional quality measures. Results for rural versus urban households were mixed with no clear pattern for whether rural or urban households had higher levels of nutritional quality. Finally, households with pets had generally lower levels of nutritional quality suggesting that pet ownership may be associated with household characteristics or habits not captured by other variables in the model.
Conclusion
Using household-based scanner data, we examined whether changes in SNAP benefits and program operations during the first year of the pandemic were associated with changes in the nutritional quality of food purchases of SNAP-participating households with children as compared to SNAP-eligible households with children. Results were consistent with previous analyses that showed a small or negative effect of SNAP participation on diet quality in normal times. Specifically, most studies have not found that SNAP improves diet quality for adults (Garasky et al. Reference Garasky, Mbwana, Romualdo, Tenaglio and Roy2016; Grummon and Taillie Reference Grummon and Taillie2017; Katare et al. Reference Katare, Binkley and Chen2021; Lacko et al. Reference Lacko, Popkin and Taillie2019; Mancino et al. Reference Mancino, Guthrie, Ver Ploeg and Lin2018; Singleton et al. Reference Singleton, Young, Kessee, Springfield and Sen2020) or for children (Andreyeva et al. Reference Andreyeva, Tripp and Schwartz2015; Condon et al. Reference Condon, Drilea, Jowers, Lichtenstein, Mabli, Madden and Niland2015; Hudak et al. Reference Hudak, Racine and Schulkind2021). For example, a report by USDA’s FNS found that, compared with income-eligible nonparticipants, SNAP participants had lower HEI scores and consumed fewer fruits and vegetables and more added sugars than participants who were eligible for SNAP based on income but did not participate (Gleason et al. Reference Gleason, Hansen and Wakar2021). However, they also consumed fewer refined grains and less sodium than nonparticipants (Gleason et al. Reference Gleason, Hansen and Wakar2021). Because SNAP households self-select into the program, they may face greater challenges and constraints in purchasing and preparing foods that can affect nutritional quality as compared to nonparticipating households.
Although we did not find that participation in SNAP during the pandemic was associated with improved nutritional quality of food purchases, it likely improved food security. Several prior studies showed SNAP improves food security for families with children (see Carlson and Llobrera [Reference Carlson and Llobrera2022] for a summary review). Studies focusing on the pandemic period showed that food insecurity among SNAP participants decreased as a result of benefit enhancements (Restrepo Reference Restrepo2023; Troy et al. Reference Troy, Ahmad, Zheng and Wadhere2024; Wolfson and Leung Reference Wolfson and Leung2024). Additionally, later studies showed that the discontinuation of benefits had a detrimental effect on food security (Dasgupta and Plum Reference Dasgupta and Plum2023; Richterman et al. Reference Richterman, Roberto and Thirumurthy2023; Sanjeevi and Monsivais Reference Sanjeevi and Monsivais2023; Wolfson and Leung Reference Wolfson and Leung2024).
There are some limitations to the study worth noting. Household-based scanner data are the most extensive representation of food purchases by demographic groups in the United States and allow us to identify SNAP-participating households. However, these data are subject to some limitations as noted in Muth et al. (Reference Muth, Sweitzer, Brown, Capogrossi, Karns, Levin, Okrent, Siegel and Zhen2016). For example, these data represent only foods purchased from grocery stores and similar retail outlets (i.e., not restaurants or cafeterias that could have worse nutritional quality). SNAP households could have shifted from less healthful FAFH purchases that are not captured in our data. Also, some types of households may be less well represented in the data, and households may be less likely to enter data on purchases of foods sold as random weight because of the additional recording burden. In addition, the SNAP variable used in the analysis captures participation in SNAP but not the variation in SNAP benefits over time.
The analysis focused on comparing households with children that were in SNAP in both 2019 and 2020 to those that were income eligible nonparticipants in both years. Therefore, households that were in SNAP in 2019 but not in 2020 were excluded from the analysis, and likewise households that were nonparticipants in 2019 but joined SNAP in 2020 were also excluded. A separate analysis assessed changes in food purchase behaviors of households that joined SNAP in 2020 and found they had larger absolute increases in food purchase expenditures but similar expenditure shares by food category compared to households that were already in SNAP (Muth et al. Reference Muth, Love, Okrent, Bock, Creel, Ellison, Karns and Mancino2025).
In summary, we found that the expenditure-based nutritional quality measures used in our study declined from 2019 (pre-pandemic) to 2020 (pandemic) with larger decreases for SNAP households compared to SNAP-eligible households. Using a regression modeling approach, SNAP participation was associated with small negative or statistically insignificant differences for nutritional quality of food purchases. These results suggest that simply increasing the amount of benefits does not necessarily push participants towards healthier food purchases. However, households may have decreased purchases of less healthful food away from home not captured in the data. In future crises, increased benefits may need to be coupled with other changes in the program to help encourage use of benefits to purchase healthier foods, thus improving not only food security but also nutrition security. Future analyses could assess changes in SNAP benefits over a longer period during the pandemic for participating households for a more extensive examination of the effects of program changes.
Supplementary material
The supplementary material for this article can be found at https://doi.org/10.1017/age.2026.10030.
Data availability statement
The data used in this study are subject to third party restrictions but can be made available with the permission of the U.S. Department of Agriculture and Circana. Access to the data requires entering into a data use agreement and acquiring an account on a restricted data enclave.
Acknowledgements
We appreciate input and advice from Joseph Llobrera, Center on Budget and Policy Priorities, on the study design, SNAP operations and benefits, and potential policy implications. We also appreciate suggestions provided by Jordan Jones, USDA, ERS on an earlier draft.
Funding statement
This research was supported by grant #78876 from Healthy Eating Research, a national program of the Robert Wood Johnson Foundation and by the U.S. Department of Agriculture, Economic Research Service.
Competing interests
None to report.
Disclaimer
The findings and conclusions in this paper are those of the authors and should not be construed to represent any official USDA or U.S. Government determination or policy. In addition, the findings should not be attributed to Circana.


 Open access