


INTRODUCTION
Climatic change may be assessed objectively by measuring the three factors carbon dioxide, temperature and precipitation (Ali et al., Reference Ali, Tedone, De mastro, Ahmed and Stockle2017). These three abiotic factors (CO2, heat and drought) individually and in combination play a major role in plant growth and development with heat being the most crucial one. Climatic change is a phenomenon that affects global agriculture especially the yield and quality of annual crops that are key to global food security (Bita and Gerats, Reference Bita and Gerats2013; Christensen and Christensen, Reference Christensen and Christensen2007). Of the three major agricultural crops maize, wheat and rice, 57% of the land area under wheat has been reported to be vulnerable and affected by heat stress (Kosina et al., Reference Kosina, Reynolds, Dixon and Joshi2007). From a mean minimum threshold temperature of 15 °C for wheat during its crop season, every degree rise was calculated to affect grain yield by up to 5% (Gibson and Paulsen, Reference Gibson and Paulsen1999). Recent reports indicate that every degree rise in temperature daily minimum has a higher effect (4%) on yield than the daily maximum (2%) (Gupta et al., Reference Gupta, Somanathan and Dey2017).
Heat stress affects molecular, biochemical and physiological factors (Bita and Gerats, Reference Bita and Gerats2013) with different organs and/or ontogeny exhibiting variable sensitivity during crop growth (Prasad et al., Reference Prasad, Bheemanahalli and Jagadish2017). In wheat, the reproductive and grain-filling phases are known to be most vulnerable to heat stress (Farooq et al., Reference Farooq, Bramley, Palta and Siddique2011) and may reduce grain yield (Qin et al., Reference Qin, Wu, Peng, Yao, Ni, Li, Zhou and Sun2008) and impact on grain quality (Blumenthal et al., 1993, Reference Blumenthal, Barlow and Wrigley1993; Stone and Nicolas, Reference Stone and Nicolas1996). Heat stress during the reproductive phase has been shown to alter pollen and stigma morphology (Prasad et al., Reference Prasad, Bheemanahalli and Jagadish2017) and may lead to poor fertilization and seed set and thereby yield loss mainly through reduced grain numbers rather than grain weight. Heat stress during the grain-filling phase has adverse effects on kernel weight (Stone and Nicolas, Reference Stone and Nicolas1995) and not on grain numbers since fertilization had occurred and seeds are set. Seed size and weight are the key desired agronomic traits (Ge et al., Reference Ge, Yu, Wang, Luth, Bai, Wang and Chen2016; Kim et al., Reference Kim, Ahn and Jeong2013) that have been subjected to artificial selection for generations and played a key role in the origin of agriculture (Fuller et al., Reference Fuller, Allaby and Stevens2010; Harlan, Reference Harlan1992) and the domestication syndrome (Hammer, Reference Hammer1984).
Heat stress in wheat could be overcome either by choosing early maturing germplasm (Mondal et al., Reference Mondal, Singh, Mason, Huerta-Espino, Autrique and Joshi2016) and breeding to develop cultivars or selecting genotypes capable of sustaining grain filling and thereby yield during heat stress (Farooq et al., Reference Farooq, Bramley, Palta and Siddique2011). However, with variable and erratic climatic change patterns (Henry et al., Reference Henry, Rangan and Furtado2016), choosing genotypes that could sustain grain filling during heat stress will be more effective than choosing germplasm with early maturing types. Seed size and weight are the key agronomic traits reflecting yield, and genotypes that sustain grain filling during heat stress may be the best option for heat stress tolerance. Three genotypes differing for heat stress tolerance were subjected to heat stress at early- and late- grain filing stages in a mutually exclusive fashion. This study reports partitioning of the effect of genetic/genotypic (G), environmental/heat stress (E) and interactive (G×E) factors on the four grain physical characteristics thousand grain weight (TGW), grain length (GL), grain width (GW) and grain thickness (GT) under heat stress.
MATERIALS AND METHODS
Plant germplasm utilized
Three genotypes differing in heat stress tolerance were used in this study were Banks (AUS20599), EGA Gregory (AUS34283) and Fang-60 (AUS24511) with the latter known to be heat tolerant (Blumenthal et al., Reference Blumenthal, Bekes, Gras, Barlow and Wrigley1995; Skylas et al., Reference Skylas, Cordwell, Hains, Larsen, Basseal, Walsh, Blumenthal, Rathmell, Copeland and Wrigley2002). Seed material for the present study was procured from the Australian genebank.
Growth conditions (control)
Seeds were sown in four litre ANOVA™ pots filled with UQ23 potting mix (The media consists of: 70% Composted Pine Bark 0–5 mm, 30% Coco Peat. Fertilizers and other augments/M3: 1 Kg Yates Flowtrace, 1 Kg iron sulphate heptahydrate, 0.4 Kg Superphosphate, 0.03 Kg copper sulphate, 1 Kg Gypsum The pH was balanced to 5.5–6.5 with either FeSO₄ or Dolomite). Following sowing the pots were kept under glass house conditions with 20 °C and 18 °C as day and night temperature, respectively switching automatically on a 12-h cycle with relative humidity maintained at 40–50% throughout the growing period. Pots were placed on a capillary mat fitted with adjustable drippers and watered twice a day using a sterling 12 port controller (Superior Controls Inc., USA). When the seeds germinated (15 days after sowing), Osmocote slow release (3–4 m) granular fertilizer was applied at a rate of 30 g per pot to satisfy the nutritional requirement for the growth of the plantlets. The experiment was conducted in triplicate using a randomized block design for statistical analyses.
Heat stress treatment
To study the impact of heat stress during grain filling, potted plants were subjected to heat stress for 3 days at two stages, early- (11–14 dpa) and late- (27–30 dpa) grain filling with day/night temperature set at 38 °C and 20 °C in a 12-h cycle with no change in relative humidity (Blumenthal et al., Reference Blumenthal, Bekes, Gras, Barlow and Wrigley1995; Furtado et al., Reference Furtado, Bundock, Banks, Fox, Yin and Henry2015). For heat stress treatment (at both early- and late-grain filling stages, in a mutually exclusive fashion), pots in triplicates were shifted from the control glass house chamber to the adjacent chamber wherein temperature (38 °C/20 °C at day/night-12h cycle) and RH (40–50%) was pre-set. Plants were subjected to heat stress at the above-mentioned conditions for 3 days with manual watering three times a day to avoid drought condition, after which, they were moved back to the control glass house chamber and allowed to recover and grow till maturity.
Physical characteristics of wheat grains
Mature spikes for all the three genotypes individually for different treatment, time points and replicates were harvested at maturity and threshed using a LD350 A-4910 Reid laboratory thresher (Wintersteiger, Austria). Threshed wheat grains were used to measure physical characteristics of the grain like TGW using a Pioneer™ analytical balance (Ohaus Corporation, USA), GL, GW and GT using a 150 mm digital Vernier calliper (Kincrome Australia Pty Ltd., Australia).
The impact of heat stress during early- (11–14 dpa) and late- (27–30 dpa) grain filling independently across the three genotypes was assessed by measuring at maturity the grain parameters that reflected yield (TGW, GL, GW and GT). In total, spikes from 27 samples (since in harvested seeds the control is common for both time treatments) were harvested and threshed. In each sample, 100 seeds were counted at random in five sets and were individually weighed (expressed in grams). The mean value of five sets was extrapolated (mean value × 10) to obtain TGW values. From each of the five set, one kernel was randomly chosen; GL, GW and GT were measured in mm using a digital Vernier calliper and the mean of the five samples was used to assess the performance of the three genotypes under control and heat stress conditions.
Statistical analyses
Data recorded for these physical characteristics was subjected to statistical factorial analyses (Rangaswamy, Reference Rangaswamy2010) with two factors, genotypes (Banks, EGA Gregory and Fang-60) and heat stress (control, 11–14 dpa, 27–30 dpa) with three levels in each factor. Partitioning of the treatment effect between genotype (G), heat stress (E) and their interactive effect (G×E) for each of the physical characteristics was made through analysis of variance and tests for significance were performed using F-statistics. Treatment sum squares’ value and their partitioned G, E and G×E values was used to assess the effect of heat stress (percent contribution basis for G, E and G×E) on TGW, GL, GW and GT during early- and late-grain filling. Critical difference (CD) values are calculated and used to identify the statistically significant ones.
RESULTS
Factorial analyses with two factors (genotypes and heat stress) at three levels each for the four grain physical characteristics TGW, GL, GW and GT contributing to seed size and weight agronomic traits reflecting yield were performed. Mean values for the four grain physical characteristics (TGW, GL, GW and GT) along with standard error, and CD (α) at 0.05 and 0.01 are summarized in Table 1. Analysis of variance and its partitioning of the treatment effect into genotypic (G), heat stress (E) and interactive (G×E) for TGW, GL, GW and GT using F-statistics (Tables 2–5) indicated the significance of the heat tolerance genotype Fang-60during early- and late-grain filling. In general, heat stress subjected during grain filling (early as well as late) significantly affects Banks and EGA Gregory genotypes’ TGW, GW and GT excepting GL (Table 1). Whereas the heat tolerant genotype Fang-60 could sustain the heat stress without any significant effect for all the four grain characteristics (Table 1). Interestingly, early-grain filling heat stress yielded significantly higher TGW in tolerant genotype Fang-60 (Table 1). This might be due to accelerated release of the osmocote® fertilizer since the temperature during heat stress was more than 21 °C (38 °C) (Husby, Reference Husby2000) and the capacity of Fang-60 to utilize the released fertilizer.
Effect of heat stress during early-(H1) and late-(H2) grain filling on thousand grain weight (TGW), grain length (GL), grain width (GW) and grain thickness (GT).
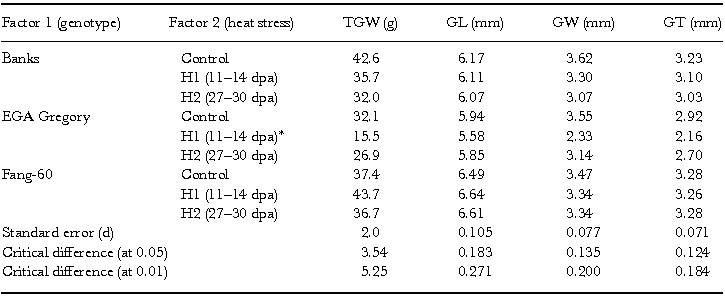
*One replicate was lost during threshing, so only duplicate values were obtained.
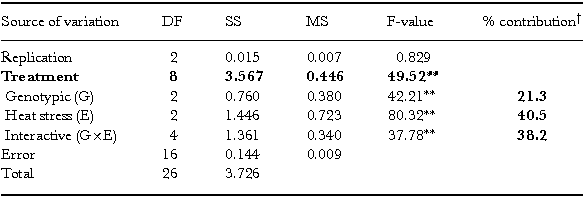
Analysis of variance and partitioning for two factors (genotype and heat stress) at three levels each for thousand grain weight (TGW).

**P < 0.01; †calculated for G, E and G×E in SS treatment’ fractions; DF: degrees of freedom; MS: mean sum squares; SS: sum squares.
Analysis of variance and partitioning for two factors (genotype and heat stress) at three levels each for grain length (GL).

**P < 0.01; *P < 0.05; †calculated for G, E and G×E in SS treatment’ fractions; DF: degrees of freedom; MS: mean sum squares; SS: sum squares.
Analysis of variance and partitioning for two factors (genotype and heat stress) at three levels each for grain width (GW).
**P < 0.01; †calculated for G, E and G×E in SS treatment’ fractions; DF: degrees of freedom; MS: mean sum squares; SS: sum squares.
Analysis of variance and partitioning for two factors (genotype and heat stress) at three levels each for grain thickness (GT).

**P < 0.01; †calculated for G, E and G×E in SS treatment’ fractions; DF: degrees of freedom; MS: mean sum squares; SS: sum squares.
Thousand grain weight (TGW)
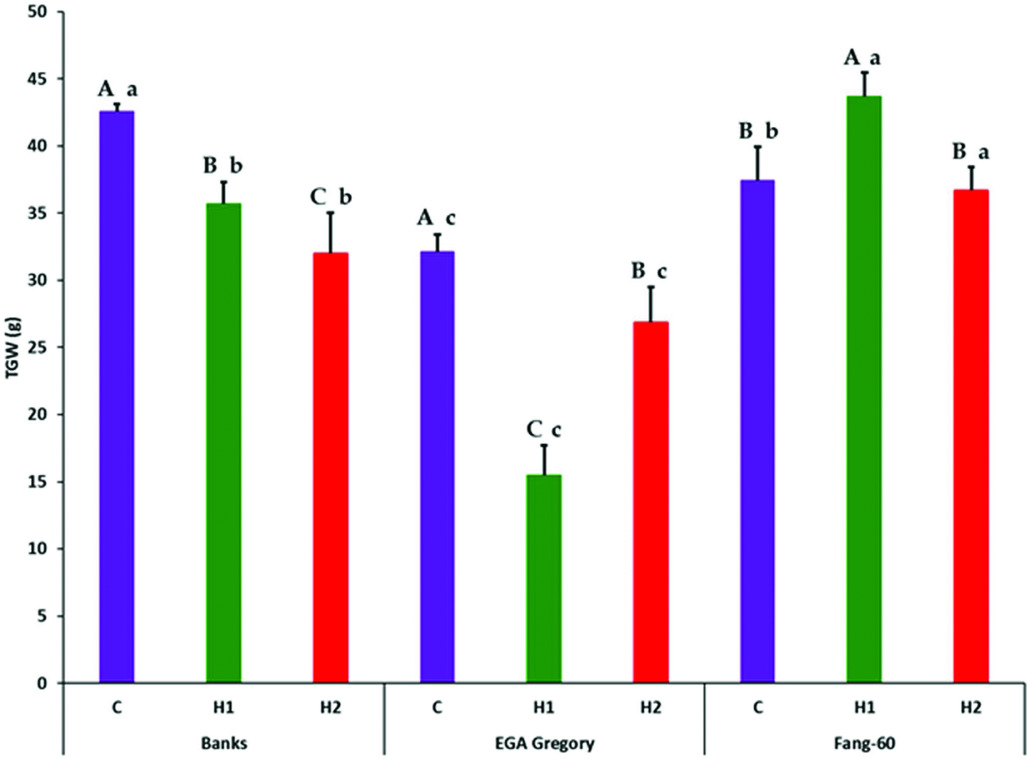
Partitioning of treatment into G, E (both early- and late-grain filling heat stress) and G×E interactive effect along with its components subjected to F-statistics through analysis of variance revealed that the variation due to genotypic (G), heat stress (E) and their interactive effect (G×E) are statistically significant (Table 2). The variation due to replication and error were not significant indicating the soundness of the experimental results. Genotype and its interactive effect during heat stress on TGW contributes to around 90% (Table 2) indicating the role valuable heat tolerant germplasm like Fang-60 (Table 1, Figure 1) could play in sustaining yield under heat stress during grain filling.
Effect of heat stress during early- and late-grain filling on thousand grain weight (g) across the three genotypes with Fang-60 being stress tolerant. Error bars represent standard deviation. Capital letters above error bar compare treatment effect within a genotype (set of three bars C, H1 and H2 of a genotype are compared). Small letters above error bar compare between the genotypes of same treatment (same coloured bar across three genotypes are compared). X-axis – C: control; H1: 11–14 dpa heat stress; H2: 27–30 dpa heat stress.
Grain length (GL)
Statistical analysis of variance for GL indicated that effects of heat stress during grain filling were significant overall as a treatment, replicate and error variance were not significant (Table 3). However, partitioning the treatment into G, E and G×E effect revealed that the treatment significance was only due to G and G×E; and E did not impact GL significantly by itself and only showed significance through the interactive effect with genotypes (Table 3). Genotypic differences (G) alone contribute to nearly 92% (Tables 1 and 3) of the variation in GL and this might also reflect on the developmental stage of the plant (grain filling – when GL is almost determined) subjected to heat stress. Heat stress did not have a significant direct effect on GL although it shows a significant effect through G×E indicating the role of germplasm.
Grain width (GW)
Treatment effects including all partitioned components (G, E and G×E) were statistically significant for GW through F-statistics with variation due to replicates and error (excluding treatments and replicates from total variation) being not significant (Table 4). The GW parameter was the most affected due to grain-filling heat stress (E) and contributed to 40% (Table 4) of the variation irrespective of early- (11–14 dpa) or late- (27–30 dpa) grain filling (Table 1). The G×E effect on GW was higher in contribution (38%) than the genotype effect (G, 21%; Table 4).
Grain thickness (GT)
Like GW, GT also exhibited a significant treatment effect along with all the partitioned components (G, E and G×E) as studied through analysis of variance (Table 5). However, the genotypic contribution was around 70% (Table 5) compared to GW that was only 21% (Table 4). Heat stress including both early- and late-grain filling stress contributes to around 14% while its interactive effect with genotypes (G×E) contributes to 17% of variation (Table 5).
DISCUSSION
In wheat, grain filling is the most sensitive stage for heat stress (Farooq et al., Reference Farooq, Bramley, Palta and Siddique2011) and warrants a search for germplasm exhibiting tolerance to heat stress during grain filling to avoid significant yield loss and thereby sustain yield and quality. The present study was conducted to study the effect of heat stress during grain filling (early- and late-) on the physical characteristics (TGW, GL, GW and GT) of the grain at maturity using three genotypes Banks, EGA Gregory and Fang-60 with the latter one known to be heat tolerant (Blumenthal et al., Reference Blumenthal, Bekes, Gras, Barlow and Wrigley1995; Skylas et al., Reference Skylas, Cordwell, Hains, Larsen, Basseal, Walsh, Blumenthal, Rathmell, Copeland and Wrigley2002). These four grain characteristics were studied because seed size and weight are the key agronomic traits (Ge et al., Reference Ge, Yu, Wang, Luth, Bai, Wang and Chen2016) that are being subjected to selection pressure for domestication since the origin of agriculture and even now as classical plant breeding tools in crop improvement. The role of bs1 (big seeds1), a transcriptional factor regulating seed size and weight in model legumes Medicago and soybean was recently reported (Ge et al., Reference Ge, Yu, Wang, Luth, Bai, Wang and Chen2016). Of TGW, GL, GW and GT, three traits exhibit higher genotypic effects (G) with 61%, 92% and 70%, respectively, for TGW, GL and GT, while it was only 21% for GW with all being statistically significant with respect to G and the interactive effect G×E (Tables 2–5).
Control versus heat stress
Except for GL, the other three grain parameters TGW, GW and GT varied significantly between control and heat stress (Table 1) indicating that GL is determined before the grain filling stage at which heat stress was experienced. In the genotypes Banks and EGA Gregory, TGW was reduced significantly during heat stress (both early- and late-grain filling) with respect to the control (Table 1, Figure 1) indicating that heat stress during grain filling either at the early- or at late-stage might result in a significant yield loss. In contrast, the heat tolerant Fang-60 exhibited a significant increase in TGW during early-grain filling heat stress compared to the control. The nutrient uptake efficiency of Fang-60 at high temperature stress may sustain its physiology and morphology (Sattelmacher et al., Reference Sattelmacher, Horst and Becker1994), retaining higher TGW (also reflecting yield) and suggests the potential to explore its root characteristics as well. Nutrient efficiency in relation to heat stress may be an important issue to understand to guide crop improvement (Baligar et al., Reference Baligar, Fageria and He2001; Hirel et al., Reference Hirel, Le Gouis, Ney and Gallais2007; Lynch, Reference Lynch1998). With wheat grain being photosynthetic, and the recent discovery of C4 photosynthesis exclusively in wheat grains (Rangan et al., Reference Rangan, Furtado and Henry2016), the contribution of ear photosynthesis to TGW or yield cannot be undermined. In addition to efficient nutrient uptake or utilization, Fang-60 must also be capable of fixing CO2 efficiently under heat stress.
Although TGW for Banks and EGA Gregory was significantly lower when compared to control at either early- or late-grain filling heat stress; the Banks genotype was only moderately affected, while EGA Gregory was severely affected (more than 50% reduction in TGW relative to control) during early-grain filling heat stress (Table 1, Figure 1). Whereas during late-grain filling heat stress, the reduction in TGW for Banks was 25%, while for EGA Gregory, it was only 17%, although EGA Gregory TGW in quantum was lower than Banks (Table 1, Figure 1).
Banks and EGA Gregory also exhibit significant reduction in GW and GT relative to control (similar to TGW) during heat stress irrespective of early- or late-grain filling. Whereas in the case of Fang-60 – the heat tolerant genotype, variation in GW and GT due to either early or late-grain filling heat stress was not statistically significant when compared to the control (Table 1). Comparison between early- and late-grain filling heat stress for GW in Banks and EGA Gregory (for Fang-60 it is not significant) indicates both were significantly affected with Banks having significantly lower GW during late- rather than early-grain filling heat stress, while for EGA Gregory it was vice versa (Table 1). In the case of GT, only EGA Gregory exhibit a significantly lower GT during early- rather than late-grain filling heat stress (Table 1), while variation in other two genotypes for GT between early- and late-grain filling heat stress was not significant.
These data suggest Fang-60 is tolerant to heat at either stage of grain filling, while Banks is moderately tolerant to early- grain filling heat stress and sensitive to late-grain filling stress. Whereas EGA Gregory is susceptible to early-grain filling heat stress and during late-grain filling heat stress it can be categorized as moderately tolerant type. When comparing the TGW between genotypes under control condition, Banks exhibit significantly higher TGW than Fang-60 and EGA Gregory. These diverse responses demonstrate the potential to select wheat genotypes that are climate resilient and suitable for environments in which the frequency of heat stress is likely to be increased during the critical grain filling stages of crop growth.
Acknowledgements
Authors acknowledge Sally Norton, Australian Grains Genebank for the supply of the germplasm reported in this study. Authors are thankful to Ken Hayes for facilitating glasshouse services. Help rendered by Ravi C. Nirmal during harvesting, and threshing is duly acknowledged. Author RP is thankful to DBT, Govt. of India for Indo-Australian Career Boosting Gold Fellowship; QAAFI, UQ for the honorary position; and ICAR-NBPGR for institutional support.


 Open access